
Global impacts of climate change - projections
These maps show the areas of greatest concern for experiencing severe climate-related impacts at 4°C global warming relative to pre-industrial levels (1850-1900).
These maps show the areas of greatest concern for experiencing severe climate-related impacts at 4° C global warming relative to pre-industrial levels (1850-1900). They highlight those regions where people may be exposed to severe climate-related impacts, and regions where multiple severe impacts may occur at similar times. Five types of impacts are shown: extreme heat stress, river flooding, fire weather, drought and food insecurity. Unless otherwise stated, population statistics refer to present-day population levels. Numerous other impacts related to human-induced climate change, such as risks to biodiversity and coastal flooding, are also of concern but not shown here.
Trends in climate impacts have also been observed in historical data. For more information please see our page on observed climate impact trends.
Contents
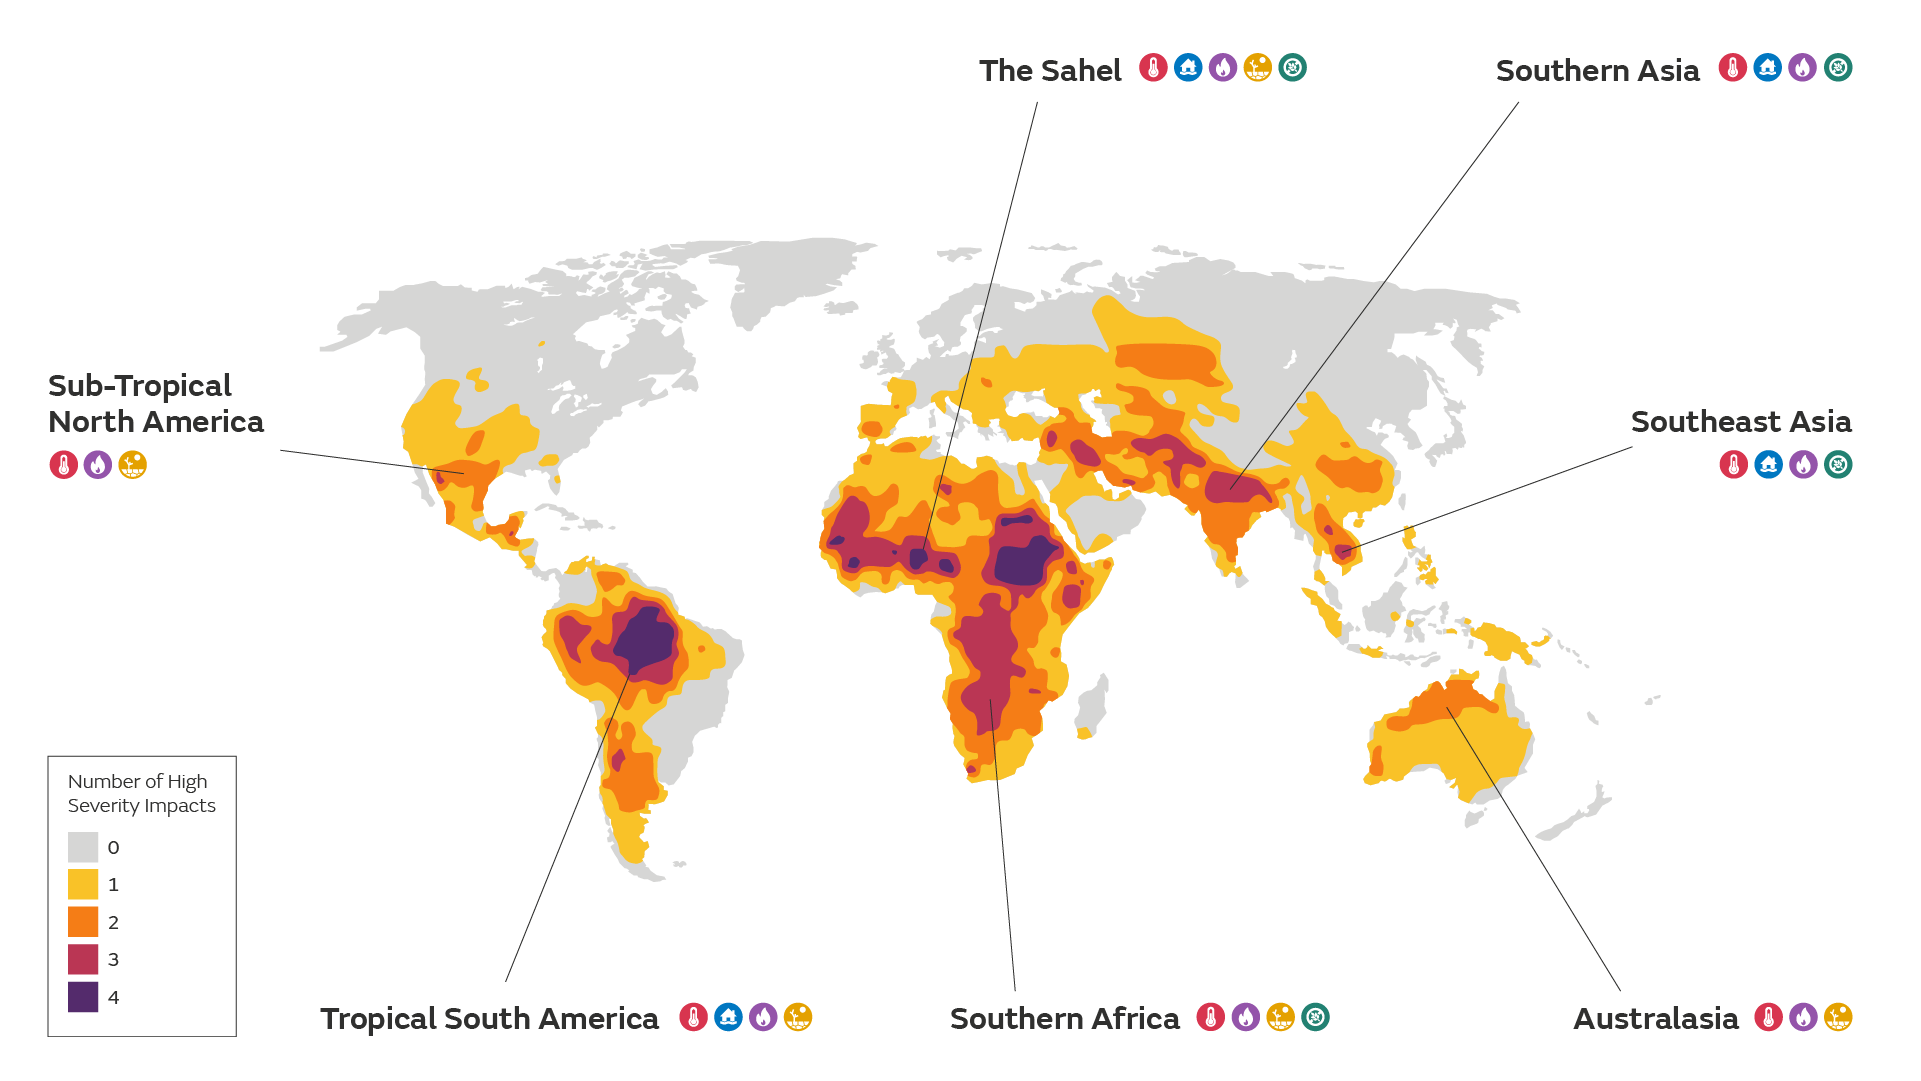
This map shows regions where multiple severe impacts may occur at similar times at 4° C of global warming above pre-industrial levels. These impacts include extreme heat stress risk, river flooding, drought and wildfire risk, overlaid with an indicator of present-day food insecurity. The regions in the callout boxes highlight locations of particular concern where multiple severe impacts coincide under 4° C global warming.
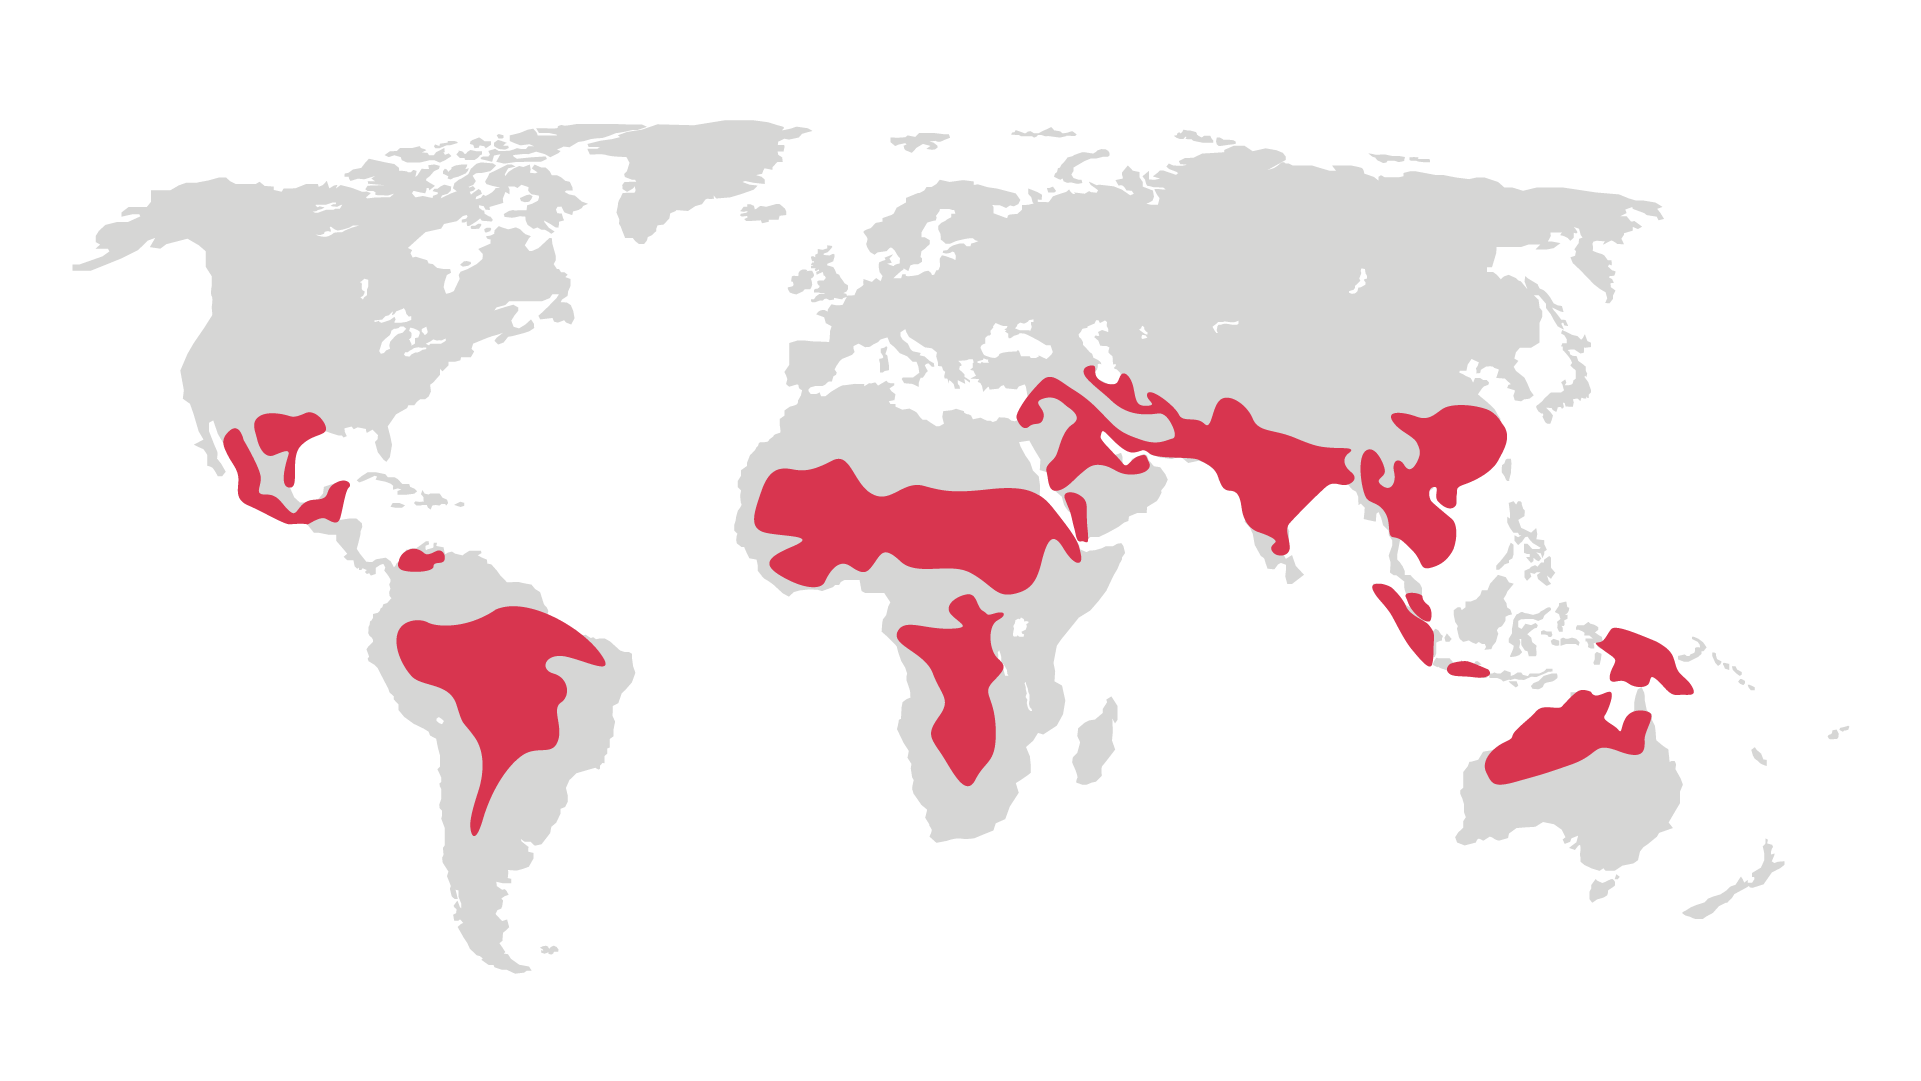
Human heat stress risk depends on both temperature and humidity, and is indicated using wet bulb globe temperature (WBGT). WBGT above 32 °C is defined as “extreme risk”. At this level, vulnerable members of the population, and those with physical, outdoor jobs are at greater risk of adverse health effects. The map shows areas where a WBGT greater than 32 °C occurs for more than 10 days per year at 4° C global warming, in the ensemble mean of models from the 5th Coupled Model Intercomparison Project (CMIP5). The bar chart shows the global total number of people exposed at this level for the present day, 2° C and 4° C global warming, in relation to present-day population.
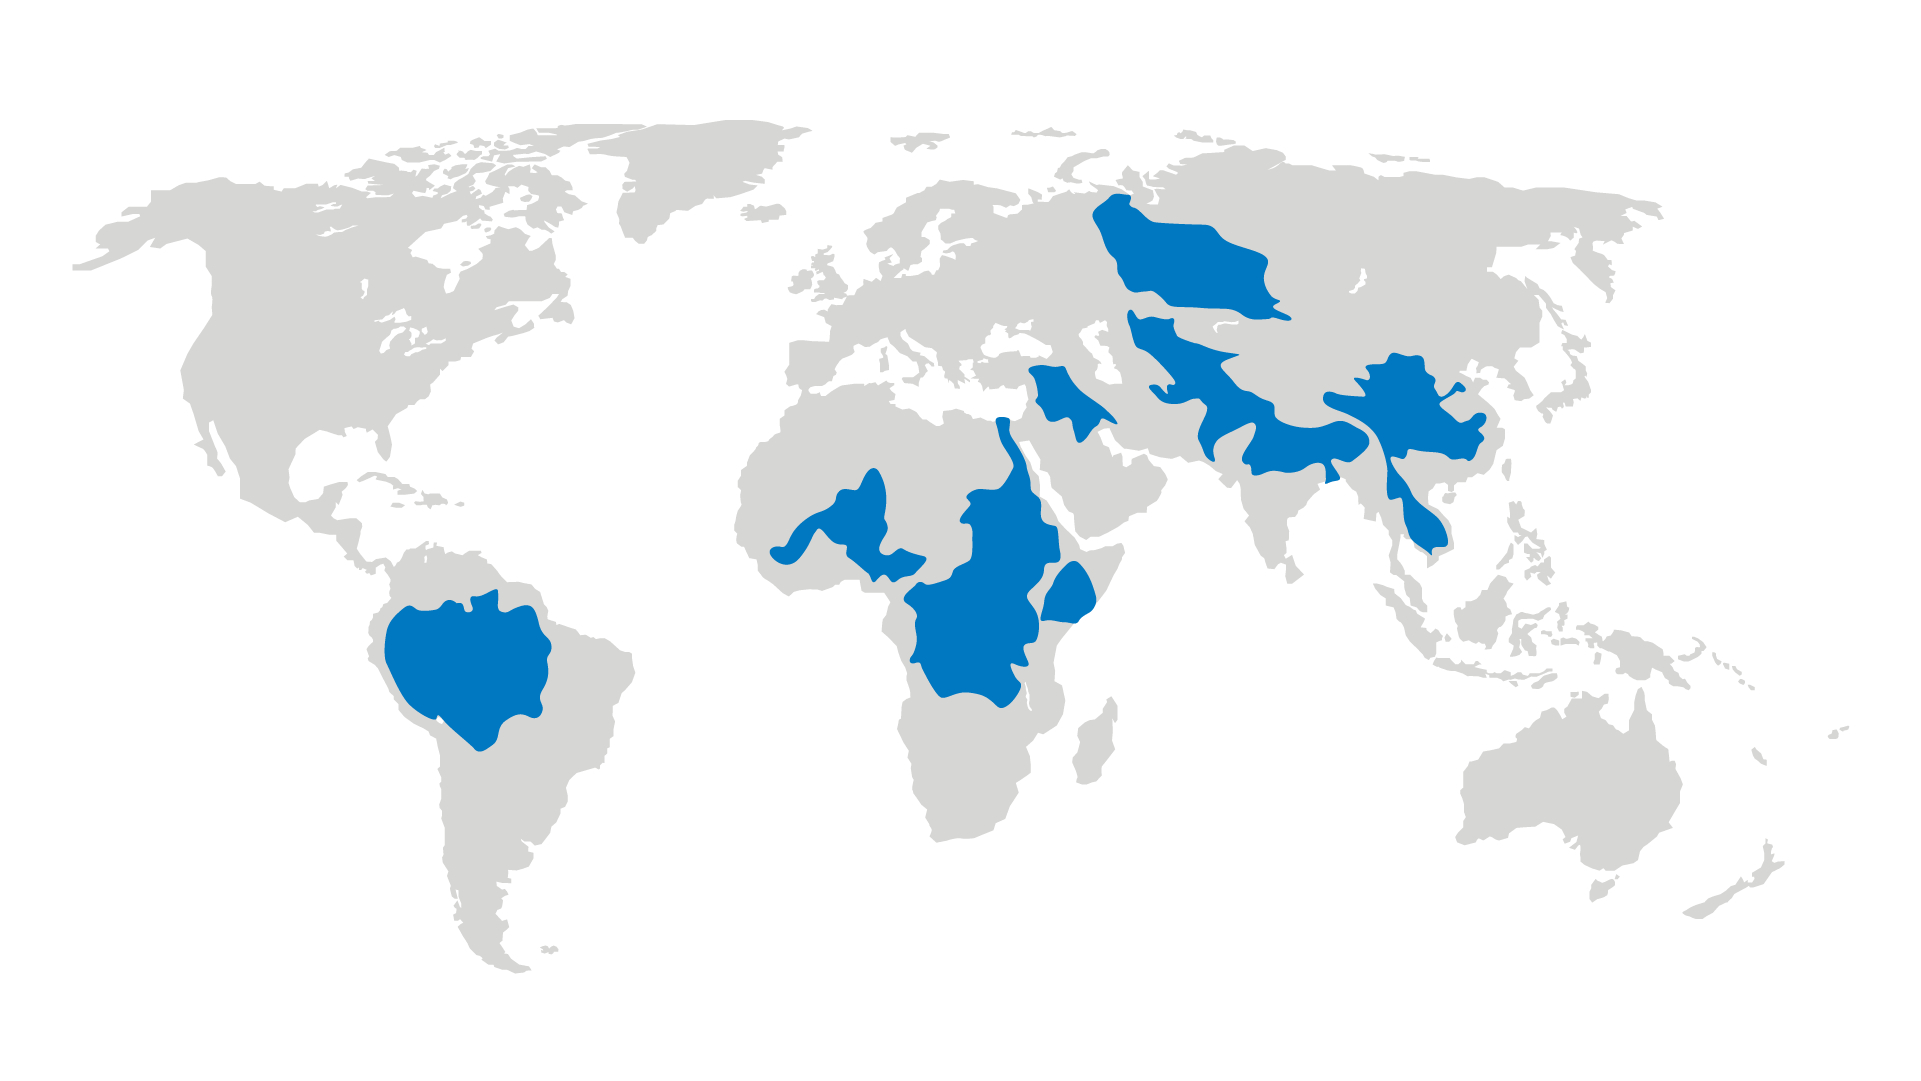
Heavy and/or prolonged rainfall can increase the likelihood of river flooding, alongside other human factors such as land use activities. The map shows selected major river basins with more than 1 million people per year projected to be affected by river flooding at 4° C global warming, using the ensemble mean of the HELIX climate projections and the LISFLOOD flood model, with present-day population and flood management measures. The bar chart shows the projected global number of people affected by river flooding in the present day, 2° C and 4° C global warming.
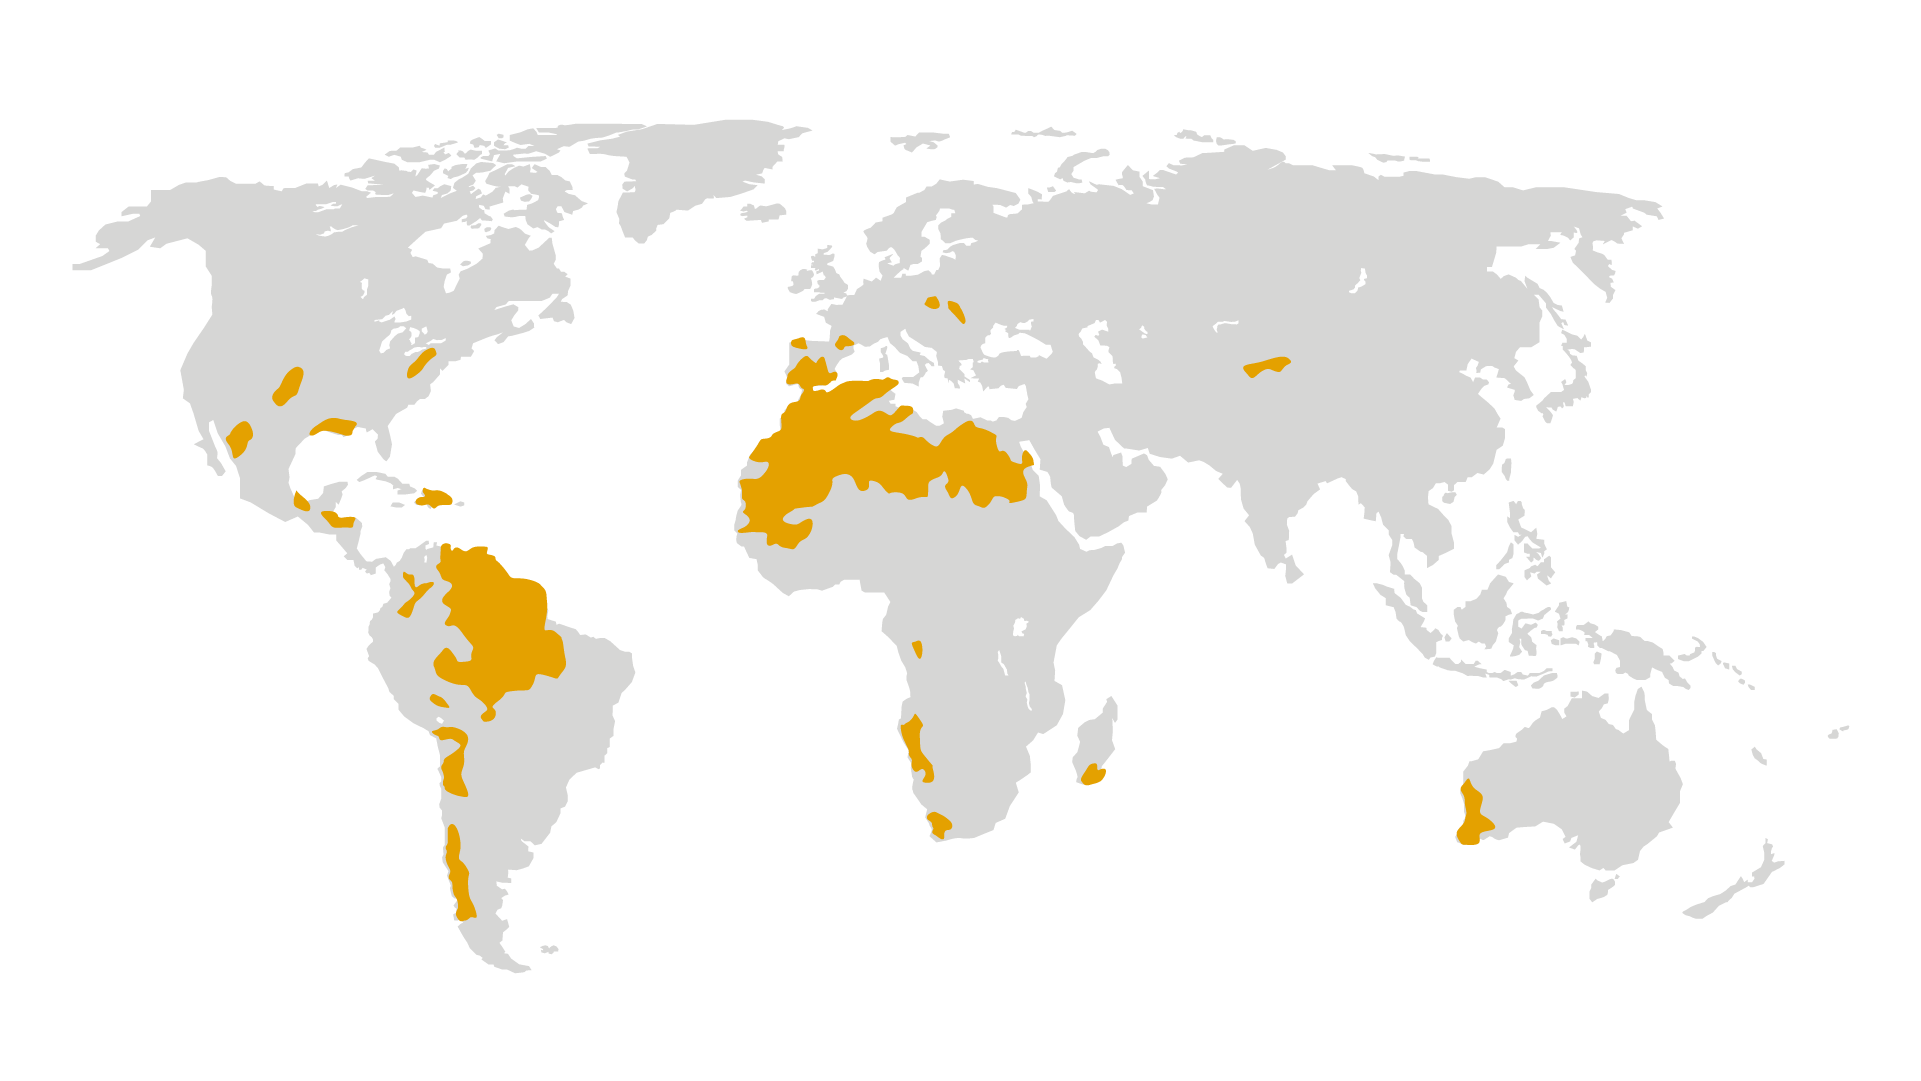
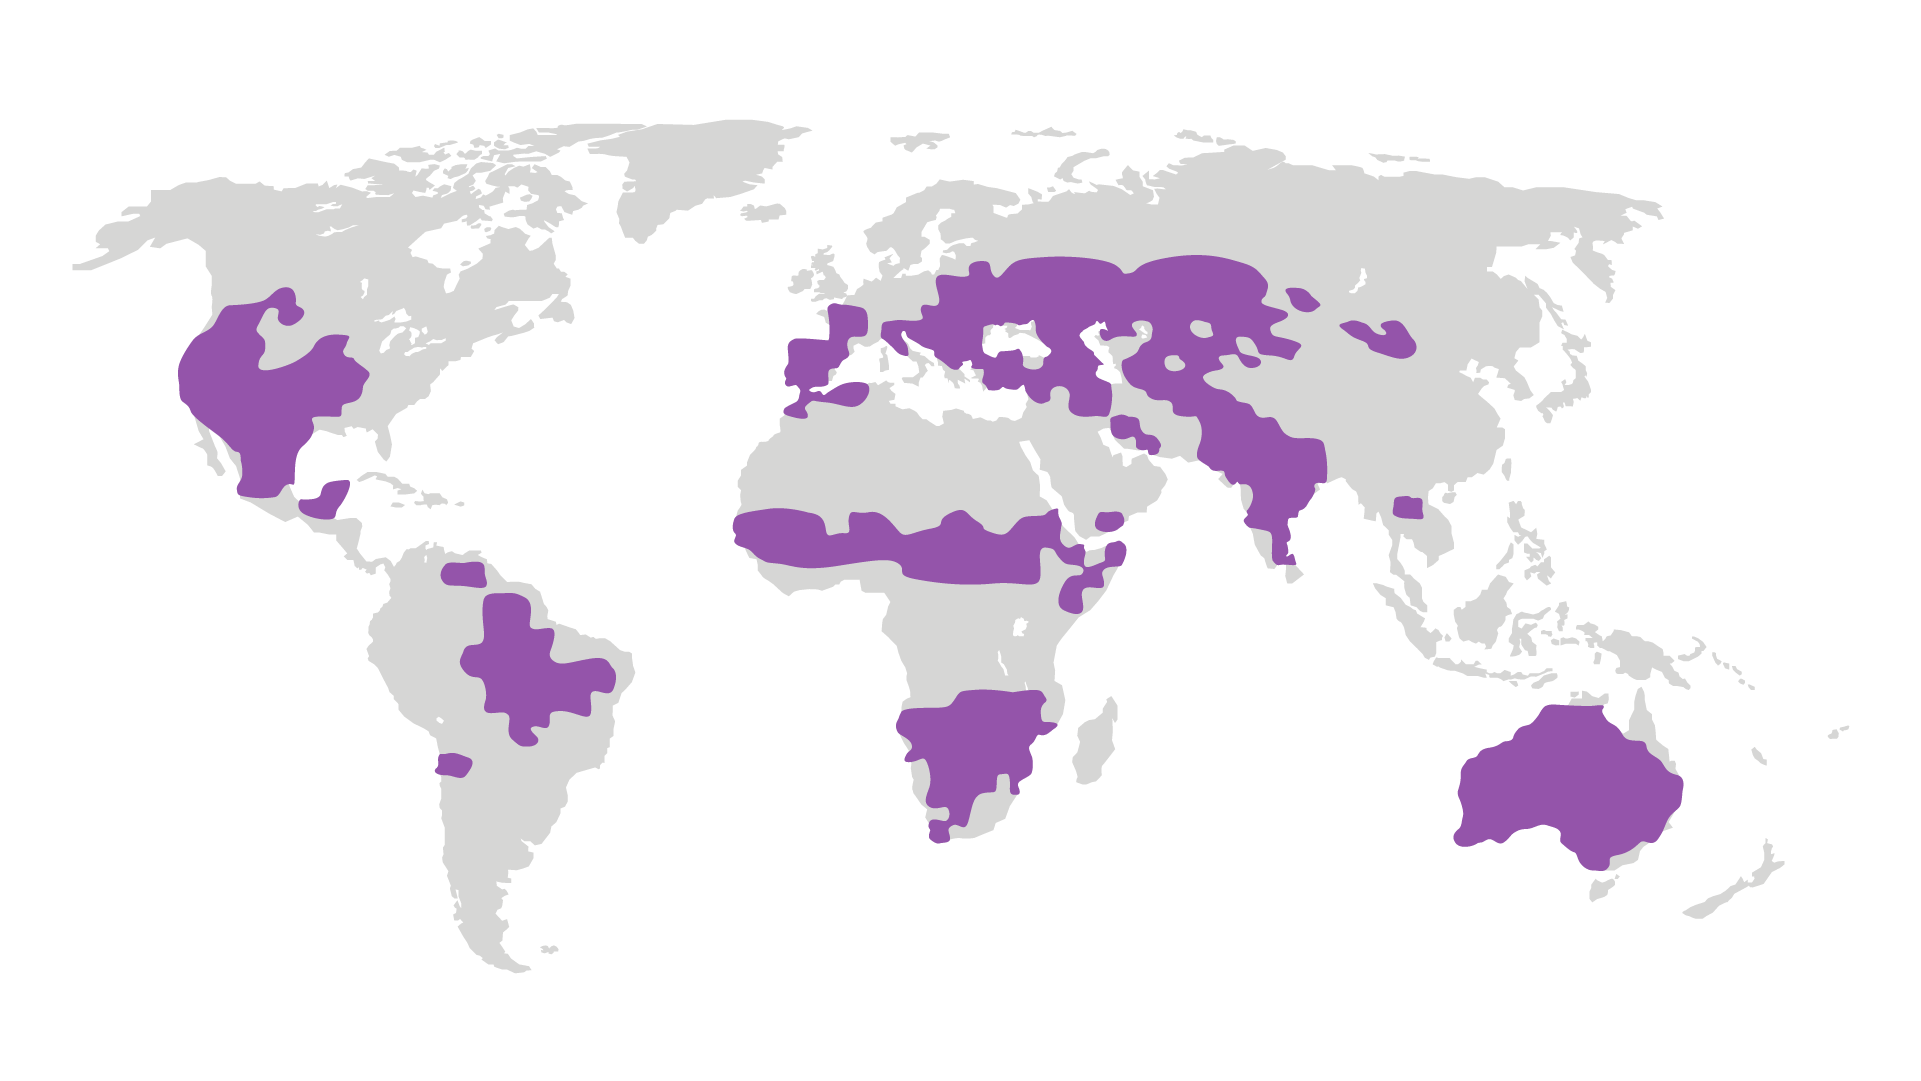
Hydrological drought is the relative reduction in the availability of water in rivers and can be defined using the Standardised Runoff Index (SRI). Here, severe and extreme drought is defined as the driest 24-day period of the year in the present climate. The map shows areas with more than a 25% increase in time under severe and extreme drought at 4° C global warming, in the ensemble mean of the HELIX climate projections. While the global average change in severe and extreme drought is close to zero, there are strong regional variations in the response of rainfall to climate change. For example, the bar chart shows the mean increase in time under this level of drought for the Mediterranean region.
The risk of wildfires increases under hot, dry, windy conditions, which can be quantified with the McArthur Forest Fire Danger Index (FFDI). The map shows where fire danger is projected to be “very high” or above (FFDI > 25) for more than 10 days per year at 4° C global warming, from the median of an ensemble of projections with the HadCM3C climate model. The bar chart shows the global land area at this level of risk for the present day, 2° C and 4° C global warming. Actual fire occurrence also depends on ignition, so this metric indicates fire weather rather than fire activity.
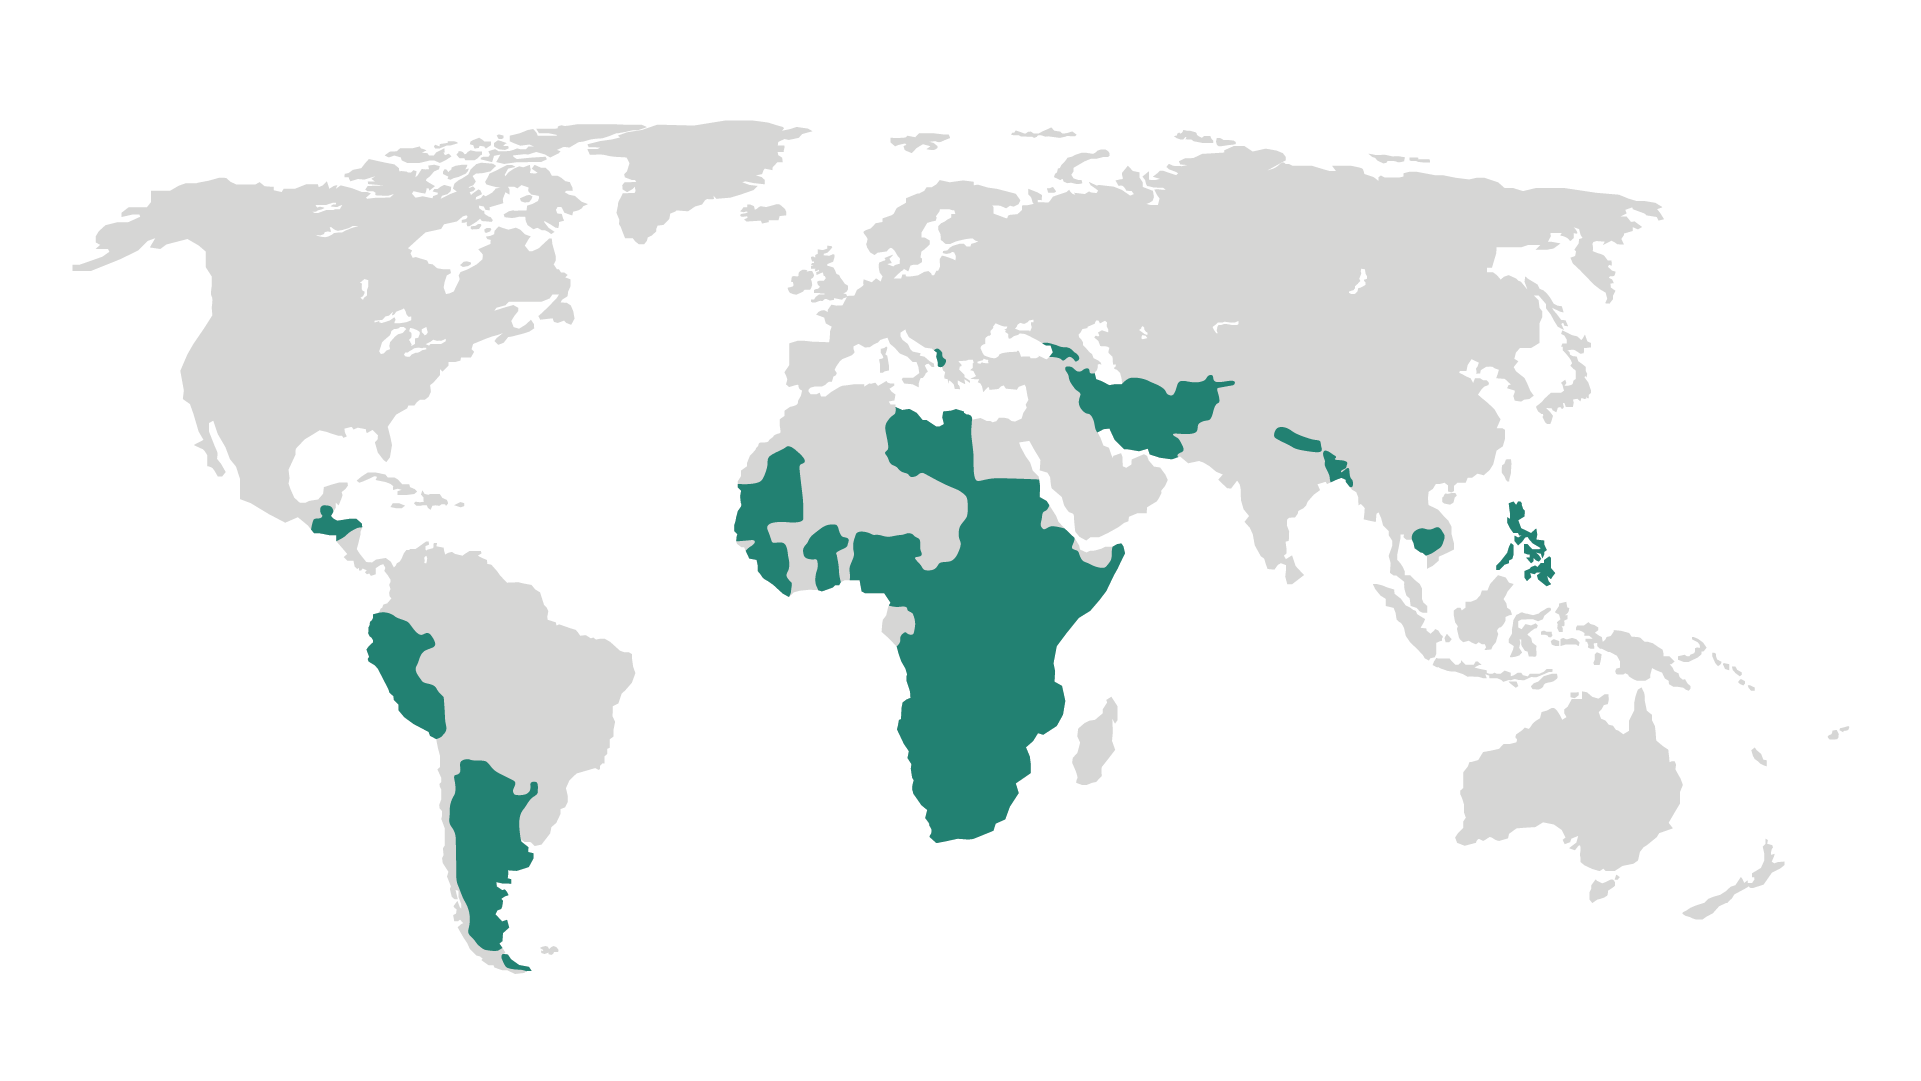
The map shows countries where more than 30% of the present-day population (2020) is exposed to moderate or severe food insecurity, as defined by the Food Insecurity Experience Scale. We use a present-day measure for this impact due to the challenges of estimating non-climate related future levels of exposure and vulnerability to food insecurity. Moderate food insecurity is generally associated with the inability to regularly eat healthy, nutritious diets. Severe food insecurity is strongly related to insufficient quantity of food and therefore undernourishment or hunger. While this indicator is purely related to present-day vulnerability factors, it is important to note that food production is closely influenced by climate hazards such as drought, heat stress, flooding and fire.