
Briefing on Arctic and Antarctic sea ice - July 2018
Current Arctic sea ice extent
Arctic sea ice extent on 9th July 2018 was 9.22 million square km according to data from the US National Snow and Ice Data Center (NSIDC). This is the twelfth lowest value for this date on record, 0.88 million square km below the 1981-2010 average, and 1.04 million square km above the record low for this date, which occurred in 2012 (Figure 1).
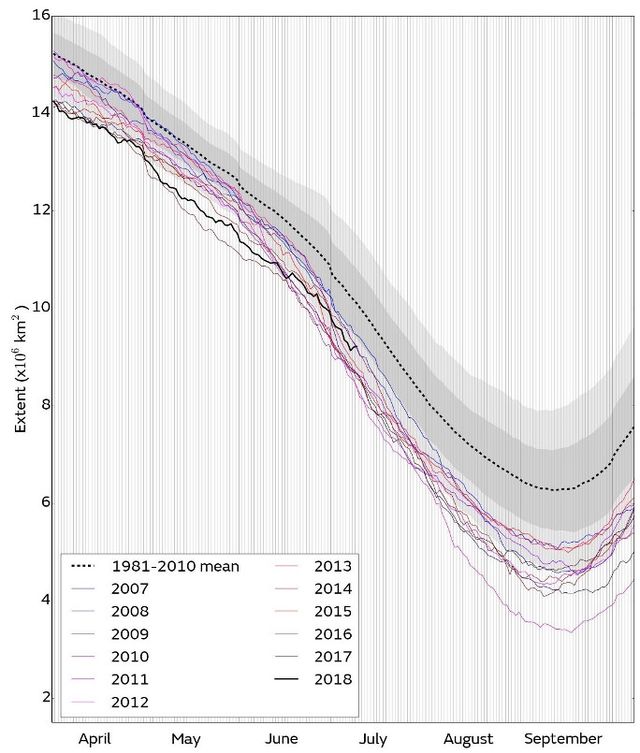
Figure 1. Daily Arctic sea ice extent for 2018, compared with recent years and the 1981-2010 average with ± 1 and 2 standard deviation intervals indicated by the shaded areas. Data are from the National Snow and Ice Data Center (NSIDC).
Extent was exceptionally low in the Atlantic sector of the Arctic, particularly in the Barents and Kara seas, and was somewhat below average in the Chukchi and Laptev seas (Figure 2). The Beaufort Sea, however, has seen very little overall ice loss since early June.
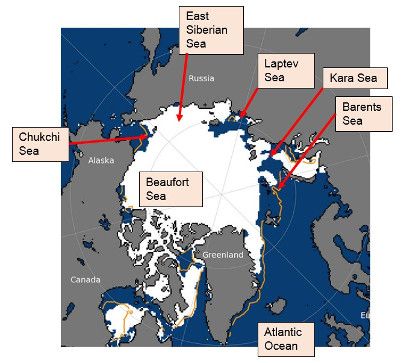
Figure 2. Arctic sea ice extent on 9th July 2018, with 1981-2010 average extent indicated in orange, and the regions referred to in the text labelled. Underlying map and data courtesy of NSIDC.
The patterns of ice loss are likely to be associated with winds tending to blow from the Atlantic to the Pacific side of the Arctic during June, enhancing ice loss on the Atlantic side but attenuating it on the Pacific side. Temperatures across the Arctic during June were above average in the Kara, Laptev and East Siberian seas, but somewhat below average in the Beaufort Sea (Figure 3).
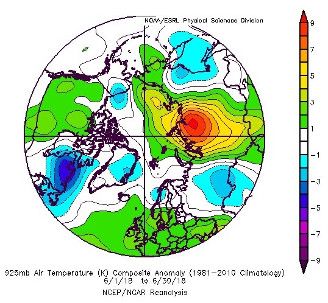
Figure 3. June 2018 air temperature anomaly at 925mb, relative to the 1981-2010 average. Data are from the NCEP reanalysis.
June 2018 in context
Average sea ice extent for the month of June 2018 was 10.84 million square km according to the HadISST1.2 dataset (Rayner et al., 2003). This is the third lowest June extent on record (the lowest was 10.58 in 2016), 1.03 million square km below the 1981-2010 average, and 0.10 million square km below the long-term linear trend (Figure 4).
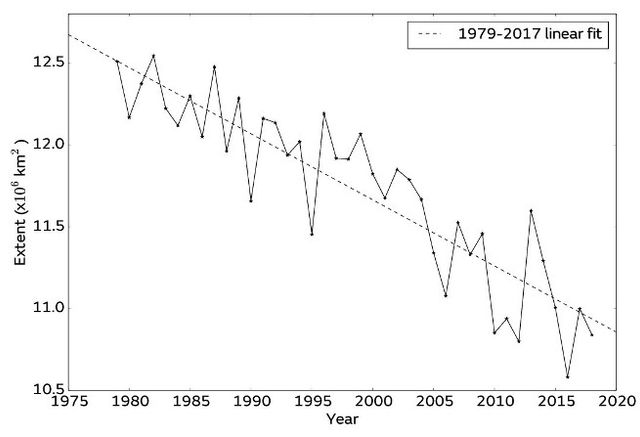
Figure 4. Average June Arctic sea ice extent according to the Hadley Centre Sea Ice and Sea Surface Temperature (HadISST) 1.2 dataset (Rayner et al, 2003).
The average rate of sea ice loss during June was 54,000 square km per day according to data from NSIDC, somewhat below the 1981-2010 average of 59,000 square km per day and the slowest rate of June ice loss since 2004.
Outlook for September
A number of predictions of this year’s seasonal minimum (September) Arctic ice extent are displayed in Figure 5, and described below:
- The Sea Ice Prediction Network (SIPN) July Outlook report includes 33 predictions of mean September ice extent based on a variety of methods and from centres around the world. Except for two outliers, the predictions range from 4.0 to 5.3 million square km, with a median of 4.58 million square km. Only the lowest prediction, 3.4 million square km, would indicate a record low September extent.
- Statistical predictions based on an extrapolation of the linear trend for the entire satellite period from 1979-2017 (black), and most recent 15 years (red) suggest a mean September sea ice extent of 4.42 (±1.08) and 4.18 (± 1.11) million square km respectively.
- There is a reasonable correlation between mean September ice extent and the extent for 25th June – 9th July (the most recent 15 days of data available at the time of writing). Applying simple statistical methods to the anomalies for these dates gives a prediction of September mean extent of 4.93 (± 0.84) million square km, indicated in blue on Figure 5.
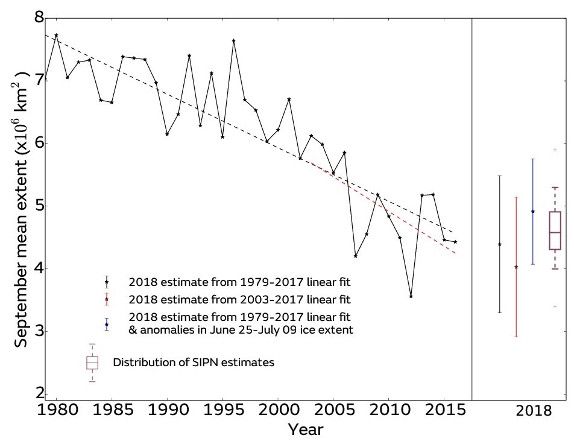
Figure 5: September median Arctic sea ice extent since satellite records began in 1979 from the HadISST1.2 dataset (Rayner et al., 2003), with predictions from the SIPN Sea Ice Outlook and statistical predictions for September 2018. For the statistical predictions, error bars represent twice the standard deviation of September mean ice extent about the trend lines with respect to which the estimates are taken. The Sea Ice Outlook is shown as a boxplot indicating range, median and quartiles of the 33 predictions submitted.
Although these predictions suggest that a new record low September extent is unlikely this year, there remains a high degree of uncertainty at this point of the melt season. Ice thickness measurements by CryoSat-2 in May showed large regions of sea ice to be less than 2m thick; these areas are likely to be vulnerable to enhanced ice loss should weather conditions more conducive to ice melt emerge.
Antarctic sea ice state
Antarctic sea ice extent on 9th July was 15.25 million square km (Figure 6). This is the fifteenth lowest value for this date on record, 0.16 million square km below the 1981-2010 average, and 0.75 million square km above the lowest value for this date, which occurred in 1986. Extent remained particularly low relative to average in the Weddell Sea (Figure 7).
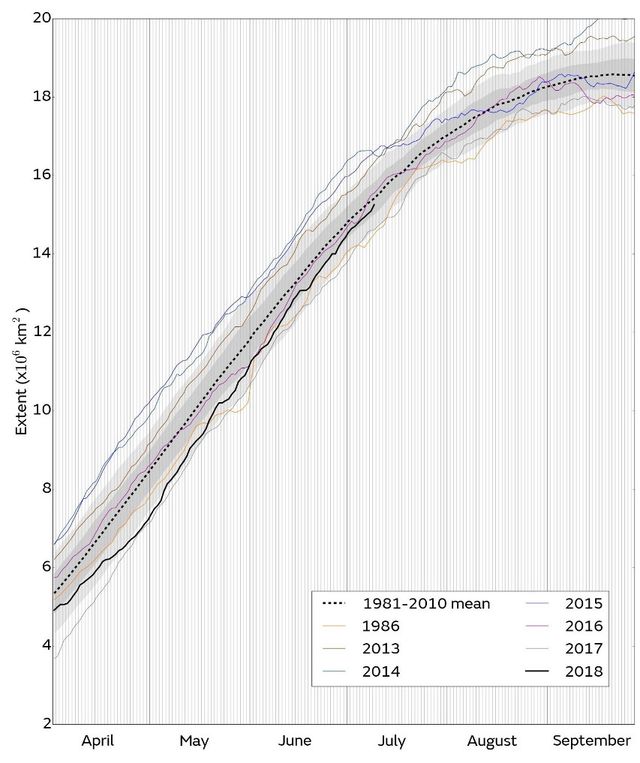
Figure 6. Daily Antarctic sea ice extent for 2018, compared with recent years, the low-ice year of 1986, and the 1981-2010 average, with ± 1 and 2 standard deviation intervals indicated by the shaded areas. Data are from NSIDC.
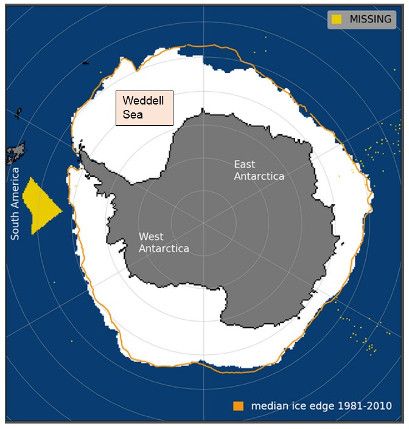
Figure 7. Antarctic sea ice extent on 9th July 2018, with 1981-2010 average extent indicated in orange, and regions referred to in the text labelled. Underlying map and data courtesy of NSIDC.
References
Rayner, N. A.; Parker, D. E.; Horton, E. B.; Folland, C. K.; Alexander, L. V.; Rowell, D. P.; Kent, E. C. and Kaplan, A.: Globalanalyses of sea surface temperature, sea ice, and night marine air temperature since the late nineteenth century. J. Geophys.Res. Vol. 108, No. D14, 4407 10.1029/2002JD002670, 2003.
10th July 2018, Alex West and Ed Blockley