
The heatwave in Western Europe in June 2022
A rapid attribution study of the Western Europe heatwave in June 2022
Technical summary. Details of the attribution system in Christidis (2021).
A real-time attribution study was conducted during the heatwave that affected large parts of Western Europe in June 2022. The analysis was produced with a system developed in Hadley Centre for the attribution of extremes in near-real time (Christidis, 2021). It employs an unconditional attribution framing, which estimates the changing risk of critical temperature threshold crossings under any possible conditions. The system also adopts the well-established and peer-reviewed riskbased methodology that infers probabilities of extreme events with and without the effect of human influence from large multi-model ensembles of climate model simulations. The new analysis employed coupled model data drawn from large multi-model ensembles of the Coupled Model Intercomparison Project phase 6 (CMIP6, Eyring et al., 2016). In total, the study uses data from 14 models that provide the necessary experiments for event attribution, namely historical simulations extended to the end of the 21st century with the medium emissions scenario SSP2-4.5 (ALL; Riahi et al., 2017) and simulations with natural forcings only (NAT) to year 2020. Each model provides several simulations for each experiment and there are in total 82 ALL and 71 NAT model runs for temperature, and similar numbers for rainfall (87 ALL and 72 NAT) as listed in Table 1.
Table 1. The CMIP6 models used in the attribution analysis. The table gives the number of simulations per experiment and the total mutli-model ensemble size (last row).
| Model |
ALL hist+ssp245 |
NAT |
|---|---|---|
| ACCESS-CM2 | 3 | 3 |
| ACCESS-ESM1-5 | 18 | 3 |
| BCC-CSM2-MR | 1 | 3 |
| CESM2 | 3 | 3 |
| CNRM-CM6-1 | 6 | 10 |
| CanESM5 | 25 | 15 |
| FGOALS-g3 | 4 | 3 |
| GFDL-ESM4 | 3 | 3 |
| GISS-E2-1-G | 3 | 5 |
| HadGEM3-GC31-LL | 5 | 5 |
| IPSL-CM6A-LR | 9 | 10 |
| MIROC6 | 3 | 3 |
| MRI-ESM2-0 | 1 | 3 |
| NorESM2-LM | 3 | 3 |
| Total | 87 | 72 |
The study aims to a) estimate the likelihood of the June temperature reaching a new record in year 2022 over a region that has so far been largely affected by high temperature anomalies (5W-13E; 38- 52N) and b) assess the role of anthropogenic forcings in the changing likelihood of extreme heatwaves. Extreme events are defined as exceedances of the previous record anomaly of 4.126 0C (relative to 1901-1930) observed in year 2003. Temperature observations come from the CRUTEM5 2 dataset (Osborn et al., 2020) and cover the period 1851-2021. The model simulations start at year 1850. The likelihood of extreme heatwaves is calculated under four different climatic conditions:
- the natural climate, represented by all June temperature anomalies extracted from the NAT experiment.
- The climate of 2003, when the record June temperature was observed, represented by temperature anomalies in years 1993-2012 extracted from the ALL experiment.
- the present climate, represented by the temperature anomalies in years 2013-2032 extracted from the ALL experiment.
- the climate of the late 21st century, represented by temperature anomalies in years 2081- 2100 extracted from the ALL experiment (ALL simulations extended with SSP2 4.5).
Observed and modelled timeseries of the June anomalies averaged over the reference region are illustrated in Fig. 1. Both CRUTEM5 and the ALL experiment suggest an increase in temperature since the late 20th century that continues throughout the 21st century, expected to steadily increase the likelihood of extremely hot events. Such long-term warming is not seen in the NAT climate, suggesting it is of anthropogenic origin.
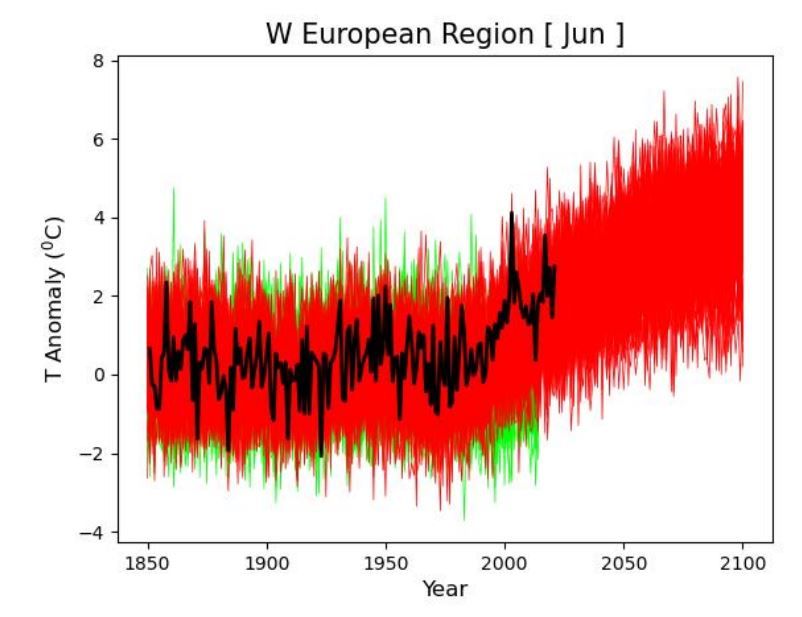
Figure 1. Timeseries of the June temperature anomaly (relative to 1901-1930) in the reference region (5W-13E; 38-52N) computed with observational data from CRUTEM5 (black line) and the CMIP6 ALL (red lines) and NAT (green lines) simulations.
The models were evaluated against the observations (Fig. 2) by applying a number of evaluation tests commonly employed in event attribution studies (Christidis et al., 2013). The observed temperature trend is within the range of the ALL simulations (Fig. 2, top panel). Power spectra also indicate good consistency between the models and CRUTEM5 (middle panel). The Q-Q plot produced for each simulation separately shows lines that lie close to the diagonal, which indicates that the modelled distribution compares well with the observed one. Hence, on the basis of this assessments, the models are deemed suitable for an attribution analysis of extreme heatwaves in the reference region.
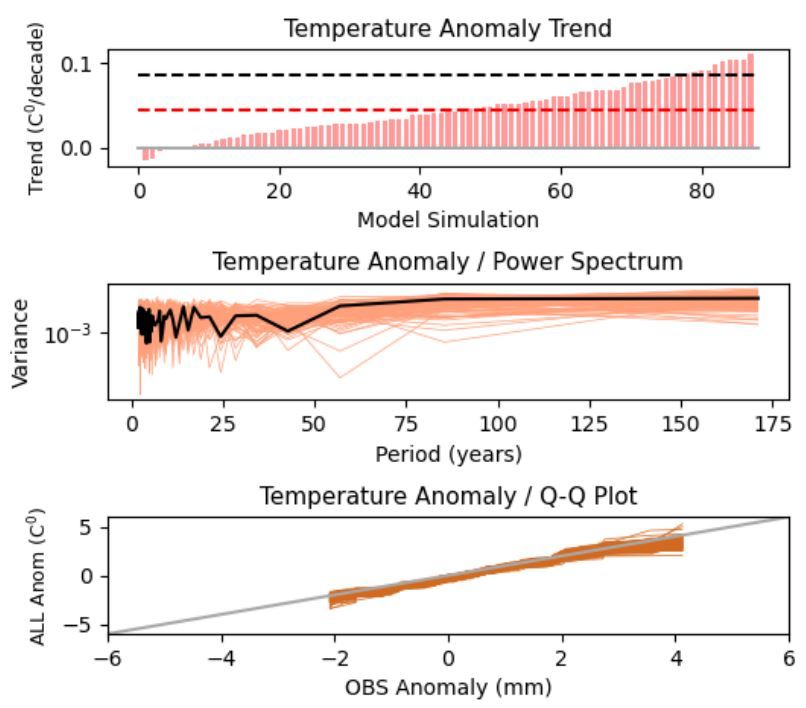
Figure 2. . Evaluation of the CMIP6 models. Top panel: temperature trends over the observational period computed with CRUTEM5 (black dashed line) and individual ALL simulations (vertical bars). The dashed red line marks the ensemble mean. Middle panel: Power spectra from CRUTEM4 (black) and the ALL simulations (orange). Bottom panel: Quantile-Quantile plot for each of the ALL simulations.
Probabilities of a new temperature record in the region are computed next. The 2003 anomaly (previous record) is set as a threshold to define extreme events. Return time estimates (inverse probabilities) and their associated uncertainty are reported in Table 2. It is found that a new record in the region would occur once in several thousand years in the NAT world, while years with June temperatures higher than the one in 2003 are now more common (return time of about 66 years) and, under SSP2-4.5, the threshold is set to be crossed every 2-3 years by the end of the century The event in year 2003 had a return time of 723 years (best estimate). The analysis suggests that human influence has increased the likelihood of extreme June temperature anomalies by a factor of about 136 (Table 3). By the end of the century the likelihood is estimated to increase over a thousand times relative to the natural climate.
Table 2. Return time estimates for extremely hot events. The 5-95% uncertainty range is given in brackets.
| Return Time (years) | |
|---|---|
| NAT | 8240 (3343 to 38688) |
| ALL-year 2003 | 723 (360 to 2245) |
| ALL-present | 66 (52 to 88) |
| ALL-future | 2.64 (2.51 to 2.79) |
Table 3. Risk ratio estimates. The 5-95% uncertainty range is given in brackets.
| Risk Ratio | |
|---|---|
| Prob (present) / Prob (NAT) | 136 (47 to577) |
| Prob (future) / Prob (NAT) | 3413 (1236 to 13946) |
References
Christidis, N., 2021: Using CMIP6 multi-model ensembles for near real-time attribution of extreme events, Hadley Centre Technical Note 107, Available from https://www.metoffice.gov.uk/research/library-and-archive/publications/science/climate-sciencetechnical-notes
Christidis, N., P. A. Stott, A. Scaife, A. Arribas, G. S. Jones, D. Copsey, J. R. Knight, and W. J. Tennant, 2013: A new HadGEM3-A based system for attribution of weather and climate-related extreme events, J. Clim., 26, 2756-2783, https://doi.org/10.1175/JCLI-D-12-00169.1
Eyring, V., S. Bony, G. A. Meehl, C. A. Senior, B. Stevens, R. J. Stouffer, and K. E. Taylor, 2016: Overview of the Coupled Model Intercomparison Project Phase 6 (CMIP6) experimental design and organization, Geosci. Mod. Dev., 9, 1937–1958, https://doi.org/10.5194/gmd-9-1937-2016
Osborn, T. J., P. D. Jones, D. H. Lister, C. P. Morice, I. R. Simpson, and I. C. Harris, 2020: Land surface air temperature variations across the globe updated to 2019: the CRUTEM5 dataset, J. Geophys. Res., 126, https://doi.org/10.1029/2019JD032352
Riahi, K., and co-Authors, 2017: The shared socioeconomic pathways and their energy, land use, and greenhouse gas emissions implications: an overview, Global Env. Change, 42, 153– 168, https://doi.org/10.1016/j.gloenvcha.2016.05.009