
Tropical cyclone verification northern hemisphere 2025
A summary of tropical cyclone activity in the Northern Hemisphere for the 2025 season together with an assessment of the performance of the Met Office global model in predicting the track and intensity of these tropical cyclones.
1. Introduction
A summary of tropical cyclone activity in the Northern Hemisphere for the 2025 season is presented below together with an assessment of the performance of the Met Office global model in predicting the track and intensity of these tropical cyclones.
Tropical cyclones are experienced in the North Pacific, North Atlantic and North Indian Oceans and nearby tropical seas with occasional tropical or subtropical storms in the Mediterranean Sea. For the purpose of tropical cyclone verification the northern hemisphere is divided in to five basins; the North-West Pacific (west of 180° E to the Malay Peninsula), the North-East Pacific (east of 180° E), the North Atlantic, the North Indian Ocean (west of the Malay Peninsula) and the Mediterranean Sea. Mean error statistics for the four main basins are presented together with a table of statistics for the whole Northern Hemisphere. Verification is performed at 12-hour intervals up to forecast time T+168, although statistics are only presented at 24-hour intervals in this report. The global model resolution in operation was 0.140625° x 0.09375° x 70 levels. This is equivalent to a horizontal resolution of 16 km × 10 km at the equator.
Tropical cyclone forecast verification - measures of error
Advisory positions received in real time from RSMC Tokyo, JTWC Hawaii, NHC Miami and CPHC Honolulu are used as verifying observations of storm location. Best track data from these centres will be obtained once they become available. Past experience shows that use of best track rather than real time data usually only makes minor differences to seasonal error statistics. Some mean error statistics for last season are also included for the purposes of a comparison. Forecast tracks are only verified when a depression reaches tropical storm status.
2. Tropical cyclone activity
Tropical cyclone activity
| NWP | NEP | NAT | NI | MED | TOTAL | |
| Tropical depressions (<34 knots) | 7 (5) | 0 (2) | 0 (0) | 0 (0) | 0 (0) | 7 (7) |
| Tropical storms (34-63 knots) | 10 (8) | 9 (8) | 8 (7) | 4 (3) | 0 (2) | 31 (28) |
| Hurricanes/typhoons (>63 knots) | 17 (15) | 11 (5) | 5 (11) | 1 (1) | 0 (0) | 34 (32) |
| Total | 34 (28) | 20 (15) | 13 (18) | 5 (4) | 0 (2) | 72 (67) |
Categories assigned based on 1-minute averaged winds
Basin name abbreviations:
NWP : North-west Pacific (west of 180° E)
NEP : North-east Pacific (east of 180° E)
NAT : North Atlantic
NI : North Indian (west of Malay Peninsula)
MED : Mediterranean Sea
The number in brackets indicates the figure for the 2024 season.
3. Summary of northern hemisphere storms
3.1 North-west Pacific basin storms
Table of mean error statistics
| T+0 | T+24 | T+48 | T+72 | T+96 | T+120 | T+144 | T+168 | |
| Possibly verified | 243 | 184 | 138 | 100 | 71 | 45 | 25 | 15 |
| Detection rate (%) | 100 | 99 | 99 | 95 | 93 | 87 | 92 | 93 |
| AT error (km) | -4 | -13 | -22 | -59 | -146 | -343 | -404 | -459 |
| CT error (km) | 1 | 10 | 7 | 25 | 32 | 23 | 106 | 102 |
| Track skill (%) | ***** | 69 | 78 | 78 | ***** | ***** | ***** | ***** |
| * 2020-24 skill (%) | ***** | 66 | 72 | 71 | ***** | ***** | ***** | ***** |
| DPE (km) | 39 | 68 | 106 | 156 | 270 | 477 | 677 | 871 |
| * 2020-24 DPE (km) | 34 | 67 | 121 | 191 | 297 | 421 | 554 | 661 |
| Central pressure bias (mb) | 3.0 | 8.2 | 11.2 | 11.5 | 11.0 | 6.5 | 8.2 | 13.4 |
* 5-year running mean DPE and skill for all north-west Pacific storms 2020-24
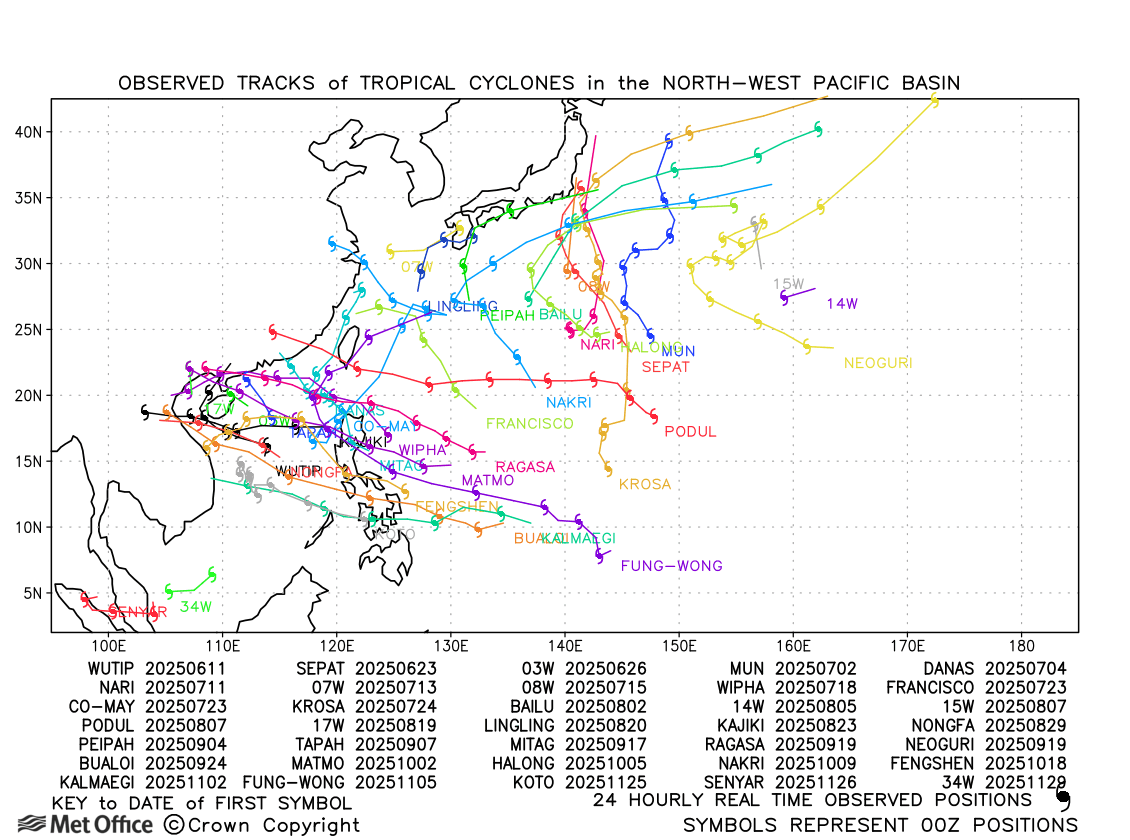
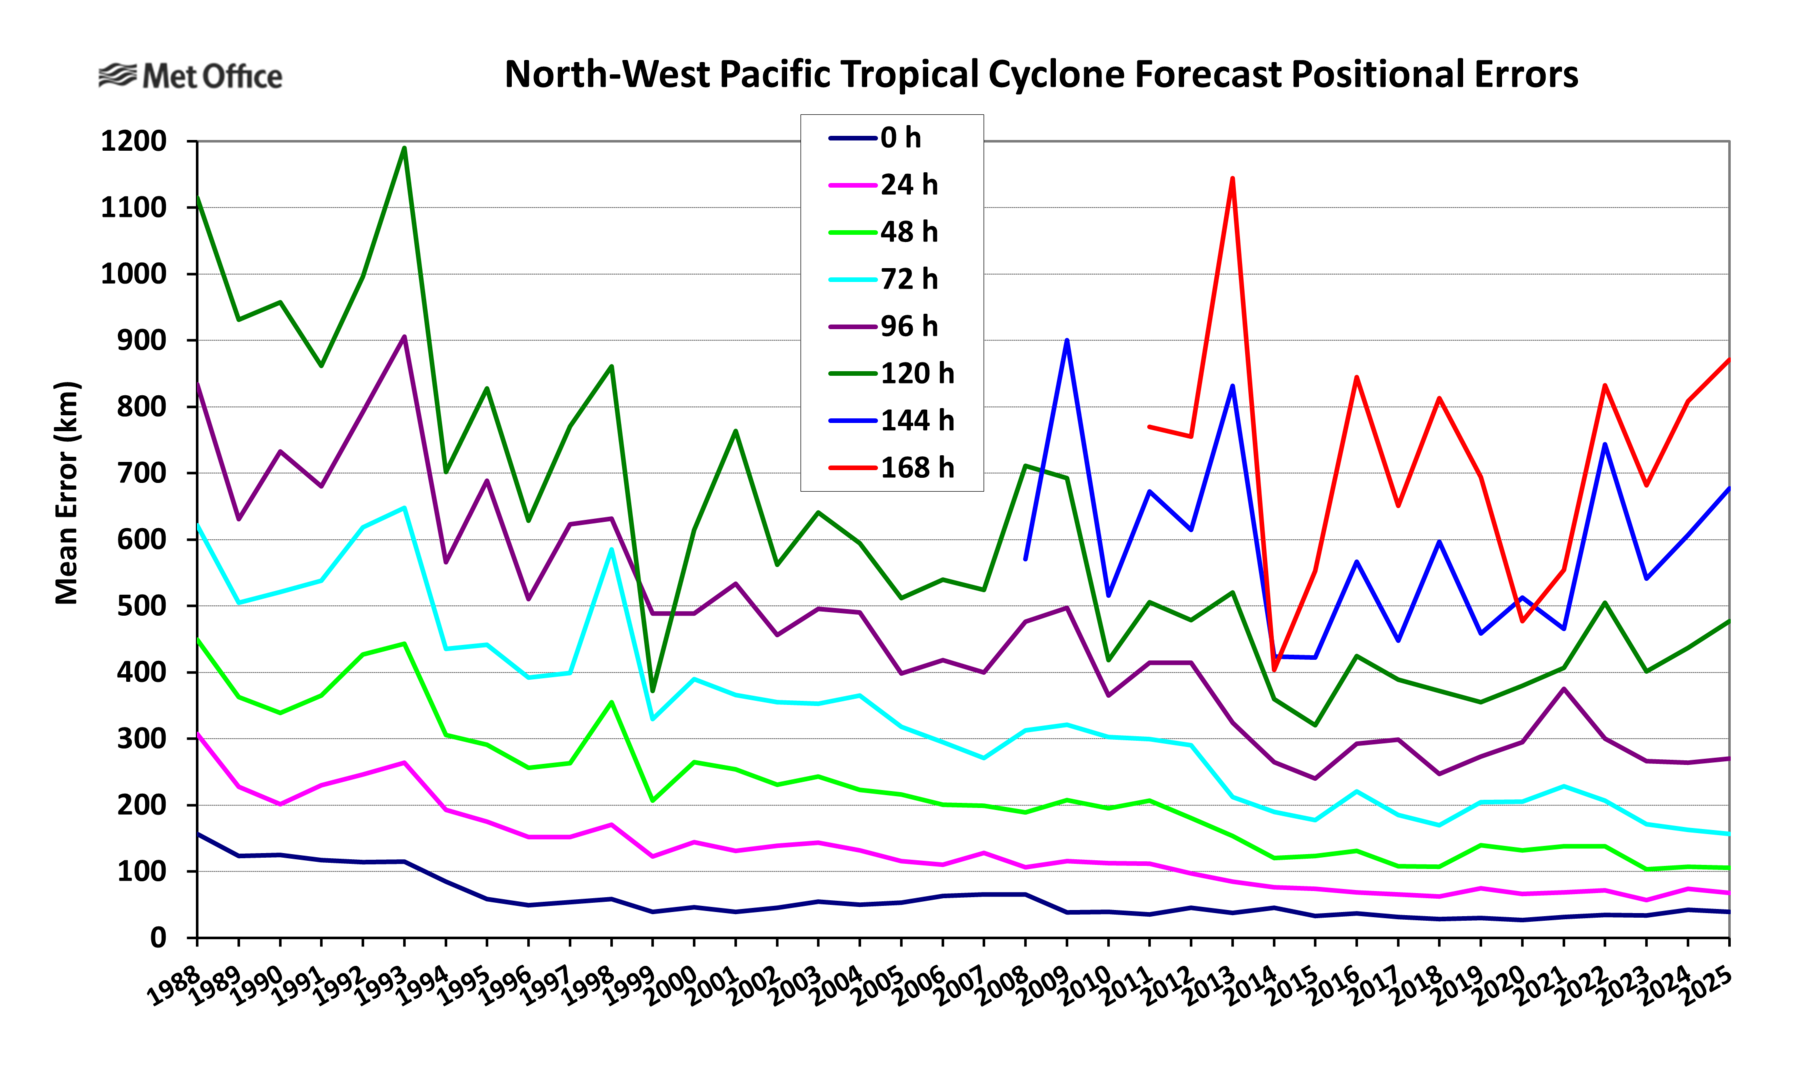
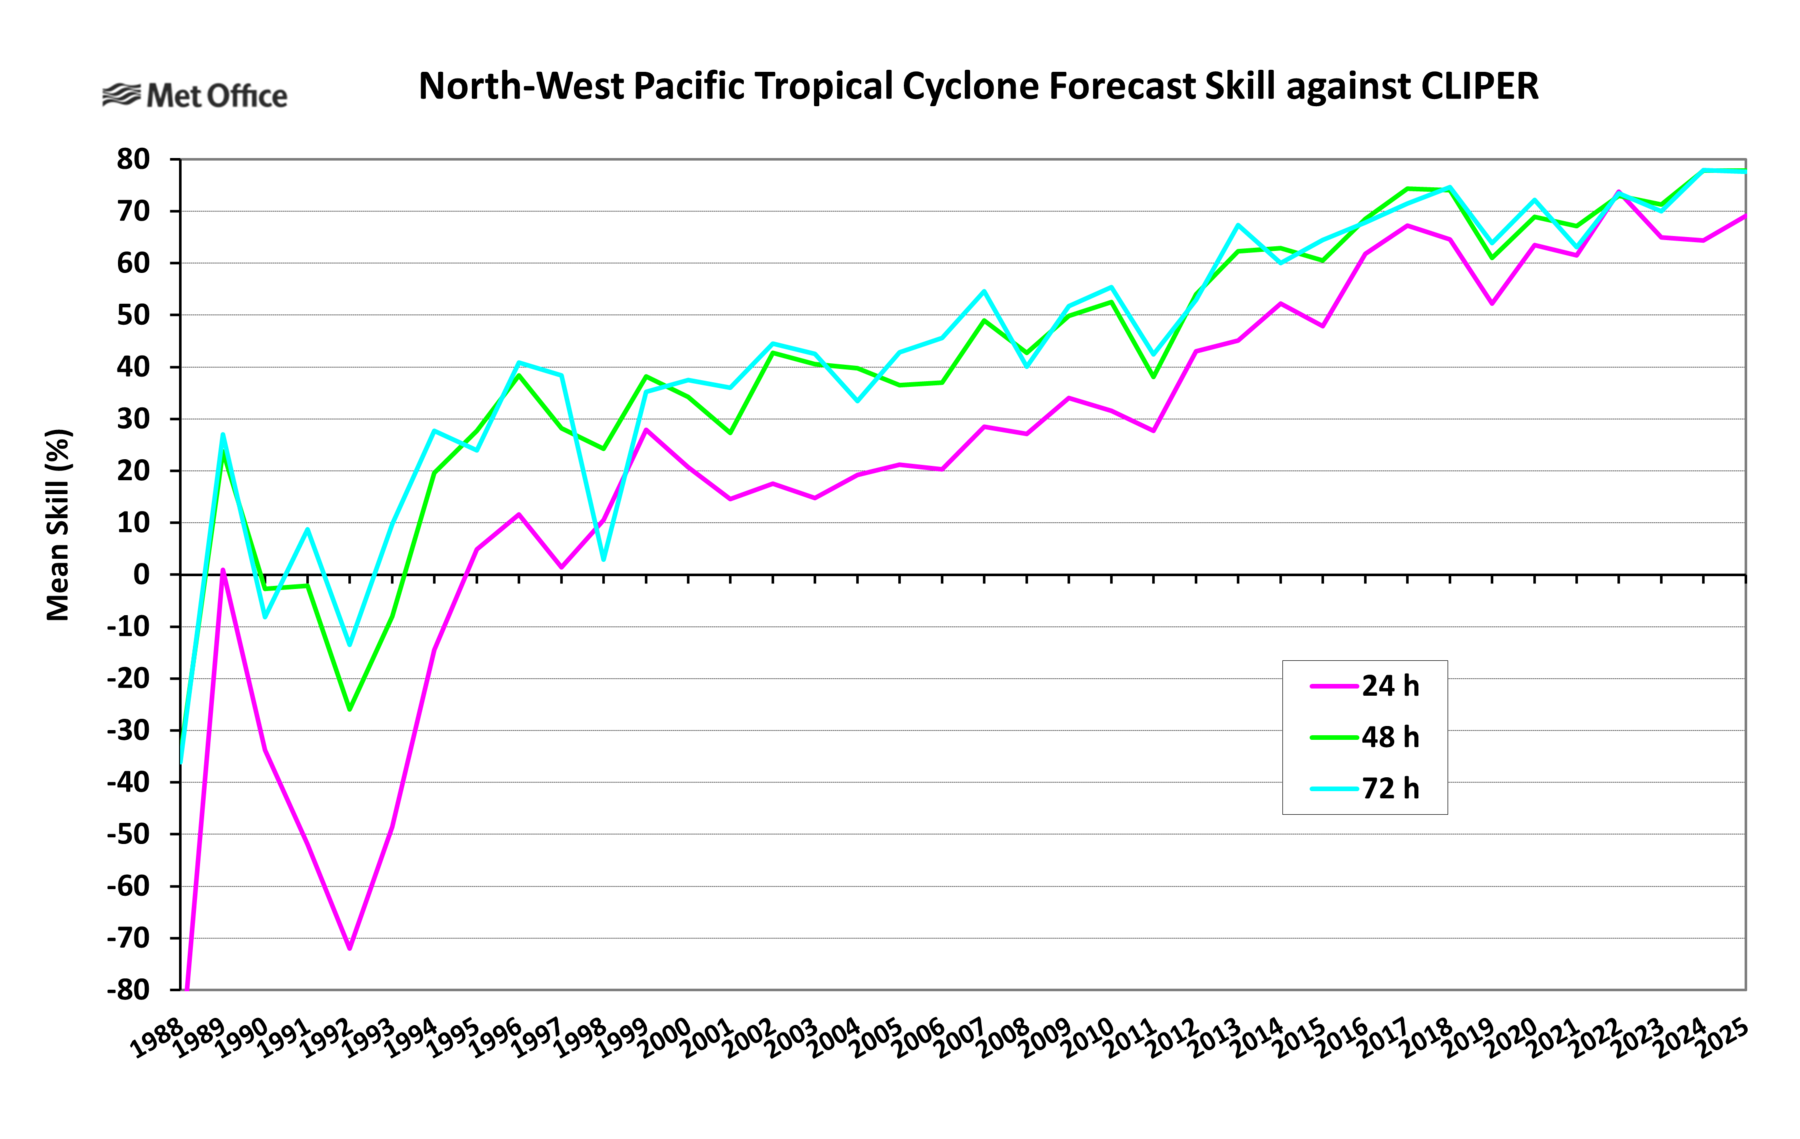
Total storm activity was higher than 2024. Track forecast errors were below the 5-year running mean up to 96 hours, but above the mean at longer lead times. The central pressure bias grew slightly with forecast lead time, but by far less than last season.
3.2 North-east Pacific basin storms
Table of mean error statistics
| T+0 | T+24 | T+48 | T+72 | T+96 | T+120 | T+144 | T+168 | |
| Possibly verified | 172 | 131 | 92 | 64 | 44 | 31 | 21 | 13 |
| Detection rate (%) | 100 | 97 | 97 | 97 | 95 | 90 | 90 | 92 |
| AT error (km) | 1 | 16 | 39 | 66 | 89 | 34 | -74 | -205 |
| CT error (km) | -6 | -12 | -8 | -35 | -63 | -111 | -155 | -223 |
| Track skill (%) | ***** | 58 | 71 | 78 | ***** | ***** | ***** | ***** |
| * 2020-24 skill (%) | ***** | 53 | 60 | 65 | ***** | ***** | ***** | ***** |
| DPE (km) | 32 | 71 | 113 | 151 | 230 | 326 | 404 | 548 |
| * 2020-24 DPE (km) | 39 | 80 | 140 | 215 | 291 | 331 | 447 | 622 |
| Central pressure bias (mb) | 2.2 | 6.8 | 9.5 | 11.1 | 13.5 | 17.9 | 17.8 | 13.8 |
* 5-year running mean DPE and skill for all north-east Pacific storms for 2020-24
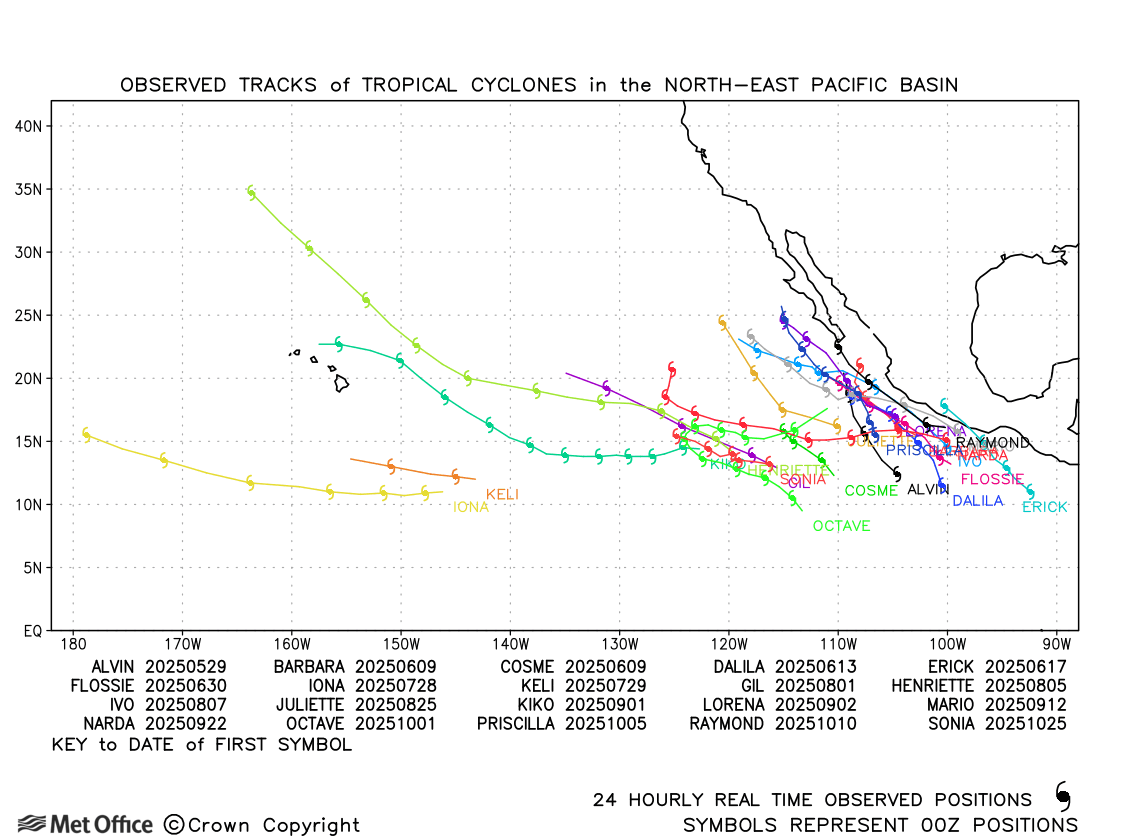
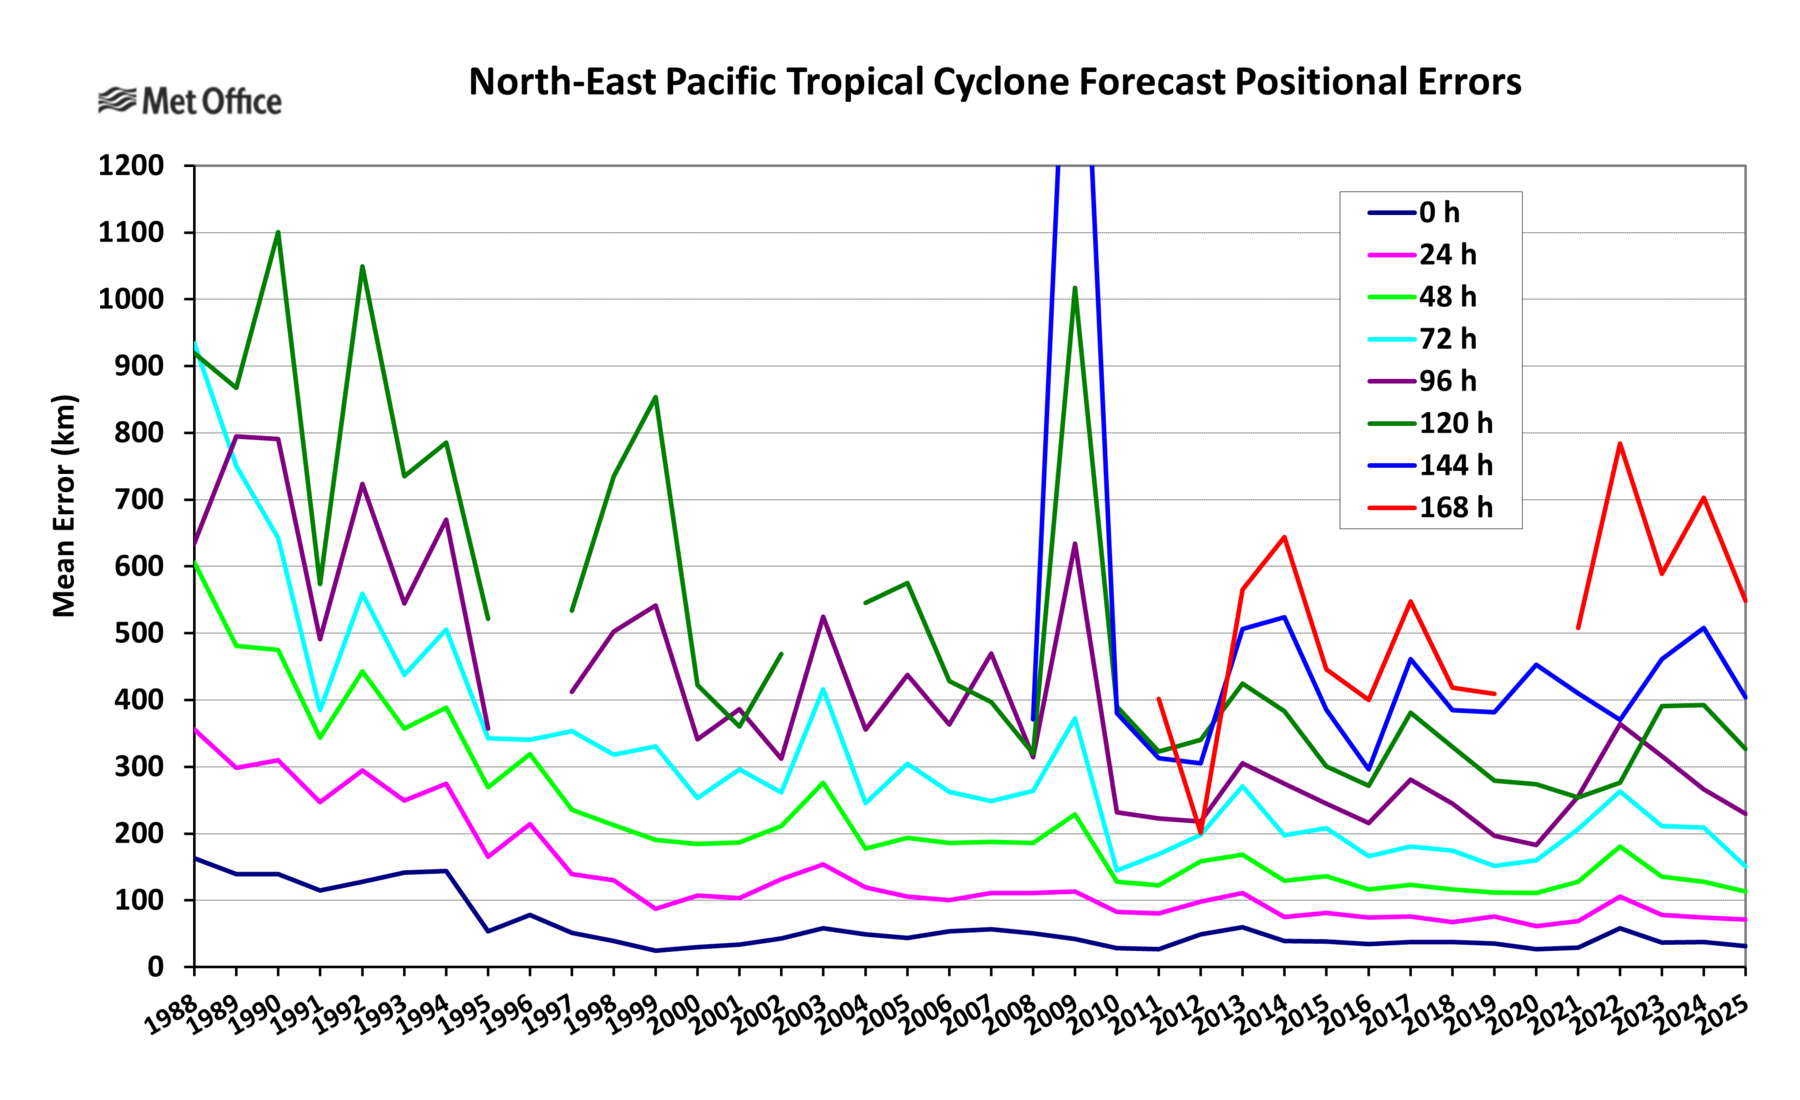
Activity was higher than 2024. Track forecast errors were below the 5-year running mean at all lead times. There was a small weak bias in central pressure forecasts.
3.3 North Atlantic basin storms
Table of mean error statistics
| T+0 | T+24 | T+48 | T+72 | T+96 | T+120 | T+144 | T+168 | |
| Possibly verified | 123 | 99 | 81 | 62 | 47 | 38 | 30 | 22 |
| Detection rate (%) | 100 | 98 | 95 | 98 | 100 | 100 | 93 | 91 |
| AT error (km) | 6 | -3 | 5 | -49 | -88 | -126 | -178 | 72 |
| CT error (km) | 3 | 0 | 5 | 17 | 11 | 14 | -21 | -144 |
| Track skill (%) | ***** | 60 | 72 | 70 | ***** | ***** | ***** | ***** |
| * 2020-24 skill (%) | ***** | 68 | 75 | 72 | ***** | ***** | ***** | ***** |
| DPE (km) | 31 | 73 | 118 | 196 | 317 | 471 | 725 | 1013 |
| * 2020-24 DPE (km) | 30 | 62 | 109 | 180 | 260 | 386 | 553 | 695 |
| Central pressure bias (mb) | 5.7 | 12.3 | 18.9 | 24.6 | 31.3 | 34.0 | 26.3 | 18.2 |
* 5-year running mean DPE and skill for all North Atlantic storms for 2020-24
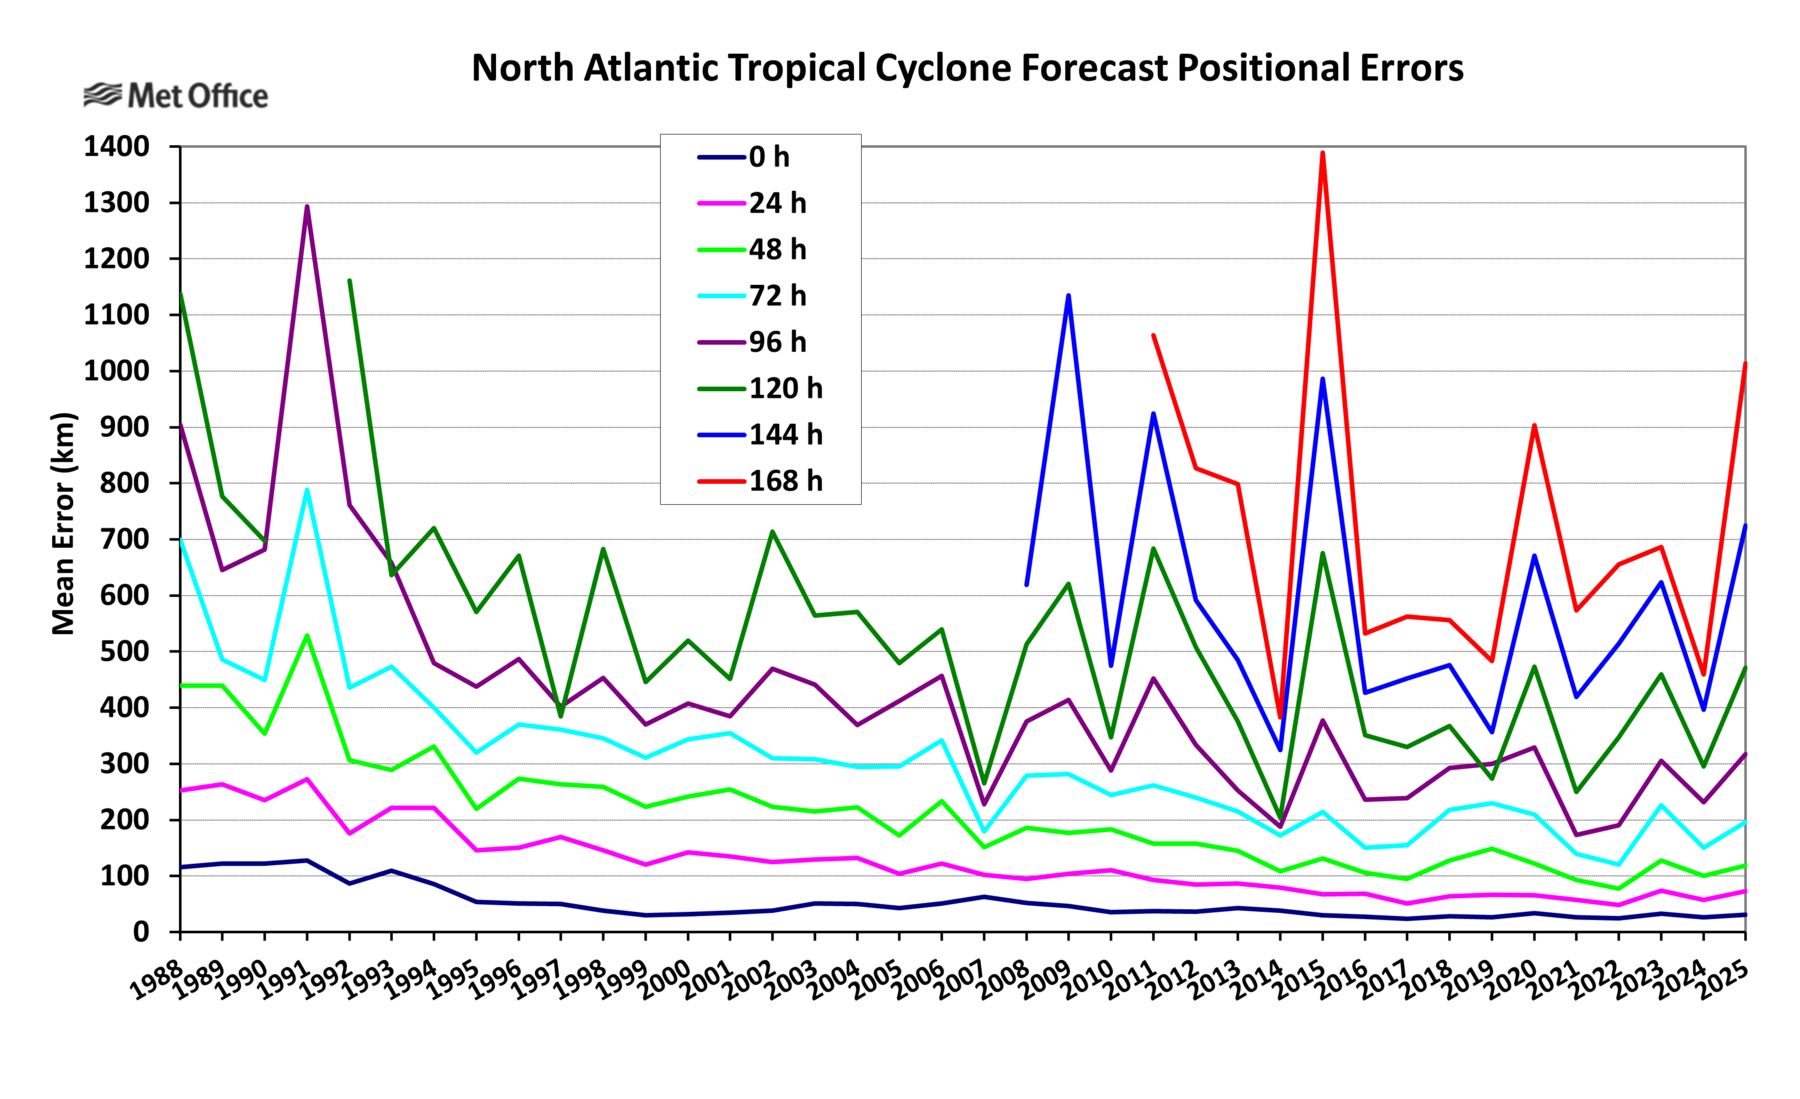
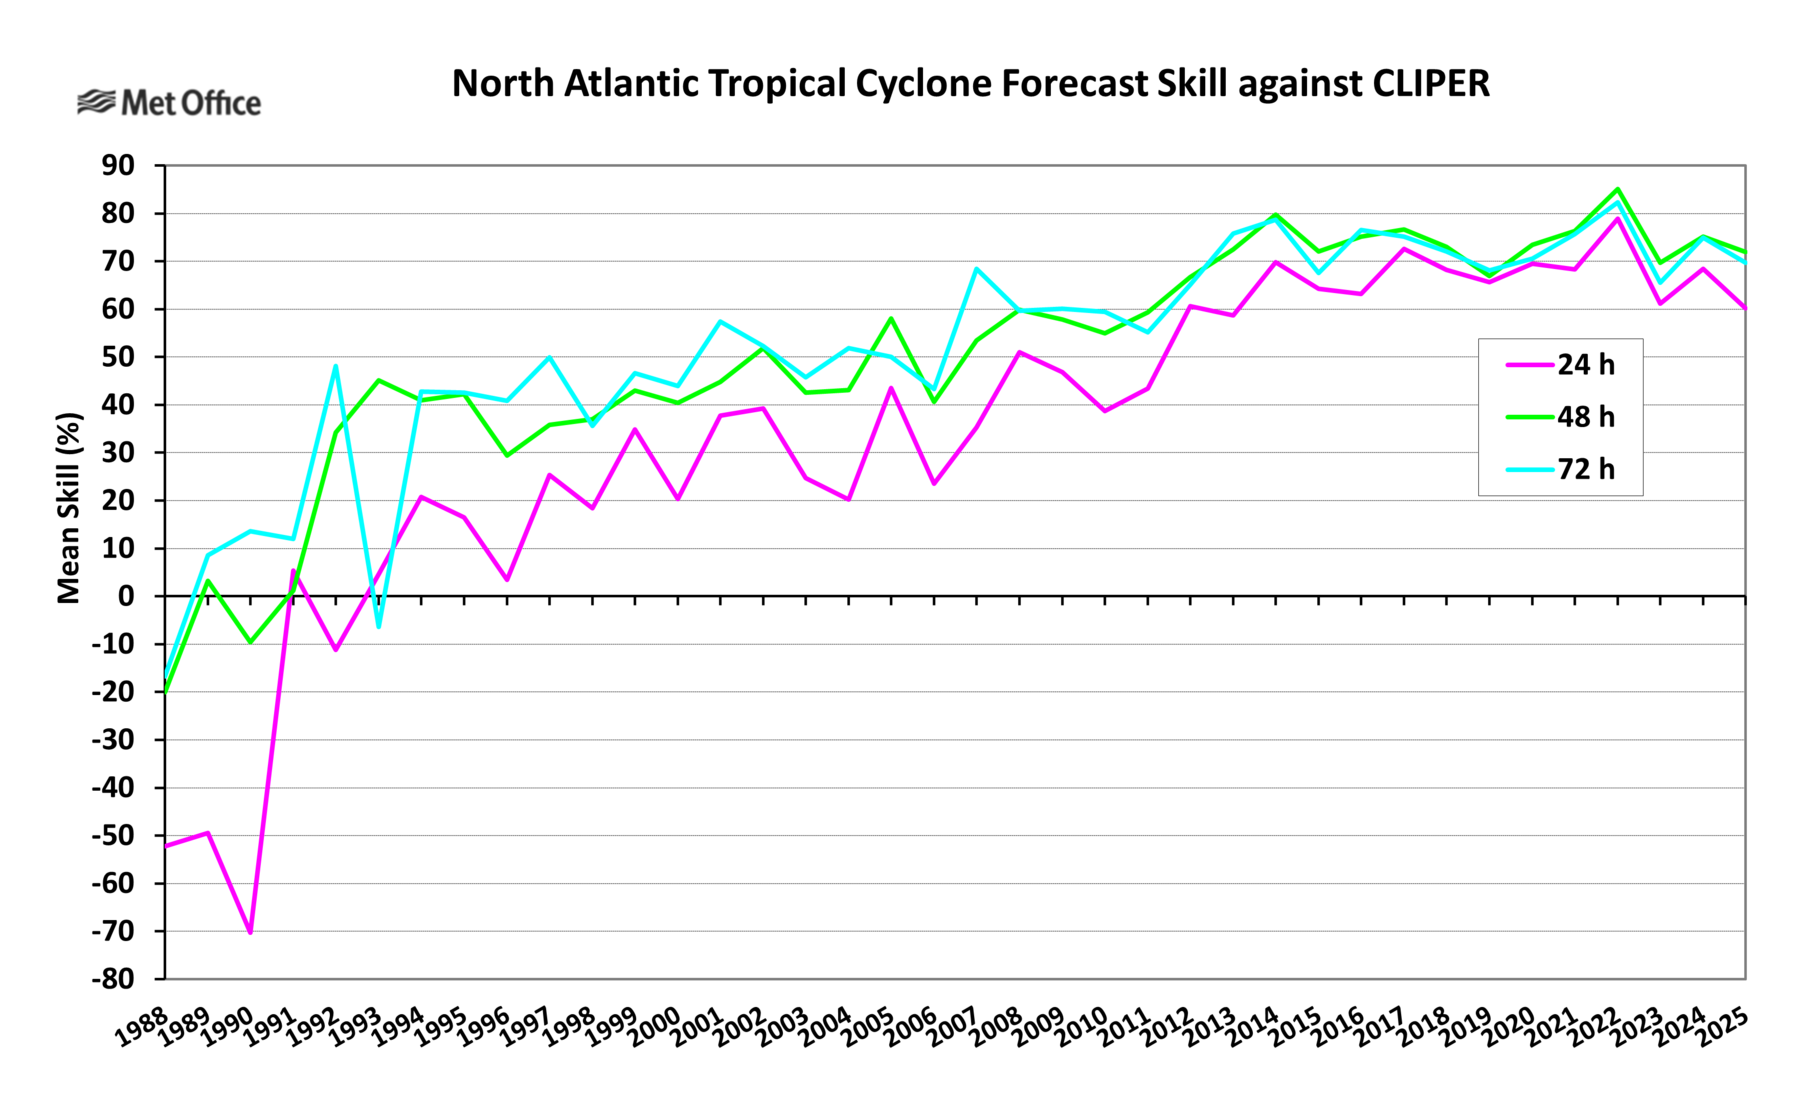
Activity was lower than in the last few years, although a high proportion of hurricanes were major. Track forecast errors were higher than the 5-year running mean at all lead times - particularly at long lead times. This was primarily due to poor track forecasts for Hurricane Melissa. There was a weak bias in forecasts.
3.4 North Indian Basin Storms
Table of mean error statistics
| T+0 | T+24 | T+48 | T+72 | T+96 | T+120 | T+144 | T+168 | |
| Possibly verified | 26 | 16 | 8 | 2 | ***** | ***** | ***** | ***** |
| Detection rate (%) | 100 | 94 | 100 | 100 | ***** | ***** | ***** | ***** |
| AT error (km) | -17 | -51 | -123 | -323 | ***** | ***** | ***** | ***** |
| CT error (km) | -9 | 11 | 22 | -292 | ***** | ***** | ***** | ***** |
| Track skill (%) | ***** | 44 | 52 | ***** | ***** | ***** | ***** | ***** |
| * 2020-24 skill (%) | ***** | 58 | 68 | 66 | ***** | ***** | ***** | ***** |
| DPE (km) | 55 | 93 | 169 | 522 | ***** | ***** | ***** | ***** |
| * 2020-24 DPE (km) | 40 | 61 | 96 | 181 | 242 | 324 | 395 | 405 |
| Central pressure bias (mb) | 1.4 | 2.4 | 4.5 | 5.5 | ***** | ***** | ***** | ***** |
* 5-year running mean DPE and skill for all North Indian storms for 2020-24
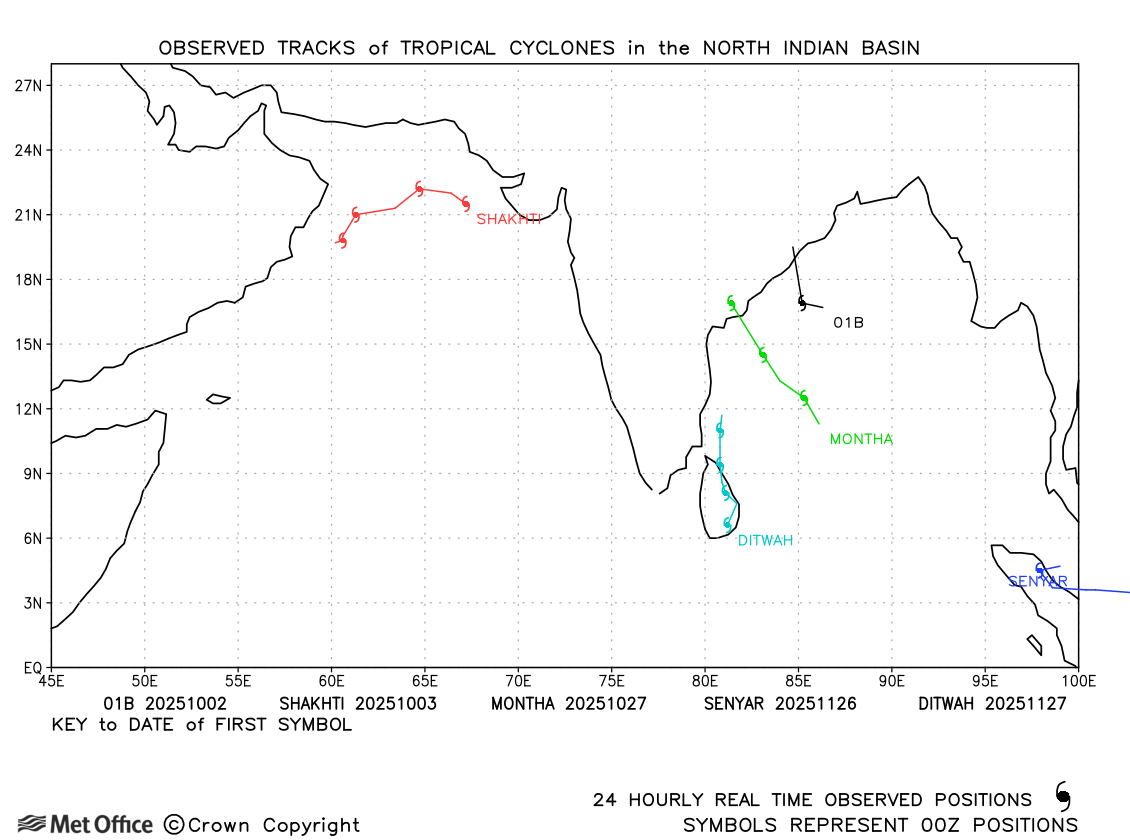
Activity was similar to 2024 with no forecasts beyond 84 hours. Track forecast errors above the 5-year running mean values. There was a very small weak bias in forecast central pressure.
3.5 Combined statistics for whole northern hemisphere
Table of mean error statistics
| T+0 | T+24 | T+48 | T+72 | T+96 | T+120 | T+144 | T+168 | |
| Possibly verified | 564 | 430 | 319 | 228 | 162 | 114 | 76 | 50 |
| Detection rate (%) | 100 | 98 | 97 | 96 | 96 | 92 | 92 | 92 |
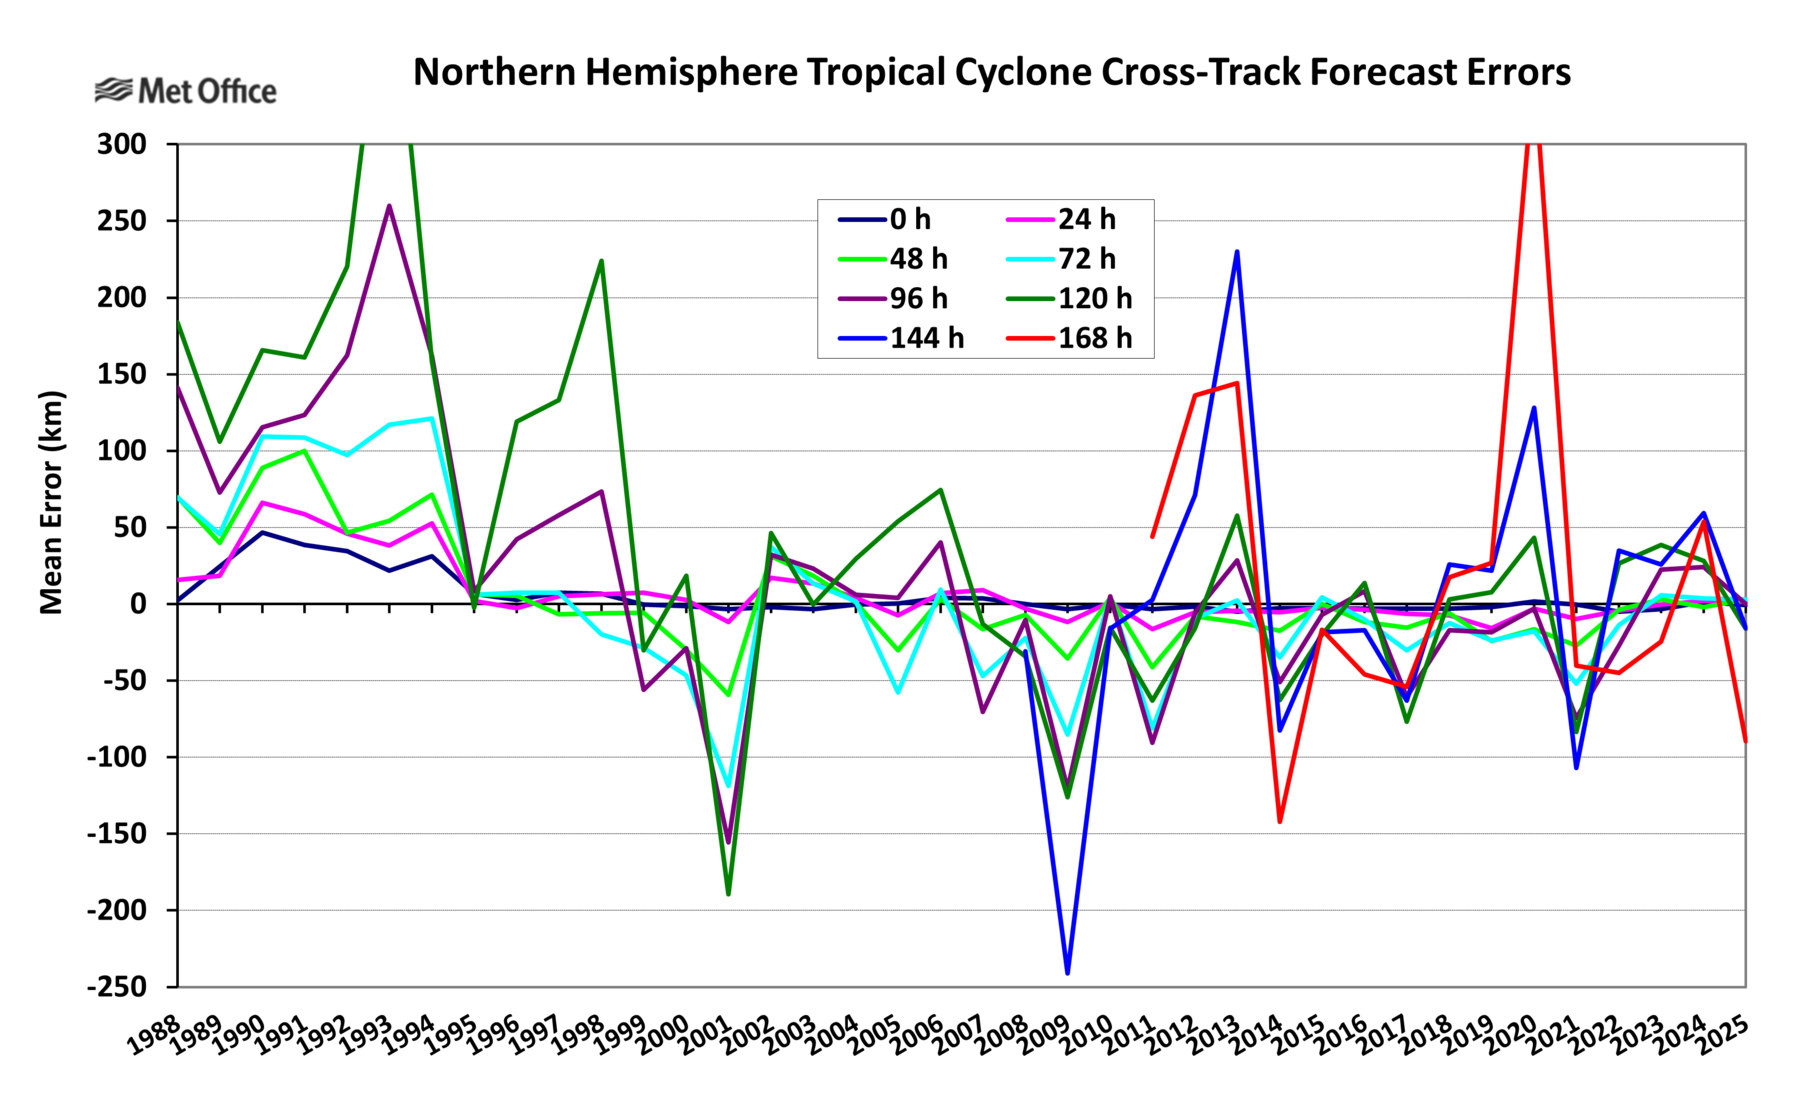
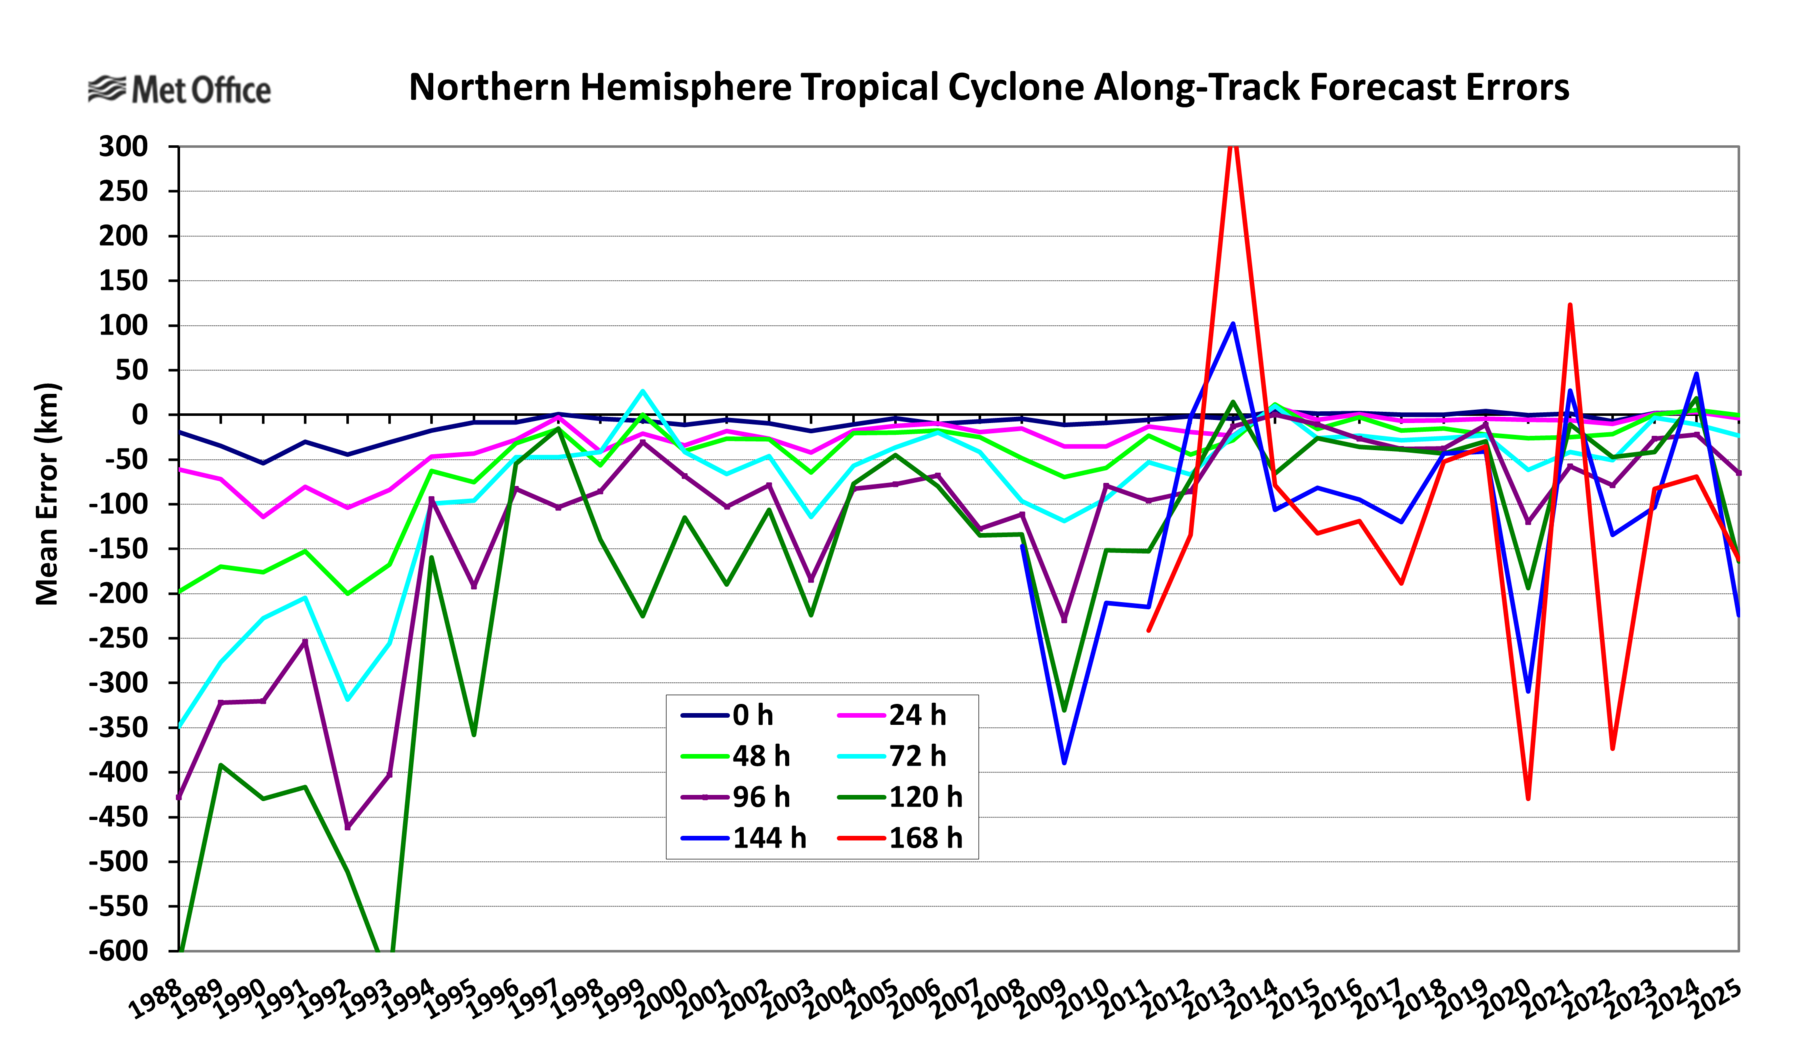
| AT error (km) | -1 | -4 | 0 | -23 | -65 | -164 | -224 | -162 |
| CT error (km) | -1 | 1 | 3 | 3 | 0 | -16 | -16 | -90 |
| Track skill (%) | ***** | 64 | 75 | 75 | ***** | ***** | ***** | ***** |
| * 2020-24 skill (%) | ***** | 64 | 71 | 70 | ***** | ***** | ***** | ***** |
| DPE (km) | 36 | 71 | 113 | 169 | 273 | 435 | 622 | 849 |
| * 2020-24 DPE (km) | 34 | 68 | 121 | 192 | 281 | 389 | 533 | 664 |
| Central pressure bias (mb) | 3.3 | 8.5 | 12.5 | 15.0 | 17.9 | 19.5 | 18.1 | 15.6 |
* 5-year running mean DPE and skill for all northern hemisphere storms for 2020-24
Tropical cyclone activity was higher in 2025 than in 2024.
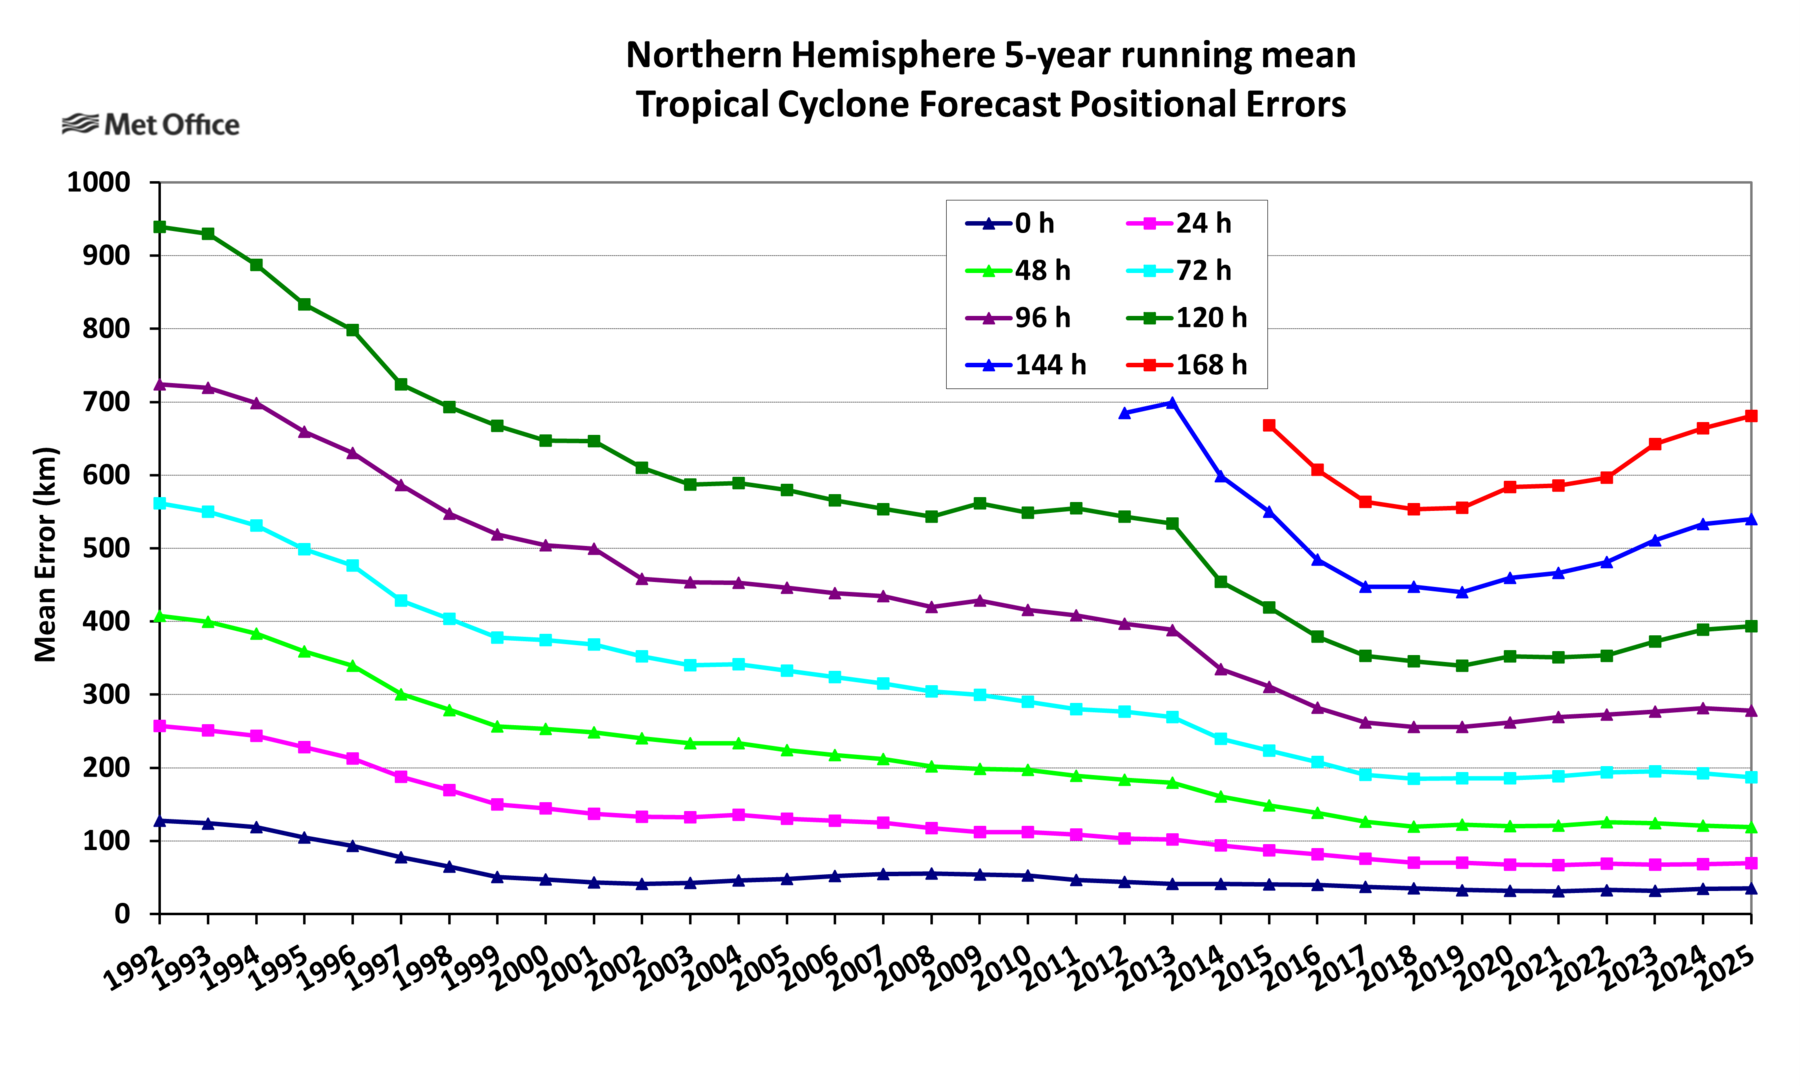
Track forecast errors were below the 5-year running mean up to 96-hours, but above the mean at longer lead times. There was a slow bias at longer lead times, but cross-track biases were mostly small. There was a small drop in detection percentages at longer lead times.
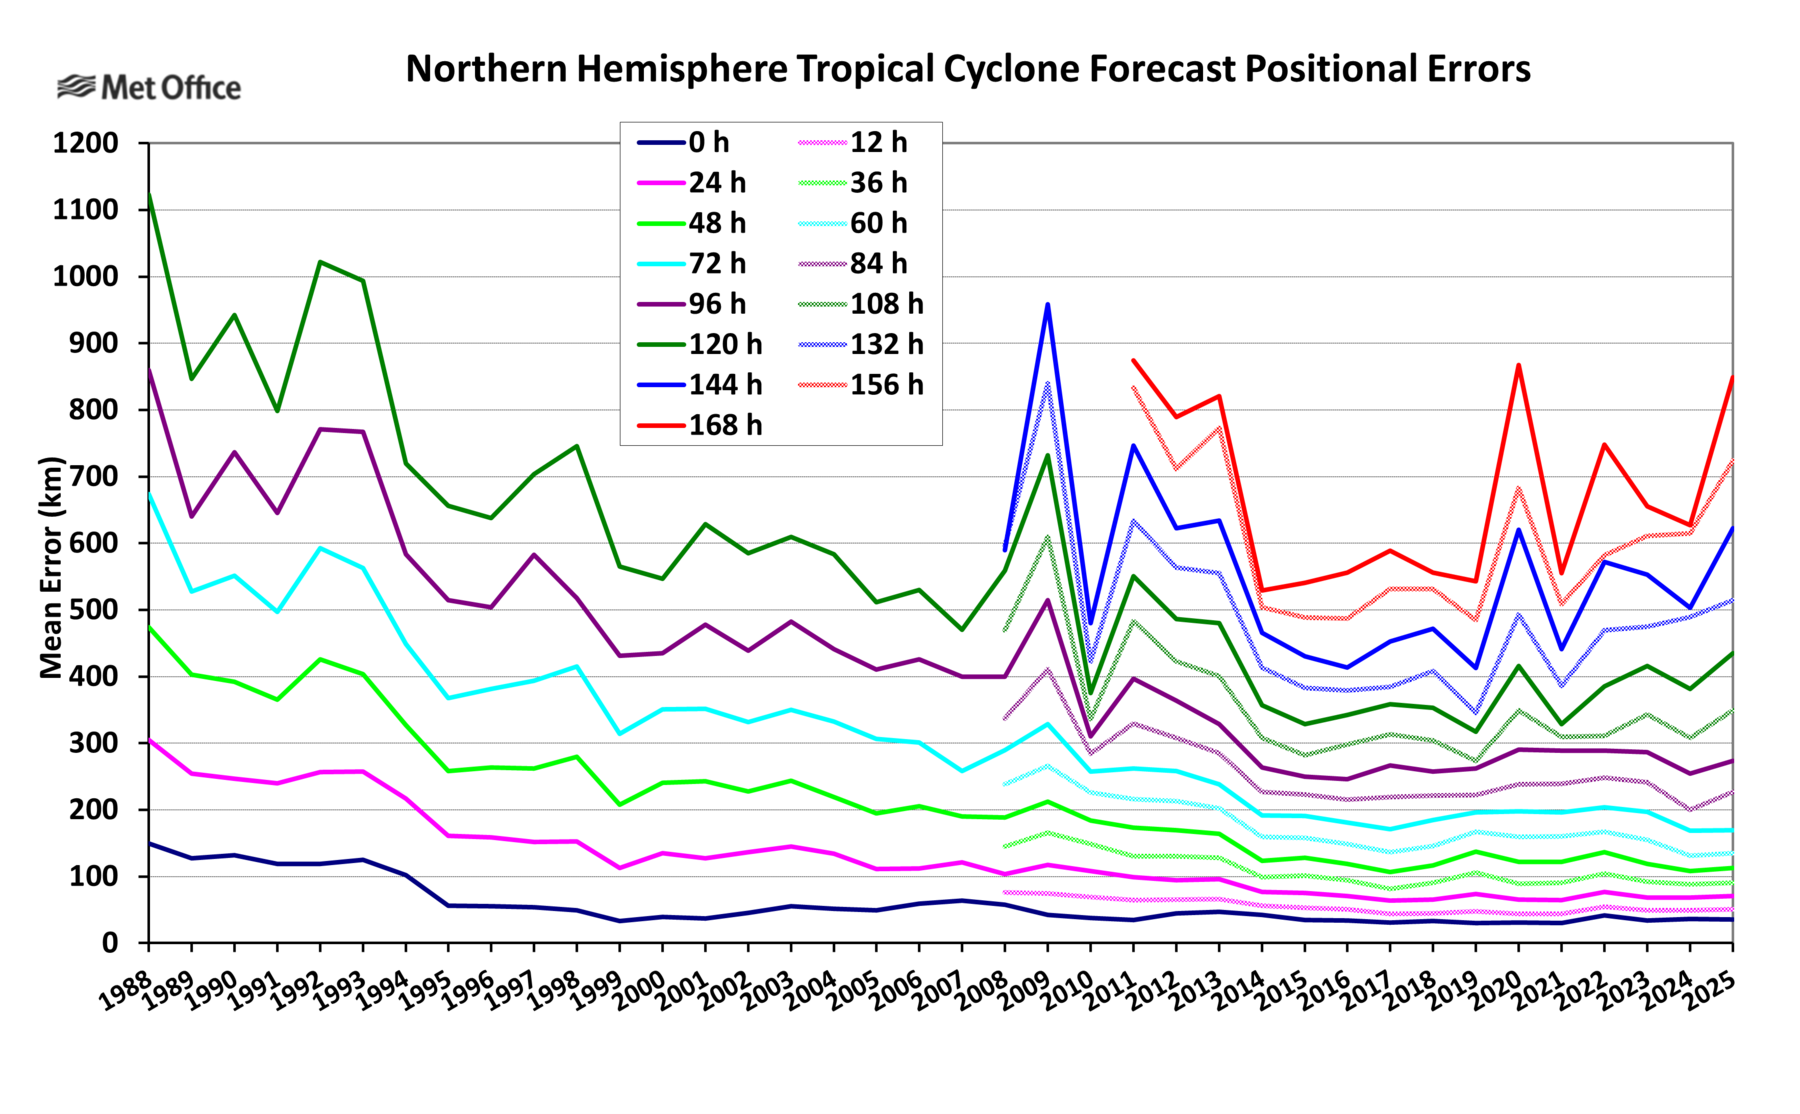
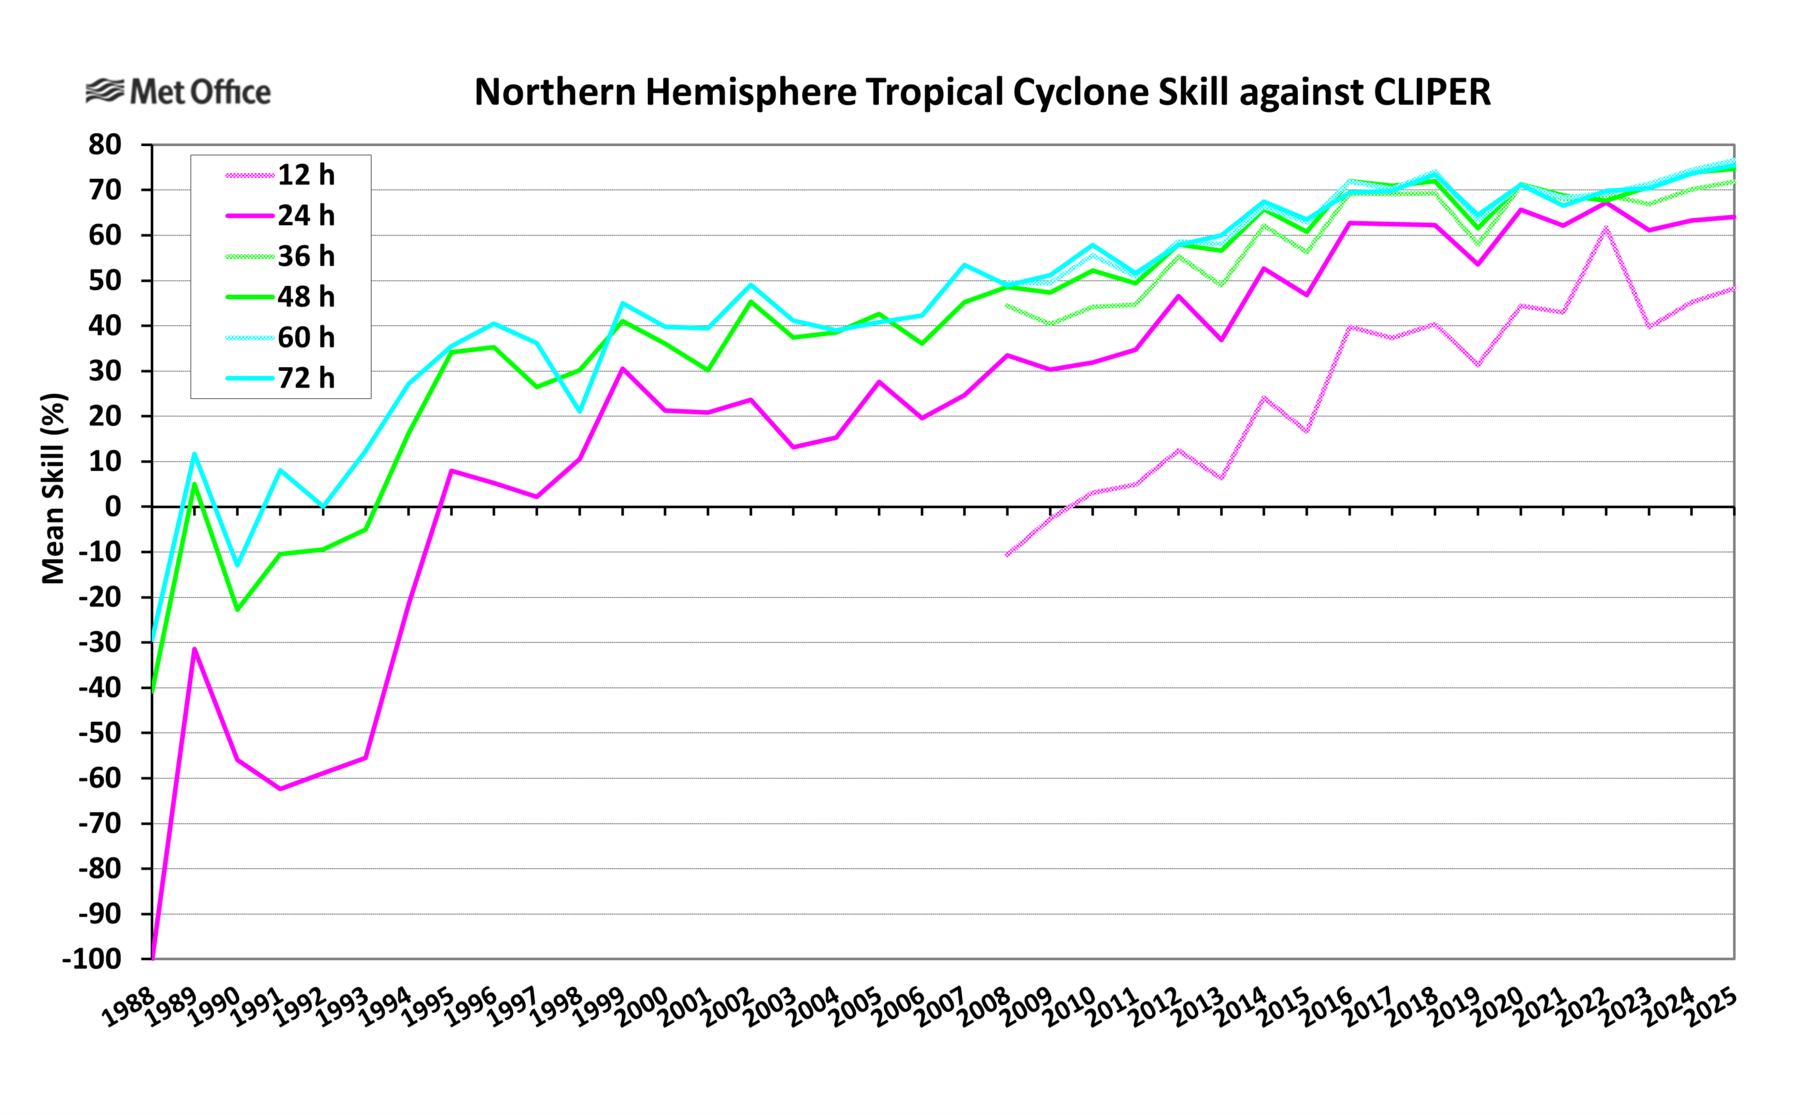
The 5-year running mean of track forecast errors was stable at short lead times, but slightly increased at longer lead times.
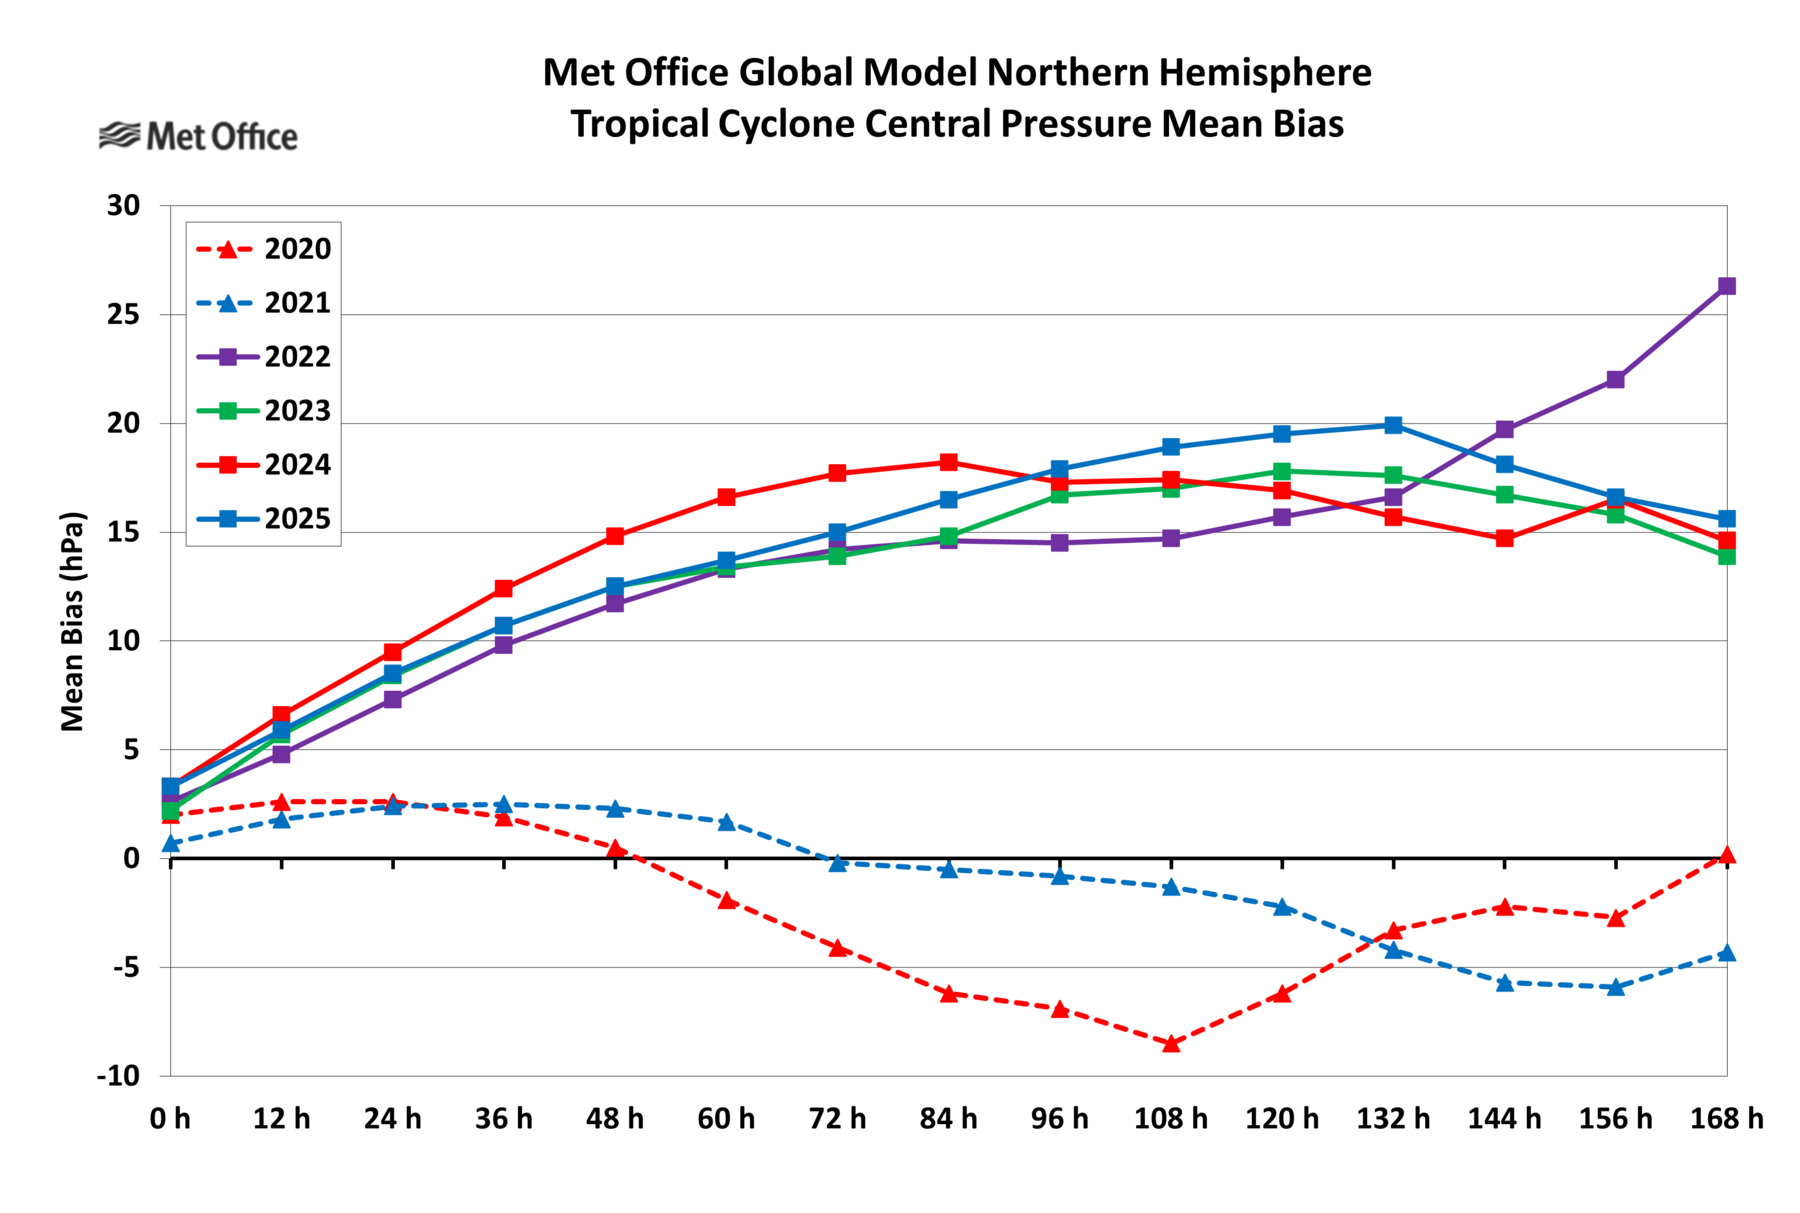
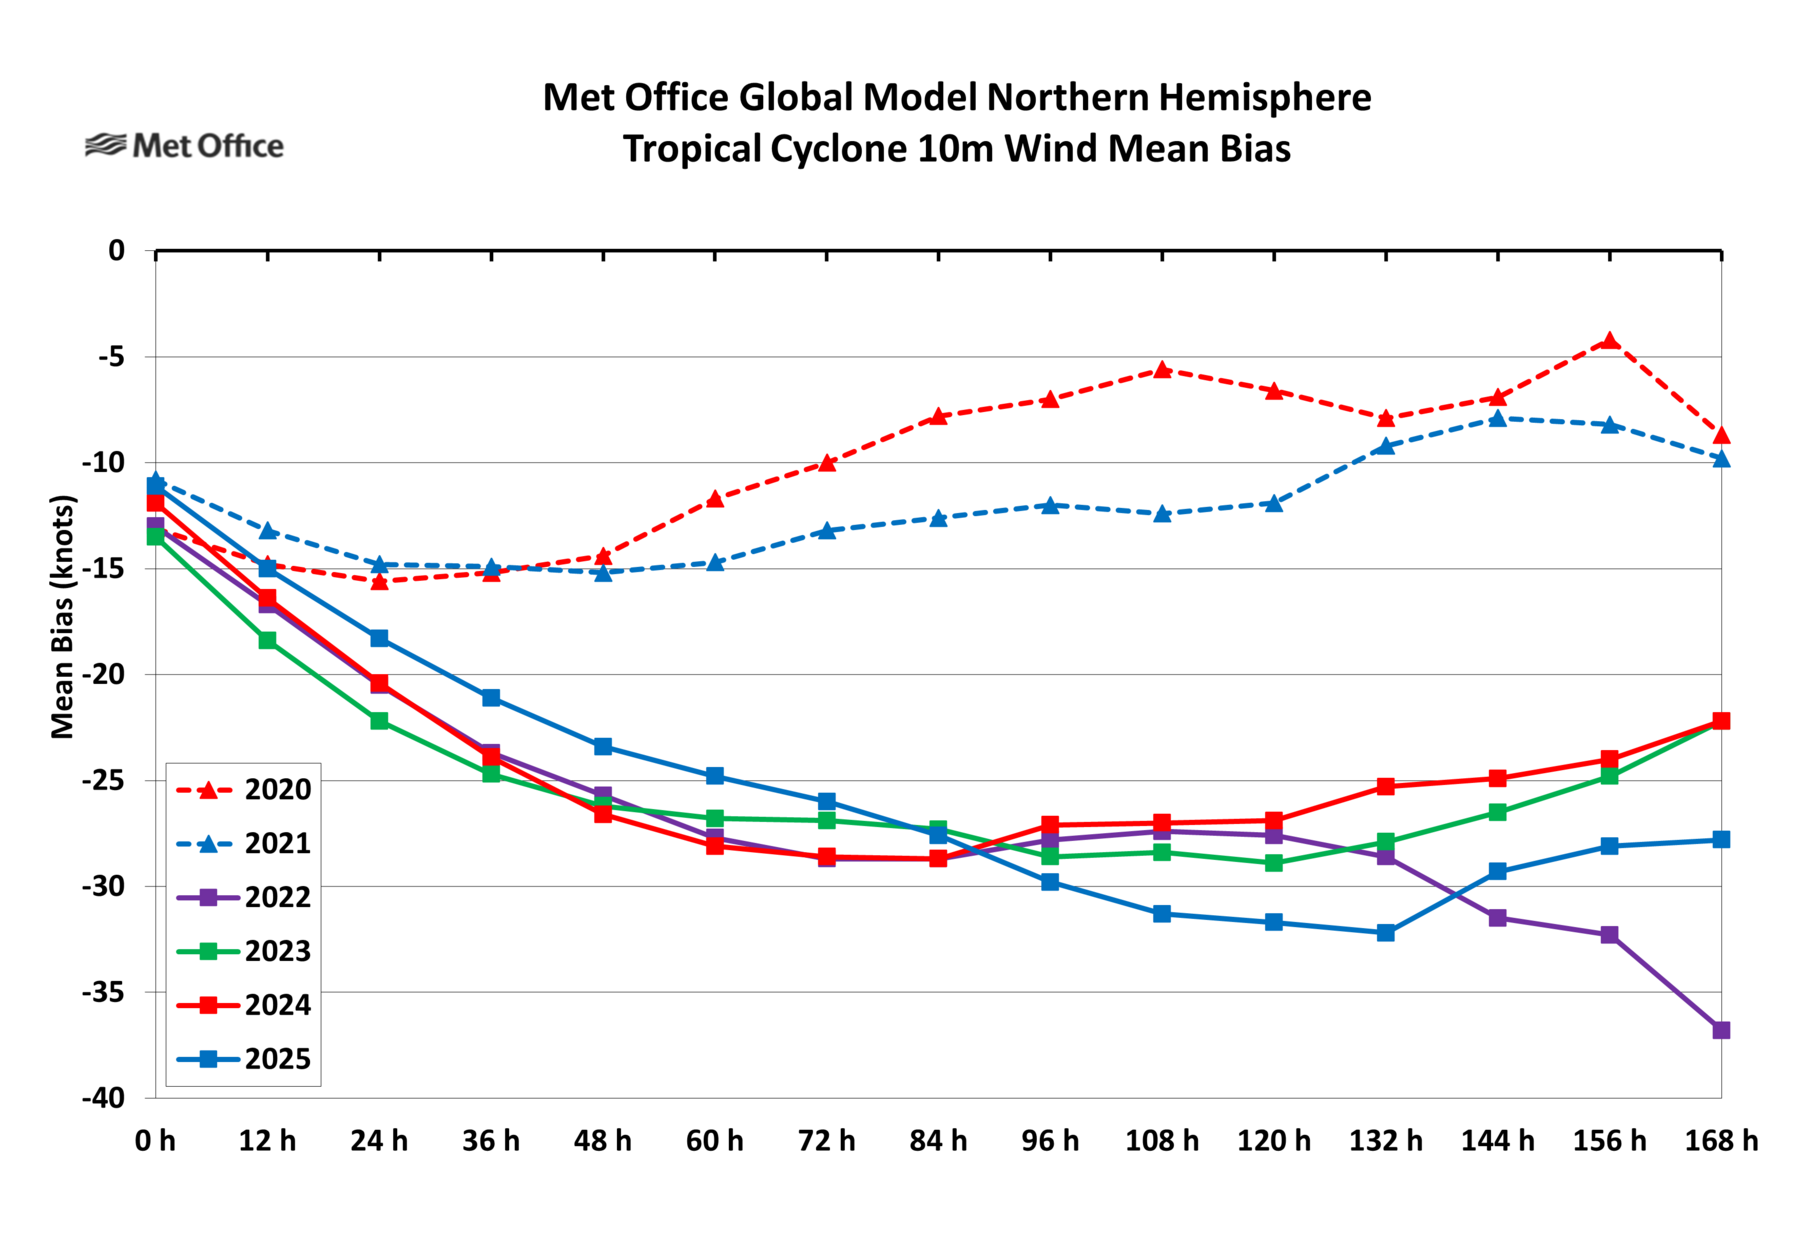
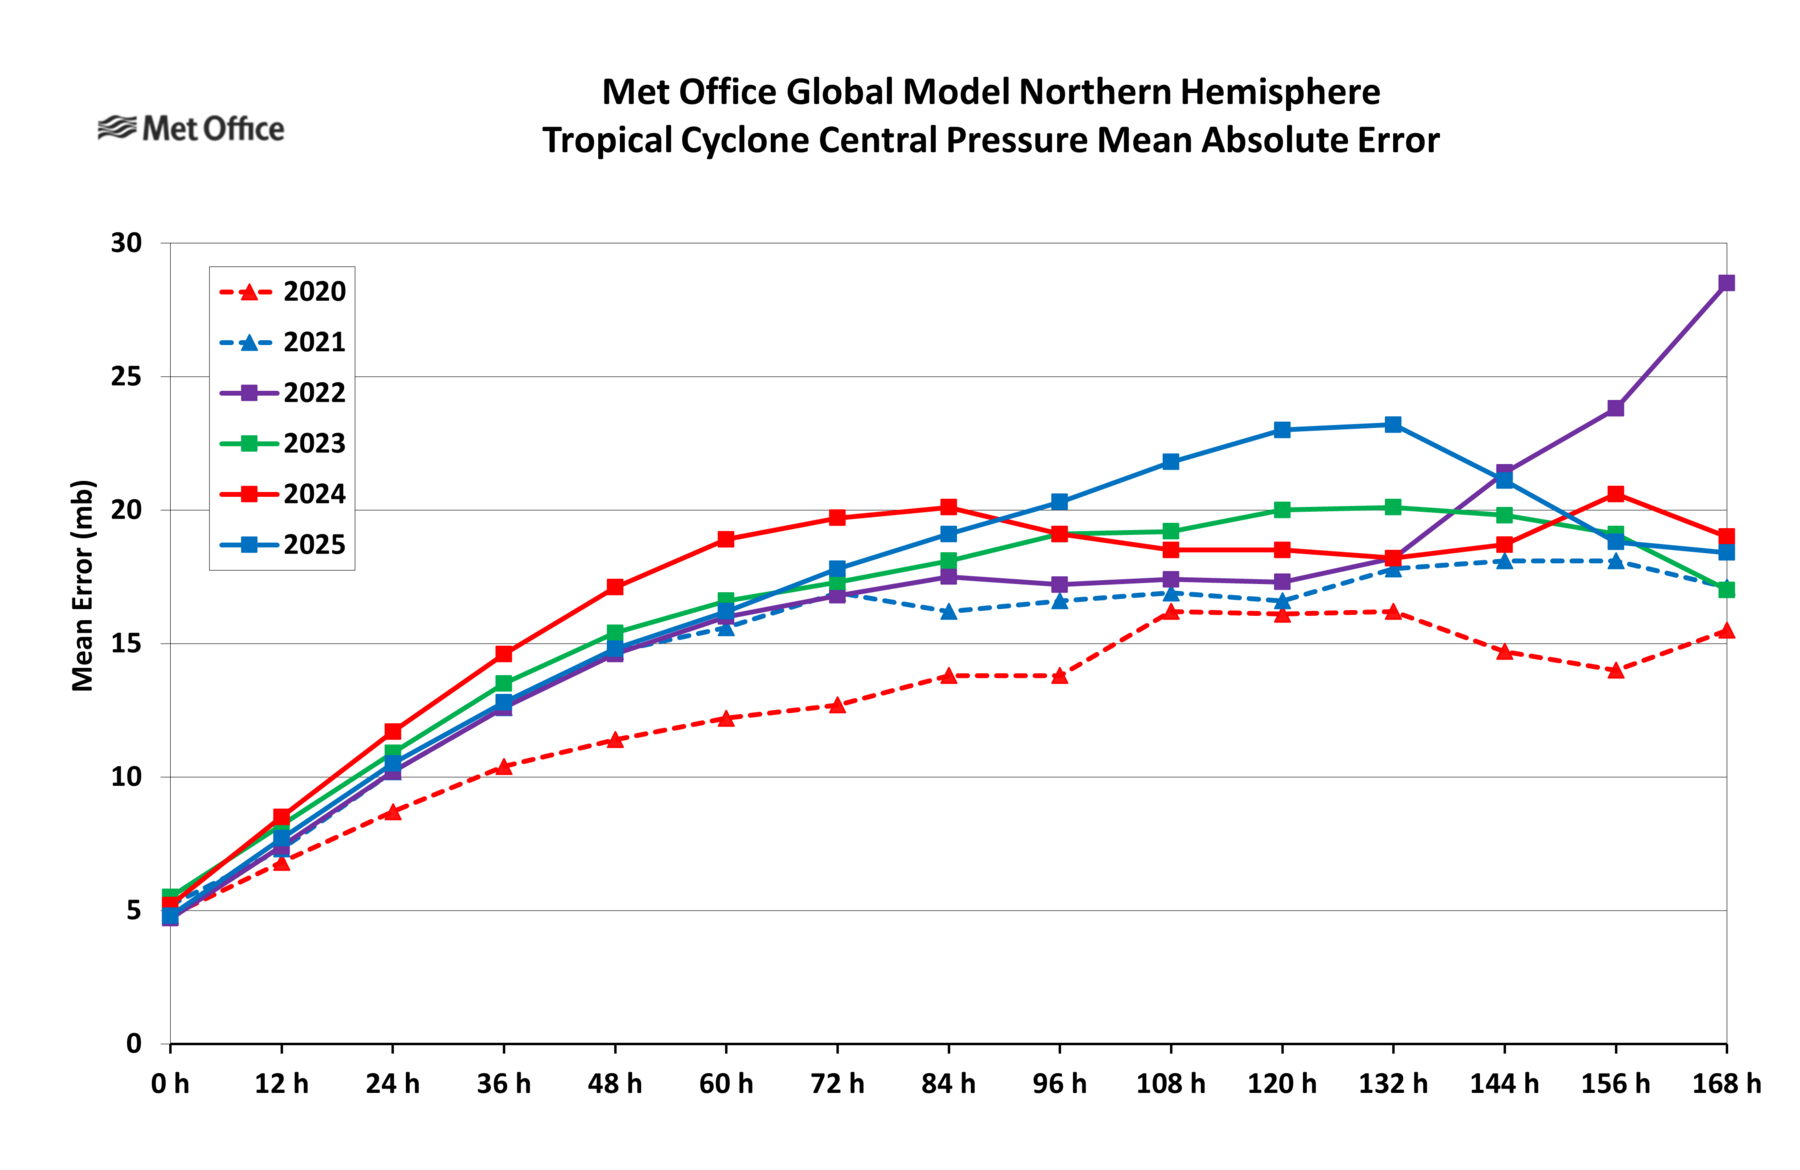
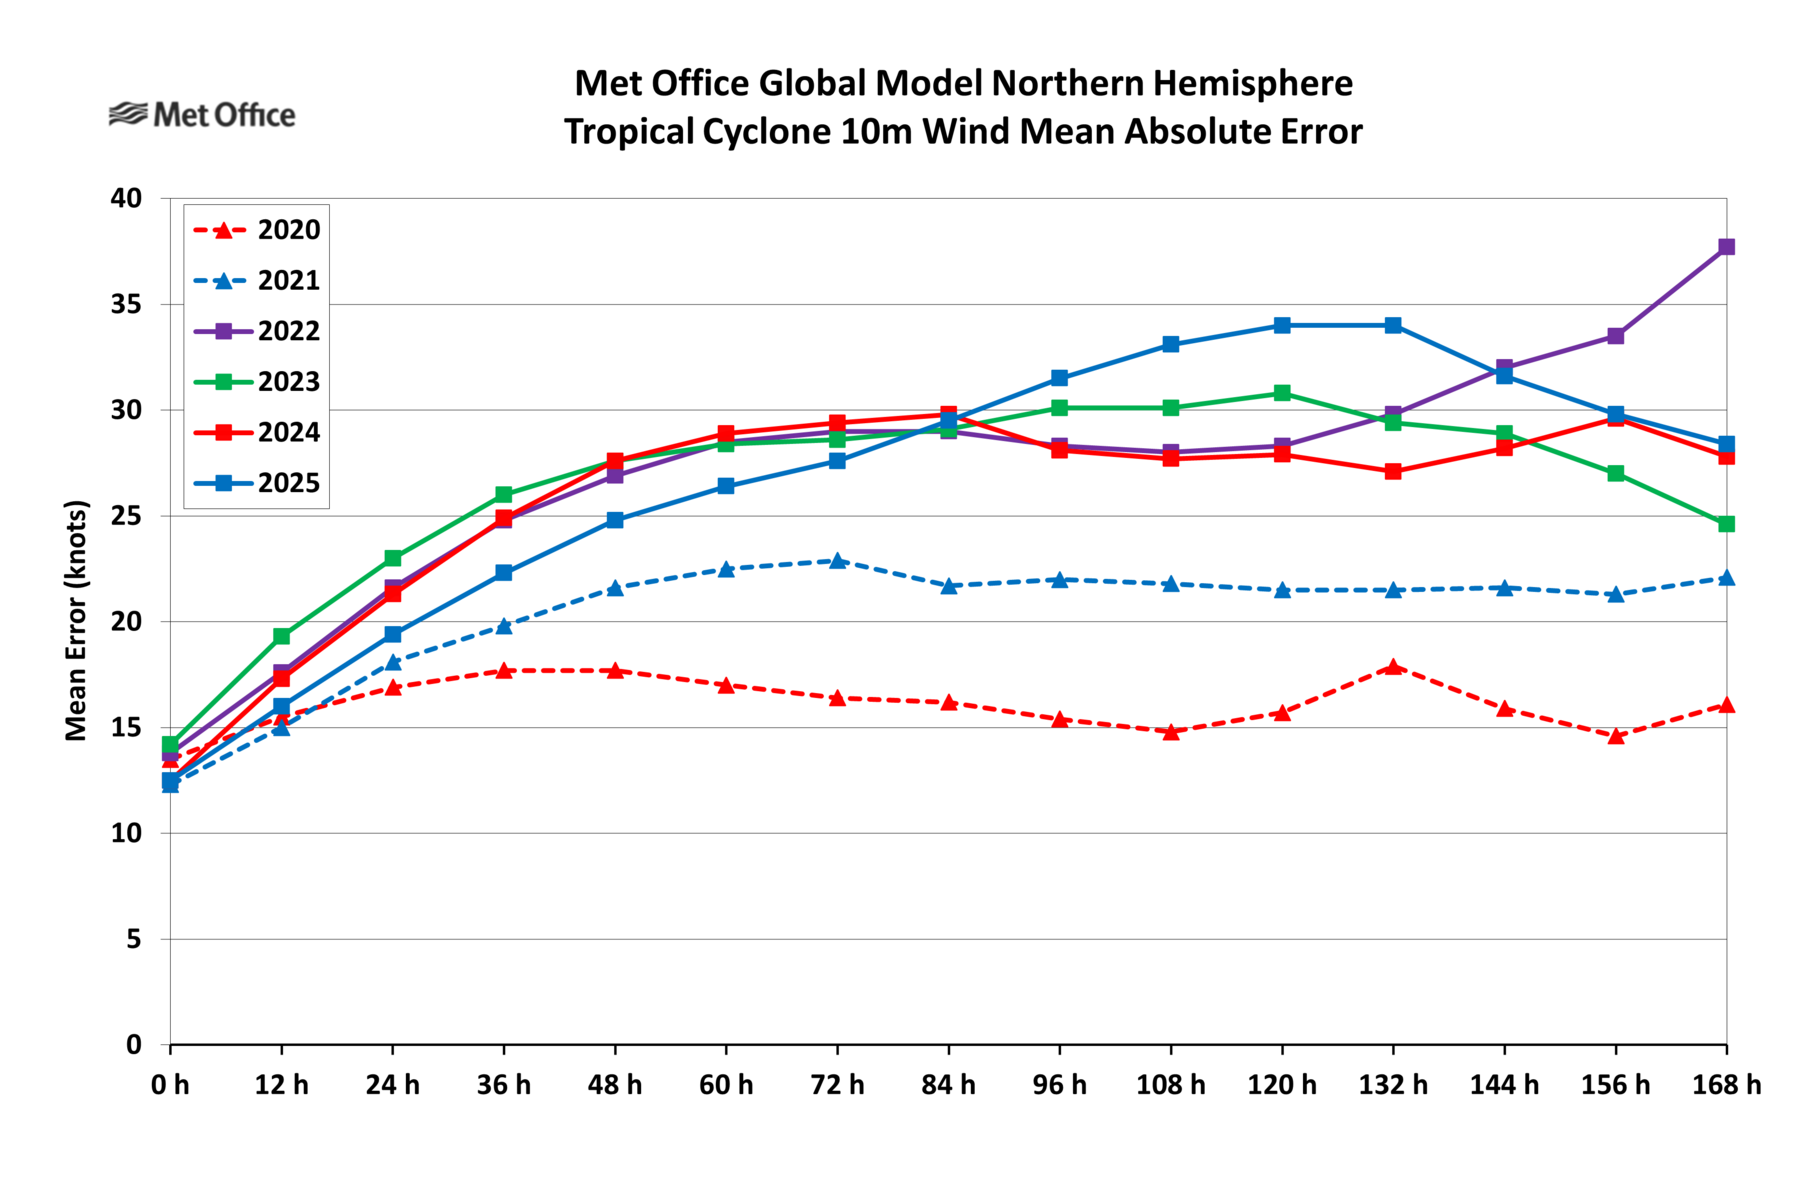
The intensity bias as measured by central pressure was positive (weak bias) and growing with lead time. It became particularly large at long lead times. Similarly 10m winds had a weak bias which increased with lead time. This is similar to what was seen in the last few years following the introduction of global model configuration GC4 in May 2022. Mean absolute errors for central pressure and 10m winds were similar to those seen in recent years.
4. Further tropical cyclone information
The Met Office tropical cyclone web pages contain information on tropical cyclone forecasting at the Met Office. Summaries of tropical cyclone observed activity and Met Office forecast track and intensity prediction errors are published at the end of each season, together with other useful information including lists of names and real-time tropical cyclone forecast guidance.
For further information on tropical cyclone forecasting email the Met Office.