Climate extremes are becoming the new ‘normal’ for the UK
“What we used to think of as extreme, we increasingly consider as normal.” That is the summarising comment from Mike Kendon, the Met Office lead author of the latest edition of the State of the UK Climate report.
The report, which covers 2025 puts the latest year and decade into a historical context, tells us about the changes already seen in the UK’s climate.
The key change in the UK’s climate is the ongoing rise in temperatures, with extremes particularly affected.
Mike Kendon, Met Office climate information scientist, said: “2025 was the UK’s warmest year on record, the sixth time this record has been broken in the 21st Century so far. The last four years are all in the top five warmest years. With warming at around 0.25°C per decade since the 1980s, it seems likely this record will be broken again in a matter of years.”
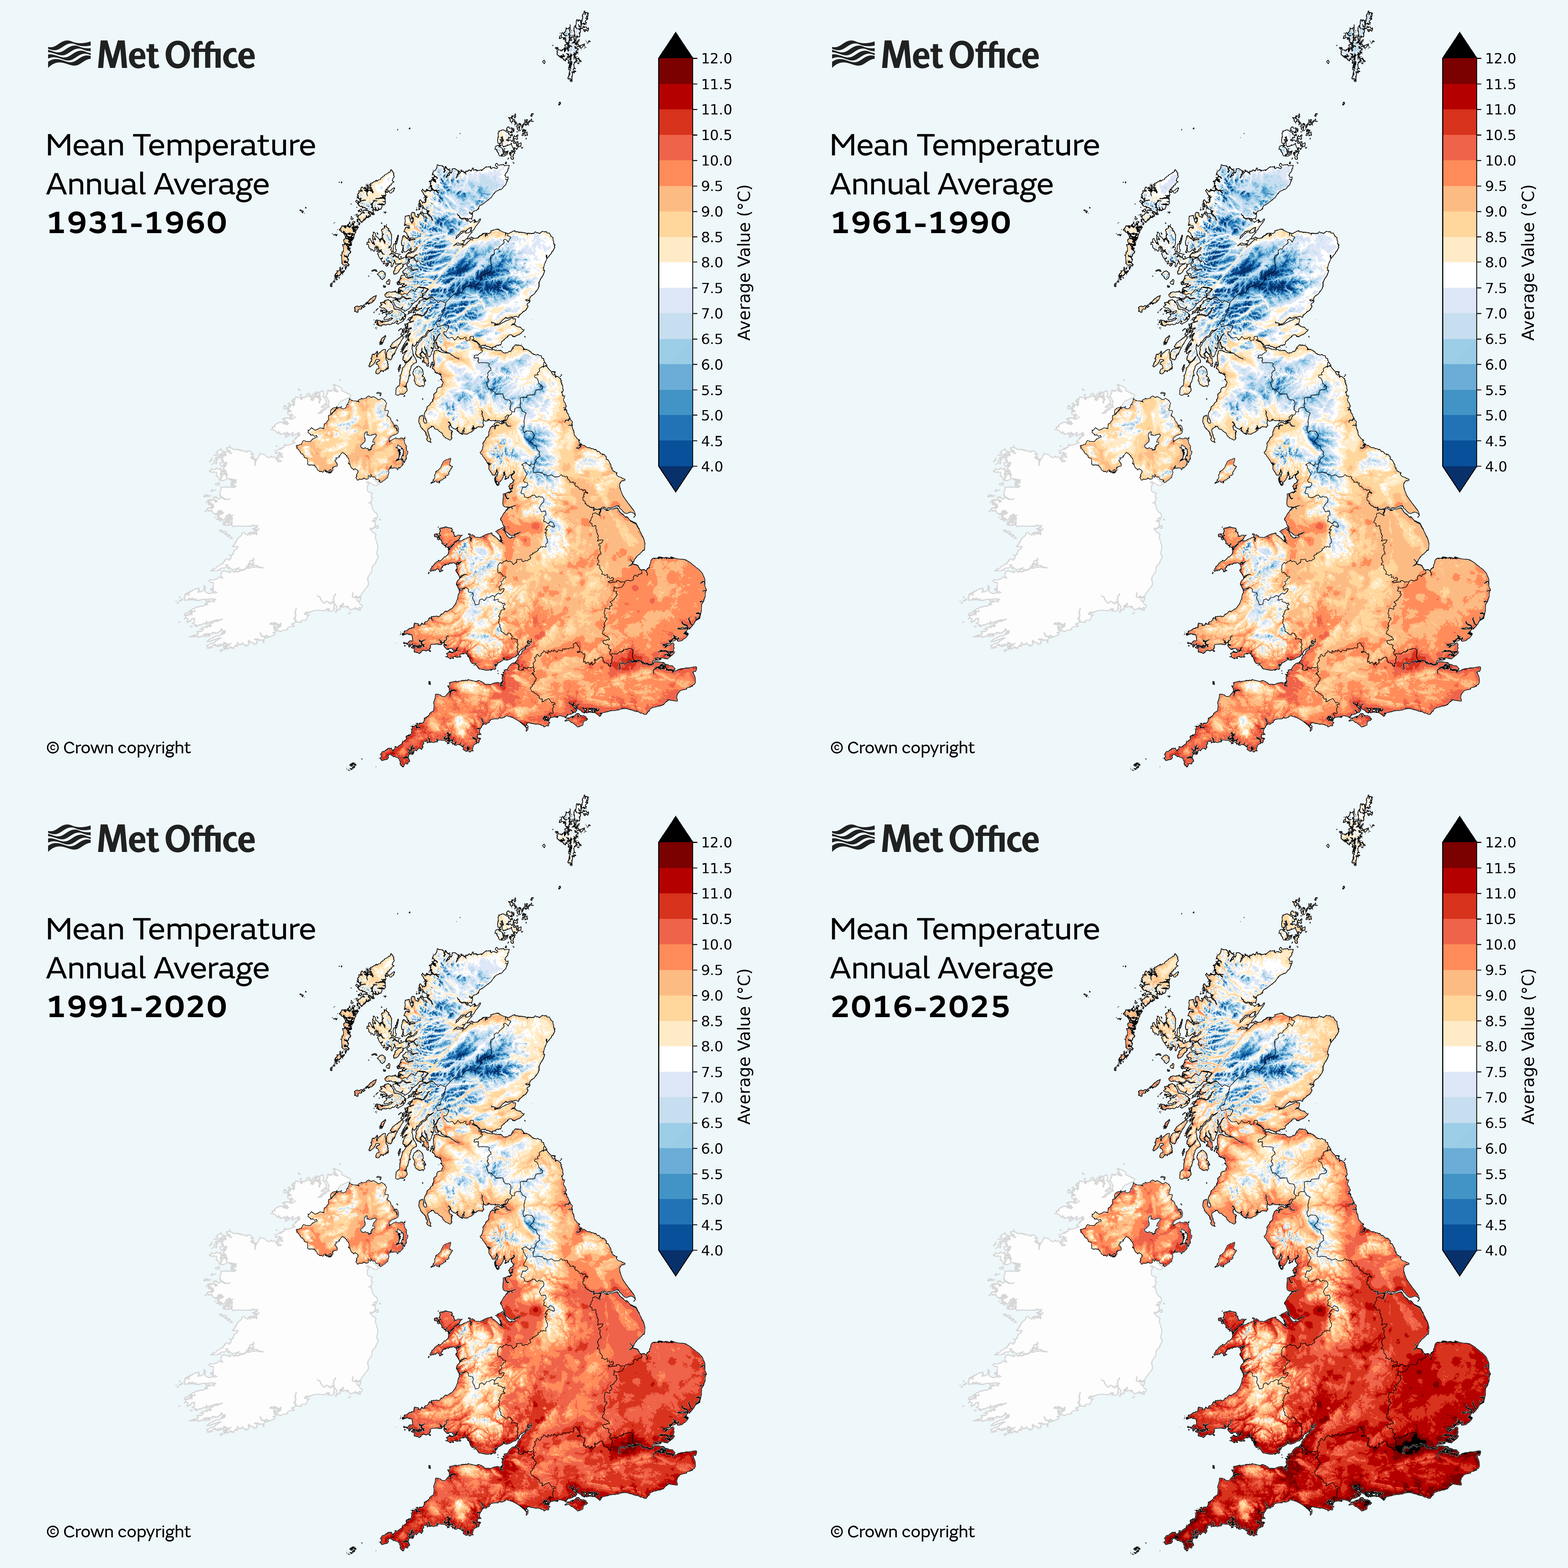
The latest 10-year period (2016-2025) is 1.33°C warmer than the period from 1961-1990.
Warming moving north and uphill
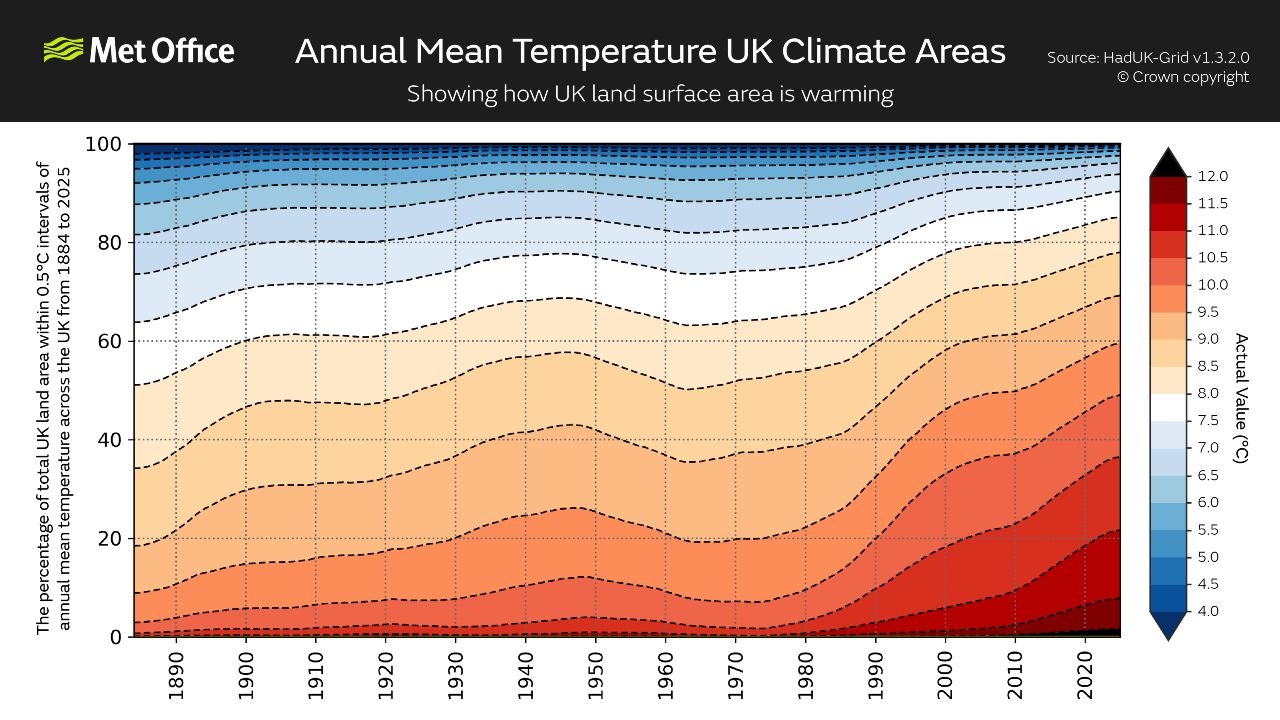
Mike Kendon added: “Think of this warming as moving north and uphill, with areas like the Vale of York and Lancashire now having similar annual temperatures to those experienced by Greater London in 1961-1990. In the south east we are seeing the emergence of new warmer climates, while in our northern upland areas we are losing the climatologically coldest habitats from the tops of our mountains. Our climate is on the move – literally. The trend shows that in the 1980s annual average temperatures of 11°C were virtually unknown in the UK yet by 2025 almost a fifth of the land surface reached that value.
“What is particularly concerning is how temperature extremes are being affected, as these cause the greatest impacts – a pattern we’ve seen again in 2026 so far. In parts of the south-east, the hottest day of the year has warmed by 4.5°C, three times that of annual mean temperature, and we are now coming to expect 35°C at some point in a hot spell in summer. Yet, despite historic heatwaves like 1976, overall temperatures as high as this were comparatively unusual in the 20th Century – back then we did not reach even 30°C, anywhere in the UK, in approximately one year in every five. As an illustration, the number of days of over 30°C has quadrupled in areas such as Greater London.”
“Every year is adding to the body of evidence showing climate change in the UK. We are right now living in a time of historic and unprecedented change and in terms of temperature, on annual, seasonal, monthly and daily timescales, this evidence shows the climate of the 20th Century has now gone.”
Key observations from 2025:
- 2025 was the warmest year in the UK series from 1884, with the last four years in the top five warmest.
- 2025 included the UK’s warmest spring and summer on record, with the six months (March to August) all in the top ten warmest of their respective monthly series.
- The most recent decade 2016 -2025, has been 0.51°C warmer than the period 1991-2020, and 1.33°C warmer than 1961-1990
- The average hottest day of the year has warmed by over 4.5°C in a swathe from Kent to Lincolnshire for the most recent decade, 2016-2025, compared to 1961-1990
- The number of days over 30°C and nights over 18°C has more than quadrupled for Greater London for the most recent decade, 2016–2025, compared to 1961–1990.
- There were 297 marine heatwave days for Northwest European seas and the Northeast Atlantic in 2025, referenced to the 1991-2020 period, more than any other year since 1982 and exceeding the previous record of 178 days in 2023
- In spring 2025, most of England and Wales received less than half of the 1991-2020 average rainfall, and in some places less than one third. England had its driest spring for over 100 years.
- The winter half-year (October to March) for the most recent decade, 2016–2025, has been 3% wetter than 1991–2020, and 13% wetter than 1961–1990, with little change for the summer half-year
- Spring and summer 2025 combined saw less than 40% of 1991–2020 average rainfall in the driest areas, but for durations longer than six months the 1976 drought was far more severe
- 2025 was the sunniest year in the UK series from 1910, with 1645 sunshine hours, 117% of the 1991-2020 average.
- Spring 2025 was the sunniest spring in the UK series from 1910 and also sunnier than all but three summers: 1976; 1995 and 1911.
Professor Liz Bentley is the Chief Executive of the Royal Meteorological Society. She said: “After the first quarter of the 21st Century, this report is an opportunity to takes stock of climate change in the UK as ‘ground truth’ from weather observations. The way we experience climate change most is through the weather extremes. Climate change has been described by scientists for many years but is now increasingly being felt by UK population in the own homes and communities.”
Hydrology
The total flow of rivers in England during March to August 2025 was the second lowest in a series from 1961, lower even than several other major summer droughts except 1976.
Any trends in low flows in the last six decades remain spatially uneven and rarely significant. In contrast, trends in high flows show a strong, coherent national increase, consistent with broader shifts towards higher winter half-year rainfall.
Lucy Barker, Senior Hydrological Analyst, UK Centre for Ecology & Hydrology: “Last year was memorable for the intense drought over the spring and summer, when we saw very low river flows across the country, as well as significant impacts on water supplies, agriculture and the environment. River flows over the spring and summer approached or were lower than other recent droughts like those in 2018 and 2022, as well as the major drought of 1976.
“Our long-term river flow records do not indicate a widespread or significant trend towards worsening droughts over the last 60 years. However, recent droughts, associated with very hot, dry summer conditions – as seen now again in 2026 – are consistent with projections towards more severe droughts in future due to climate change.”
Sea level rise
Since 1901, the sea level around the UK has risen by about 20.1 cm (likely range 16.6 to 23.6cm), but this is accelerating, with two-thirds of this rise happening over the last three decades.
Storm surges in the UK in 2025 mostly occurred on small or moderate tides, limiting their impact.
Dr. Joanne Williams, Expert in Sea-Level Extremes, at NOC said: “The most severe surges were from storms Éowyn (January), Amy (October), and Bram (December). Had Éowyn arrived a week later, coinciding with a spring tide, the estimated total sea level at Heysham, Lancashire, would have made this a 1 in 300 year event. This timing, which is purely a matter of chance, is crucial, but coastal flood risk from events like this is also made substantially worse by our rising sea levels.”
Climate and nature
Many species and processes in nature are closely linked with climate. In 2025, high seed yields from common UK trees and shrubs were likely associated with the extreme warm, dry and sunny conditions experienced between April and September.
Alex Marshall of the Woodland Trust said: “In 2025, Nature's Calendar citizen science observations showed the highest seed yields on record (since 2001) for some common UK tree and shrub species.
“Seed yields of Blackthorn, Pedunculate oak and Sessile oak in 2025 were particularly high. For oak this phenomenon is often described as a ‘mast’ year.”
“Producing this much seed comes at a real cost. Trees exhaust their reserves, leaving them weaker and more exposed to the heat and recent dry conditions we've been seeing.”