
Wet end to October pushes rainfall above average across the UK
October was wetter, warmer and sunnier than average across the UK, with two named storms contributing to a notably wet end to the month, according to provisional Met Office statistics.
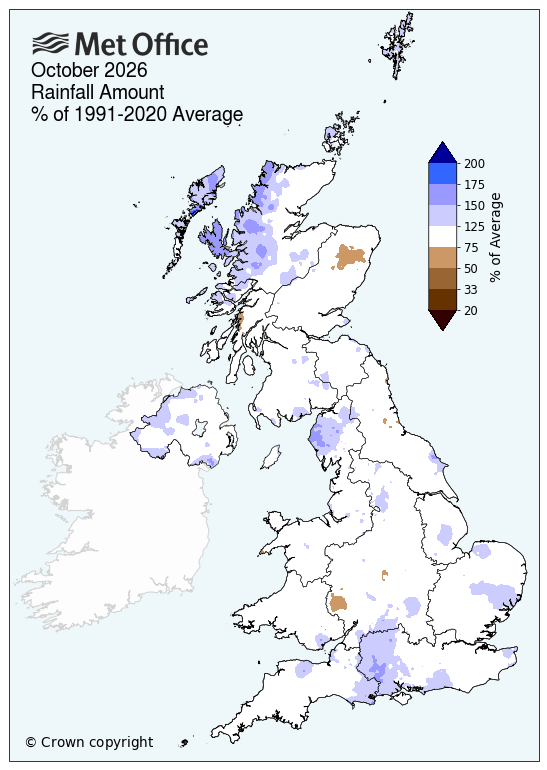
The UK received 138.9mm of rainfall during October, 13% more than its 1991-2020 average. All four UK nations recorded above-average rainfall, with northern Scotland particularly wet, seeing 31% above its October average.
England saw 12% and Wales saw 3% above its October rainfall average.
Meanwhile, Scotland saw 16% and Northern Ireland saw 19% above its October rainfall average.
Met Office Scientist Dr Emily Carlisle said:
“October saw a notable shift towards more unsettled weather, with low-pressure systems bringing repeated spells of rain through the month. Rainfall was particularly concentrated towards the end of October as Storms Austen and Storm Boelo affected the UK in quick succession.
“This resulted in above-average rainfall for the UK and all four nations. Storm Boelo was especially notable, with 24 October provisionally the joint-sixth wettest day on record for the UK and the sixth wettest for Scotland.
“October marks the ninth consecutive month with above-average mean temperatures for the UK, continuing the prolonged spell of warmer-than-average conditions seen through much of 2026.”

Despite the rainfall, drought conditions, or in some cases ‘severe drought’ continues in some areas following the prolonged dry conditions experienced through spring, summer and early autumn.
Environment Agency Chief Executive, Philip Duffy, said: “The recent rain is welcome, but the drought isn’t over. A few wet days cannot reverse months of hot, dry weather.
“Our rivers, reservoirs and groundwater need sustained rainfall to recover, and the effects on nature can last much longer.
“Everyone can help. Using a little less water, from taking shorter showers to turning off the tap while brushing your teeth, makes a difference. Saving water now will help our environment and water supplies recover.”
Another warmer-than-average month
October was warmer than average across the UK and each of the four nations.
The UK's provisional mean temperature was 10.6°C, 0.9°C above the 1991-2020 average.
The greatest temperature anomalies were generally in southern parts of the UK, while temperatures in Scotland and Northern Ireland were closer to their October averages.
The warmth was significant for some regions, with Shetland recording its joint-sixth-highest mean temperature for October.
England also provisionally recorded its joint-tenth-highest average maximum temperature for October, while Shetland saw its joint-highest average October maximum temperature since the series began in 1884, matching the record set in 1959.

UK's fifth sunniest October on record
Sunshine for October was above average across the UK and all four nations.
The UK recorded its fifth-sunniest October since records began in 1910, while England recorded its ninth sunniest.

A dry, settled week ahead
This week is set to be mostly dry with average temperatures, although a little colder in the south, and trending cooler by Friday.
Met Office Chief Forecaster Steve Willington said: “High pressure is in charge this week, with settled conditions and little in the way of rain. Though there will be some showers here and there, these will be fairly light, with some slightly heavier on Tuesday. From Wednesday, a brisk easterly airflow will make it feel chillier in the south, but elsewhere temperatures will be around normal for the time of year.”
Provisional October 2026 statistics
|
Provisional October 26 stats |
Mean temp (°C) |
Rainfall (mm/%) |
Sunshine (hours/ %) |
|||
|
|
Actual |
91/20 anomaly |
Actual |
91/20 anomaly |
Actual |
91/20 anomaly |
|
UK |
10.6 |
0.9 |
138.9 |
113 |
111.6 |
121 |
|
England |
11.7 |
1.1 |
101.5 |
112 |
127.1 |
124 |
|
Wales |
10.9 |
0.8 |
163.3 |
103 |
110.8 |
121 |
|
Scotland |
8.7 |
0.6 |
195.3 |
116 |
87.6 |
117 |
|
Northern Ireland |
10.1 |
0.5 |
135.6 |
119 |
101.3 |
119 |
Where does the monthly data come from?
The Met Office’s monthly climate statistics use HadUK‑Grid data to work out county, regional and UK‑wide averages. The dataset takes weather observations from across the country and interpolates them across the UK onto a 1km x 1km grid, covering every part of the UK. Some of these records stretch all the way back to 1836, meaning almost 200 years of weather data.
https://www.youtube.com/watch/MffwvKK1jBE?start=0