
UKCP data caveats and limitations
Key caveats and limitations that you need to be aware of before using UKCP18 results and data.
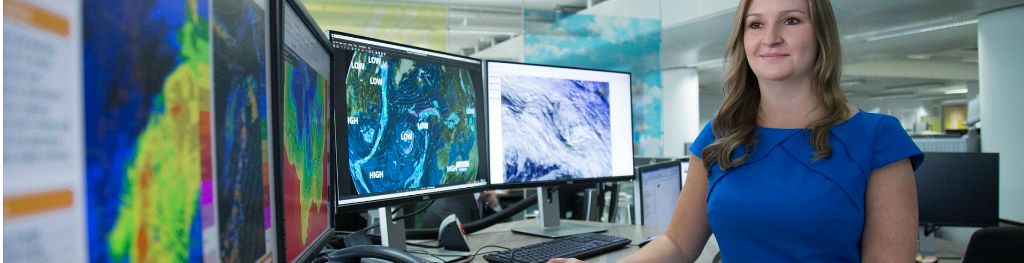
Introduction
Our understanding and ability to simulate the climate is advancing all the time but our climate models are not able to represent all of the features seen in the present day real climate and there are still limitations in our ability to project 21st century weather and climate.
All simulations of the future are conditioned on both a limited number of scenarios of future greenhouse gas emissions and the particular methodologies we employ in UKCP18. For instance, while the global projections provide a range of climate futures, they cannot cover all potential future climate outcomes. The UKCP18 climate models, like all other climate models, have limitations in their simulation of the real world.
You can find further detailed information on the caveats and limitations in the underpinning science and other user guidance available at the UKCP18 website.
Climate projections are dependent on future greenhouse gases assumptions
The change in climate projected by models in UKCP18 is strongly dependent on future global greenhouse gas emissions. UKCP18 uses scenarios for future greenhouse gases called the representative concentration pathways (RCPs) which cover a more up-to-date (compared to UKCP09) range of assumptions around future population, economic development and to explicitly include the possibility of mitigation of greenhouse gas emissions towards international targets. Each pathway drives a different range of simulated global mean temperature increases over the 21st century. The RCP pathways lead to a broad range of climate outcomes but are neither forecasts nor policy recommendations.
The four RCPs considered in UKCP18 attempt to capture a range of potential alternative futures, spanning a range of outcomes, further guidance is available on the UKCP18 website. The real world may follow a different pathway altogether. The scientific community cannot reliably place probabilities on which scenario of greenhouse gas emissions is most likely.
See Box 1 in UKCP18 Science Overview (Lowe et al, 2018) available on our Science reports page, for further guidance
Estimated ranges for future climate are conditional
As with all climate modelling, the estimated ranges for future climate are conditioned on a set of modelling, statistical, and dataset choice assumptions with expert judgement playing a role in the various methodological and data choices. As the science evolves some of these preferred choices will also change, which will lead to new estimates of uncertainty. At this time, the UKCP18 project team believe the UKCP18 ranges best capture our understanding of potential future outcomes.
The probabilistic projections adopt a particular set of methods including an approach to emulating climate models, treatment of structural uncertainty and use of a particular simple energy balance climate model. The approach also downscales results to the 25km scale using a statistical approach based on a global model-regional model pairing from a single model structure. Each stage of the method has many assumptions and relies on expert judgement. See section 2.2 of UKCP18 Land Projections: Science Report, (Murphy et al, 2018) available on our Science reports page.
For RCP8.5, it is clear that the PPE-15 models tend to sample the warmer end of the future response range projected by the probabilistic approach and CMIP5-13 models sample the mid-range and colder end – with some limited overlap in the middle. This is consistent with recent research into a HADGEM3 model version (GC3.1), to which the UKCP18 GC3.05 versions of the model are closely related, having an equilibrium climate sensitivity (ECS)1 above the likely end of the current IPCC range, and higher than the CMIP5 set of models. In the IPCC’s 5th Assessment, ECS was judged to have a “likely” range of 1.5-4.5°C (Collins et al, 2013), and that there is a small probability (of up to 10%) that ECS exceeds 6°C.
The 2°C and 4°C worlds from the Derived Projections offer an alternative approach that does not depend on the equilibrium climate sensitivity. However, they come with their own limitations (see Section 9).
UKCP18 does not capture all possible future outcomes
We have designed the probabilistic projections to provide the primary tool for assessments of the ranges of uncertainties in UKCP18. However, they may not capture all possible future outcomes.
The set of global and UK future climates has limited sizes and whilst it does cover a range of futures (with the Met Office set of global models providing the higher end of future global temperatures), it cannot simulate every possible future climate. This is especially true of the regional model (and consequently the convection-permitting model used in the local (2.2km) projections) which is not driven by any climate model simulations that fed into IPCC AR5 (i.e. CMIP5 climate models). Neither the set based on global models, or that based on regional and convection-permitting models have been designed to support estimates of the relative likelihood of alternative outcomes within their ranges of response, nor have they been constructed to replicate the probabilistic projections.
The 21st century surge and wave projections are based upon relatively small set of CMIP5 models. It is unlikely that these simulations span the full range of CMIP5 model responses under climate change. In particular, these projections should be viewed as indicative of the overall magnitude of changes we might see over the 21st Century. For both the surge and wave projections, we are unable to quantify the relative influence of the climate change signal and natural variability on the simulated changes over the 21st Century.
How to use the UKCP18 probabilistic projections and what they represent
The future probabilistic projections in UKCP18 are an update of those produced for UKCP09. You should interpret the probabilities as being an indication of how much the evidence from models and observations taken together in our methodology support a particular future climate outcome.
The relative probabilities indicate how strongly the evidence from models and observations, taken together in our methodology, support alternative future climate outcomes. There is more evidence for outcomes near the centre of the distribution than in the tails, so we see unimodal (single-peaked) distributions. In these, the relative probabilities for specific outcomes are typically much higher near the 50% cumulative probability level (median) of the distribution, than for outcomes lying either below the 10% cumulative probability level or above the 90% cumulative probability level.
As mentioned above, the probabilities are conditioned on methodological choices and expert judgement. The results may change if a different methodology is used. See sections 2 and 4.1 of UKCP18 Guidance: How To Use The Land Projections.
Climate model data contain biases
Global climate models provide greater confidence for long-term climate averages than extreme events or time series of daily or sub-daily values. All climate models exhibit systematic differences between model results and observations and you need to consider whether to modify the datasets to correct for these. This is called bias-correction and is a popular approach used by many researchers and climate data users. Take care when applying these methods, as debatable assumptions are often required and bias-correction may not be appropriate. We present four common bias-correction methods, summarising what they are, their advantages and disadvantages and examples of their use. The choice of method, if any at all, will depend on your particular application. Note that if the climate model projections show very large biases in the variable of interest, then you should consider excluding it from your analysis.
See UKCP18 Guidance: How to Bias-Correct. For further information on using the global, regional and derived projections see UKCP18 Guidance: How To Use The Land Projections and for the local (2.2km) projections, see UKCP Factsheet: Local (2.2km) Projections.
Finer model resolution does not necessarily provide greater confidence
Downscaling – the process of generating model data at higher spatial and/or temporal resolution – adds detail but also increases the level of uncertainty. The additional information content can be useful for applications that wish to understand how small-scale features such as mountains and coastlines or land surface features may influence the local climate and their system of interest. However, finer model spatial resolution does not necessarily provide greater confidence in modelling the climate system unless it has been shown to give a better representation of the underlying physical processes. See UKCP18 Guidance: How to Use the Land Projections and UKCP Factsheet: Local (2.2km) Projections
We cannot rule out substantial additional sea level rise
The UKCP18 21st Century time-mean sea level projections follow approaches similar to those used in the IPCC 5th assessment and have the following limitations:
- The best expert judgement is that the 5-95th percentile ranges cover only the 2/3 “likely range”. We advise augmenting this information with other strands of evidence, such as the UKCP09 H++ scenarios which are an estimate of the low probability, high impact range for sea level rise around the UK to 2100 (see Lowe et al, 2009).
- We cannot rule out substantially larger rates of sea level rise over the 21st Century associated with the potential for accelerated loss of ice from the West Antarctic Ice Sheet.
- For any given geographic location, there may be other vertical land motion processes at play that are important when carrying out coastal risk/impacts assessments. We have lower confidence in some products.
We have different levels of confidence for different products
Additional caveats and limitations come with:
- Derived projections.
- Extended exploratory time-mean sea level projections.
- Tide and surge simulations.
The derived projections over UK land areas use approximate methods to produce an estimate of RCP2.6 and global warming levels of 2 and 4°C (compared to pre-industrial). This introduces additional uncertainties. One of the major assumptions is that we can use the climate model time series that reach particular warming levels through the 21st century (transient) to inform a future that has reached a steady warming level (stabilized). There is some evidence that future climate outcomes at a particular global warming level can differ depending on whether that warming level is transient or stabilized (e.g. Ceppi et al, 2018). See UKCP18 Derived Scenarios Report (Gohar et al, 2018).
The extended exploratory time-mean sea level projections have much lower confidence than the 21st Century Projections. Consider these projections as sensitivity studies and do not interpret them as showing the full range of post-2100 behaviour, or the most likely behaviour. The potential for additional sea level rise from Antarctic dynamic ice discharge is even more uncertain on these time horizons, with some studies suggesting several additional metres of rise by 2300 under RCP8.5.
The simulations of changes in tide and surge characteristics make the simple assumption of a fixed coastline under all levels of future sea level rise.
Take care when comparing/combining variables
When carrying out analyses that consider more than one variable, ensure that any outcomes are consistent and coherent in their representation of the changes. For the probabilistic projections, there is no spatial coherence. For the global, regional, local and derived projections ensure that you choose variables from the same member of the set of projections. For example, summer temperature from one member is unlikely to be consistent with precipitation from another.
Choosing a model based on being amongst the largest of the probabilistic climate changes in summer does not necessarily translate into the same model being in such an extreme position in the winter change results.
Climate projections are likely to evolve
As our understanding of the climate system and our ability to model it improves, and as computing power increases, it is likely that future projections will be refined. A consequence of these expected improvements is that both the model projections and probability distribution for a given outcome are likely to evolve in the future. This is not a reason for delaying carrying out a risk assessment but may impact on the actions taken to build resilience.
This document is citable as Fung F, Lowe J, Mitchell JFB, Murphy J, Bernie D, Gohar L, Harris G, Howard T, Kendon E, Maisey P, Palmer M and Sexton D (2018). UKCP18 Guidance: Caveats and Limitations. Met Office Hadley Centre, Exeter.
References
- Ceppi P, Zappa G and Shepherd T (2018). Fast and Slow Components of the Extratropical Atmospheric Circulation Response to CO2 Forcing, Journal of Climate, DOI: 10.1175/JCLI-D-17-0323.1.
- Gohar G, Bernie D, Good P and Lowe JA, 2018. UKCP18 Derived Projections of Future Climate over the UK, Met Office.
- Lowe JA, Howard TP, Pardaens A, Tinker J, Holt J, Wakelin S, Milne G, Leake J, Wolf J, Horsburgh K, Reeder T, Jenkins G, Ridley J, Dye S, Bradley S. 2009. UK Climate Projections science report: Marine and coastal projections. Met Office Hadley Centre, Exeter, UK.
- Lowe JA, Bernie D, Bett PE, Bricheno L, Brown S, Calvert D, Clark RT, Eagle KE, Edwards T, Fosser G, Fung F, Gohar L, Good P, Gregory J, Harris GR, Howard T, Kaye N, Kendon EJ, Krijnen J, Maisey P, McDonald RE, McInnes RN, McSweeney CF, Mitchell JFB, Murphy JM, Palmer M, Roberts C, Rostron JW, Sexton DMH, Thornton HE, Tinker J, Tucker S, Yamazaki K, and Belcher S (2018). UKCP18 Science Overview report. Met Office.
- Murphy JM, Harris GR, Sexton DMH, Kendon EJ, Bett PE, Clark RT, Eagle KE, Fosser G, Fung F, Lowe J, McDonald RE, McInnes RN, McSweeney CF, Mitchell JFB, Rostron JW, Thornton HE, Tucker S and Yamazaki K, 2018. UKCP18 Land Projections: Science Report. Met Office.
Footnotes
1ECS is an important characteristic of climate models is the amount of warming that can be expected in response to the concentration of carbon dioxide in the atmosphere reaching double the level observed in pre-industrial times. However, potential users should note that the projected response over the UK has a wider spread in both GC3.05 and CMIP5 projection sets and the degree of overlap of the sets is greater.