
Briefing on Arctic and Antarctic sea ice - June 2018
Current Arctic sea ice extent
Arctic sea ice extent on 10th June 2018 was 10.95 million square km according to data from the US National Snow and Ice Data Center (NSIDC). This is the second lowest value for this date on record, after 10.78 million square km in 2016, and is 1.12 million square km below the 1981-2010 average
(Figure 1)
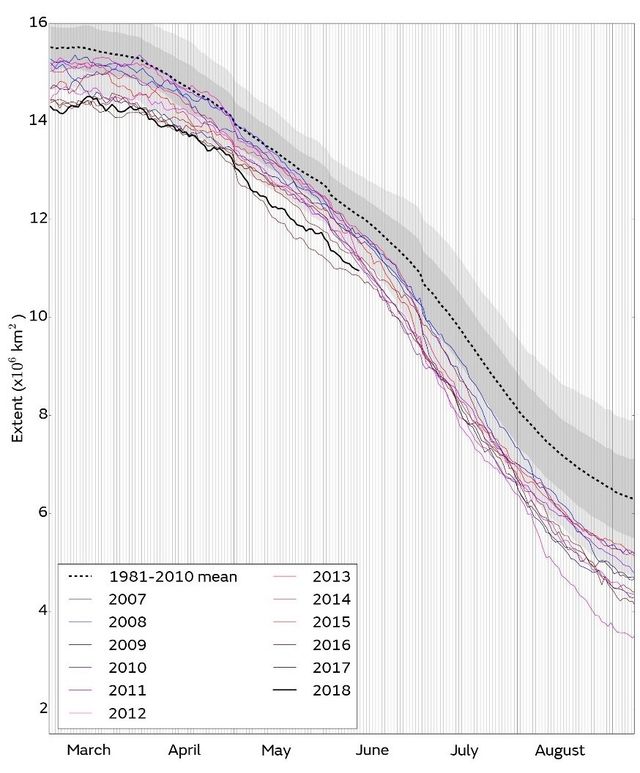
Figure 1. Daily Arctic sea ice extent for 2018, compared with recent years and the 1981-2010 average with ± 1 and 2 standard deviation intervals indicated by the shaded areas. Data are from the National Snow and Ice Data Center (NSIDC).
Extent was well below average in the Barents, Chukchi and Laptev seas of the Arctic Ocean (Figure 2), with summer sea ice melt in these areas having commenced unusually early. In the subarctic seas, extent was well below average in the Greenland Sea and near average in Baffin Bay.
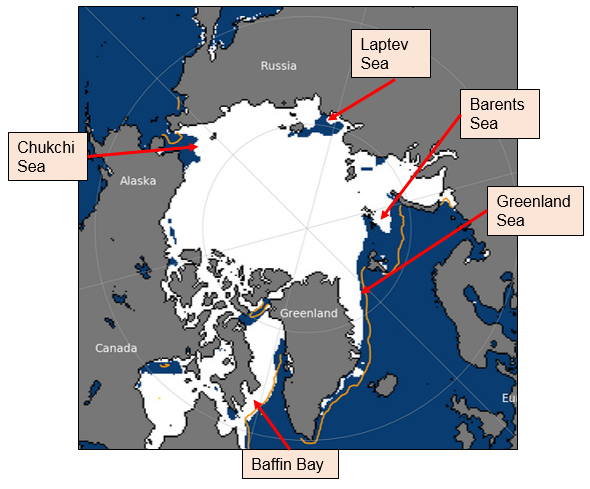
Figure 2. Arctic sea ice extent on 10th June 2018, with 1981-2010 average extent indicated in orange, and the regions referred to in the text labelled. Underlying map and data courtesy of NSIDC.
May 2018 in context
Average sea ice extent for the month of May 2018 was 12.30 million square km according to the HadISST1.2 dataset (Rayner et al., 2003), the second lowest on record after 11.90 million square km in 2016. This is 1.06 million square km below the 1981-2010 average, and 0.38 million square km below the long-term linear trend (Figure 3).
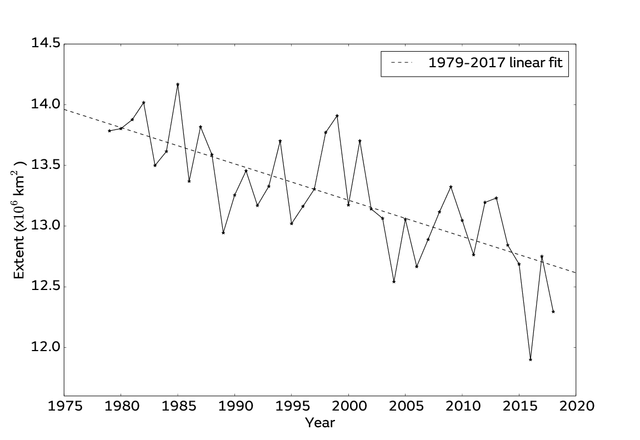
Figure 3. Average May Arctic sea ice extent according to the Hadley Centre Sea Ice and Sea Surface Temperature (HadISST) 1.2 dataset (Rayner et al, 2003).
The average rate of sea ice loss during May was 54,000 square km per day, somewhat above the 1981-2010 average of 47,000 square km per day.
Winter review, sea ice thickness and outlook for September
Winter 2017-2018 was extremely mild over the Arctic Ocean, associated with enhanced transport of mild, moist air from midlatitudes (Figure 4a) driven by higher than average atmospheric pressure (Figure 4b), and a weak polar vortex. As during the two preceding winters, brief spells of exceptional mildness occurred in association with strong southerly flow, with above-freezing temperatures measured on the north coast of Greenland at the end of February. The Bering Sea was particularly mild and stormy relative to average, with exceptionally low sea ice conditions throughout the winter.
 |
 |
Figure 4. (a) Surface air temperature anomaly; (b) mean sea level pressure anomaly relative to the 1981-2010 average for November 2017 – March 2018. Data are from the NCEP reanalysis.
The past three winters have all been notably mild in the Arctic (Figure 5). A recent study by Stroeve et al. (2018) found that the persistent mildness was likely to be greatly reducing winter sea ice growth, preventing the ice from recovering from the more extensive summer melt that has been observed over the past decade. Estimates of sea ice thickness from the CryoSat-2 satellite over the month of May, produced by the Centre for Polar Observation and Monitoring (CPOM), show large areas of ice of thickness below 2m across the Pacific sector of the Arctic Ocean (Figure 6), a level below which sea ice has been shown to be very likely to melt completely during summer (Keen et al., 2013).
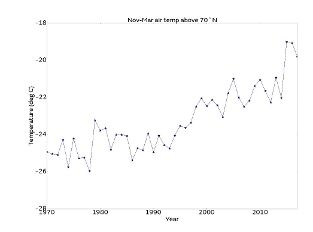
Figure 5. Average November-March surface air temperature for the region north of 70°N from 1970-present, according to the NCEP reanalysis.
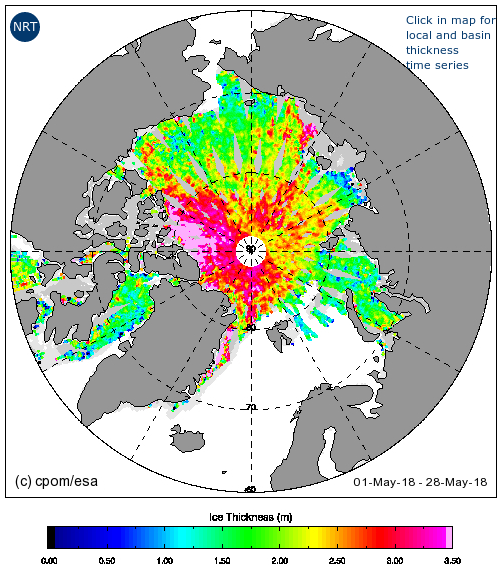
Figure 6. Average Arctic sea ice thickness from 1st – 28th May 2018, as estimated from satellite radar altimetry measurement from CryoSat-2. Courtesy of the Centre for Polar Observation and Modelling (Tilling et al., 2016).
There is no significant correlation between ice extent in mid-June and the seasonal minimum extent in September. While the apparent extent of relatively thin ice suggests that the sea ice cover is again very vulnerable to melting, the severity of summer melt is still very dependent on Arctic weather conditions. Hence it is not possible to predict September sea ice extent with any confidence at this point in the season.
Antarctic sea ice state
Antarctic sea ice extent on 10th June was 12.26 million square km (Figure 7). This is 0.55 million square km below the 1981-2010 average, and 0.56 million square km above the lowest value for this date, which occurred in 2002. Extent was particularly low relative to average in the Weddell Sea (Figure 8).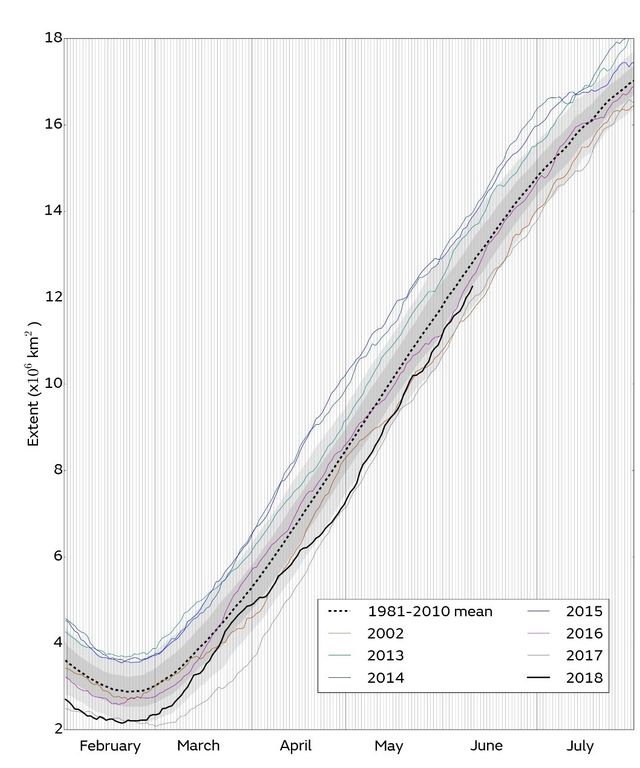
Figure 7. Daily Antarctic sea ice extent for 2018, compared with recent years, the low ice year of 2002, and the 1981-2010 average, with ± 1 and 2 standard deviation intervals indicated by the shaded areas. Data are from NSIDC.
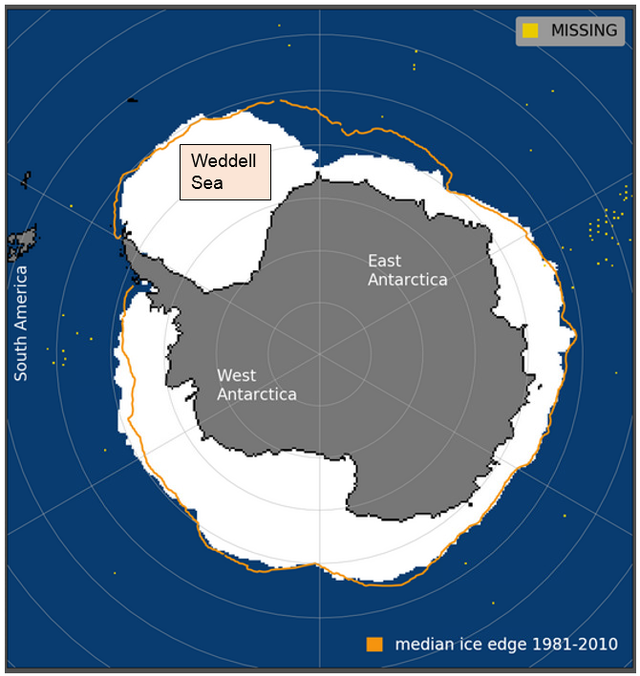
Figure 8. Antarctic sea ice extent on 10th June 2018, with 1981-2010 average extent indicated in orange, and regions referred to in the text labelled. Underlying map and data courtesy of NSIDC.
References
Keen, A. B., Hewitt, H. T., and Ridley, J. K.: A case study of a modelled episode of low Arctic sea ice. Climate Dynamics, 41, 5, 1229–1244. doi: 10.1007/s00382-013-1679-y, 2013.
Rayner, N. A.; Parker, D. E.; Horton, E. B.; Folland, C. K.; Alexander, L. V.; Rowell, D. P.; Kent, E. C. and Kaplan, A.: Global analyses of sea surface temperature, sea ice, and night marine air temperature since the late nineteenth century. J. Geophys. Res. Vol. 108, No. D14, 4407 10.1029/2002JD002670, 2003.
Stroeve, J. C.; Schroeder, D., Tsamados, M. and Feltham, D.: Warm winter, thin ice? The Cryosphere, 12, 1791-1809, doi: 10.5194/tc-12-1791-2018, 2018.
11th June 2018, Alex West and Ed Blockley