
Briefing on Arctic and Antarctic sea ice - June 2026
Alex West and Ed Blockley
Summary
- Arctic sea ice extent is currently 5th lowest on record for the date, at 11.18 million sq km on 10th June. Melting has begun early across the Arctic marginal seas, and extent is particularly low along the Atlantic sea ice edge
- The maximum Arctic sea ice extent of the winter, recorded on 7th March, was the lowest on record; average March Arctic sea ice extent was also the lowest on record for the month
- During the Arctic winter of 2025-26, atmospheric patterns directed warm air towards the Atlantic sea ice edge on one side of the Arctic, and the East Siberian Sea on the other side
- Satellite measurements show very low ice thickness in the Atlantic sector of the Arctic, but near- or above average thickness elsewhere
- Predictions of September Arctic sea ice extent cannot be made with confidence at this point in the season
- In a change from recent years, Antarctic sea ice extent in February was near-average
- Antarctic sea ice growth has been slower than average since March, and Antarctic sea ice extent is currently 8th lowest on record for the date
Arctic
Sea ice state
Arctic sea ice extent on 10th June was 11.18 million sq km according to the OSI SAF Sea Ice Index (Lavergne et al., 2023). This was the 5th lowest extent on record for this date, the lowest having been 11.00 million sq km, recorded in 2016. It was 0.97 million sq km below the 1981-2010 average (Figure 1).
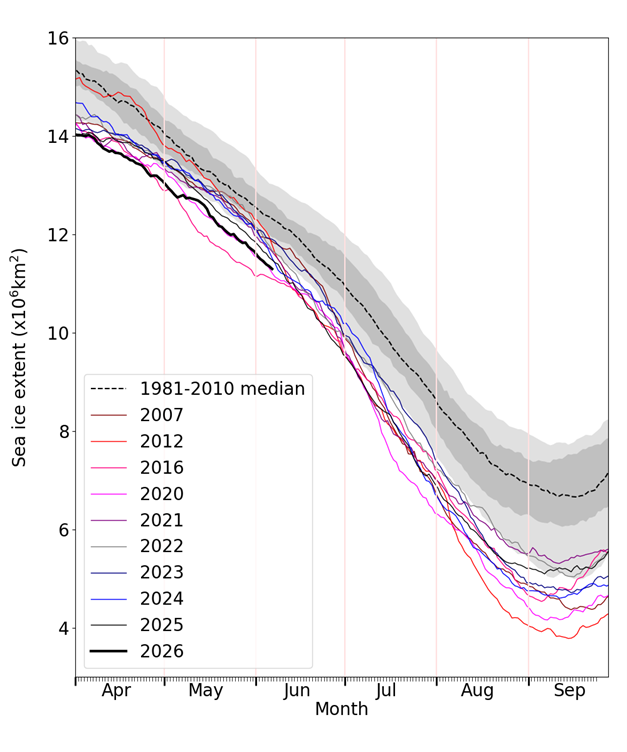
Figure 1. Daily Arctic sea ice extent for 2026, compared with recent years, other years with notably low ice extent, and the 1981-2010 average with interquartile and interdecile ranges shown by the shaded areas. Data are from the OSI SAF Sea Ice Index (Lavergne et al., 2023).
Extent was well below average all along the Atlantic sea ice edge, and exceptionally so in the Barents Sea. In addition, extent was below average across all marginal seas of the Arctic Ocean, ice retreat having begun earlier than average in all areas (Figure 2).
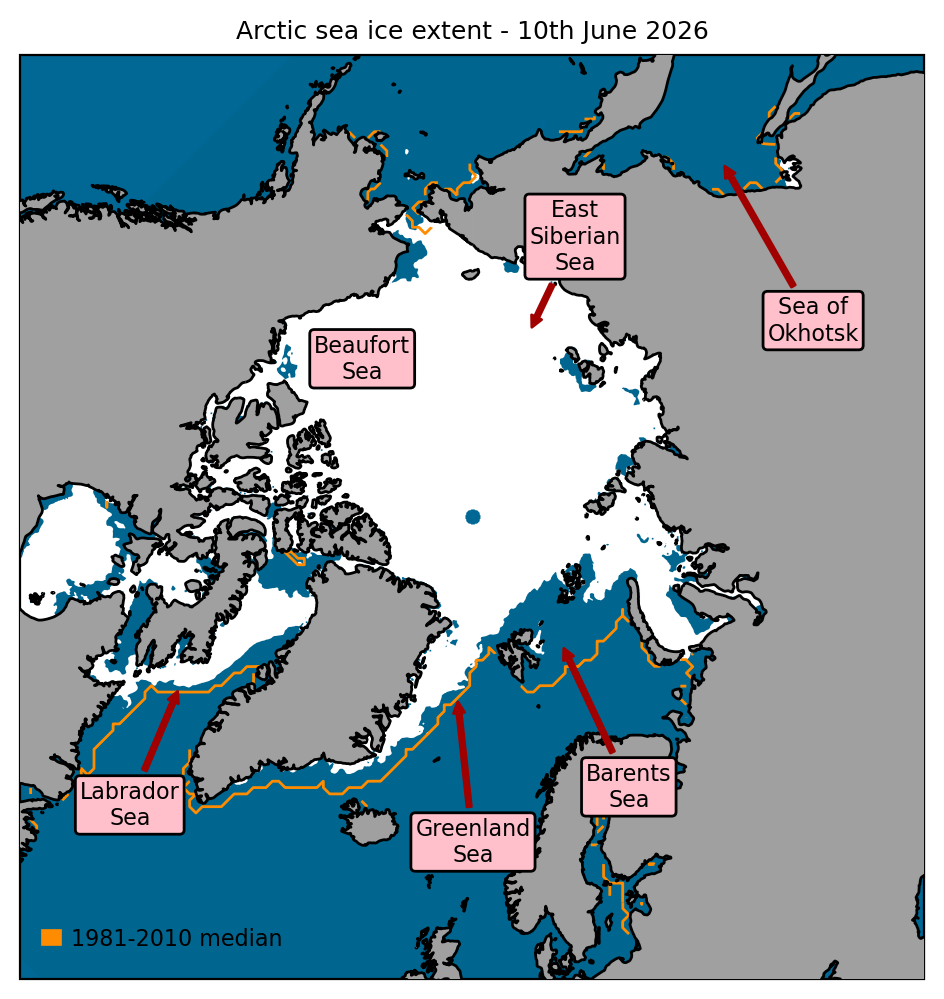
Figure 2. Arctic sea ice extent on 10th June 2026, with 1981-2010 average extent indicated in orange, and the regions referred to in the text labelled. Data are from EUMETSAT OSI SAF (Tonboe et al., 2017).
Winter and spring review
As is usual for recent years, the Arctic winter was much warmer than the 1981-2010 average (Figure 3). The winter temperature, here measured as the average November-March temperature at the 925hPa level in the atmosphere above 70°N, was on average 2.3 °C warmer than the 1981-2010 average according to the ERA5 reanalysis (Hersbach et al., 2017). Temperature anomalies were highest over the Central Arctic and the eastern Siberian coastal seas (Figure 4a), exceeding +5°C in the region north of Greenland, but were near or below-average in the Beaufort Sea north of Alaska. This pattern was due to persistent winter high pressure areas, which often stretched from Greenland and the Nordic Seas across the Siberian Arctic into East Siberia, directing warm southerly winds into the East Siberian Sea and the Atlantic sector of the Arctic but cold northerlies into the Beaufort Sea (Figure 4b).
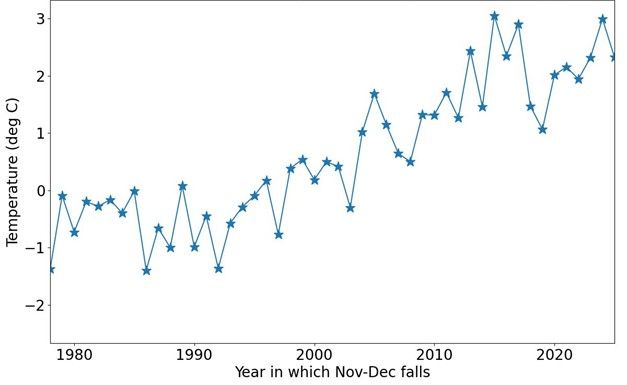
Figure 3. Average temperature anomaly at 925hPa above 70°N from November-March, according to the ERA5 reanalysis (Hersbach et al., 2017). Anomaly is relative to the 1981-2010 average.
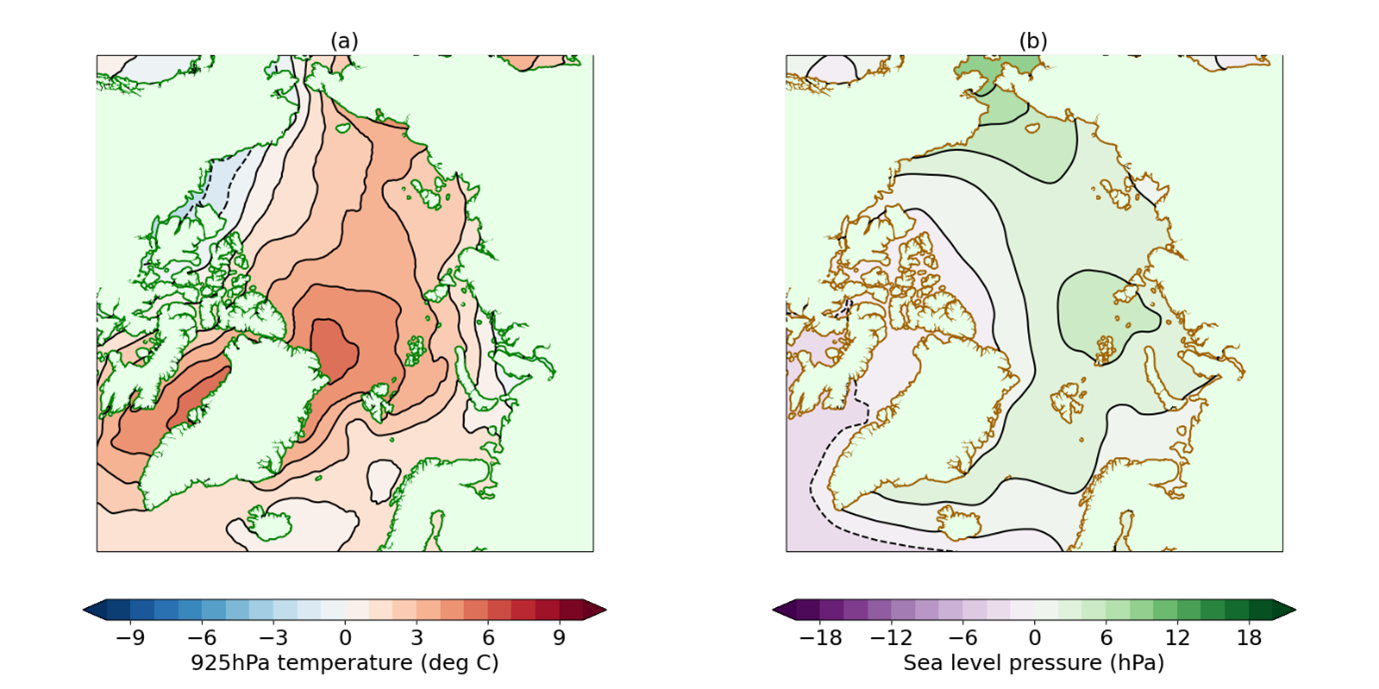
Figure 4. Anomaly in (a) 925hPa temperature; (b) mean sea level pressure for November 2025-March 2026 relative to the 1981-2010 average. Data are from the ERA5 reanalysis.
Arctic sea ice extent for March 2026 was the lowest on record for the month at 14.17 million sq km, narrowly below the previous year at 14.18 million sq km, and well below the 1981-2010 March average of 15.43 million sq km. Extent for the month was particularly low all along the Atlantic Ocean sea ice edge (in the Labrador Sea, the Greenland Sea and the Barents Sea). Extent was also exceptionally low in the Sea of Okhotsk. In the Bering Sea, however, extent was near- or above-average. The daily maximum Arctic sea ice extent of 2026, recorded on 7th March, was also the lowest on record at 14.34 million sq km, compared to an average 1981-2010 maximum sea ice extent of 15.65 million sq km.
Measurements of sea ice thickness are taken by a radar altimeter aboard the CryoSat-2 satellite (Tilling et al, 2018) in all except the summer months. In March 2026, CryoSat-2 suggests that ice thickness was well below the long-term (2011-2025) average in a region stretching along the north of Greenland and Svalbard, but was near- or above-average elsewhere (Figure 5). Hence while ice extent at the end of winter was certainly exceptionally low, it is less clear that this was the case for ice volume.
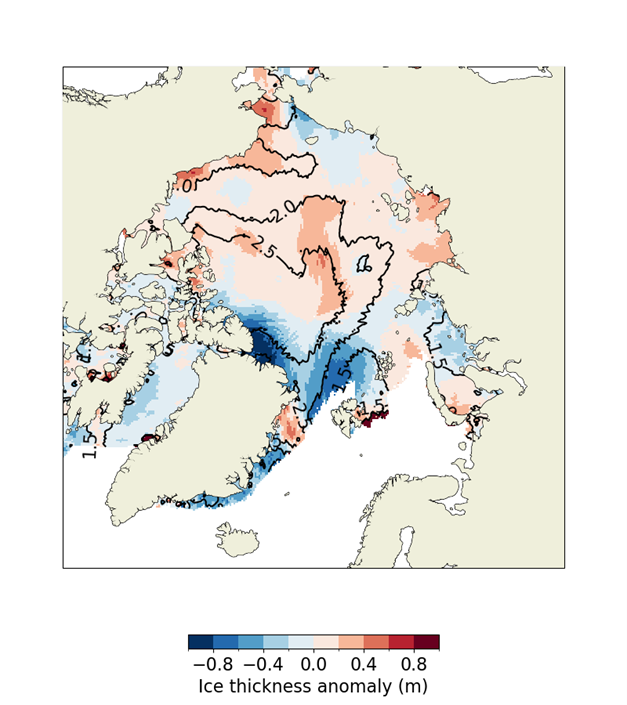
Figure 5. Sea ice thickness anomaly for March 2026 relative to the 2011-2025 average according to CryoSat-2 radar altimeter observations. Contour lines of March 2026 mean ice thickness are overlaid.
Sea ice extent for the month of May was, at 12.14 million sq km, the fourth-lowest extent on record for the month, 0.92 million sq km below the 1981-2010 average (Figure 5). During May, pressure tended to be high over Greenland and the Canadian Arctic, and there were frequent outbreaks of warm air into the Arctic Ocean coastal seas, particularly in the East Siberian Sea where upper air temperature anomalies exceeded +3°C. The warm temperature anomalies here may explain the earlier onset of melt near the Arctic Ocean coasts this year. On the other hand, the Canadian Arctic was often rather cold, with upper air temperature anomalies 2°C colder than average in some areas.
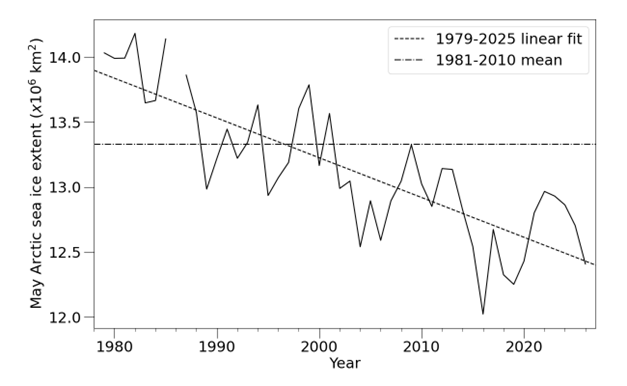
Figure 6. Average May Arctic sea ice extent according to the OSI SAF Sea Ice Index with 1979-2025 linear fit and 1981-2010 mean indicated.
Outlook for September
There is no significant correlation between ice extent in early June and the seasonal minimum extent in September, as the severity of melt is heavily dependent on Arctic weather conditions over the summer. Statistical predictions based on daily ice extent only start to achieve some skill by mid-July. Hence it is not possible to predict September sea ice extent with any confidence at this point in the season. However, it is highly likely that September sea ice extent will fall within the post-2007 range (3.99 to 5.68 million sq km), which is much lower than the 1981-2010 average of 6.76 million sq km.
Antarctic
Sea ice state
Antarctic sea ice extent on 10th June was 12.15 million sq km according to the OSI SAF Sea Ice Index. This was the 7th lowest extent on record for this date, the lowest having been 11.14 million sq km, recorded in 2023. It was 1.06 million sq km below the 1981-2010 average (Figure 7).
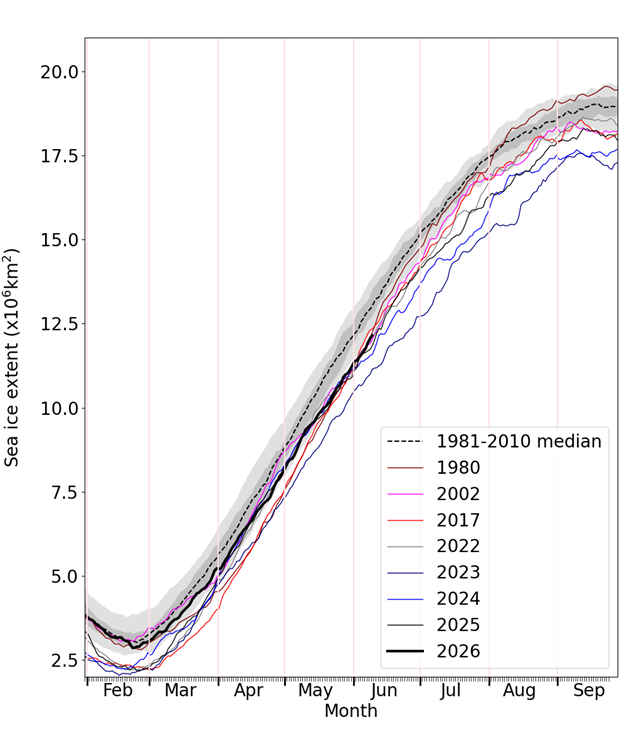
Figure 7. Daily Antarctic sea ice extent for 2026, compared with recent years and the low ice years of 1980, 2002 and 2017. Also shown is the 1981-2010 average with interquartile and interdecile ranges indicated by the shaded areas. Data are from the OSI SAF Sea Ice Index.
Extent was exceptionally below average in the Bellingshausen Sea, and well below average in a wide area stretching from the eastern Weddell Sea to the Indian Ocean sector. However, it was near- or above average in the eastern Ross and Amundsen Seas, as well as the western Weddell Sea (Figure 8). The areas of above- and below-average extent mostly reflect the patterns of cold southerly or warm northerly winds observed during April and May. An exception is the western Weddell Sea, where upper air temperature has been anomalously very warm since March despite the high sea ice extent observed here.
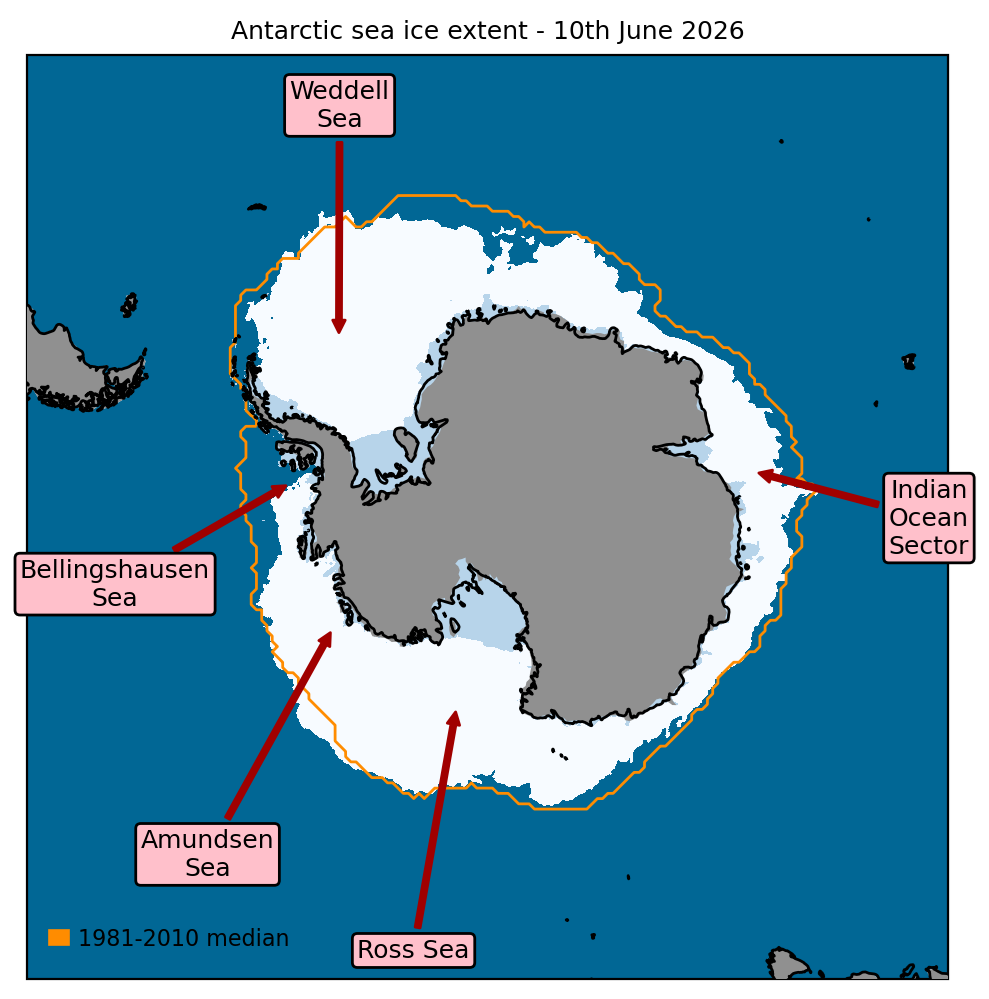
Figure 8. Antarctic sea ice extent on 10th June 2026, with 1981-2010 average extent indicated in orange, and with regions referred to in the text labelled. Data are from EUMETSAT OSI SAF (Tonboe et al., 2017).
Austral summer review
In the Southern Hemisphere, June is a winter month. At this time of year, Antarctic sea ice typically continues to expand following its minimum extent, which is usually recorded in February. In early 2026, Antarctic summer ice extent was substantially higher than was seen in many recent years. The average February ice extent, for example, was at 3.24 million sq km, close to the 1981-2010 average of 3.33 million sq km and considerably higher than the last 4 years, which ranged from 2.23 to 2.51 million sq km. The near-average extent was largely due to high extent in the Weddell Sea, partly caused by cold southerly winds. Since February however, Antarctic sea ice extent has been growing somewhat more slowly than average.
References
Hersbach, H. et al. (2017) Complete ERA5 from 1940: Fifth generation of ECMWF atmospheric reanalyses of the global climate. Copernicus Climate Change Service (C3S) Data Store (CDS). https://doi.org/10.24381/cds.143582cf. Date Accessed: 10-06-2026.
Lavergne, T. et al. (2023) OSI SAF Sea ice index 1978-onwards, Product OSI-420, Version 2.2, May 2023, Available at: https://thredds.met.no/thredds/osisaf/osisaf_seaiceindex.html. Date Accessed: 11-06-2026.
Tilling, R.L., A. Ridout and A. Shepherd (2018) Estimating Arctic sea ice thickness and volume using CryoSat-2 radar altimeter data. Adv. Space Res., 62, 1203-1225. https://doi.org/10.1016/j.asr.2017.10.051
Tonboe, R., J. Lavelle, R.-H. Pfeiffer and E. Howe (2017) OSI SAF Global Sea Ice Concentration, Product OSI-401-b, Version 1.6, September 2017. Available at: https://osi-saf.eumetsat.int/products/osi-401-b. Date Accessed: 11-06-2026.