A new set of weather patterns for Europe
April 2016 - Met Office research published this month reveals a new set of 30 and 8 objectively derived daily weather patterns, which are typical of the main synoptic scale variability over large parts of Europe.
These new weather patterns, which have been published in Meteorological Applications, are based on the analysis of mean sea level pressure (MSLP) observations over a 154 year period, from 1850 to 2003. They are primarily designed for use in probabilistic medium- to long-range forecasting applications, driven by output from ensemble forecasting systems. This Research News article provides an overview of these new weather patterns, along with examples of their forecasting application.
An introduction to weather patterns
A weather pattern can be described as one of many circulation types over a defined region, which differs in its characteristics from other weather patterns over the same region and varies on a daily basis. An example of a daily weather pattern over the UK is a cyclonic westerly type (left-side image below). This pattern brings mild, wet and windy conditions. There are several patterns this type can transition to, one of which is a cyclonic north-westerly type (middle image below). This pattern brings cool and showery conditions.
![]()
The term weather regimes can also be used to describe a defined circulation type. Weather regimes are typically larger in scale, fewer in number, and persist for more days than weather patterns. However, to a certain extent, the two terms can be used interchangeably.
A new set of 30 weather patterns
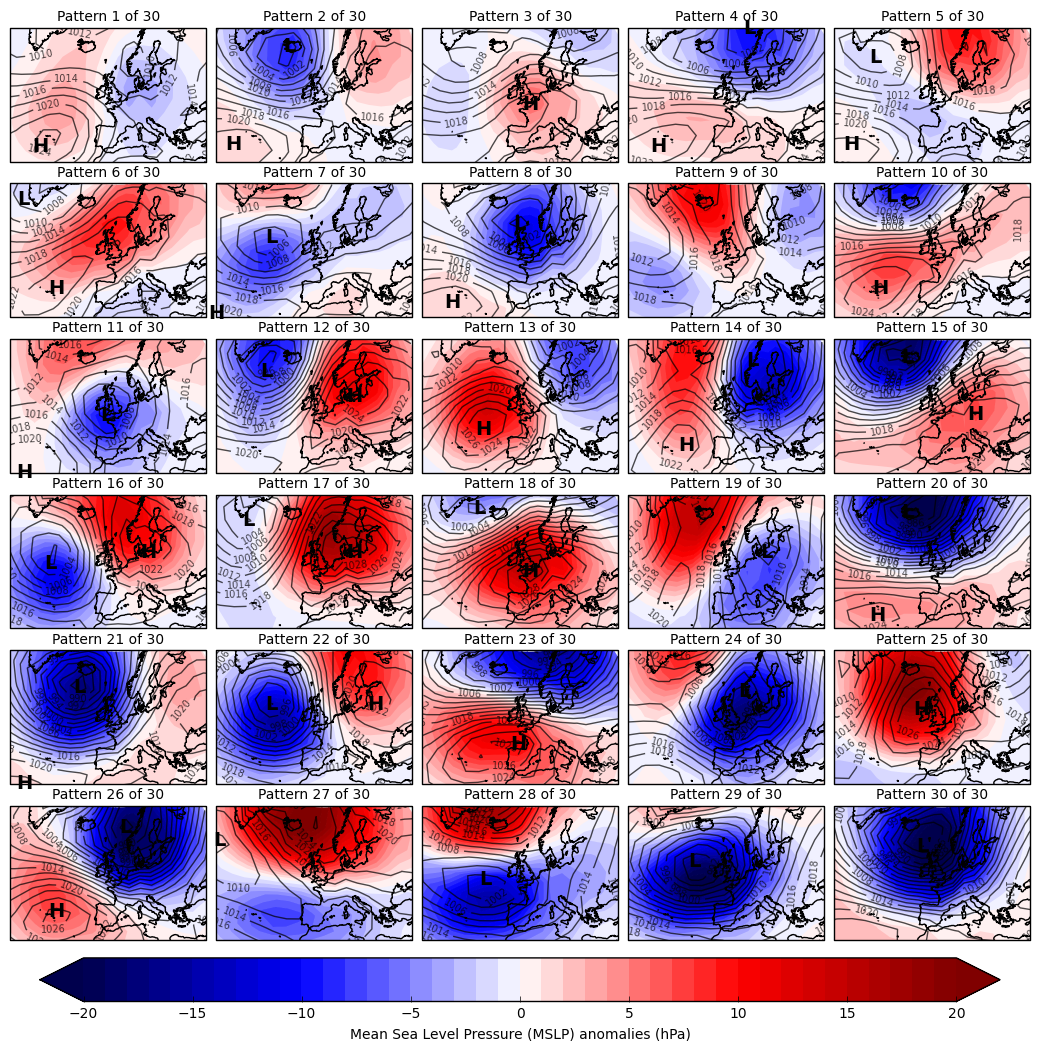
A new set of 30 weather patterns were generated objectively by clustering daily MSLP anomaly fields over the 154 year observation period. The aim was to use cluster analysis as a convenient way to produce a representative set of patterns.
The final set of patterns was arrived at by an iterative process, in which a series of sets of patterns were evaluated by meteorologists to ensure that a full range of circulation types affecting Europe were adequately represented.
The 30 patterns are primarily designed for use in medium-range forecasting (out to around 15 days). They can be used to examine variations within a broadscale regime. For example, a useful forecast transition can be identified between a calm westerly (Pattern 10) and a stormy westerly (Pattern 20).
Patterns are ordered according to their annual historic occurrences between 1850 and 2003, which was the period used to generate the patterns. Pattern 1 occurs most often annually (around 6.5% of the time) and Pattern 30 occurs least often annually (around 1.5% of the time).
However, clustering MSLP anomalies tends to group days with strong anomalies as well as days with weak anomalies, resulting in some interesting seasonality. Lower numbered patterns have weaker MSLP anomalies and tend to occur more in summer. Higher numbered patterns have stronger MSLP anomalies and tend to occur more in winter.
Understanding this climatological variability in weather pattern occurrence throughout the year helps identify more unusual patterns at certain times of year, which can sometimes be an indication of severe weather (e.g. the occurrence of Pattern 30 in summer).
A new set of 8 weather patterns
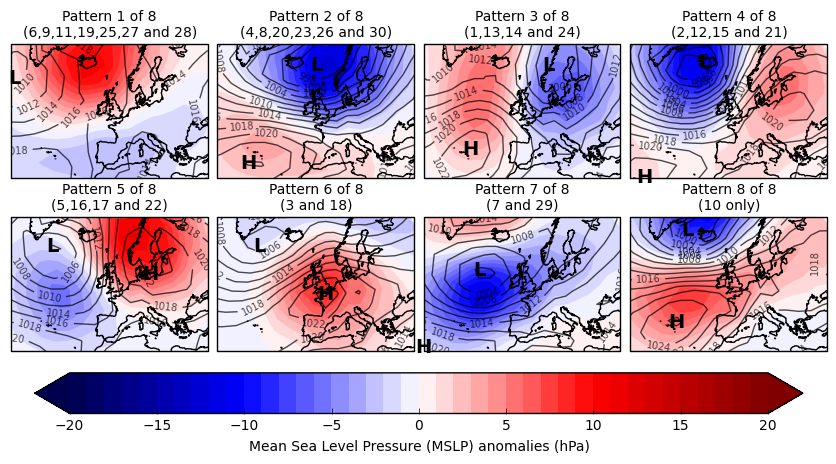
A smaller set of 8 weather patterns (or regimes) were derived from the original set of 30 for use in evaluating long-range and seasonal forecasts. At the seasonal timescale, only a broad indication of atmospheric circulation is possible, so fewer clusters are needed.
To enable seamless comparisons with the original set of patterns at intermediate timescales, the reduced set of patterns was produced by combining highly correlating combinations from the original set of 30, using the MSLP anomalies.
The 8 patters are ordered according to their annual historic occurrences in the same way as the 30 patterns. However, seasonality is less evident as the correlation method used to derive them combines patterns with varying MSLP anomaly intensities. Although the MSLP anomaly intensities vary within the sub-patterns, features are generally in the same place.
The forecasting application of predefined weather patterns
Ensemble forecasting systems
Having a set of predefined weather patterns allows multiple forecast scenarios (members) from ensemble forecasting systems to be automatically assigned to the closest matching type, hence reducing the ensemble forecast to a sequence of circulation type probabilities.
This is an efficient way of reducing data quantity while maximising useful information. Once weather pattern characteristics are understood, in terms of their climatologies or impacts, it then becomes relatively easy to interpret forecast output and describe likely consequences.
Decider
The Met Office has a probabilistic weather pattern forecasting tool called Decider. This forecasting tool assigns ensemble members to the closest matching pattern definition, from the set of 30 only. Ensemble member assignments are carried out separately for each day in the forecast period, allowing short-lived (transitionary) weather patterns to be identified.
Forecast probabilities are based on the number of ensemble members assigned to each pattern. Probabilities for the set of 8 patterns are derived by aggregating up probabilities from each of the 30 patterns, depending on which of the 8 patterns they are mapped to.
These forecasts are used routinely by Met Office meteorologists to assist them in producing Long range weather forecast. The new weather patterns have also been trialled with a range of customers, who use the information on expected impacts associated with specific weather patterns in their planning.
Forecast example
In this forecast example, the probability of each pattern occurring at each lead time is given out to 15 days. High probabilities have a darker background shading to help identify periods of high forecast confidence.
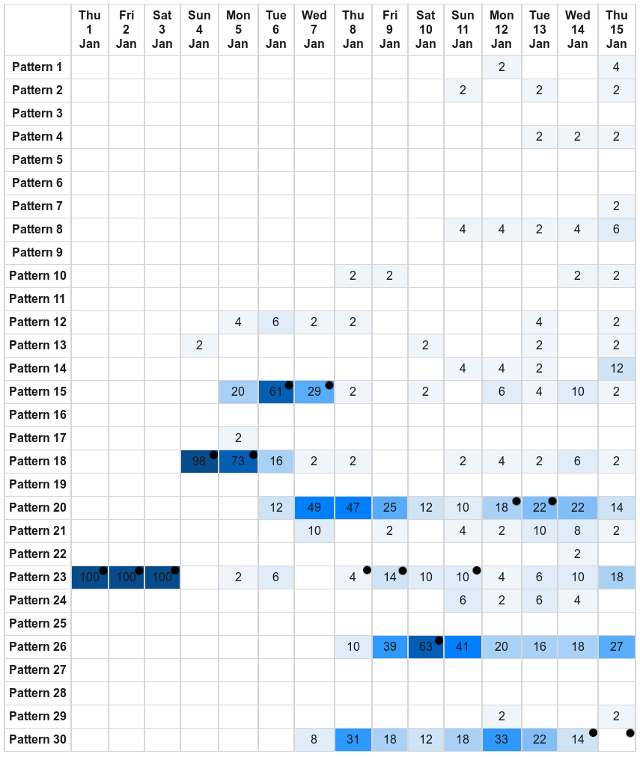
Looking at the 30 patterns, the first three days of the forecast have a 100% probability of Pattern 23 (anticyclonic westerly over the UK) occurring, with all members assigned to the same pattern.
Ensemble members diverge with lead time giving a number of possible solutions by day 15. However, even at long lead times there are typically two or three patterns with higher probabilities than the rest.
The most likely patterns between 12 January and 14 January are Pattern 20 (cyclonic westerly over the UK), Pattern 26 (cyclonic north-westerly over the UK) and Pattern 30 (very stormy cyclonic westerly over the UK).
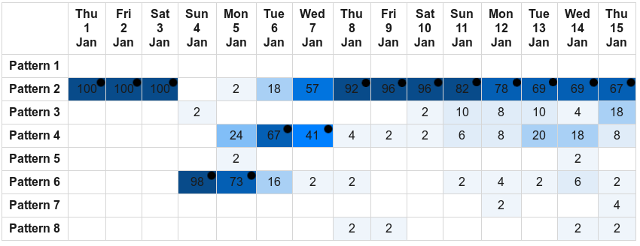
These patterns are variants of the westerly type and combining similar patterns in this way can help produce a forecast signal towards a particular broadscale circulation type when ensemble spread is high. This process is done automatically through use of the 8 patterns.
Verification of probabilistic weather pattern forecasts
The observed weather patterns shown by the dots in the forecast example above coincide with probabilities >0%, with the exception of Pattern 30 on 15 January (day 15). On this day, members were assigned to similar looking cyclonic westerly patterns which are less severe in terms of wind and rain (e.g. Patterns 7, 8, 20 and 26). However, a more generalised forecast of cyclonic westerly would have been correct at this long lead time.
Ideally, probabilistic forecasts should be verified over thousands of cases, enabling a robust interpretation of forecast skill under different scenarios. In the research paper published in Meteorological Applications, ECMWF ensemble forecasts for the set of 8 patterns were verified over a 5 year period from 1 January 2010 to 31 December 2014.
Results showed that probabilistic forecasts for Pattern 2 (westerly variants) followed by Pattern 1 (blocked variants) had the best forecast skill annually. Also, all patterns had small annual forecast biases of around 1 to 2%. However, seasonal variations in forecast skill were found, with forecasts having better forecast skill in winter than summer. This may be caused by a tendency for forecast biases to be amplified in summer, with the exception of Pattern 2 (westerly variants), which was found to under-forecast in winter and over-forecast in summer.
Ongoing research into weather impacts
Research is ongoing to link these new weather patterns to weather impacts. Certain weather impacts (such as coastal flooding, extreme heat, and poor air quality) are more likely to occur during the occurrence and persistence of a few specific weather patterns.
For example, coastal flooding in parts of South West England is more likely to occur under very cyclonic westerly or south-westerly types which coincide with spring tides. Once a relationship has been established, forecasts for these high impact weather patterns can be used to highlight an increased risk of particular impacts at relatively long lead times.