
Decider: our unique weather regime forecast tool
Choose Decider to give fast advice to forecasting teams or traders working in weather-sensitive trades.
Understanding the certainty of forecasts is vital when making decisions about weather-impacted assets such as natural gas, electricity or oil.
It can also be challenging to quickly interpret large amounts of information provided by probabilistic forecasts and brief analysts or traders with the relevant information.
What is Decider?
Decider is a unique weather regime forecast tool that can be used for applications where a weather correlation can be established from historical regime data.
This will help you to predict future trends and consequences by assisting with the interpretation of the large amounts of probabilistic data provided by ensemble forecasting systems.
Why choose Decider?
Decider will help you to provide quick and comprehensive advice to forecasting teams or traders to ensure that decision makers working in weather-sensitive trades are fully informed.
- Access an alternative view of weather conditions up to 32 days ahead that utilises the most accurate weather models in medium range weather forecasting.
- Review the confidence in the forecast and make risk based decisions accordingly.
- Clearly identify changes and transitions over the forecast period.
- Quickly see how weather patterns will impact on climatologies for different regions.
- Summarise a broad range of information, including circulation biases, regime seasonality, distance and correlation values which supports decision making.
- Identify clear correlations between weather regimes and your own data, enhancing the quality and confidence of your decision making.
- Recognise impacts on energy generation and demand, as a result of several weather parameters, including wind, precipitation and temperature anomalies.
"Decider has revolutionised the way we interpret the weather forecast.”Dave Parker, Head of Meteorology, EDF Energy |
Product options
Decider is a flexible package, designed to suit your needs. We can update your Decider subscriptions with any of the following options:
- Web access to ECMWF 15 day forecasts – updated twice daily
- Web access to GEFS 16 day forecasts – updated four times daily
- Web access to ECMWF 46 day forecasts – updated twice weekly
- Web access to GloSea 51 day forecasts – updated daily
- Web access to daily historic weather regime classifications from 1850 to present (available to download in CSV format). This data can be used to correlate weather regimes with a parameter of interest where historic records exist, such as weather observations, cases of high impact weather and even energy demand or supply. Once a relationship has been established, it becomes possible to forecast the likely consequences given a forecast for a particular weather regime. The number of specific forecast applications is potentially large.
- A live data feed of ensemble member regime assignments for all models (in CSV format). This subscription would enable you to (1) derive probabilities for your own broadscale regime groupings (in the same way as the 8 regimes used in Decider); (2) derive regime probabilities for your own multi-day forecast periods and (3) drive any downstream forecast systems.
Forecast visualisation
Forecast visualisation summarises key aspects from the large volumes of data which ensemble forecasting systems provide. Once weather regime characteristics are understood, in terms of their climatologies or impacts, it then becomes possible to interpret forecast output and describe likely consequences.
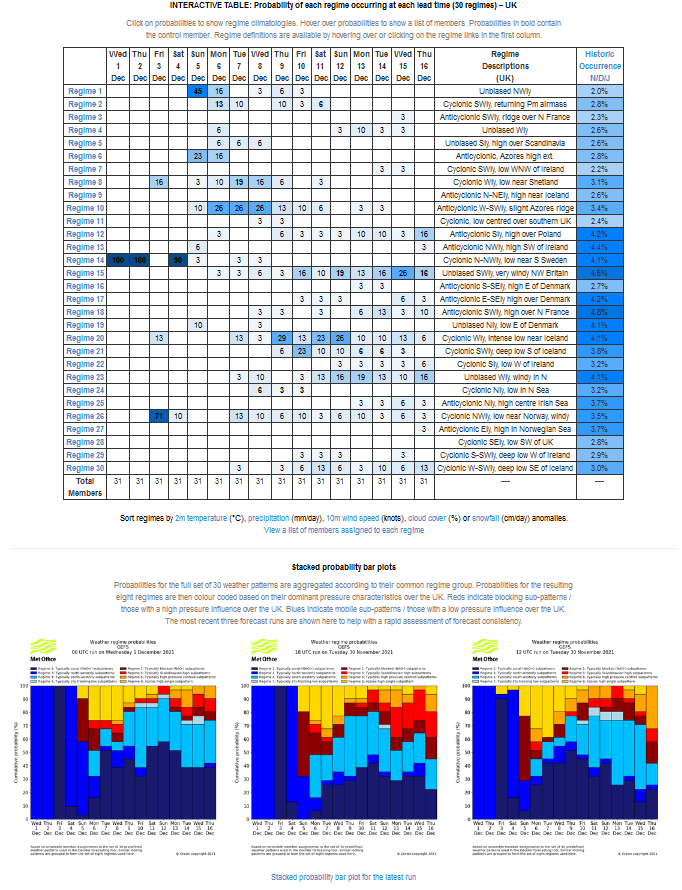
The image above shows an example of the interactive forecast summary table. The table at the top provides the probability of each weather regime occurring at each forecast lead time.
Below the table is a new weather regime forecast visualisation that we have introduced to the Decider webpages, which displays weather regime probabilities as stacked probability bar plots. These new plots present probabilities for a set of eight weather regimes and enable a quick assessment of any large-scale circulation changes within the medium- to long-range forecast period. They are also very useful for comparing consistency over consecutive runs and for identifying key trends in the forecast.
Colour shading helps you identify the most likely weather regime transitions. Forecasts are available from several ensemble forecasting systems with a number of different visualisations available to help you get the most out of the forecast.