Coastal flooding and weather patterns
July 2018 - Scientists from the Met Office and hydro-meteorologists from the Flood Forecasting Centre have objectively identified the weather patterns associated with coastal flooding in the UK.
These weather patterns can be used to identify the risk of coastal flooding in the medium- to long-range (one week to one month) forecast period.
Overview
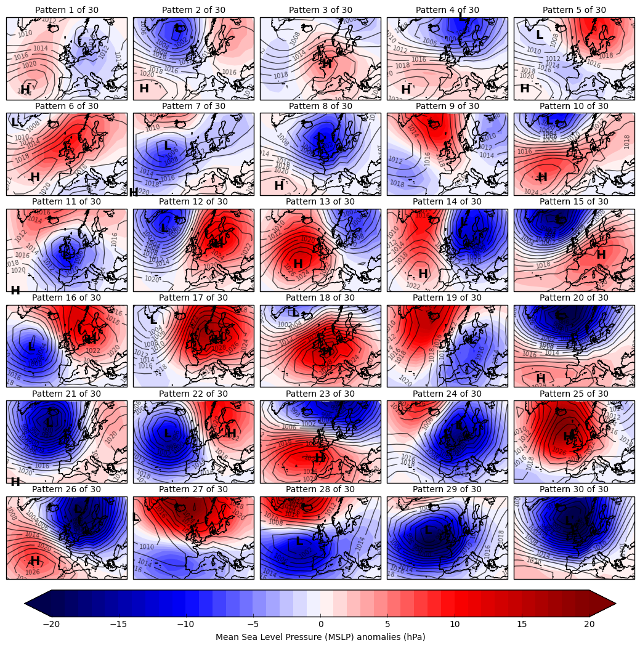
A set of 30 Met Office weather patterns shown below have been related to the occurrence of historical coastal flooding using observed tide gauge data alongside wave fields from a model hindcast. The aim was to identify a list of 'coastal risk' weather patterns that are associated with flooding at multiple UK coastal locations. These coastal risk weather patterns were then used to create a coastal flooding application of the Met Office's probabilistic medium- to long-range weather pattern forecasting tool (Decider), called Coastal Decider.
Coastal Decider is used by the Flood Forecasting Centre to assist in the decision making process which alerts the Environment Agency and the wider responder community to the possibility of a coastal event at long lead times. Given the uncertainties and forecast lead times involved, communication of the risk and magnitude of any possible event should always be qualitative, such as 'a medium likelihood of a large coastal flooding event', rather than providing absolute percentages and numbers.
Other forecasting tools such as the Met Office storm surge and wave ensembles can be used to refine any initial medium- to long-range forecasts from Coastal Decider as the event approaches within the one week time frame. At these shorter lead times, the Flood Forecasting Centre provide more detailed advice to emergency responders and this advice is used in producing flood warnings for the general public.
New forecasting tool
Within Coastal Decider, ensemble members already clustered by weather pattern are grouped to provide objective probabilities of a broader cluster of coastal risk weather patterns occurring, which can vary by site or coastal stretch. Coastal Decider also displays periods of spring tide and coastal risk weather pattern frequency climatologies to help with forecast interpretation. As a guide, forecast probabilities higher than climatology and coinciding with a spring tide suggest a higher likelihood than normal of coastal flooding.
Finally, metrics are available to help estimate the magnitude of surge and wave events given a forecast for a particular coastal risk weather pattern – these are based on pressure anomaly differences between ensemble members and their assigned weather patterns, or daily maximum 10 metre wind speed.
Coastal risk weather patterns
Coastal risk weather patterns are defined for each site as those where ≥ 1% of event samples (historical skew surge or wave events) exceed the site’s warning threshold. Warning thresholds were defined as the 99.7th percentile skew surge or wave climatology at each site. This percentile was chosen to reflect a once a year event, with the assumption made that local coastal defences should be able to cope with events that occur more frequently than this.
Example – Coastal risk surge patterns at Lowestoft (east coast)
Analysing the distribution of observed skew surges for each weather pattern at Lowestoft (Figure 1) reveals the high and low risk types. Weather Patterns 12, 17, 22 and 27 (Figure 2) are associated with negative skew surges. These weather patterns are all anticyclonic over the North Sea, with blocking areas of high pressure over Scandinavia or Iceland depressing water levels in the North Sea or causing strong offshore winds.
In contrast, Weather Patterns 13, 14, 19, 20, 23, 24 and 26 are associated with positive skew surges. These weather patterns have areas of low pressure centred in the North Sea or over Scandinavia, leading to a westerly, north-westerly or northerly flow along the East Coast of the UK. Using the 1% threshold described above, coastal risk weather patterns for skew surges at Lowestoft can be defined as 13, 14, 23 and 26 (Figure 2).
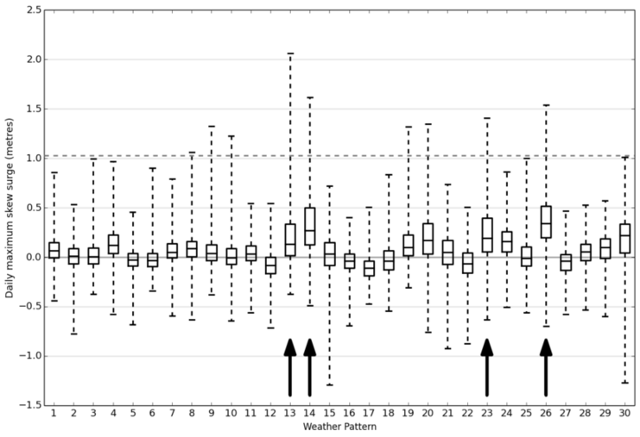
Figure 1. Skew surge distribution for each pattern at Lowestoft. Arrows show coastal risk patterns.
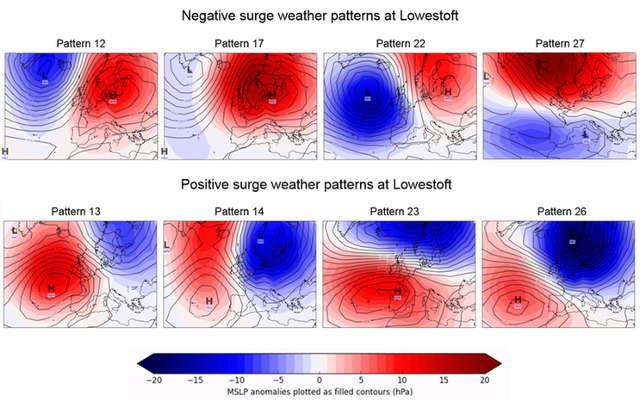
Figure 2. Patterns susceptible to negative and positive surges at Lowestoft.
East Coast storm surge on 13 January 2017
A large storm surge affected parts of the East Coast of England on 13 January 2017. In a synoptic setup analysed as Weather Pattern 14 (shown as part of Figure 2), a northerly flow over the North Sea originating from the Arctic was squeezed by a deepening area of low pressure near Denmark. The resulting north to north-westerly Beaufort force 8 to 9 winds (34 – 47 knots) generated a large surge in the North Sea that occurred around high water in a period of spring tides. In total 23 properties were flooded along parts of the north-east and east coast.
This event was first signalled by Coastal Decider from the 0000 UTC runs on 1 January 2017 (Figure 3), where probabilities for surge risk weather patterns occurring on 13 January 2017 were considerably higher than climatology. The persistence of forecast probabilities higher than climatology from consecutive runs later provided forecasters with the confidence to highlight the spring tide period between 11-16 January (shown by the yellow and orange shading) as high risk.
Another way of increasing forecast confidence is to compare output from several forecast models. Figure 3 shows consecutive forecasts from ECMWF, GEFS, MOGREPS-G as well as an equal weighted multi-ensemble. All models had a similar forecast evolution around the spring tide period, providing increased confidence in the occurrence of surge risk weather patterns around this time.
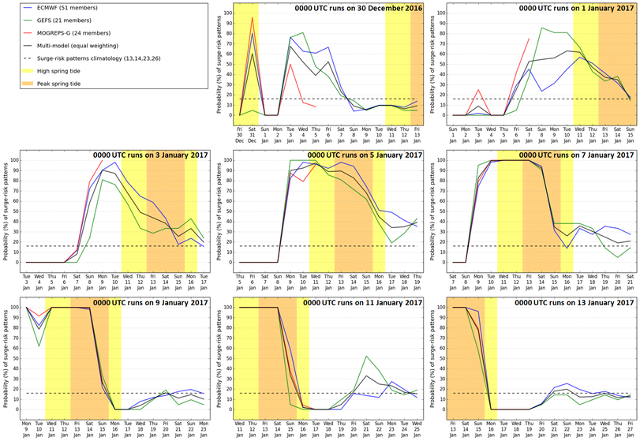
Figure 3. Coastal Decider forecast evolution for Lowestoft during January 2017.
The Flood Forecasting Centre used guidance from Coastal Decider alongside other forecasting tools to indicate the potential for high impact coastal flooding to Environment Agency duty managers from 7 January onwards. The Flood Forecasting Centre early warnings which followed resulted in the evacuation of several thousand properties and the erection of almost 9000 metres of temporary flood barriers at key locations, which helped restrict flooding to low levels (such as coastal roads and coastal town promenades).
More information
Full details of this research can be found in the following peer-reviewed paper published this month in Meteorological Applications.
Neal R, Dankers R, Saulter A, Lane A, Millard J, Robbins G, Price D. 2018. Use of probabilistic medium- to long-range weather pattern forecasts for identifying periods with an increased likelihood of coastal flooding around the UK. Met. Apps. DOI:10.1002/met.1719.