
Satellite image of the month - 2018
Showcasing some of the Met Office's satellite imagery from around the world showing weather in action, new views of the world and extra commentary on how we collect and create the images from our Satellite Applications team.
December 2018: Satellite image of spiral shaped cloud
07 December 2018
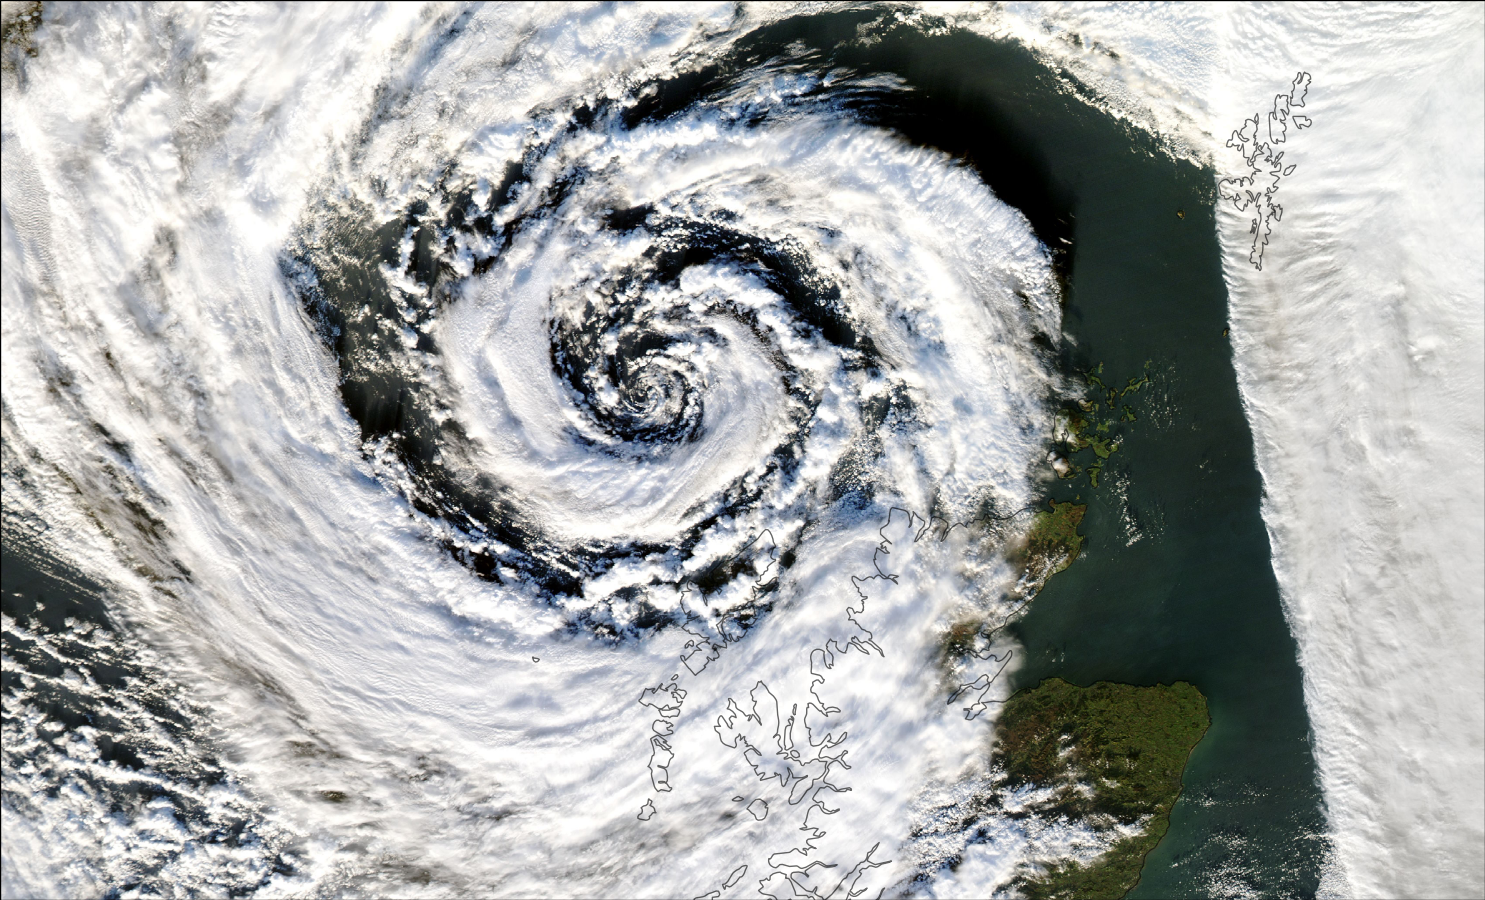
High resolution data from the Moderate-resolution Imaging Spectro-radiometer (MODIS) on board NASA's Aqua satellite shows this low-pressure system centred off the North coast of Scotland on 7th December. The anti-clockwise swirl is particularly striking in this image, as is the very straight cloud edge to the East of Scotland. Polar Orbiting satellites, such as Aqua, provide images with a high level of cloud detail.
Credits: NASA (data), Met Office (image).
November 2018: Interesting cloud phenomena over South-East Pacific
09 November 2018
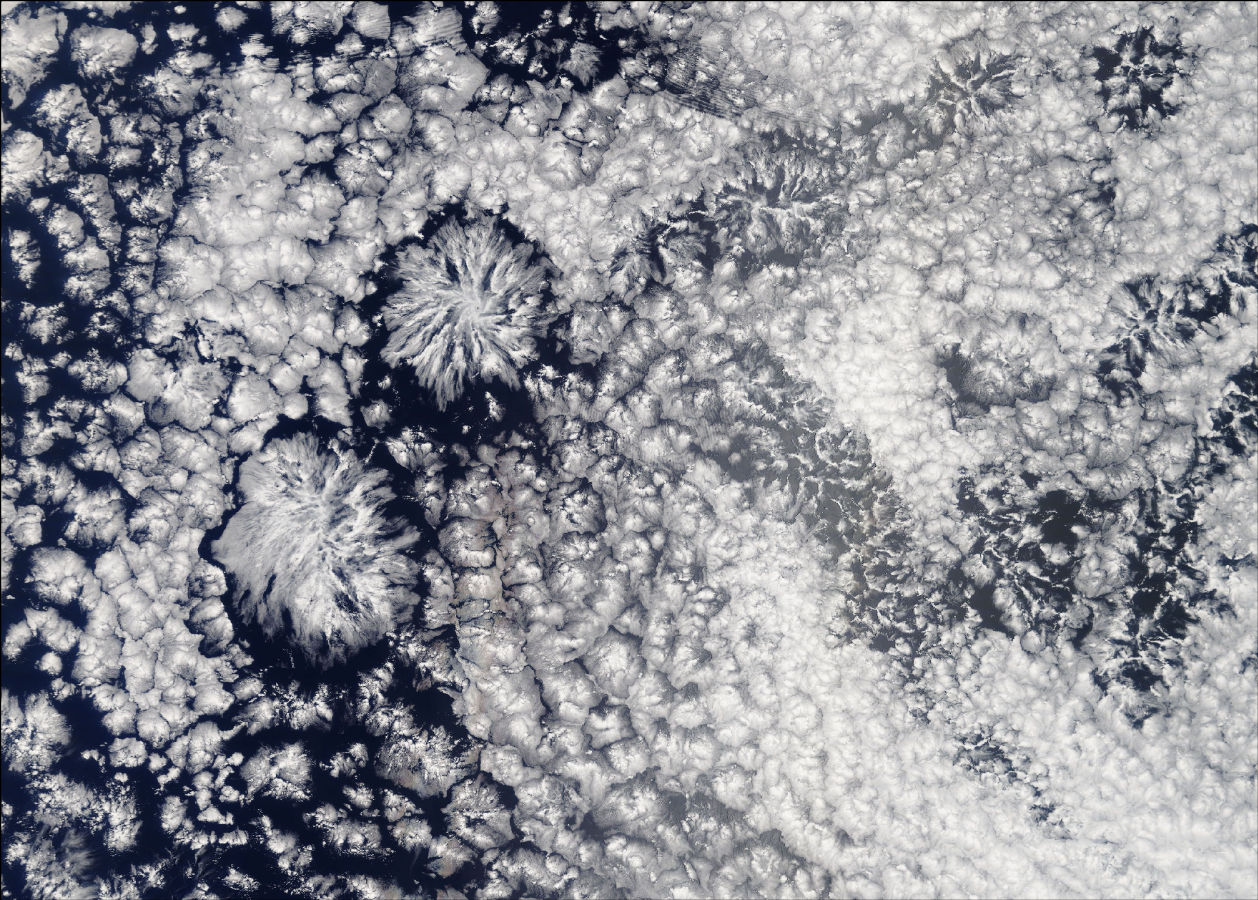
These strange shaped clouds, looking like snowflakes, appear surrounded by a layer of stratocumulus cloud over the South-East Pacific in imagery from NASA's Terra satellite. Similar features in the South-East Atlantic are colloquially referred to as 'hairy spiders'. They form by coalescence and condensation in a warm sub-tropical boundary layer. These clouds are associated with drizzle showers with larger drops than the surrounding stratocumulus but with low rates of precipitation reaching the ground, often less than 1 mm per hour. The image shows small scale bands of low-level convergence radiating outwards from the centre of the ‘spider’ (i.e. the legs of the spider) with cumulus clouds reaching the inversion and them spreading out into thin stratocumulus. Compensatory descending air surrounding each feature can be seen as a clear sunny zone circling around each ‘spider’. Also in this image, near the top edge, there are some ripples in the cloud which are atmospheric gravity waves.
Credits: NASA (data), Met Office (image).
October 2018: Satellite image of Hurricane Michael shortly after landfall in Florida
10 October 2018
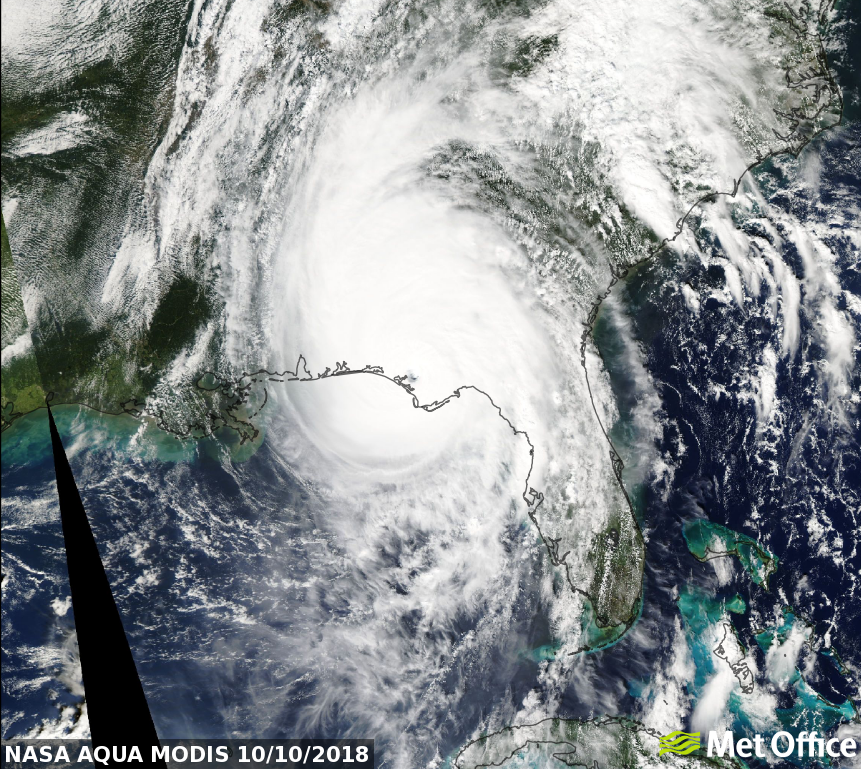
On 10 October 2018 a Major Hurricane (Category 4 on the Saffir-Simpson scale) named Michael made landfall over Florida. In this satellite image, from NASA's Aqua satellite, the eye of the hurricane can be clearly seen shortly after it passed over the barrier islands near Mexico Beach. This was one of the strongest hurricanes to make landfall over the United States since records began and was at peak intensity when it made landfall with sustained winds of 155 mph. Having already impacted Cuba and parts of Central America, it triggered a state of emergency and evacuations in the US and led to catastrophic damage and deaths.
Aqua orbits the earth every 99 minutes at an altitude of around 700 km. Data from the Moderate-resolution Imaging Spectro-radiometer (MODIS) on board the satellite is received at the Met Office. Three channels from the red, green and blue parts of the visible spectrum are combined to make this true colour image at 500 m resolution.
Credits: Met Office (image) , NASA (data).
August 2018: Satellite images showing a huge airbourne dust plume blowing over the Atlantic from the Sahara
01 August 2018
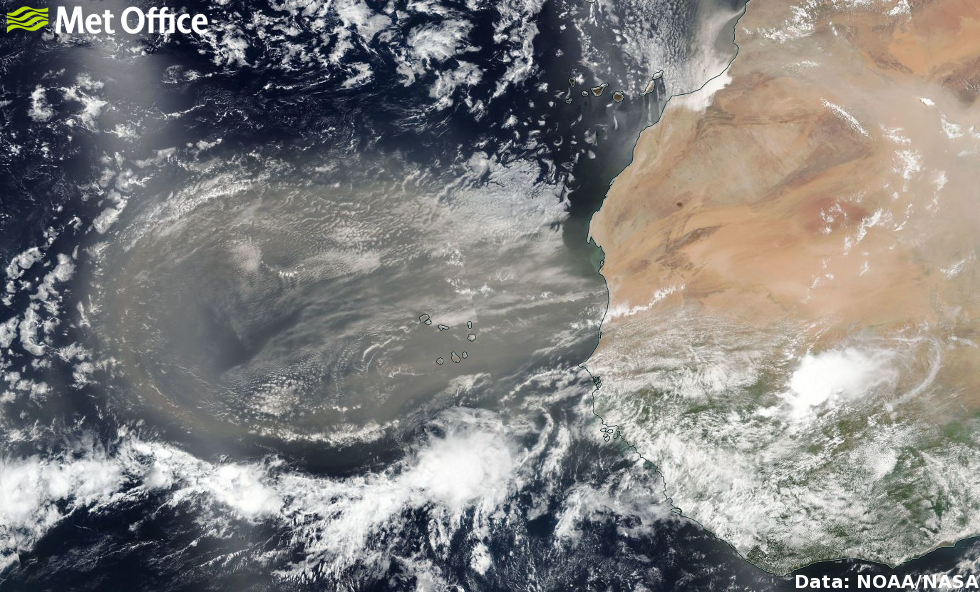
The first day of August 2018 was a dusty day in the Northern Hemisphere. Across North Africa and the Middle East large quantities of desert dust were lifted into the atmosphere by winds and transported large distances. A large plume of airborne dust moving Westwards over the Atlantic Ocean is particularly striking in the true-colour satellite imagery as there is a good contrast between the brown dust and the dark ocean surface.
The image shown above is from the Visible Infrared Imaging Radiometer Suite (VIIRS) on-board the NOAA & NASA operated Suomi-NPP satellite. This is a polar-orbiting satellite that orbits the earth every 101 minutes at an altitude of around 830 km.
We also have an image known as a 'Dust RGB' from geostationary orbit. This image is created to enable the easy identification of dust that has been lifted into the atmosphere. This is achieved by combining measurements and the difference between measurements from different infra-red wavelengths. This picks out the airborne dust as pink or purple colours that are brighter than the background. Thick ice clouds, such as the tops of very large thunderstorms, show up in red and orange colours. As well as the plume over the ocean, this image type allows us to see the lifted dust over the desert surface as the brightest pink colours.
This Dust RGB is created at the Met Office using infra-red measurements from the SEVIRI instrument on-board the European geostationary satellite, Meteosat-11, operated by EUMETSAT. This satellite sits over the equator at 0º Longitude nearly 36,000 km above the Earth and provides imagery of the full Earth disc every 15 minutes.
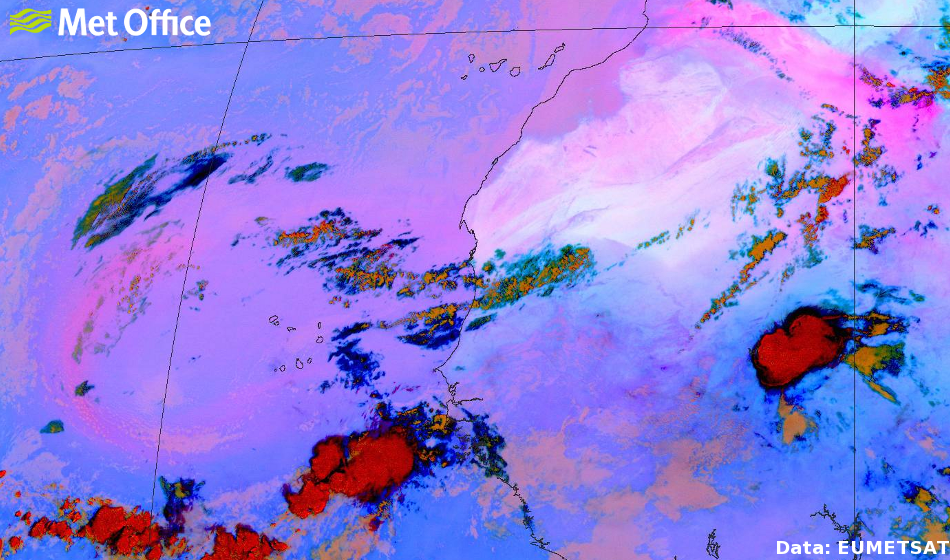
We can also view the dust plume from a different angle by creating a Dust RGB from the US geostationary satellite, GOES-16, operated by NOAA & NASA. This satellite is located over the Equator at 75ºW Longitude. This is shown in the image below.
Credits: Met Office (images) , EUMETSAT (data for image 2), NOAA/NASA (data for image 1 and 3).
July 2018: Satellite images showing he effect of the dry UK weather on vegetation
15 July 2018
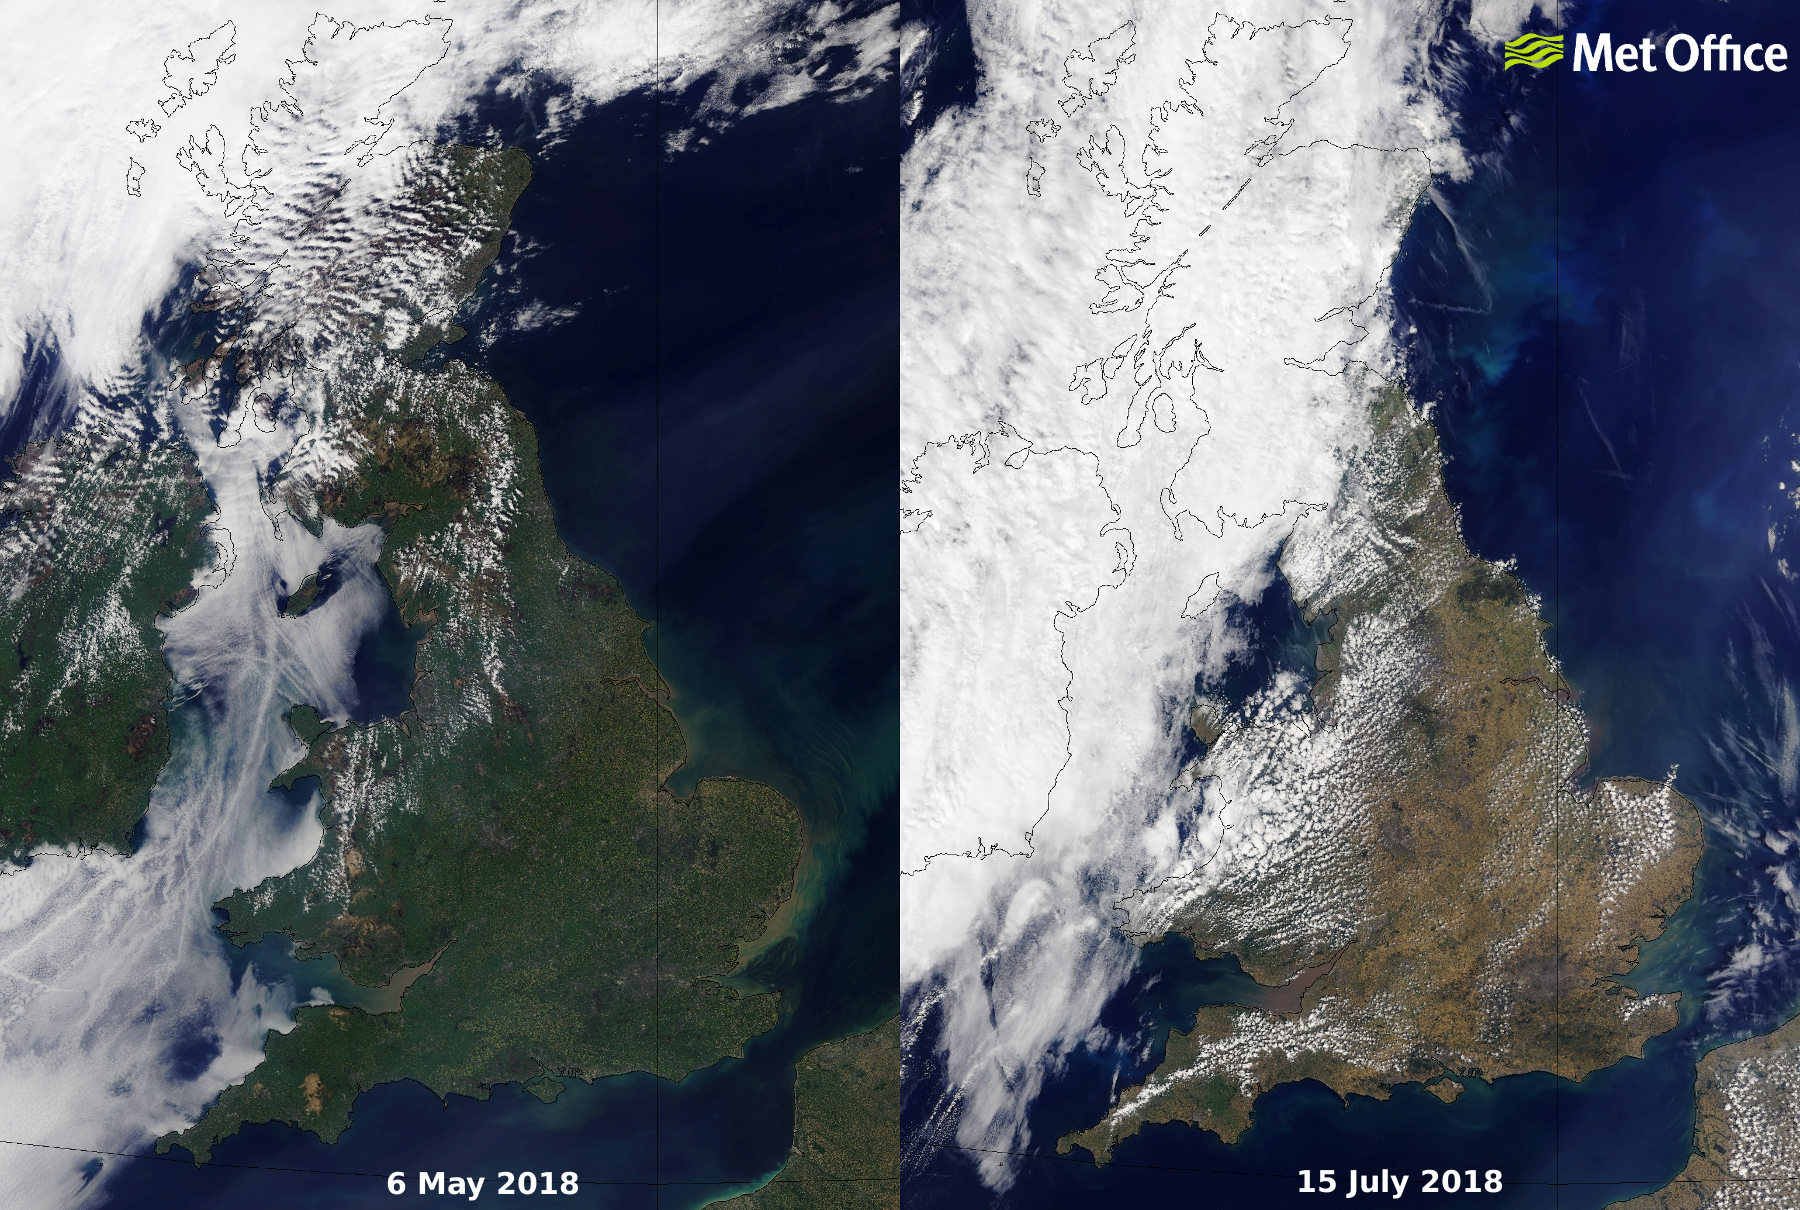
Every day the Met Office receives data directly from polar-orbiting weather satellites as they pass overhead. We use this data in our weather forecasting models and to produce images like these.
The data in these images come from the NOAA/NASA satellite, 'NOAA-20', one of the USA's newest polar-orbiting weather satellites, which passes over the UK every day. We can build a true-colour image from this data within minutes of receiving it, and do the same with data from a number of other European, Chinese and USA operated satellites.
Large sections of the selected images are cloud free, allowing a good view of the surface. They reveal extensive browning of vegetation caused by the very hot and dry conditions experienced by many parts of the UK this summer. Although browning is normal, this year has seen more than usual and the contrast between the satellite view on 15 July 2018 with the image from a largely clear day in early May is striking.
These images were shared widely by UK and International news media in mid-July.
Credits: Met Office (images) , NOAA/NASA (data).
June 2018: Satellite imagery showing wildfire smoke and hot-spots after hot weather
30 June 2018
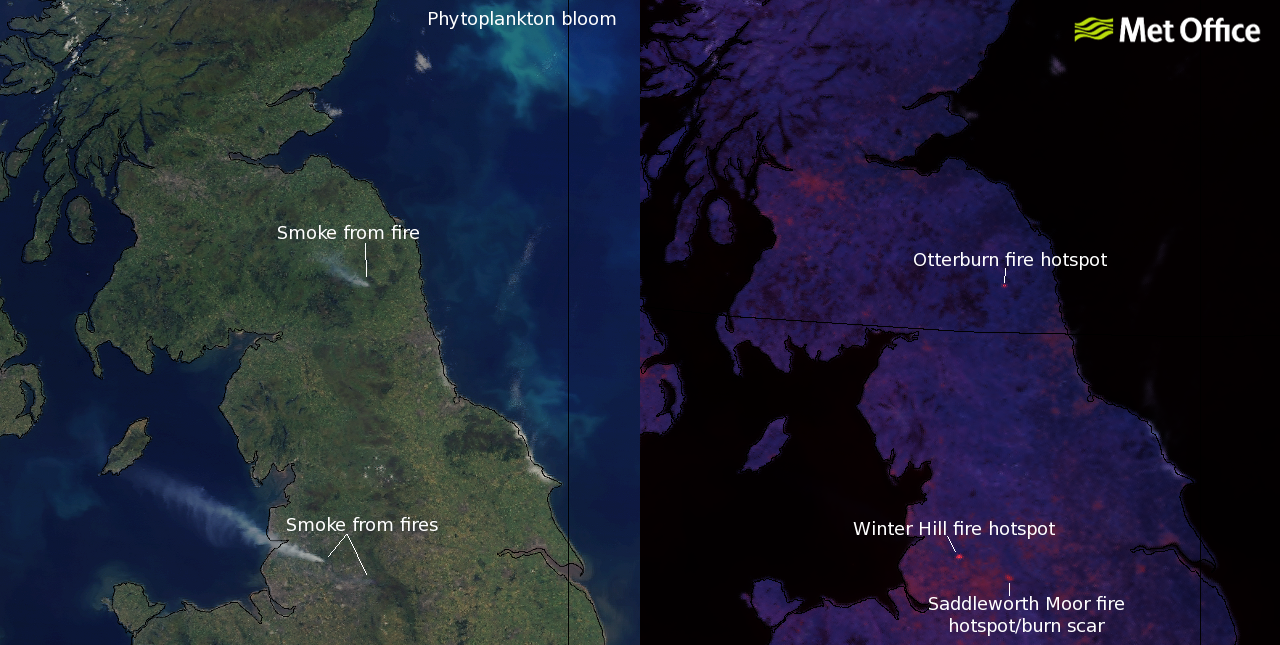
June 2018 was a warm and dry month for the UK. Many areas of the UKseeing their warmest and driest June on record. In this dry spell the risk of wildfires is high and several large moorland fires broke out over the North of the UK near the end of the month.
Polar-orbiting weather satellites were able to capture images of the fires. The images shown here are from the Visible Infrared Imaging Radiometer Suite (VIIRS) on-board the NOAA/NASA operated Suomi-NPP satellite.
The image on the left is a combination of three channels from the instrument in the visible part of the spectrum, which gives an image approximating what the human eye would see. In this image the smoke plumes from the fires can clearly be seen. The image on the right is a combination of channels that detect infra-red parts of the spectrum from the instrument. Fires are highly emissive at wavelengths of around 4 micrometers, so this channel of the satellite is used with other channels to give us this 'fire' image, where active fires appear as a red colour.
The UK was mostly cloud free on this day allowing an unobstructed view of the land surface in the left image. In addition to the smoke, it is possible to distinguish urban areas, fields, lakes, upland areas and bloom of phytoplankton in the North Sea.
Credits: Met Office (images) , NOAA/NASA (data).
May 2018: Hot weather triggers thunderstorms and lightning
26-27 May 2018
May of this year was the warmest May recorded in the UK, using a series of records stretching back to 1910.
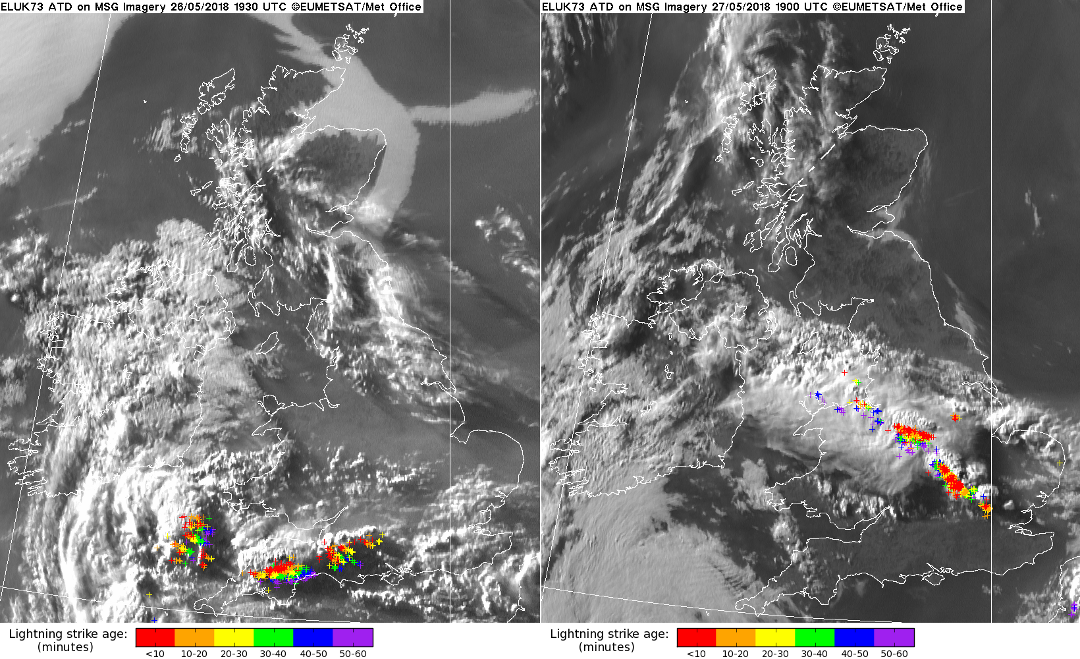
A particularly warm weekend on 26 and 27 May led to severe thunderstorms developing over parts of the UK. There were also widespread storms over mainland Europe with flooding and widespread damage in their wake.
The images above show the position of the UK thunderstorms storms on the Saturday and Sunday evening, shortly before sunset. In the left image from 26 May, the line of storms lie across south west England. The right hand image from the evening of 27 May show the storms stretching between London and North Wales. The backgrounds are visible channel images from Meteosat-11, a geostationary satellite operated by EUMETSAT. These are overlaid with lightning strikes detected by a Met Office designed, ground-based, lightning detection network, known as ATDnet. Each strike appears as a coloured cross. The colours correspond to the time elapsed since the strike. That weekend, ATDnet detected over 15,500 lighting strikes over land in the UK. Find out more about how we detect lightning.
Credits: Met Office (images and ATDnet data) , EUMETSAT (satellite data).
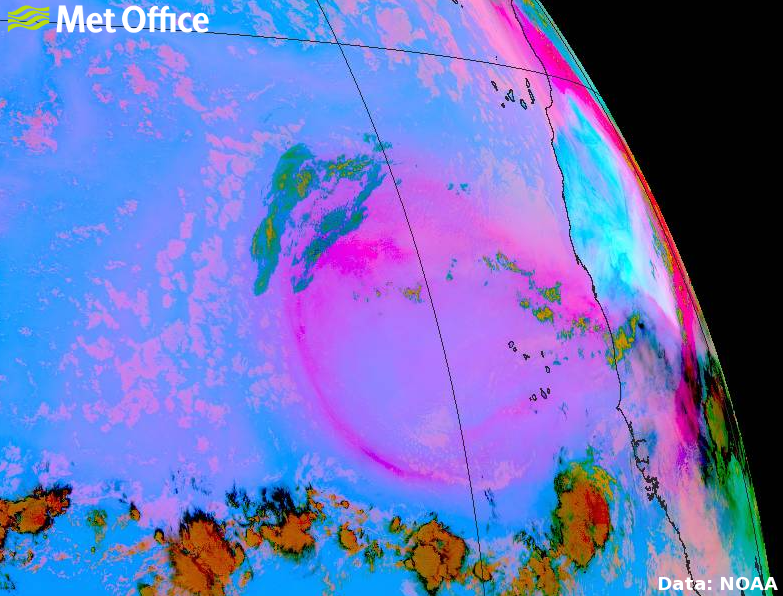
April 2018: View of an Atlantic depression from two Geostationary satellites
4 April 2018
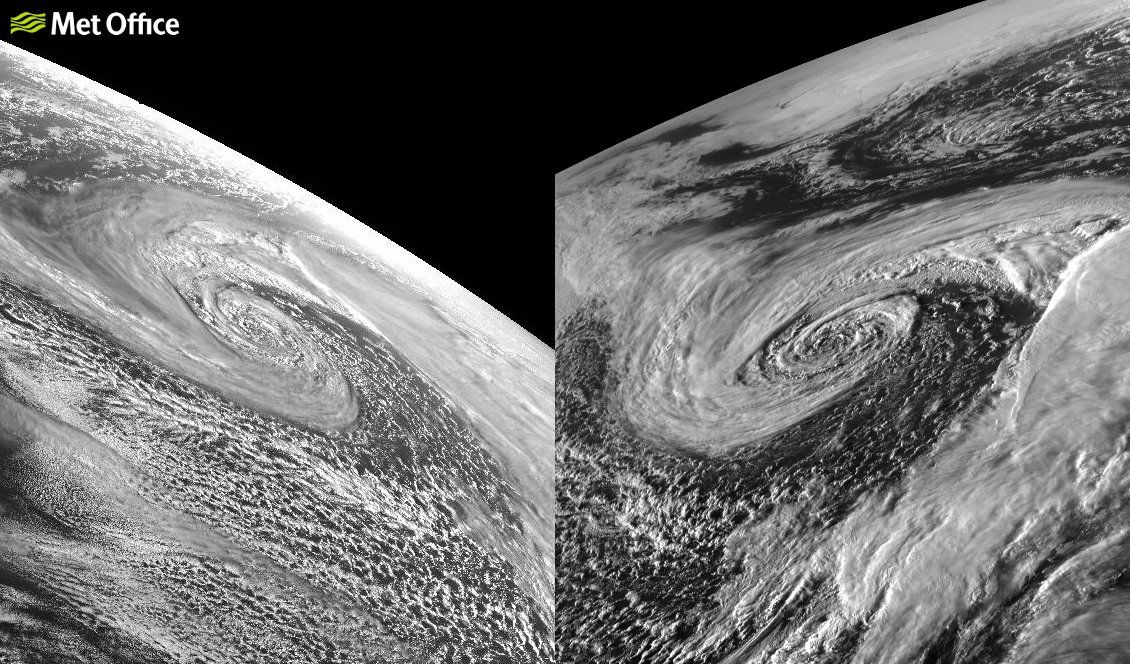
This Atlantic low pressure system to the West of the UK demonstrates the different viewpoints of two weather satellites in a geostationary orbit. Both images are taken at the same time by satellite instruments over 55,000 km apart.
The geostationary orbit is around 36,000 km above the Earth's surface and satellites at this height have an orbital period of one day, meaning they remain at a fixed position above the equator. This allows frequent images from the same viewpoint relative to the Earth, enabling the monitoring and tracking of the evolution of meteorological features and surface changes.
The image on the left is from the Advanced Baseline Imager (ABI) on-board the USA's satellite, GOES-16, operated by NASA and NOAA. It is the first in a new series of US Geostationary satellites and has been fully operational since December 2017. It is positioned over the equator at 75.2° West.
The image on the right is from the Spinning Enhanced Visible and Infrared Imager (SEVIRI) instrument on-board the European geostationary satellite, Meteosat-11, operated by EUMETSAT. It is positioned over the equator at 0° longitude and has been operational in this position since February 2018.
Both of these satellites form part of a constellation of geostationary satellites that ring the Earth. They are a crucial source of observations for global weather forecasting.
Credits: Met Office (images) , NOAA/NASA (data for left image), EUMETSAT (data for right image).
March 2018: Significant Saharan Dust Outbreak over Greece
22 March 2018
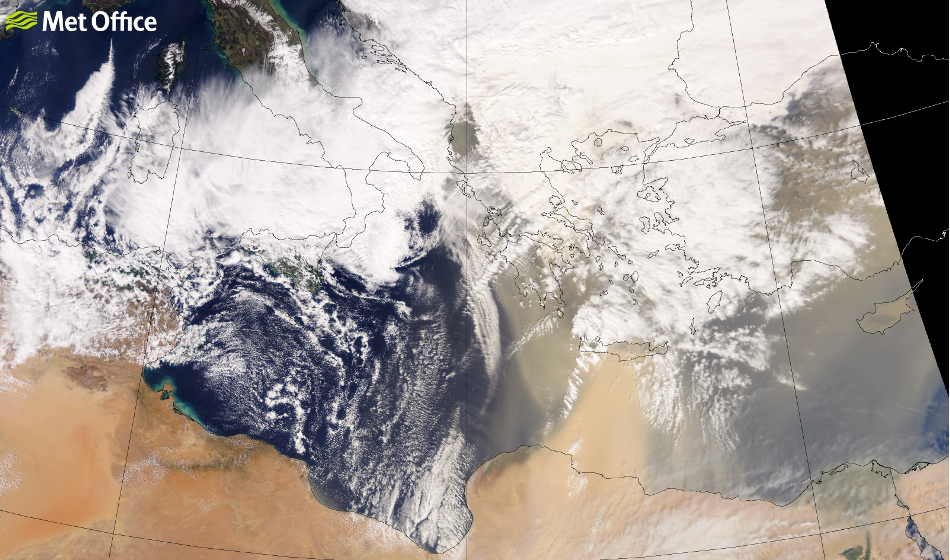
Saharan dust from the Libyan Desert was lifted by strong winds blowing from North Africa towards Europe. These winds were a result of a low-pressure system in the central Mediterranean. Crete in particular was badly affected with very low visibility caused by airborne dust. While Saharan dust over Greece is not uncommon, this was a particularly large transfer of dust, estimated to be the biggest for at least a decade. The reduced visibility led to the closure of a local airport and orange skies over the region.
The image above is from the VIIRS instrument aboard the NOAA/NASA satellite, Suomi-NPP. This is a polar-orbiting satellite that orbits the earth every 101 minutes at an altitude of around 830 km. It shows a plume of dust reaching northwards from Africa towards Crete at 11:45 UTC on 22nd March.
The type of image shown below is known as the 'Dust RGB' and enables the easy identification of dust. The lifted dust is picked out as pink or purple colours that are brighter than the background. Thick ice clouds show up in red and orange colours. To produce these images we use a combination of data from infra-red channels from the SEVIRI instrument on-board the European geostationary satellite, Meteosat-11, operated by EUMETSAT. This satellite sits at nearly 36,000 km above the Earth and provides imagery of the full Earth disc every 15 minutes.
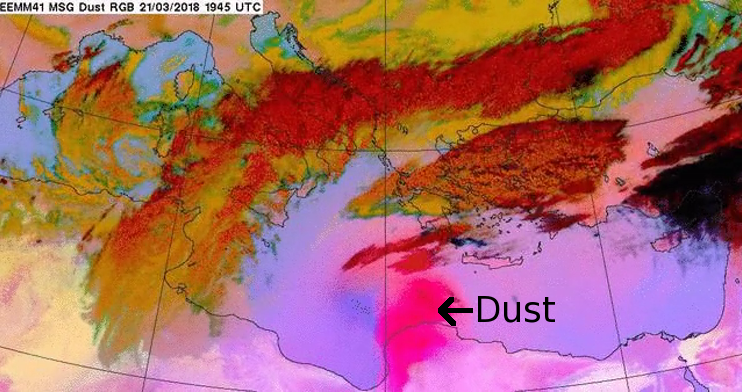
Credits: Met Office (images) , NOAA/NASA (data for top image), EUMETSAT (data for bottom image).
February 2018: Eruption of Mount Sinabung
19 February 2018
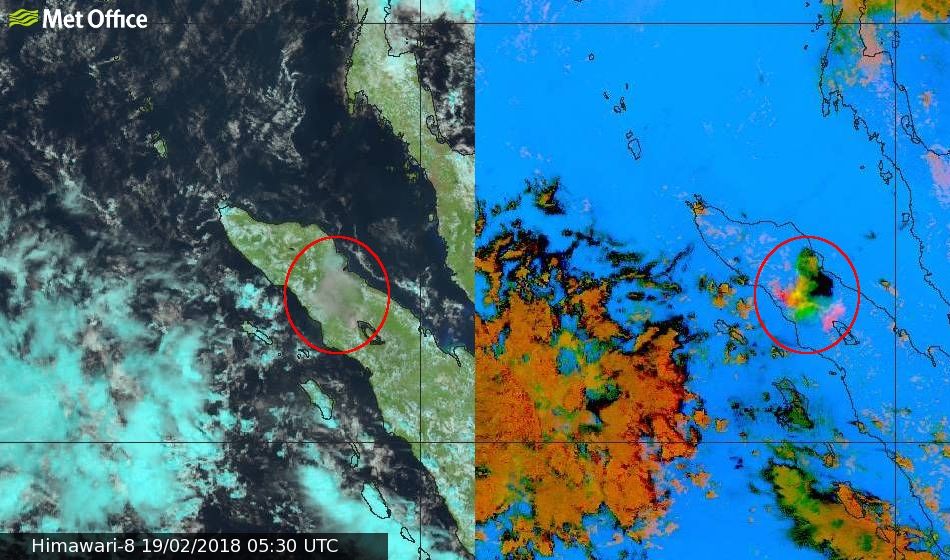
Mount Sinabung, located in Northern Sumatra, Indonesia, erupted on 19th February sending ash, sulphur dioxide (SO2) and ice high into the atmosphere and triggered flight warnings in the area.
These images are from the Advanced Himawari Imager on-board Himawari-8, a Japanese Meteorological Agency satellite. This satellite is in geostationary orbit, 36,000 km above the surface of the Earth. The false-colour image on the left uses channels from the visible and near-infra-red part of the spectrum and looks similar to a true-colour image; however, ice cloud appears as a cyan colour, allowing it to be distinguished from water cloud. Volcanic ash appears brown, close to its true colour, and can be seen spreading from the volcano at 05:30 UTC when this image was captured.
The image on the right is from the same time but uses three infra-red channels to create an image type we use to detect dust storms and volcanic ash. We can get a better idea of what is going on from this combination of IR channels, particularly when looking at a sequence of images. In this case different coloured features appear from the volcano and move in different directions following the eruption. This clearly demonstrates wind shear in the region as erupted matter advects in various directions depending on how high in the atmosphere it reaches.
The colours in the imagery coming from the volcano show:
- green: sulphur dioxide-rich plume
- pink/red: ash-rich plume
- yellow: mixture of ash and SO2
- black: ice cloud
The orange, black and pale pink colours further away from the volcano are cloud unrelated to the eruption.
Credits: Met Office (images) , JMA (data).
January 2018: Two days in winter
07/08 January 2018
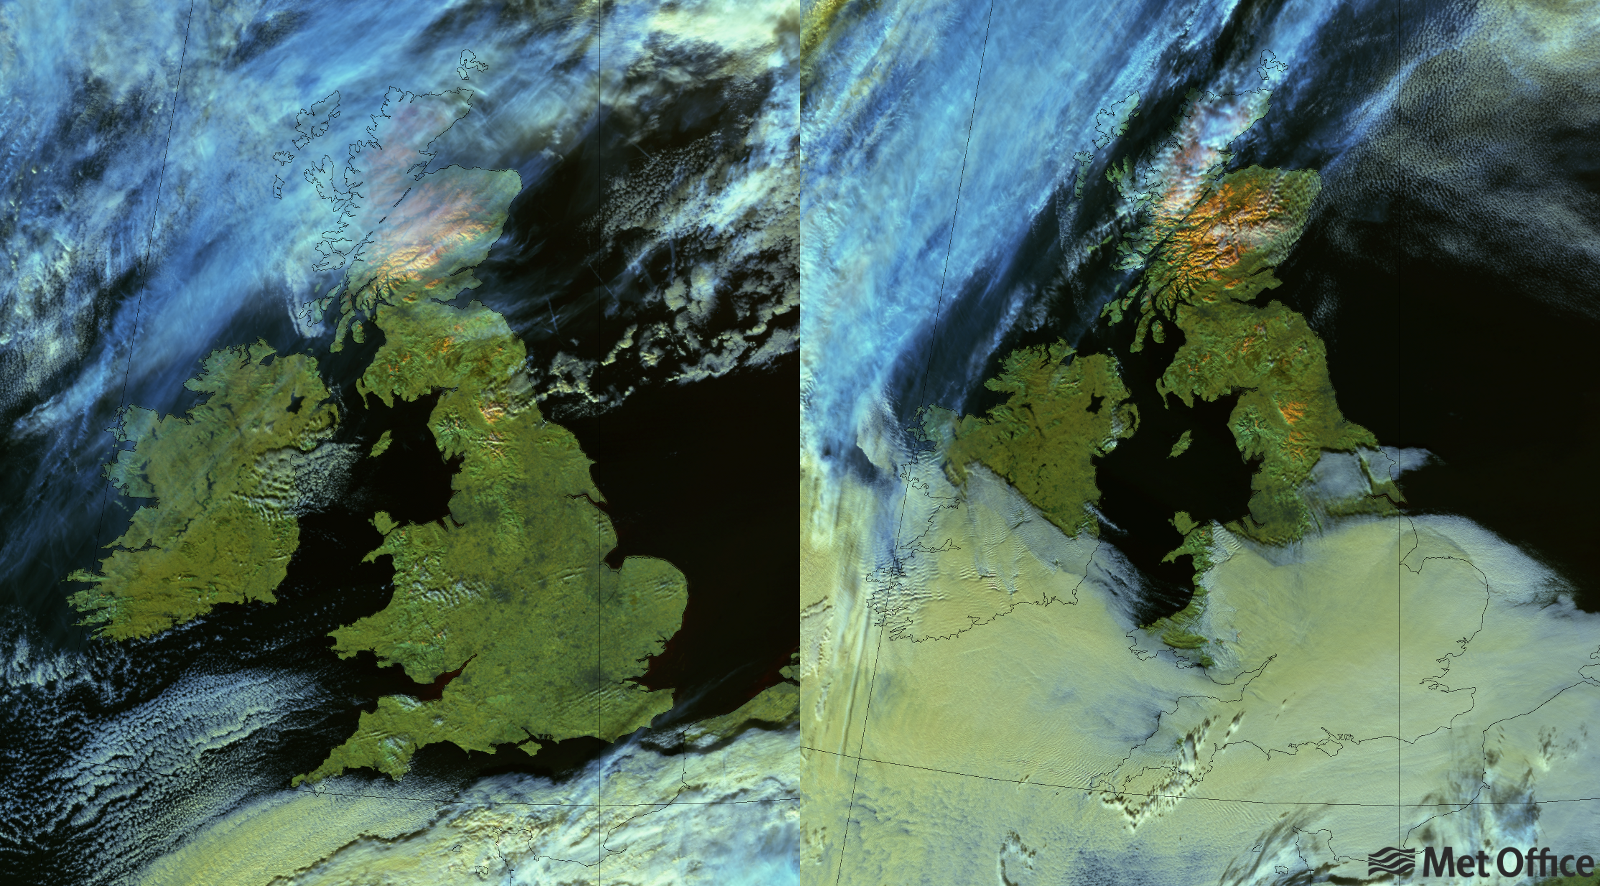
The UK and Ireland were mostly cloud-free on 7th January 2018, only for the Southern part of the UK to be blanketed by low cloud on 8th January, with the Highlands of Scotland clearing. This is shown in these false-colour images from the VIIRS instrument aboard the NOAA/NASA satellite, Suomi-NPP. The two images were made from data collected a day apart as the satellite passed over the UK on 7th (left image) and 8th January (right image). This type of false-colour image highlights where snow is lying on the ground. They are created using five channels in the near-infra-red part of the spectrum so things look a little different to what the human eye would see. The white snow can be differentiated from the white cloud as it now appears in a bright orange colour, while cloud ranges between blue, white and yellow depending on the cloud properties.
The Alps have seen very high snowfall this winter and a cloud-free day over the mountains later in January showed the snow cover on the higher ground.
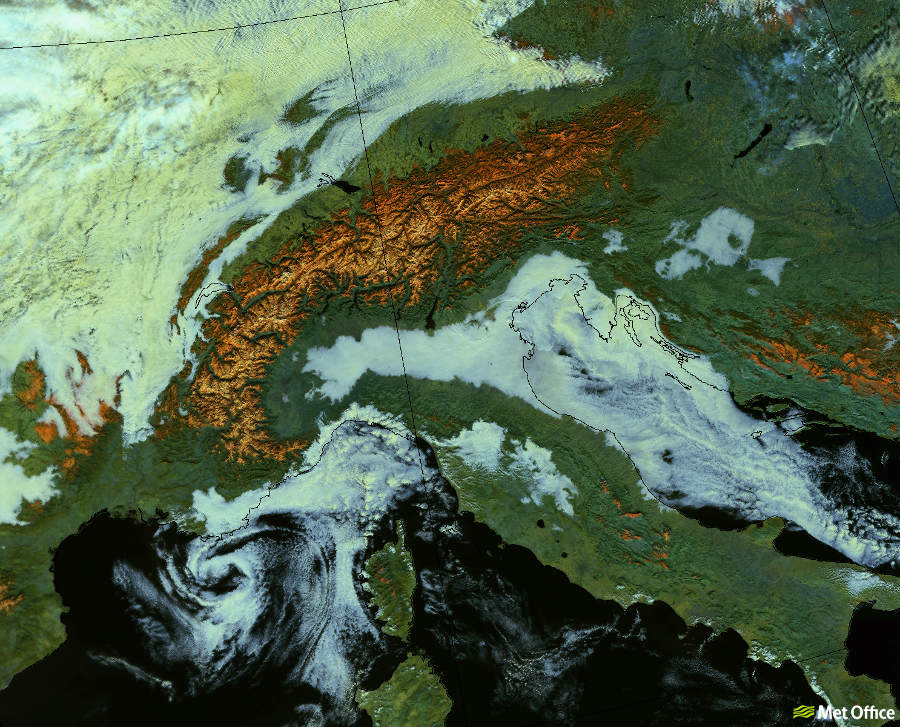
Credits: Met Office (images) , NOAA/NASA (data).