
Satellite image of the month - 2016
Showcasing some of the Met Office's satellite imagery from around the world showing weather in action, new views of the world and extra commentary on how we collect and create the images from our Satellite Applications team.
December 2016
Western Europe and North Africa from geostationary orbit
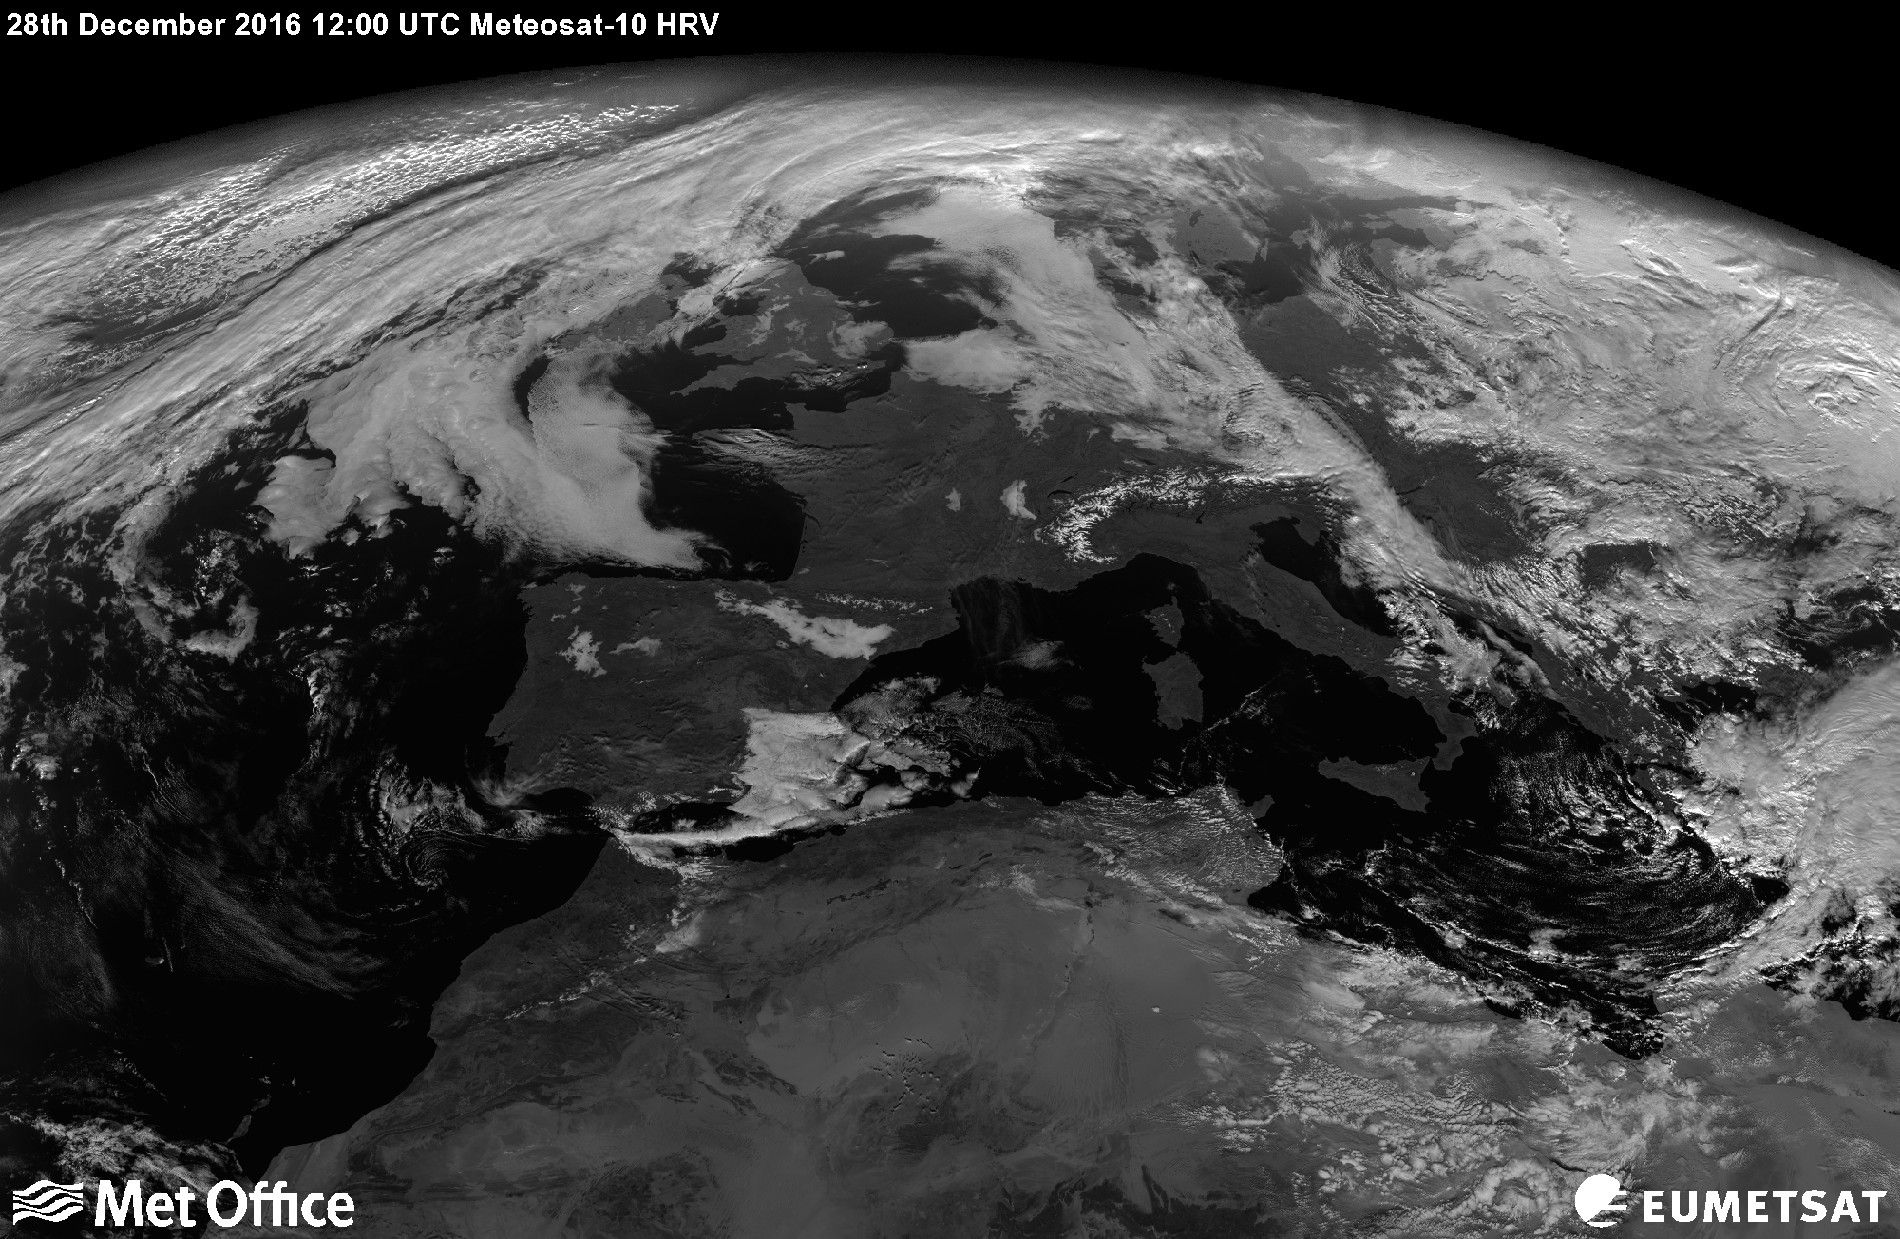
28th December 2016: Meteosat-10, Europe's primary geostationary satellite at 0 degrees longitude, captured this high resolution visible image at midday; a week after the Winter solstice. Much of the landmass in this region is cloud free and surface features such as coastlines, the snow-covered Alps and variations in the Northern Sahara desert surface are clearly visible.
Geostationary satellites orbit at around 36,000 km above the Earth's surface and have an orbital period of one day, meaning they remain at a fixed position above the equator. This allows frequent images from the same viewpoint, relative to the Earth, thus enabling the monitoring and tracking of the evolution of meteorological features and surface changes.
Credits:- Image: Met Office, Data: EUMETSAT
November 2016
Storm Angus brings heavy rain and gales to UK
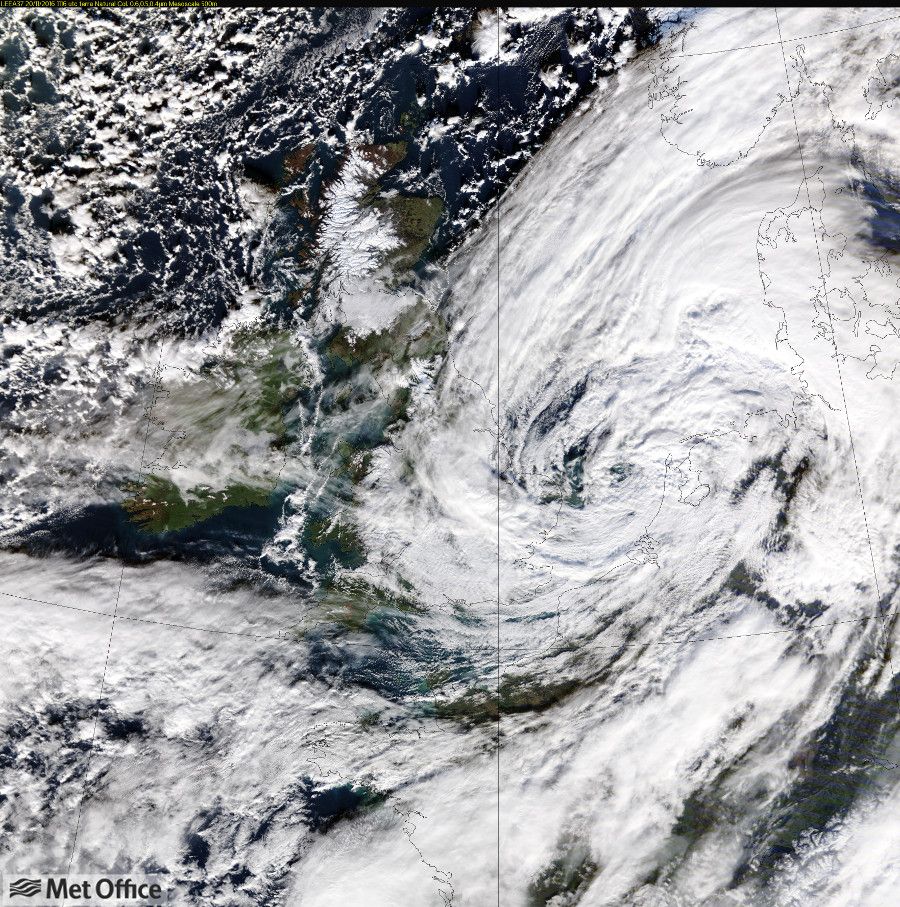
The first named storm of the season, Storm Angus, brought heavy rain and severe gales to the UK from 19 -20 November 2016. This image from NASA's TERRA satellite is from the morning of 20 November and shows Storm Angus over the North Sea and Eastern parts of the UK. Much of Scotland and parts of Northern England are clear and snow can be clearly seen on higher ground in these regions.
TERRA orbits the earth every 99 minutes at an altitude of around 710 km. Data from the Moderate-resolution Imaging Spectroradiometer (MODIS) on board the satellite is received directly from the satellite, in near-real time, by our satellite receiving ground station at the Met Office. Three channels from the red, green and blue parts of the visible spectrum are combined to make this true colour image at 500 metre resolution.
Credits:- Image: Met Office, Data: NASA
October 2016
Hurricane Matthew crossing the Bahamas
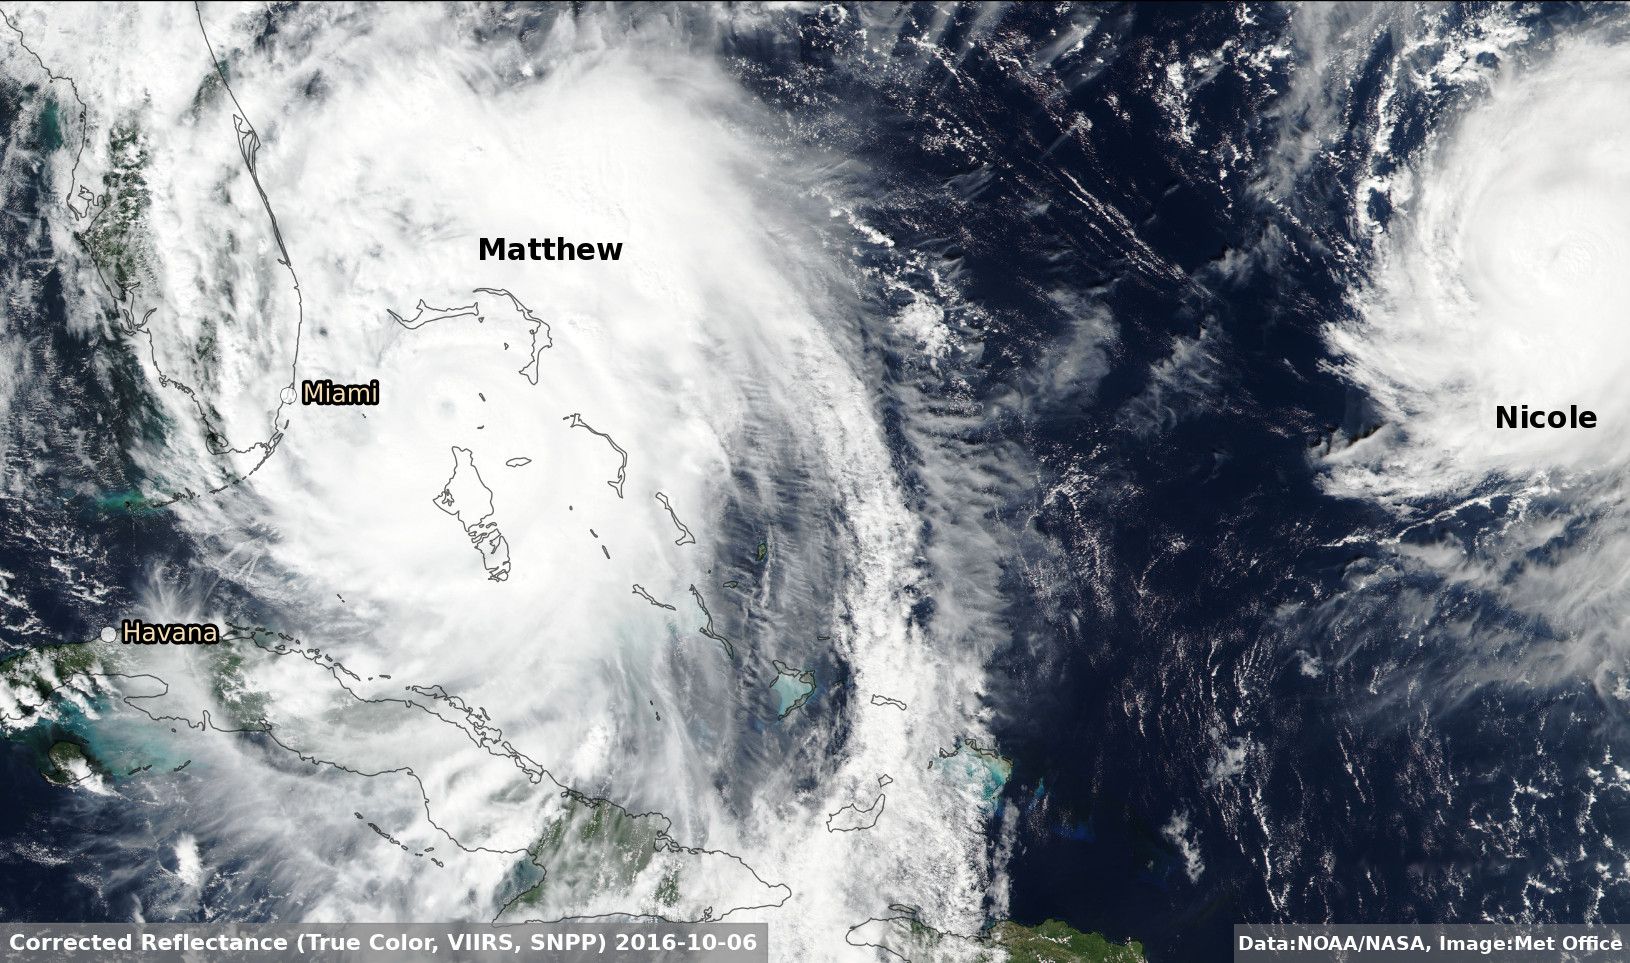
This image shows Hurricane Matthew as it crossed the Bahamas, approaching Florida, having tracked across Haiti. In its wake it left widespread destruction to lives, property and infrastructure caused by to high winds, heavy rainfall and storm surge. Another Tropical Cyclone, Nicole, which has since reached Hurricane status, sits further out in the Atlantic and is expected to interact with Matthew.
The image is created using data from the VIIRS instrument on the NASA/ NOAA Suomi NPP satellite. This is a polar-orbiting satellite which circles the Earth every 101 minutes at an altitude of over 830 km. The satellite instrument detects up-welling radiation from the Earth and atmosphere.
The image is produced by combining three visible channels which measure reflected radiation, corresponding to red, green and blue parts of the spectrum. This gives a true-colour image, which corresponds to what a human would see if they were looking down from space.
Credits:- Image: Met Office, Data: NOAA/NASA
September 2016
Burning oil wells in Northern Iraq
![]()
Dense smoke plumes from burning oil wells near the town of Qayyarah in Northern Iraq, captured near the beginning of September 2016.
These fires have been burning for months after the oil wells were first ignited during the ongoing conflict in Iraq. As this region is largely cloud free over the summer the large amount of carbon particulates that make up the plume can be seen in each successive satellite image, changing direction with the wind.
This image was captured by the Copernicus Sentinel-2A satellite, operated by the European Space Agency, ESA. This is a polar-orbiting optical imaging satellite that orbits the Earth every 100 minutes at an altitude of 786 km and captures images at up to 10 metres resolution.
For more information on Sentinel-2 go to https://sentinel.esa.int/web/sentinel/missions/sentinel-2.
This image contains modified Copernicus Sentinel data 2016 from the Sentinel-2A mission.
Credit to ESA.
August 2016
Aerial view of cumulus clouds over France and southern England
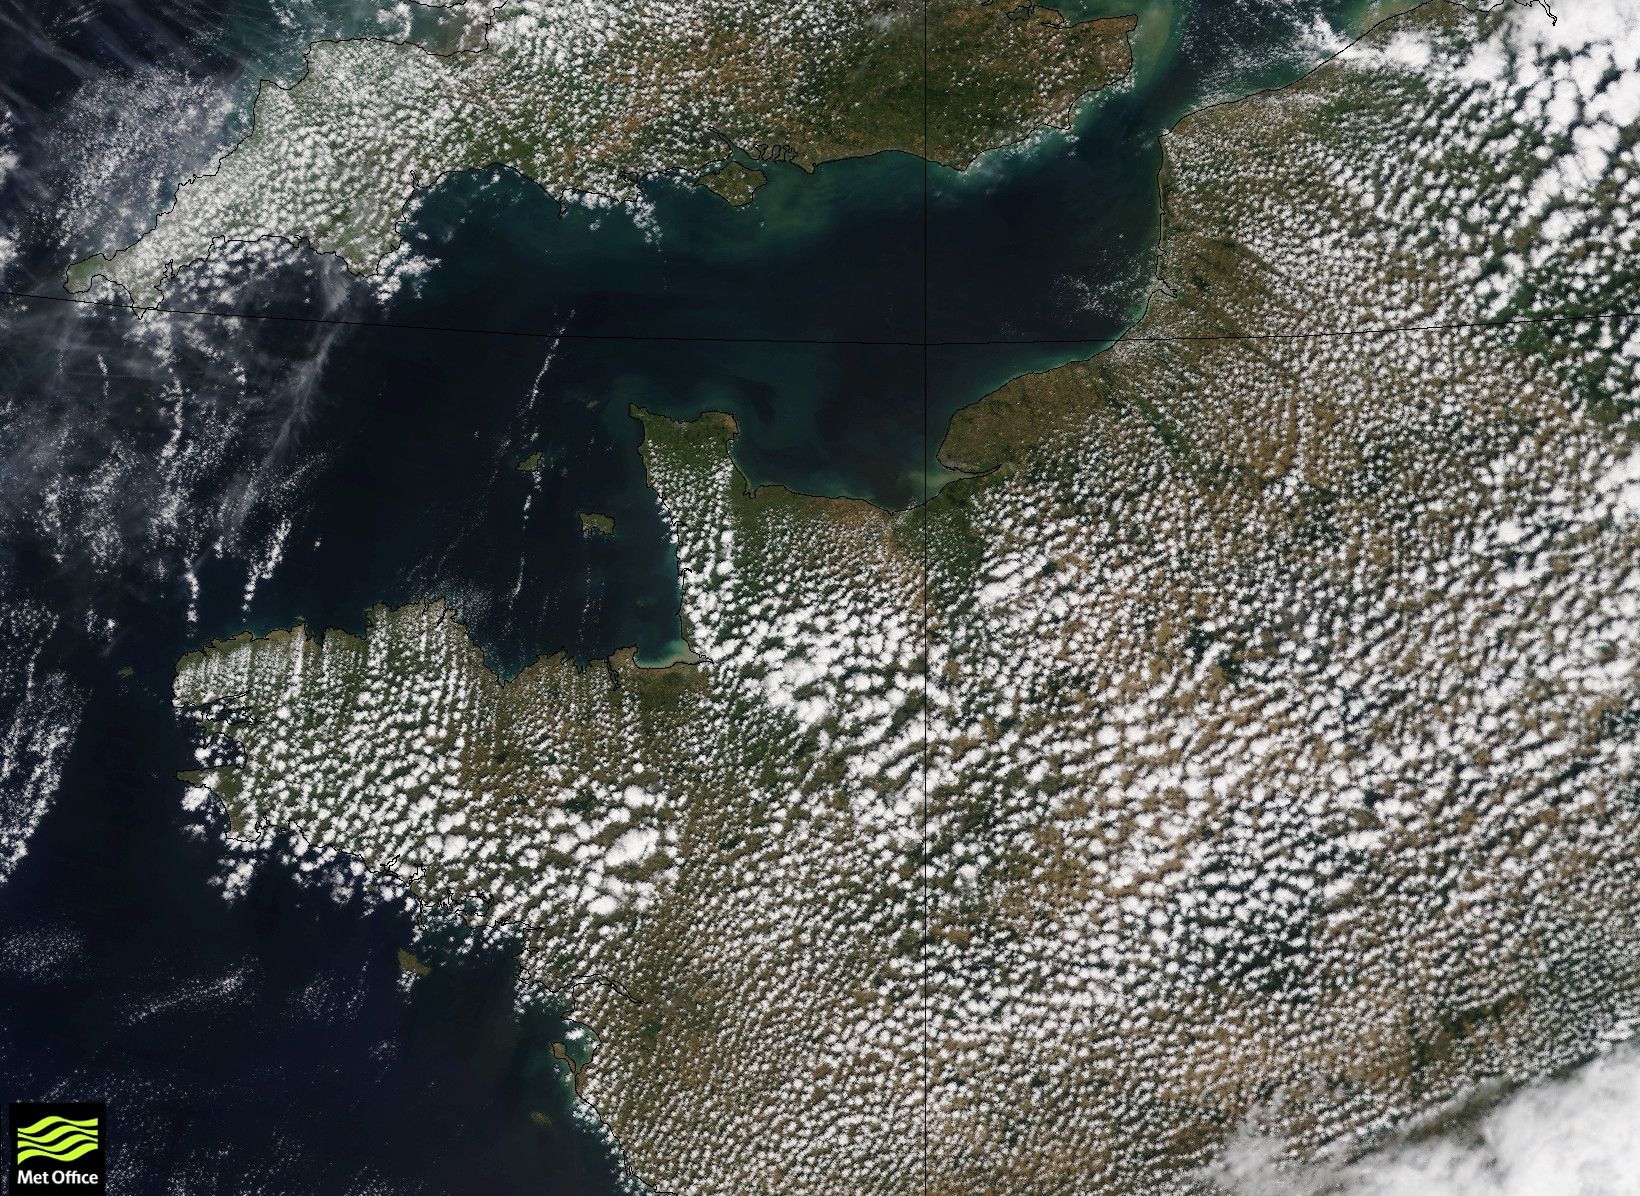
As cool air comes south-eastwards over the English Channel and into the north coast of France it is heated by the landmass and starts to form small cumulus clouds (initially giving the 'polka-dotting' appearance). In this satellite image the cloud cover matches the shape of the coastline with the organisation of the flow into the visible 'streets' likely aided through convergence caused by the local directional changes of the coastline.
The clouds are initially triggered by bubbles of warmer air rising, probably from small hills near the coast. The clouds then tend to become organised into lines along the airflow and as the cumulus clouds move further inland they become deeper and form into the larger more 'blobby-looking' open cells. What we see on this satellite picture is a reason why in relatively cool air-masses in spring and summer, coasts exposed to the breeze can enjoy the most sunshine.
This true-colour image comes from MODIS (Moderate-resolution Imaging Spectroradiometer) onboard the NASA Terra polar-orbiting satellite a research satellite that is just over 700 km above the surface of the Earth. The image is from 11:11 UTC on 9 August 2016 and the data was collected directly from the satellite at the Met Office using our satellite receiving station.
Credits:- Image: Met Office, Data: NASA
June 2016
Phytoplankton blooms in the North Sea
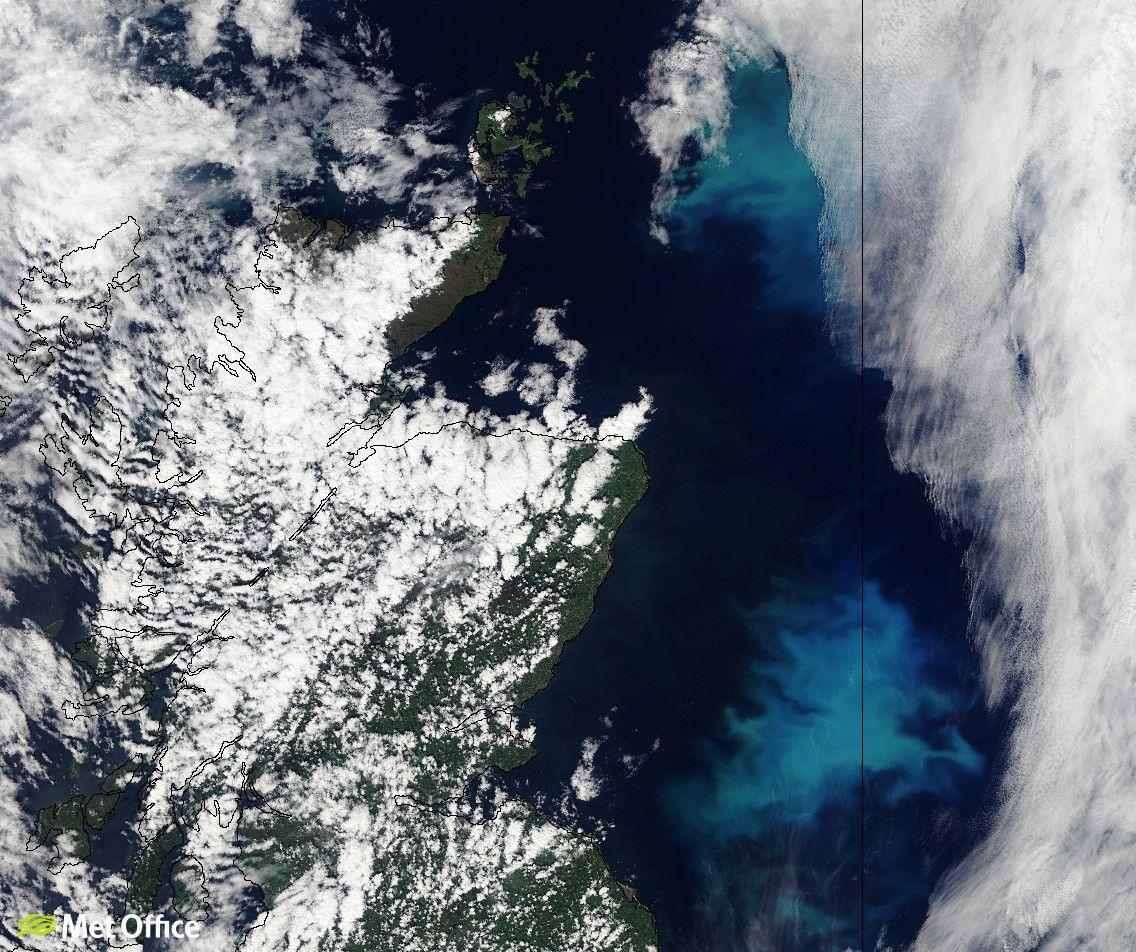
This image shows large blooms of microscopic phytoplankton in the North Sea off the coast of Scotland and north-east England. These blooms occur every year in June/July as light levels increase due to the longer days.
This image comes from the NOAA/NASA Suomi-NPP satellite which is a polar orbiting satellite which collects data while circling the Earth passing over the north and south poles. One of the images we can create from this data is a true colour image so we can see the land, sea and clouds from space as they would appear to the human eye.
Find out more: Stunning North Sea phytoplankton bloom
Credits:- Image: Met Office, Data: NOSS/NASA
June 2016
Haboob over West Africa

In this image we can see a series of massive Haboobs, or dust storms, over the Sahara caused by the outflow of air from a series of large thunderstorms. In large storms this outflow of air can cause very strong winds at the surface which can lift dust into the atmosphere. The dust is spreading radially from the storms. We can see clouds forming at the leading edge of the dust, and atmospheric gravity waves, appearing as ripples within the dust.
This image is created to enable the easy identification of dust that has been lifted into the atmosphere. This is achieved by taking the difference of and combining satellite measurements from different infra-red wavelengths. This picks out the lifted dust as pink or purple colours that are brighter than the background. Thick ice clouds, such as the tops of very large thunderstorms, show up in red and orange colours.
This dust imagery is created at the Met Office using infra-red measurements from the SEVIRI instrument onboard the European geostationary satellite, Meteosat-10, operated by EUMETSAT. This satellite sits nearly 36,000 km above the Earth and provides imagery of the full Earth disc every 15 minutes.
Credits:- Image: Met Office, Data: EUMETSAT
May 2016
Flooding in Bangladesh - 26 May 2016
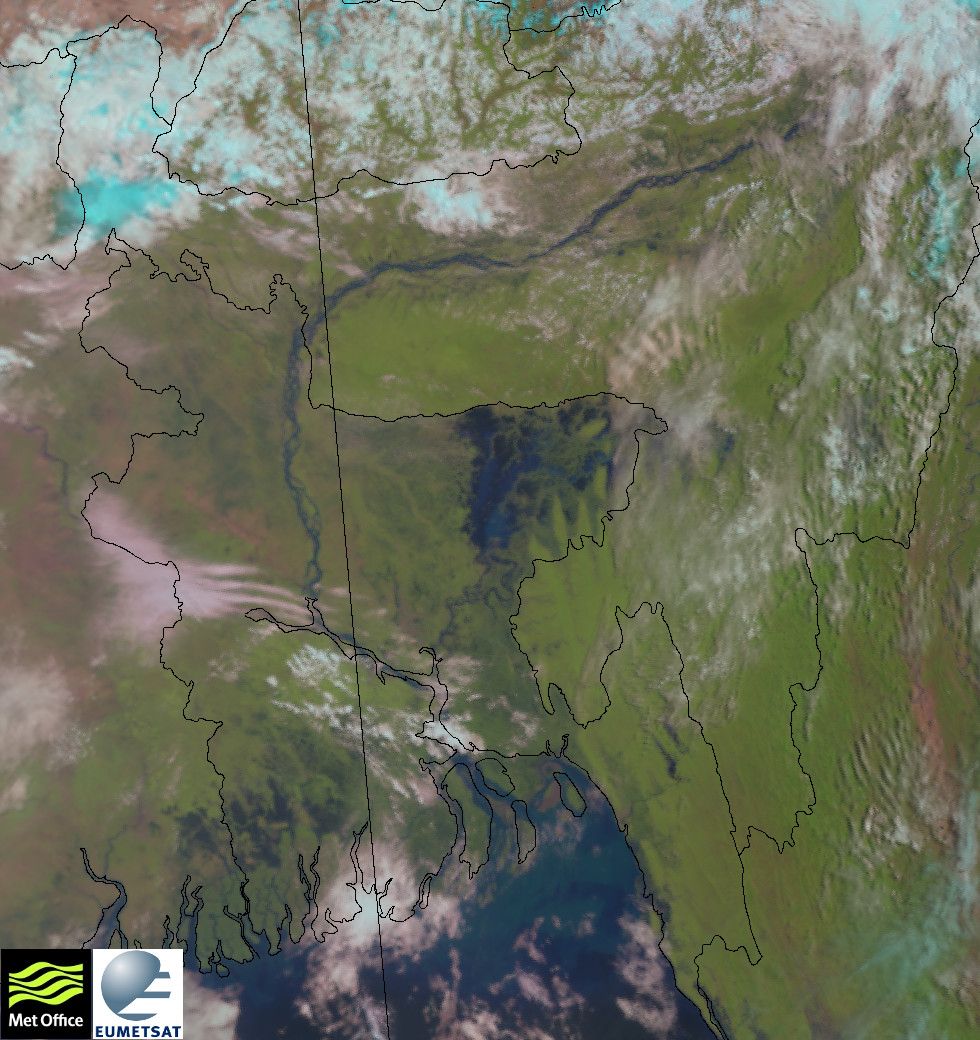
This satellite image shows the severe widespread flooding in Bangladesh after Cyclone Roanu, the first tropical cyclone of the season. It caused at least 127 deaths in Sri Lanka, and Bangladesh and brought torrential rain and severe flooding to these regions and parts of India and Myanmar.
This false-colour image comes from the EUMETSAT-operated MetOp-B satellite, a polar-orbiting satellite which orbits the earth every 101 minutes at an altitude of around 800 km at a resolution of 1 km. It was captured at 03:22 UTC on 26 May 2016.
Credits:- Image: Met Office, Data: EUMETSAT
Clear skies over the UK - 5 May 2016
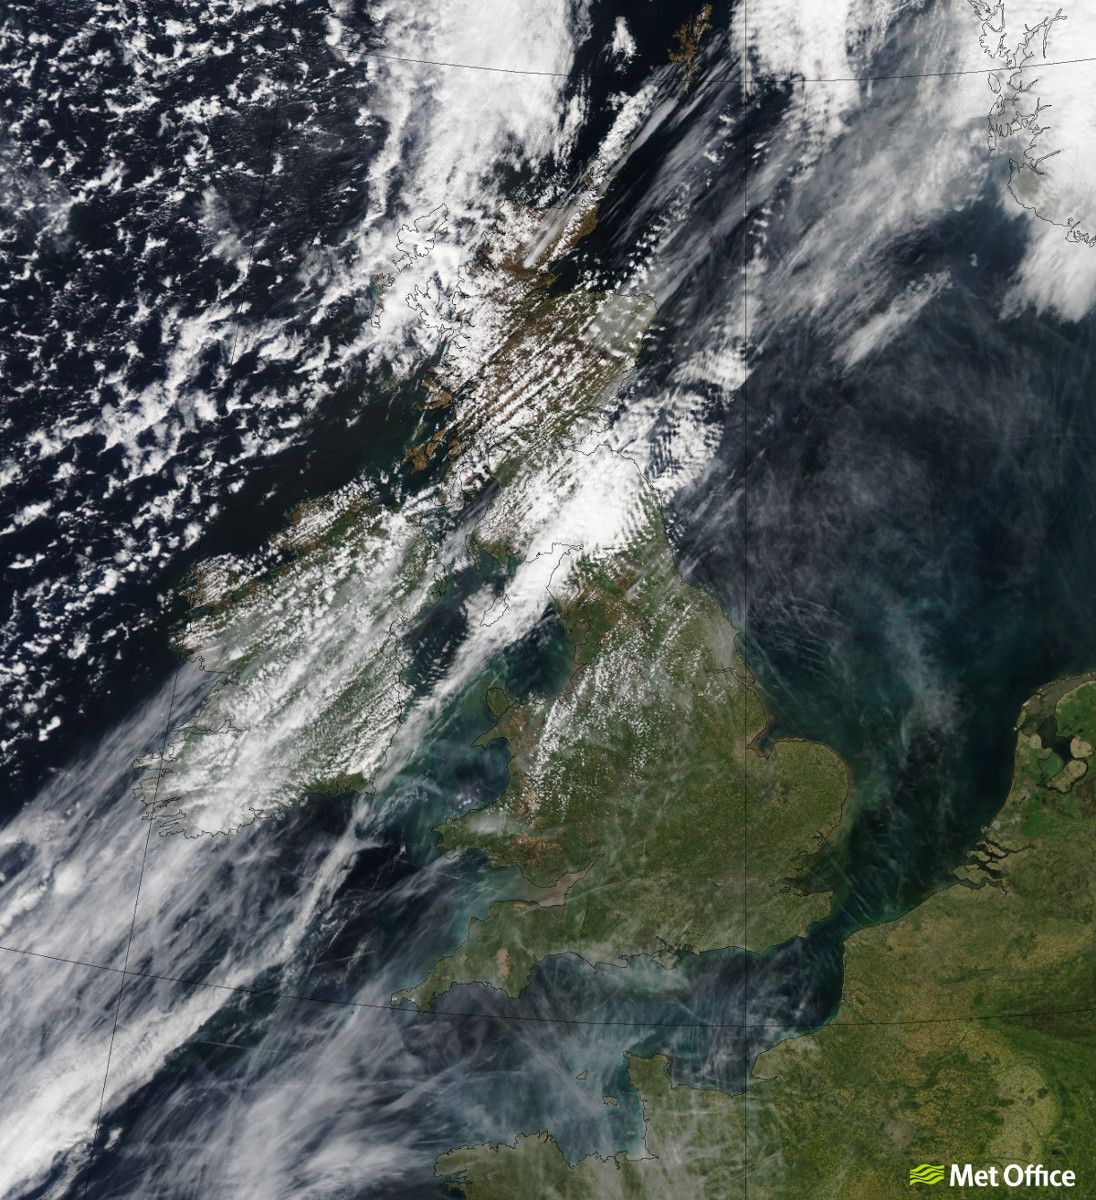
This image shows the UK enjoying clear, sunny skies and what was the warmest day of the year so far with temperatures reaching 21.5 °C in Northolt.
Image from 12:57 UTC on 5 May 2016 from the MODIS instrument onboard NASA's Aqua satellite. Aqua is a polar orbiting satellite operating at around 700 km above the Earth giving us 500m resolution true-colour satellite imagery.
Credits:- Image: Met Office, Data: NASA
April 2016
Tropical Cyclone Fantana - 14 April 2016
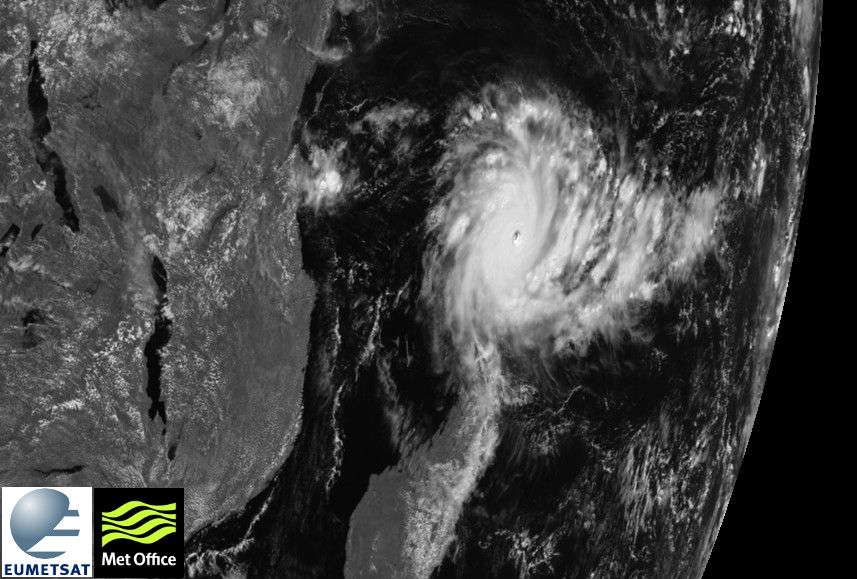
A high-resolution visible view of the very intense Tropical Cyclone Fantana over the Indian Ocean from Meteosat-10, a European geostationary satellite operated by EUMETSAT at nearly 36,000 km altitude.
Captured at 06:00 UTC on 14 April 2016 because of the viewing angle of the satellite it is possible to see some of the vertical structure of the storm clouds in the spiral arms of the cyclone as well as the eye of the storm. At this point the Tropical Cyclone is still intensifying and has sustained wind speeds of 120 mph. By 10:00 UTC on 18 April 2016 to the North of Madagascar the cyclone neared peak intensity with gusts of up to 220 mph and maximum sustained wind-speeds of 175 mph.
Credits:- Image: Met Office, Data: EUMETSAT
March 2016
Total eclipse over Indonesia - 8 March 2016
The total eclipse shows as the shadow of the moon cast on the earth. The imagery uses false-colour visible images. These look similar to how it would appear to the human eye, except the ice clouds show up as a cyan colour.
The satellite is the newest and most advanced geostationary weather satellite, Himawari-8, launched in October 2014 to an altitude of just under 36,000 km.
Credits:- Video: Met Office, Data: JMA
February 2016
Northern lights across the north of the UK - 3 February 2016
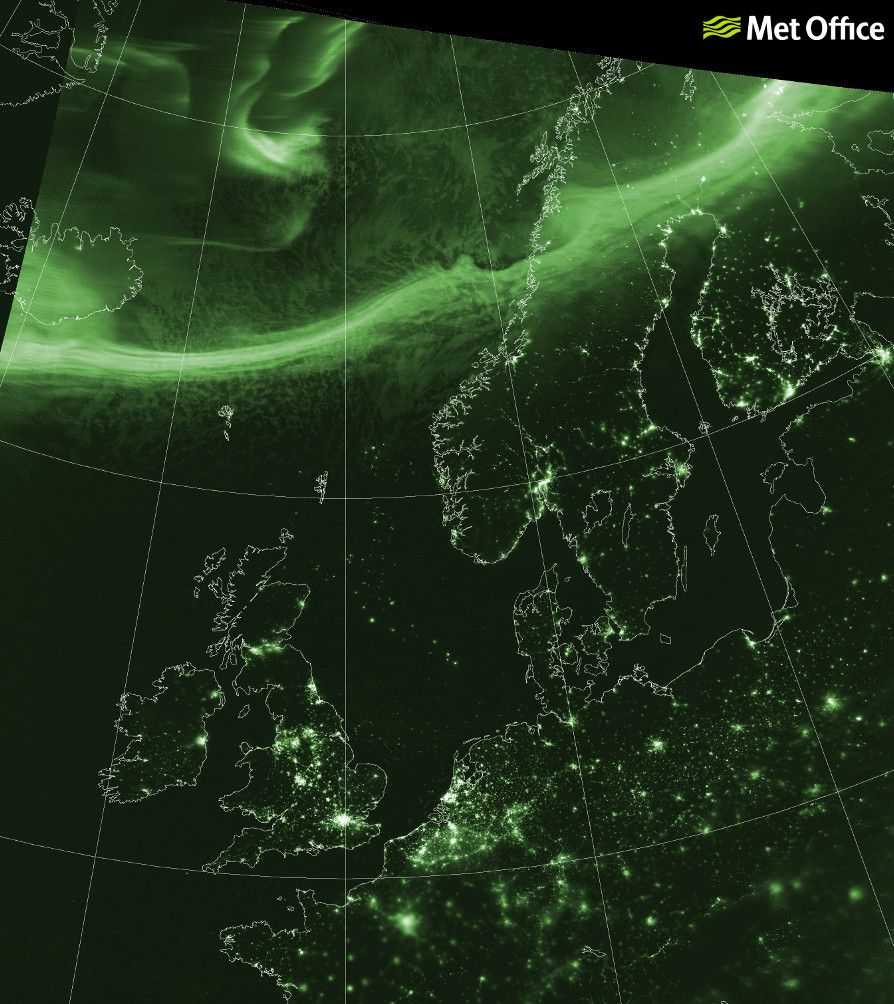
This low light level image is from the VIIRS instrument on the NOAA/NASA Suomi-NPP satellite (polar-orbiter) taken at 01:51 UTC on this February morning. It shows the Aurora to the North of the Faeroe Islands and over Scandinavia. Oil rig flares can be seen in the North Sea. City and road lights show up in populated areas.
Credits:- Image: Met Office, Data: NOAA/NASA
January 2016
Widespread snow after blizzard in the USA - 24 January 2016
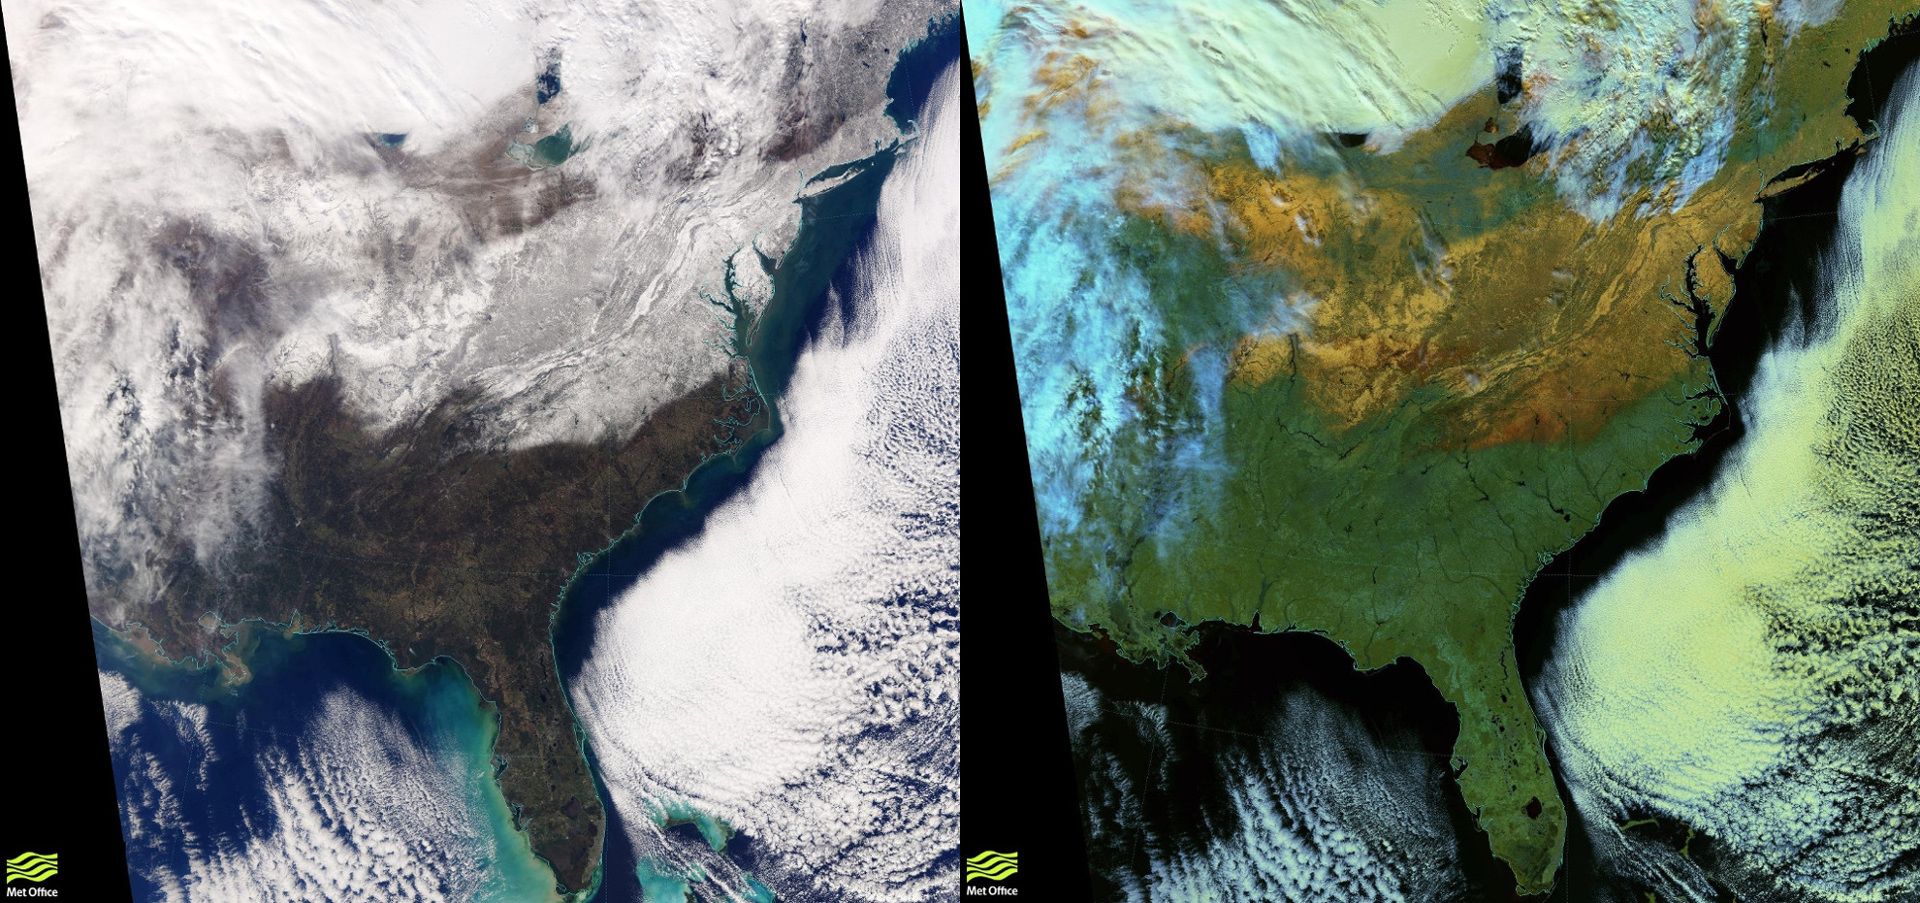
The extensive snowfall over the eastern USA on 24 January 2016 captured during a relatively clear spell following the snowstorm.
The image on the right was created from 5 near-infrared channels of the VIIRS instrument on board the Suomi-NPP polar orbiting satellite, operated by NOAA. By showing the snow as an orange colour it is possible to distinguish from the white cloud in the image (as seen in the left-hand image). This was created at the Met Office using NASA/NOAA data and an algorithm originally designed at Meteo-France.
Credits:- Image: Met Office, Data: NOAA/NASA