
Satellite image of the month - 2021
Showcasing some of the Met Office's satellite imagery from around the world showing weather in action, new views of the world and extra commentary on how we collect and create the images from our Space Applications team.
December 2021 - Fog over the UK
19 December 2021
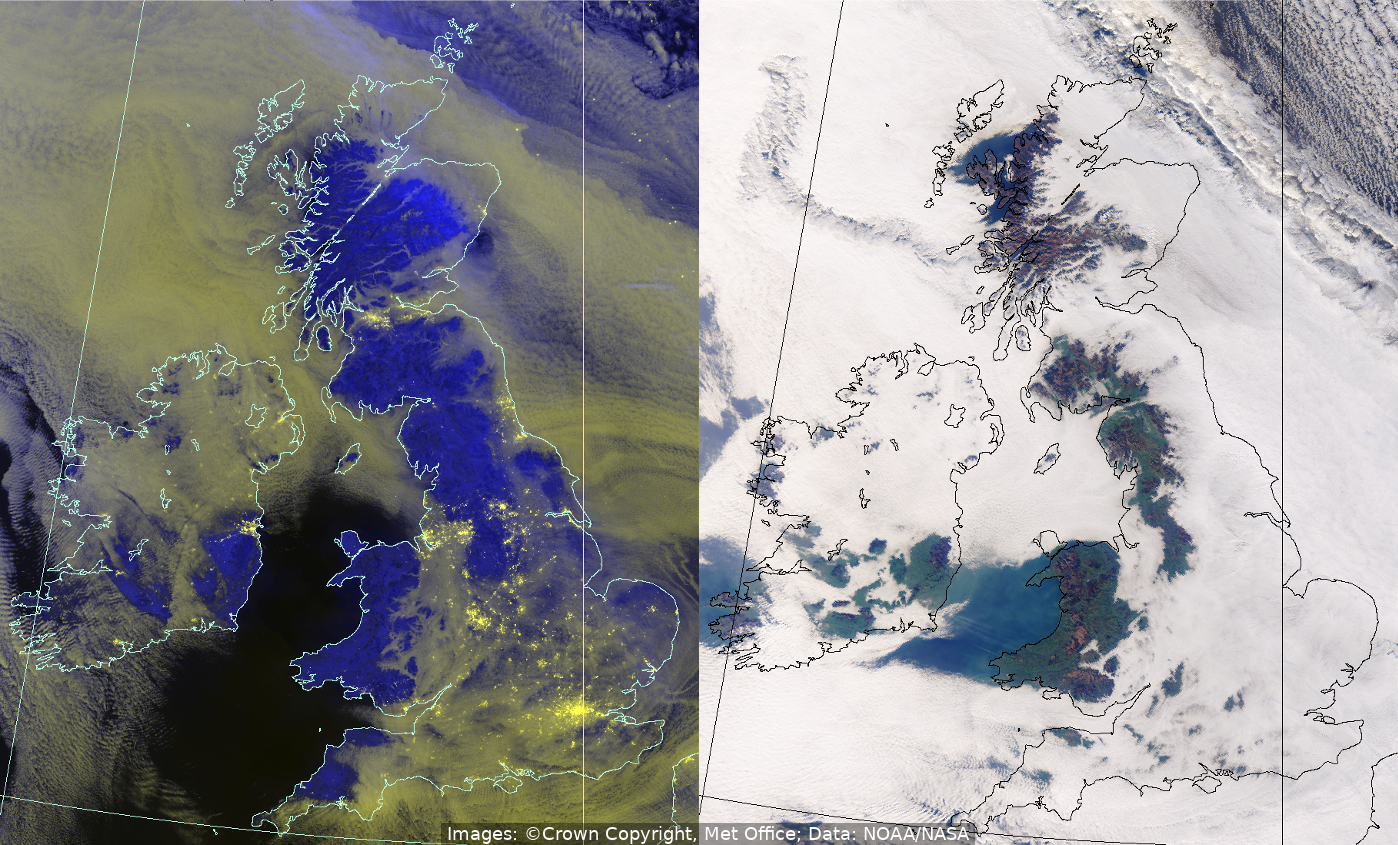
This pair of images from the VIIRS instrument on the NOAA-20 satellite shows the presence of large amounts of fog and stratus over much of the United Kingdom on the 19th December 2021. On the left-hand side is a night-time image, taken at 02:01 UTC, from the day-night band of VIIRS. This channel is able to detect very low light levels at night-time, and the fog shows up clearly from reflected moonlight in this example (while emitted light from towns, cities and North Sea oil platforms is also seen). In particular, the fine details of localized valley fog is evident around the Wales/England borders and much of central and eastern Scotland. The true-colour image on the right-hand side is taken around 10 hours later at 11:50 UTC, using three of the VIIRS visible bands, and shows how the fog has persisted and developed during this time.
November 2021 - Final Metop-A overpass received at the Met Office
15 November 2021
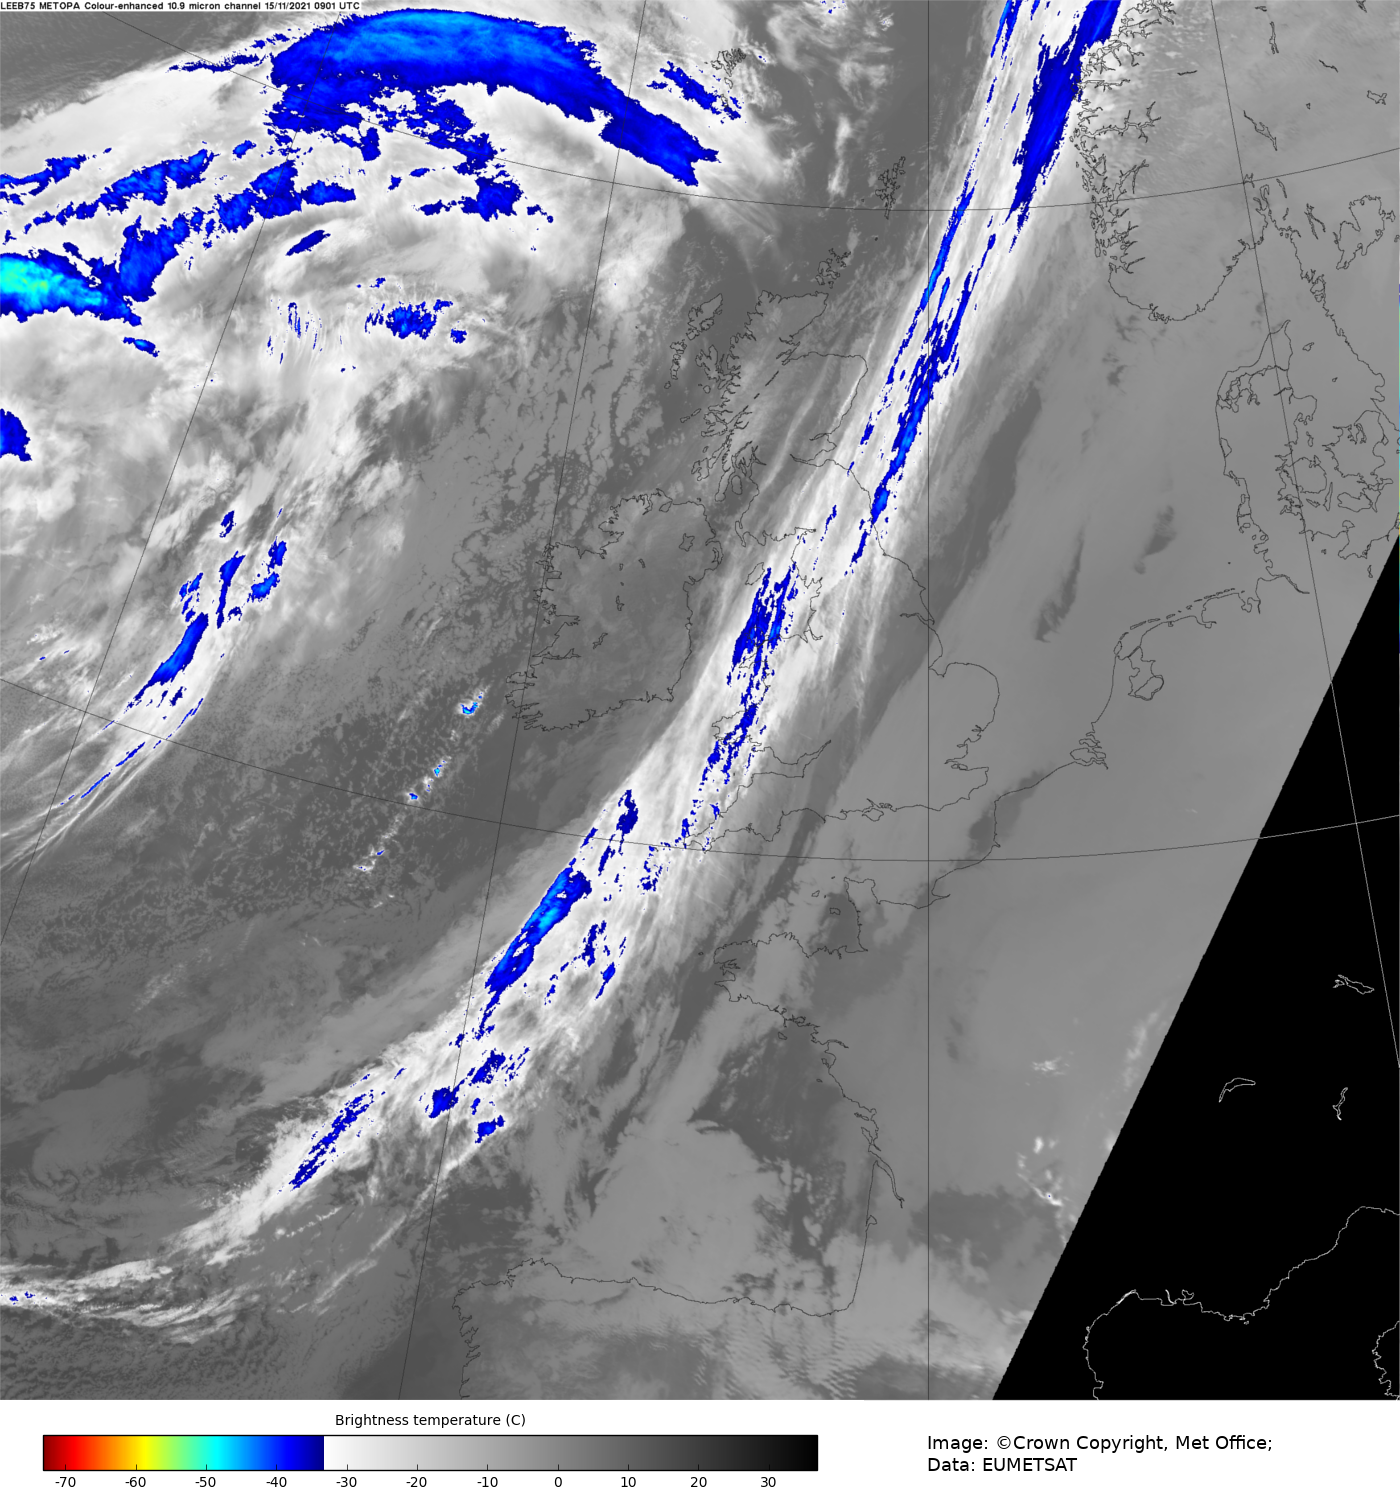
Europe's first operational polar-orbiting weather satellite, Metop-A, was withdrawn from service on 15th November 2021, after a succcessful 15-year lifetime. The image above shows a view of the UK using one of the AVHRR imager's thermal infrared channels, the data coming from the very final Metop-A overpass received at the Met Office, at around 9 o'clock in the morning.
As well as images such as the above, Metop-A has also provided data which have been fundamental to improvements in the accuracy of our Numerical Weather Prediction forecasts since its launch in 2006. The two other satellites that constitute the EUMETSAT Polar System, Metop-B and Metop-C, remain in orbit and are expected to operate until 2027 and into the 2030s, respectively.
Learn more about the de-orbiting of Metop-A.
Credits: Image: © Crown copyright, Met Office, Data: EUMETSAT
September 2021 - Typhoon Mindulle
26 September 2021
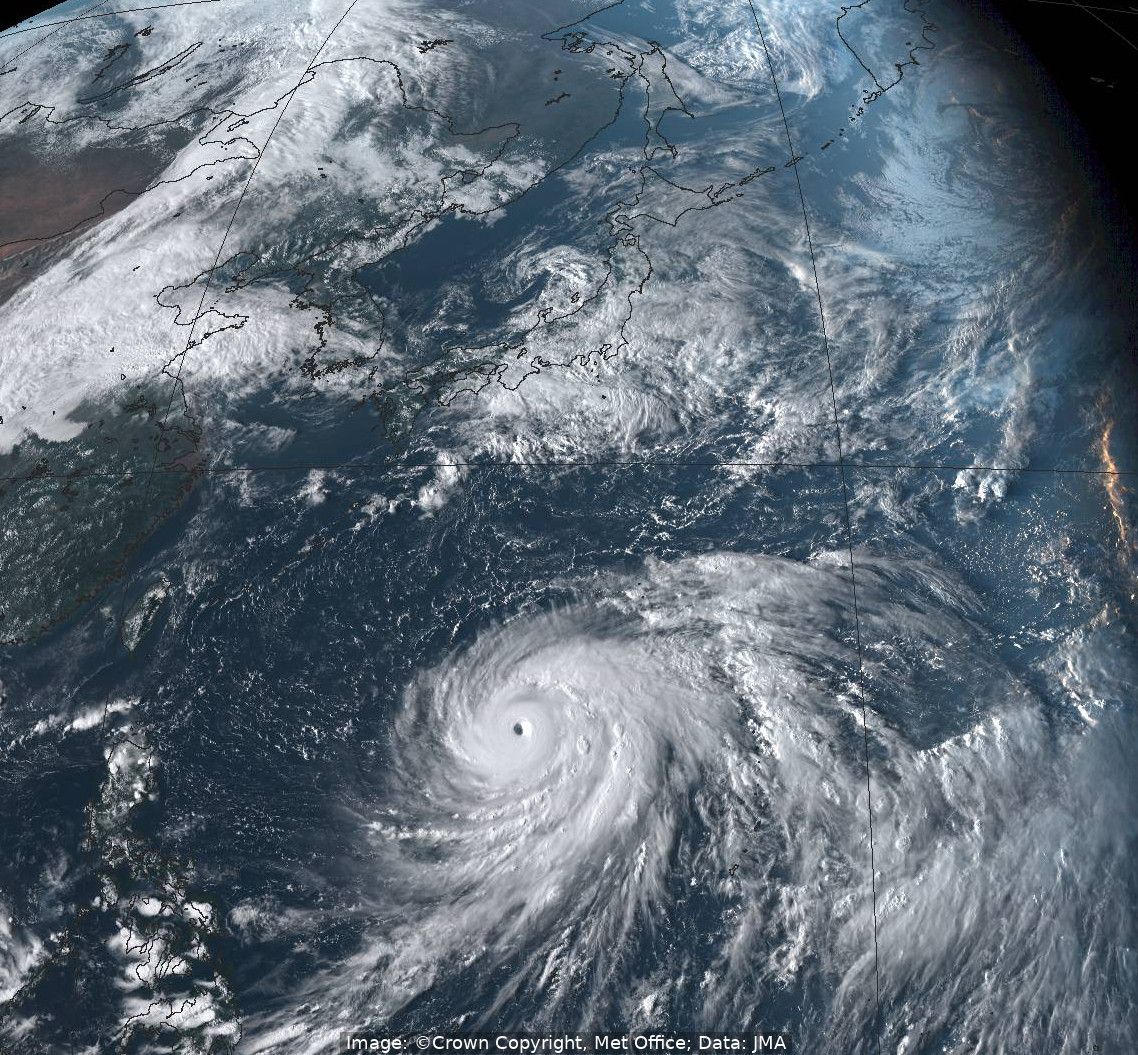
This composite image, taken from three of the visible channels on the Japanese Himawari-8 imager AHI at 07:00 UTC on the 26th September 2021, shows Typhoon Mindulle passing across the western Pacific south of Japan. At this time, it was classed as a Category 5 super typhoon, and the imagery shows that it had by then developed a well-defined eye. Although the typhoon weakened during subsequent days, it still brought violent winds and heavy rain to the Izu Islands and the east coast of Japan, disrupting train services and causing Japan Airlines to cancel over 100 flights.
July 2021 - Pyrocumulonimbus over British Columbia wildfires
1 July 2021
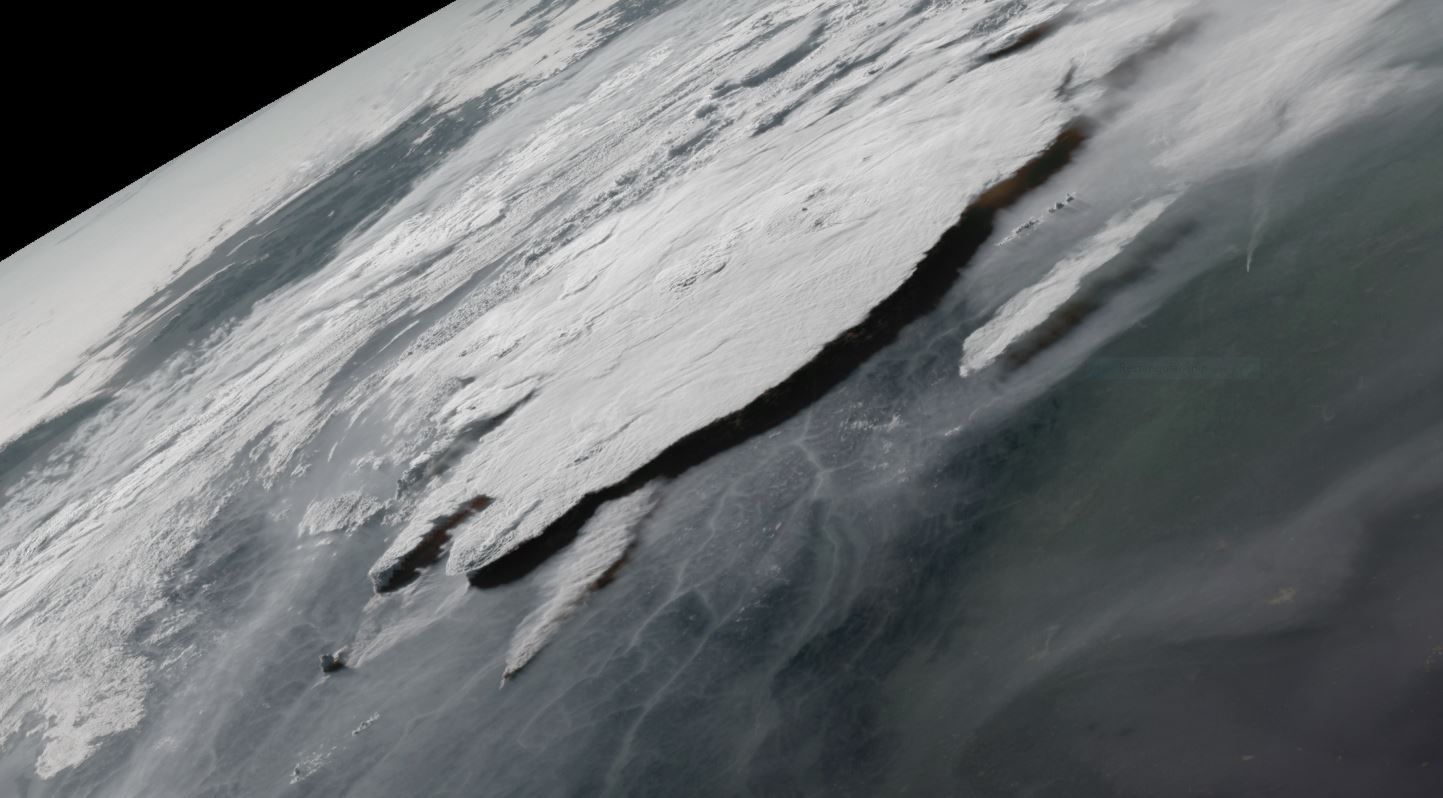
A record-breaking heatwave in late June and July affected many parts of Western North America as well as parts of Russia and Europe. Temperatures reached 49.6C in Lytton, British Colombia and wildfires broke out in many places.
This image from near the edge of the GOES East field of view shows multiple huge pyrocumulonimbus plumes developing from the heat of these fires in British Columbia on 1st July. The viewing geometry and the time of day means it's possible to see a side-on view of these huge plumes accentualted by the shadows cast by them on the surrounding smoke covered landscape, even from over 35,000 km above the Earth.
Credits: Image courtesy of NOAA / RAMMB / CIRA
May 2021 - Saharan dust over UK
21 May 2021
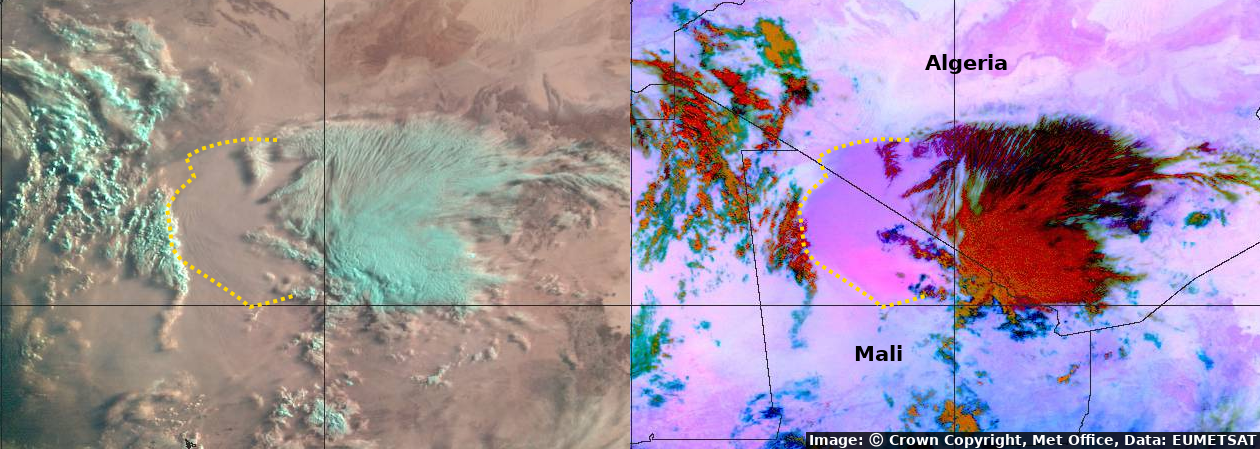
These two images both detected by EUMETSAT's Spinning Enhanced Visible and InfraRed Imager (SEVIRI) on Meteosat-11 show simultaneous views of a 'Haboob', or dust storm, generated by a large convective storm over Algeria and Mali.
The image on the left uses visible and near-infra red channels of the instrument and gives an image similar to what could be seen with the naked eye, the main difference being that ice cloud shows up as a cyan colour. The image on the right is a 'Dust RGB' which uses information from infra-red channels on the instrument. Dust in the atmosphere shows up as bright pink/magenta colour which stands out against the muted pink and purple colours of the desert surface. Thick cloud appears in red/orange colours.
The leading edge of the expanding dust storm can more easily be made out in the Dust RGB. In both images this has been marked with a yellow dashed line. At the leading edge of this ‘dust front’ new clouds form as air is pushed upwards. These in turn can sometimes develop into storms and generate new haboobs in a chain reaction. In the left image ripples, known as gravity waves, can be seen in the airborne dust.
Credits: Image: © Crown copyright, Met Office, Data: EUMETSAT
April 2021 - Saharan dust over UK
1 April 2021
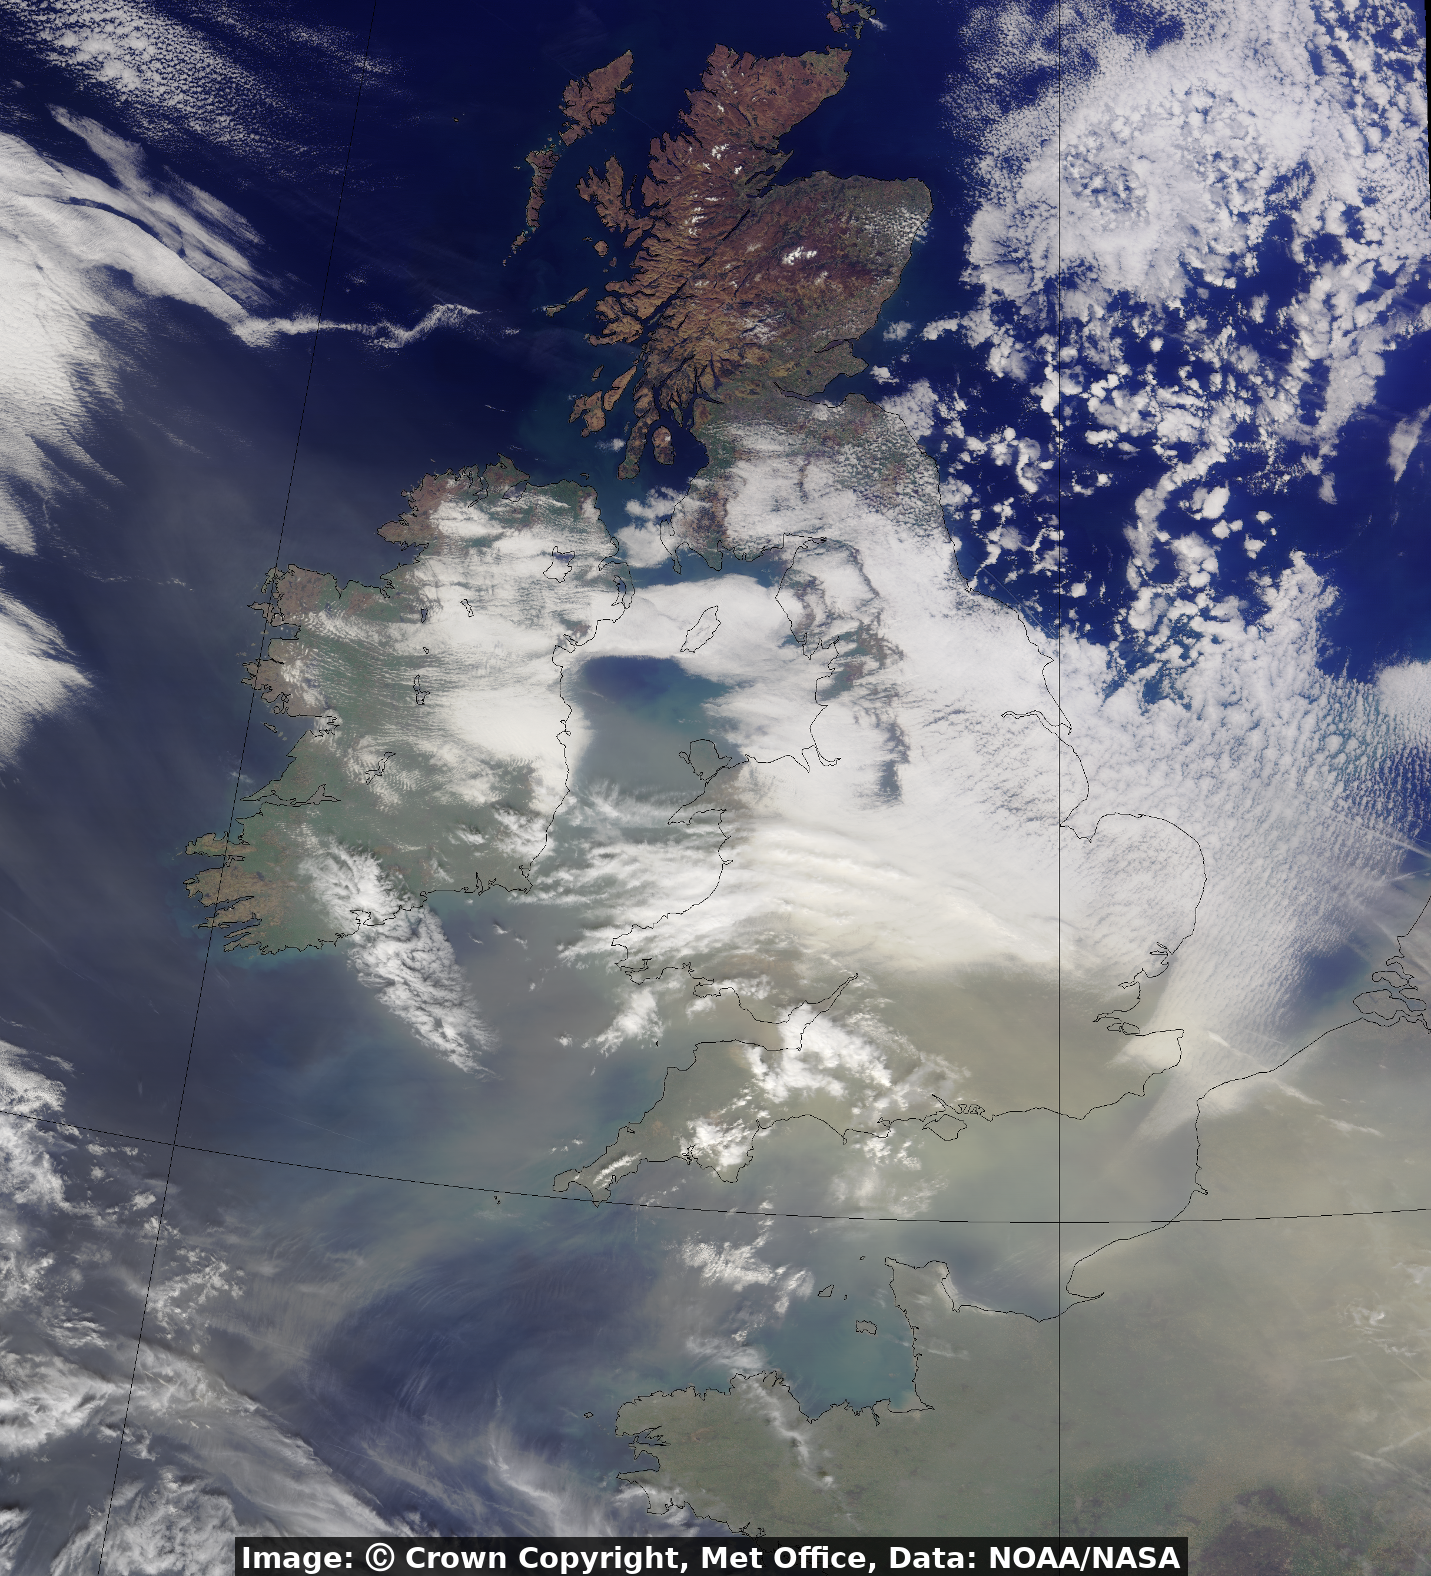
Desert dust, stirred up by storms in the Sahara desert, is carried over the UK by the wind. On 1st April large quantities of dust reached the UK and can be clearly seen in this true colour satellite image from the NASA/NOAA operated satellite NOAA-20.
Learn more about Saharan dust.
Credits: Image: © Crown copyright, Met Office, Data: NOAA/NASA
February 2021 - Etna eruption
23 February 2021
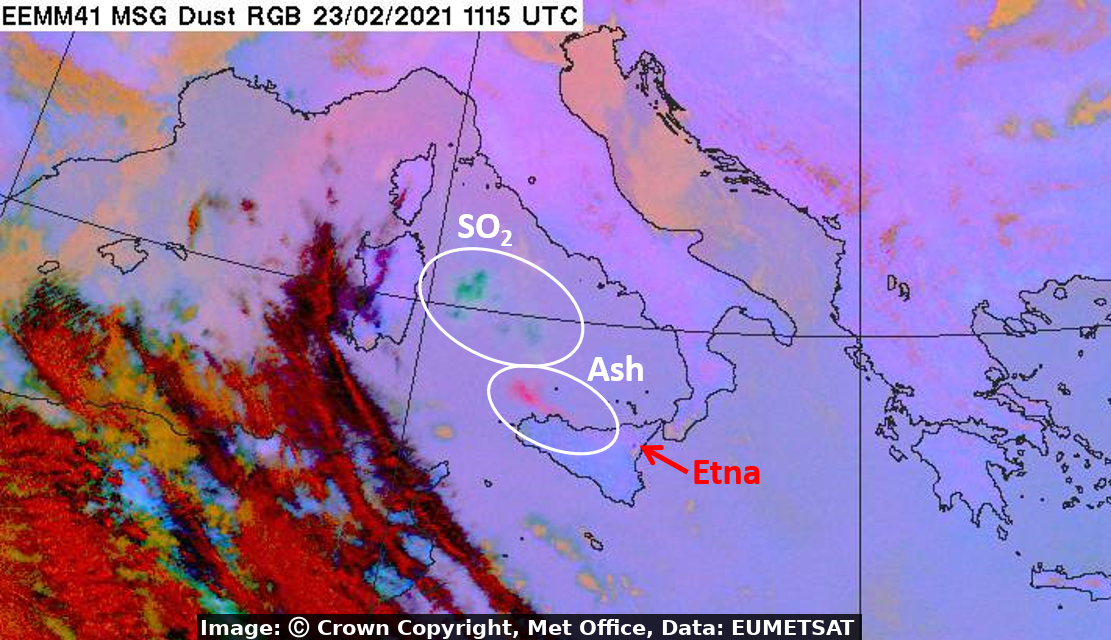
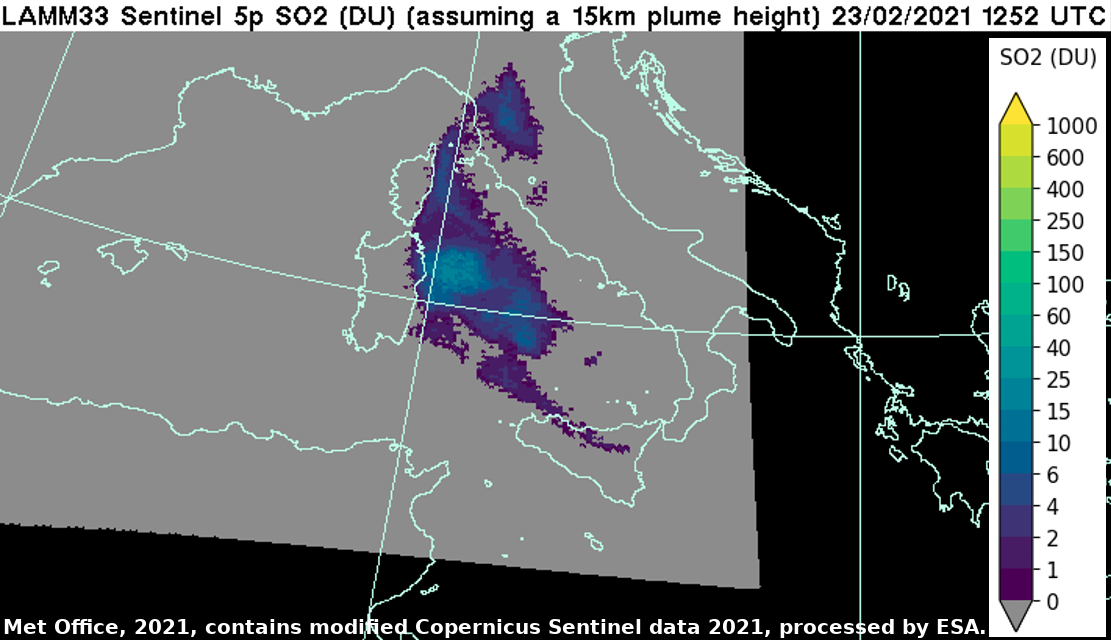
Mount Etna is one of the most active volcanoes in the world. Eruptive episodes happen extremely frequently resulting in the ejection of lava, volcanic ash and SO2 into the atmosphere. On February 16th a series of eruptive episodes began which resulted in significant amounts of SO2 being emitted in separate events over a succession of days (ongoing at the time of writing). Sulphur dioxide is a toxic gas, and concern is rising about its impact on aircraft occupants. Within the framework of the International Civil Aviation Organization, the Met Office has been invited to trial a global SO2 forecasting capability.
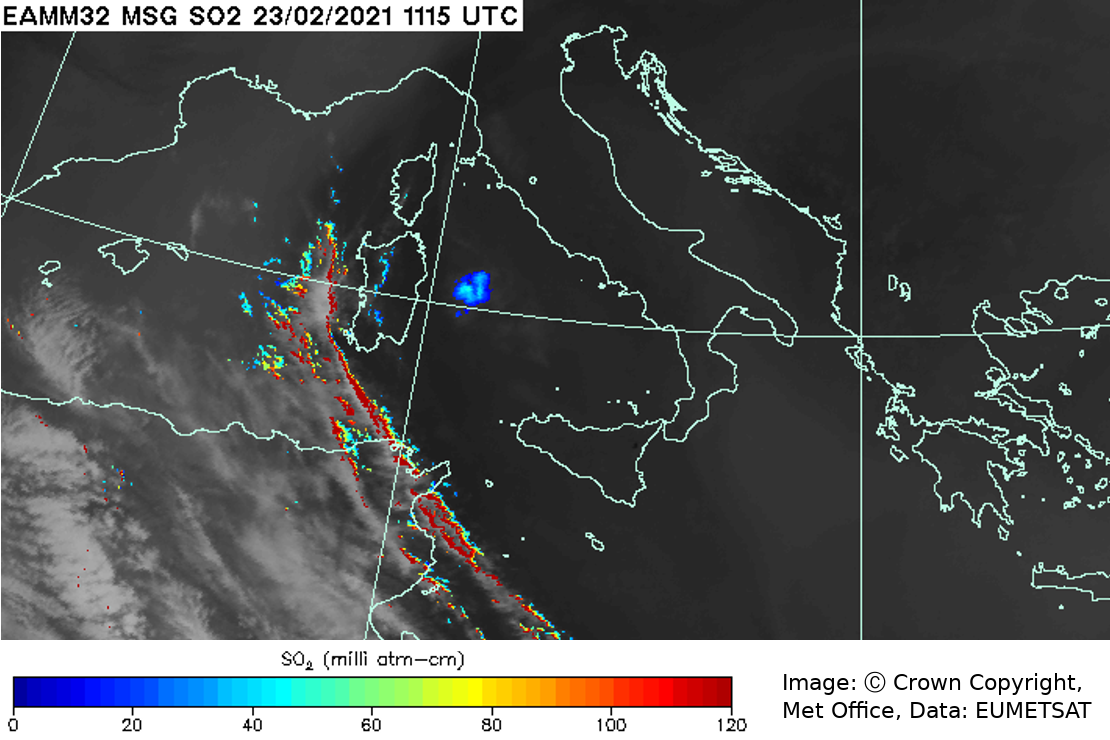
Here we have 3 images displaying the SO2 plume from the 23rd February. The first two images are from the SEVIRI instrument on MSG, which as a geostationary satellite is able to capture the plume every 15 minutes. The images chosen are the Dust RGB, which has IR channels chosen to highlight desert dust, but is also useful for identifying volcanic ash and SO2. In this example ash shows up as a pink area to the north-west of Sicily and SO2 in a green colour between Sicilyand Sardinia. The second image utilises the absorption of SO2 in the SEVIRI channels around 7.3 μm and 8.7 μm to detect the SO2 and estimate the column loading. The third image is from Sentinel-5P which, as a polar satellite utilising visible light, is only able to view a given location once a day. However, the advantages of the polar product can be seen in the lack of noise and the more complete identification of the SO2 plume.
Credits: Image 1 & 2: Ⓒ Crown Copyright, Met Office, Data: EUMETSAT. Image 3: Met Office 2021, contains modified Copernicus Sentinel data 2021, processed by ESA.
January 2021 - Snow across Iberian Peninsula
11 January 2021
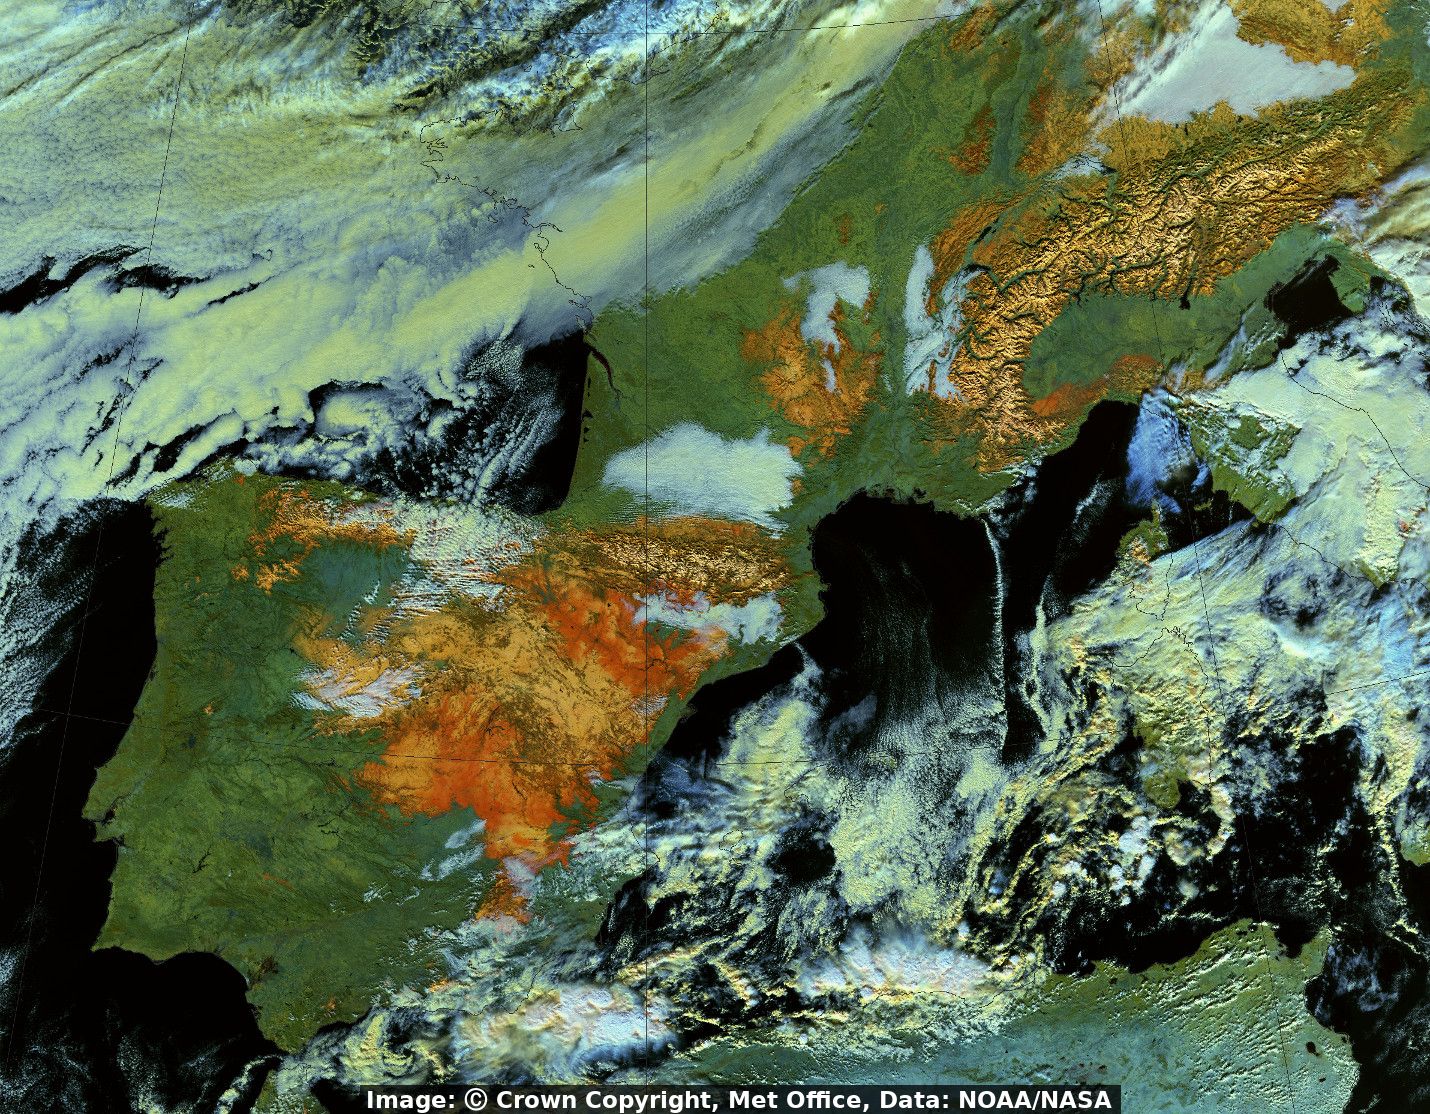
An area of low pressure, named 'Filomena' by Spain's meteorological agency passed over the Iberian Peninsular between January 8th and 10th bringing unusually high snow amounts to parts of Spain and Portugal. Residents of Madrid saw the deepest snow accumulations in the city for over 50 years with 50-60 cm of snow lying in some parts. Relatively cloud-free conditions on January 11th allowed this image to be captured by the NASA/NOAA operated Suomi-NPP satellite, showing the extent of the snow cover over Portugal, Spain and other European counties. This image type uses measurements from the near-infra-red part of the spectrum. This type of false-colour image highlights where snow is lying on the ground as it appears in a bright orange colour. This allows it to be easily differentiated from the white cloud.
Credits: Image: © Crown copyright, Met Office, Data: NOAA/NASA