Met Office
  • Weather & climate
  • Research programmes
  • Services
  • About us
Met Office
chevron Back
Weather & climate
Everything you need to know about the forecast, and making the most of the weather.
  • Find a forecast
  • Warnings & advice
    Warnings & advice
    • UK weather warnings
    • UK Storm Centre
    • Seasonal advice
  • Maps & charts
    Maps & charts
    • UK forecast
    • UK weather map
    • Cloud cover map
    • Precipitation map
    • Rainfall map
    • Temperature map
    • Wind map
    • Wind gust map
    • Surface pressure charts
    • All countries
  • Climate
    Climate
    • Climate explained
    • What is climate change?
    • Causes of climate change
    • Effects of climate change
    • Climate change questions
    • UK climate
    • Climate science
    • Organisations and reports
  • Specialist forecasts
    Specialist forecasts
    • Coast and Sea
    • Mountain
    • Space Weather
  • Learn about...
    Learn about...
    • Past UK weather events
    • Weather
    • How forecasts are made
    • Met Office for Schools
Research programmes
The latest breakthroughs, research and news from the Met Office.
  • Our approach
    Our approach
    • Overview by our Chief Scientist
    • How Met Office science is reviewed
    • Collaboration
    • Modelling systems
    • Monitoring
    • Our research staff
  • Weather science
    Weather science
    • Atmospheric dispersion and air quality
    • Space Applications and Nowcasting
    • Ensemble forecasting
    • Observations research and development
    • Ocean forecasting
    • Research to operations
    • Satellite and Surface Assimilation
    • Verification, impacts and post-processing
    • Weather science IT
  • Climate research
    Climate research
    • Climate, cryosphere and oceans
    • Climate impacts
    • Climate monitoring and attribution
    • Earth system science
    • Monthly to decadal prediction
    • UK climate maps and data
    • Understanding climate change
  • Applied science
    Applied science
    • Aviation applications
    • Climate information for international development
    • Climate security
    • Climate services
    • Defence applications
    • Post-processing applications
    • Science for Impacts, Resilience and Adaptation (SIRA)
    • Science health strategy
  • Foundation science
    Foundation science
    • Atmospheric processes and parametrizations
    • Dynamic research
    • Global modelling
    • Informatics Lab
    • Observation-based research
    • Regional model evaluation and development
  • Library
  • News
Services
Support your business with world-leading science and technology.
  • Government
    Government
    • Defence and security
    • Devolved administrations
    • Environmental Hazard and Resilience Services
    • International development
  • Transport
    Transport
    • Aviation commercial
    • Aviation regulated
    • CAV
    • Marine
    • Rail
    • Road
  • Business & industry
    Business & industry
    • Agriculture
    • Construction
    • Energy
    • Event management
    • Legal and insurance
    • Media
    • Mining
    • Retail
    • Water
  • Data
    Data
    • Weather and climate data
  • Research & consulting
    Research & consulting
    • Access a meteorologist
    • Climate service
    • International programmes
    • Weather and climate consultancy
  • Insights
About us
Who we are, what we do and organisational news.
  • Who we are
  • Supplying the Met Office
    Supplying the Met Office
    • Advertising
    • Procurement
  • Press Office
    Press Office
    • Weather and climate news
    • Corporate news
    • News blog
    • Podcasts
    • Contact the Press Office
  • Careers
    Careers
    • Working at the Met Office
    • Your career
    • Vacancies
    • Rewards and benefits
    • Equality, diversity and inclusion
    • Apprentices, graduates and placements
  • Contact us
    Contact us
    • Contact details
    • Feedback form
    • How to find us

Met Office Logo

Tropical cyclone forecast error charts - Australian region


Tropical cyclone forecast error charts - Australian region

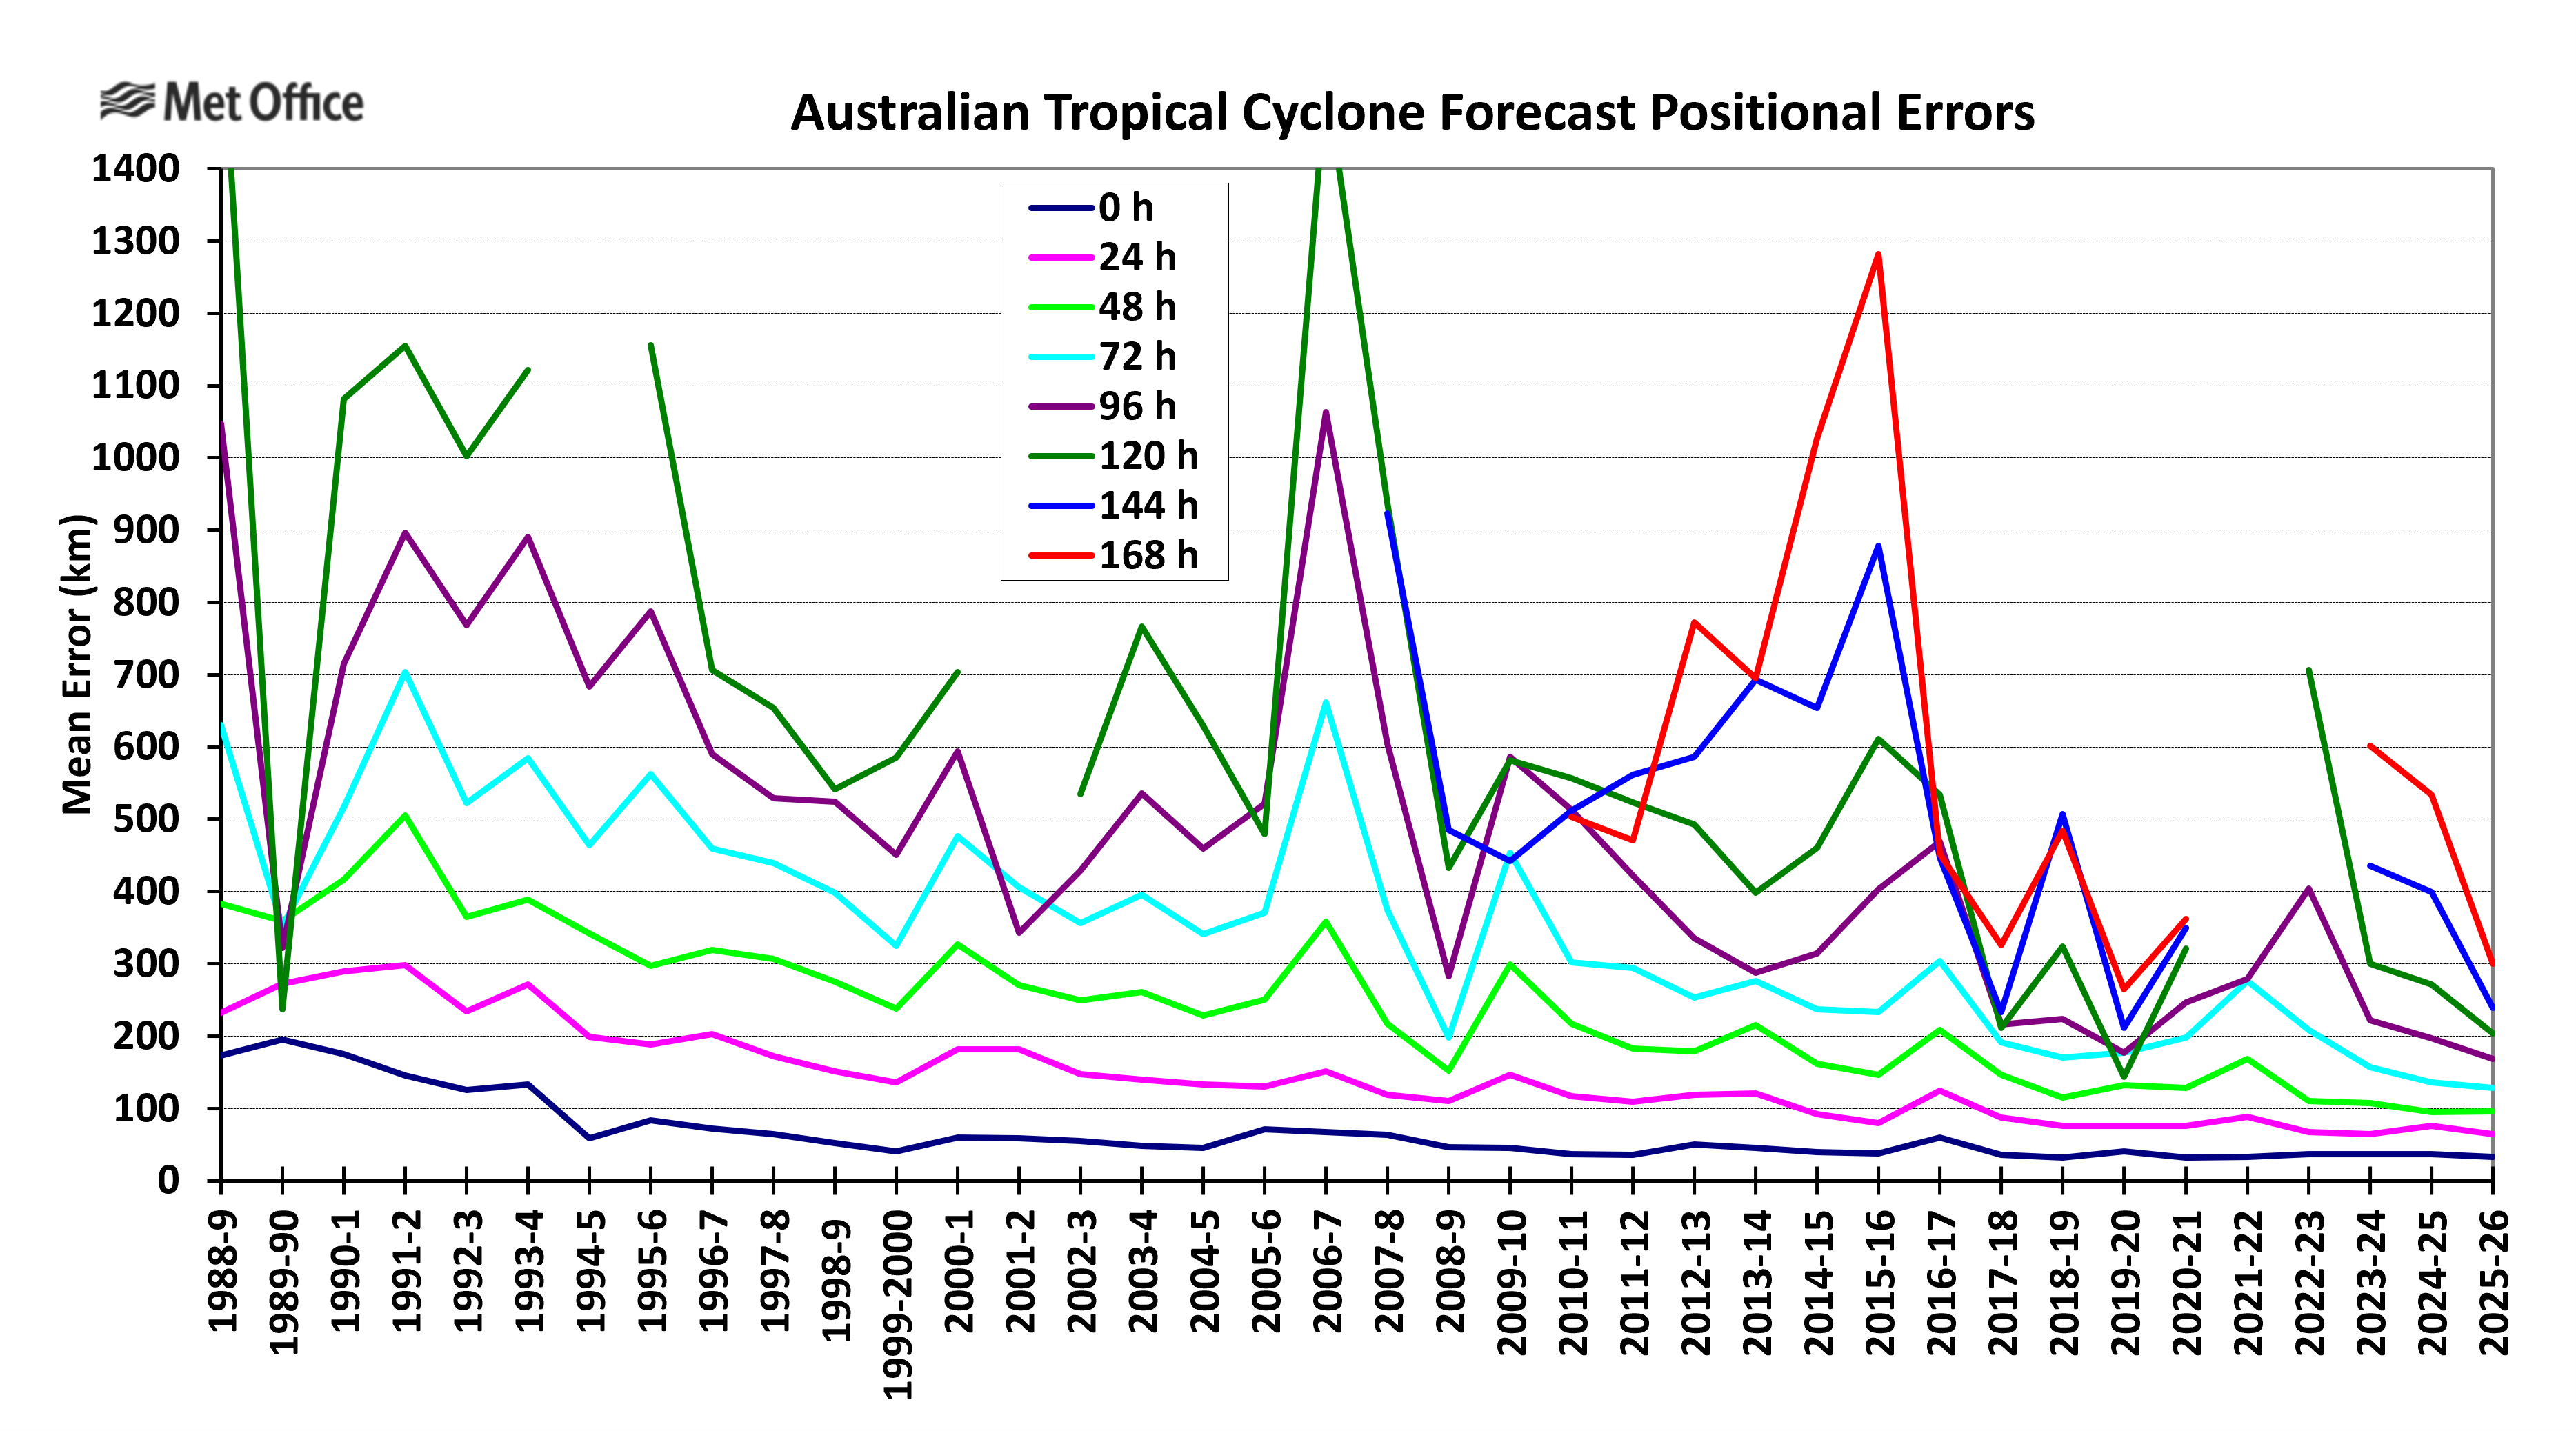
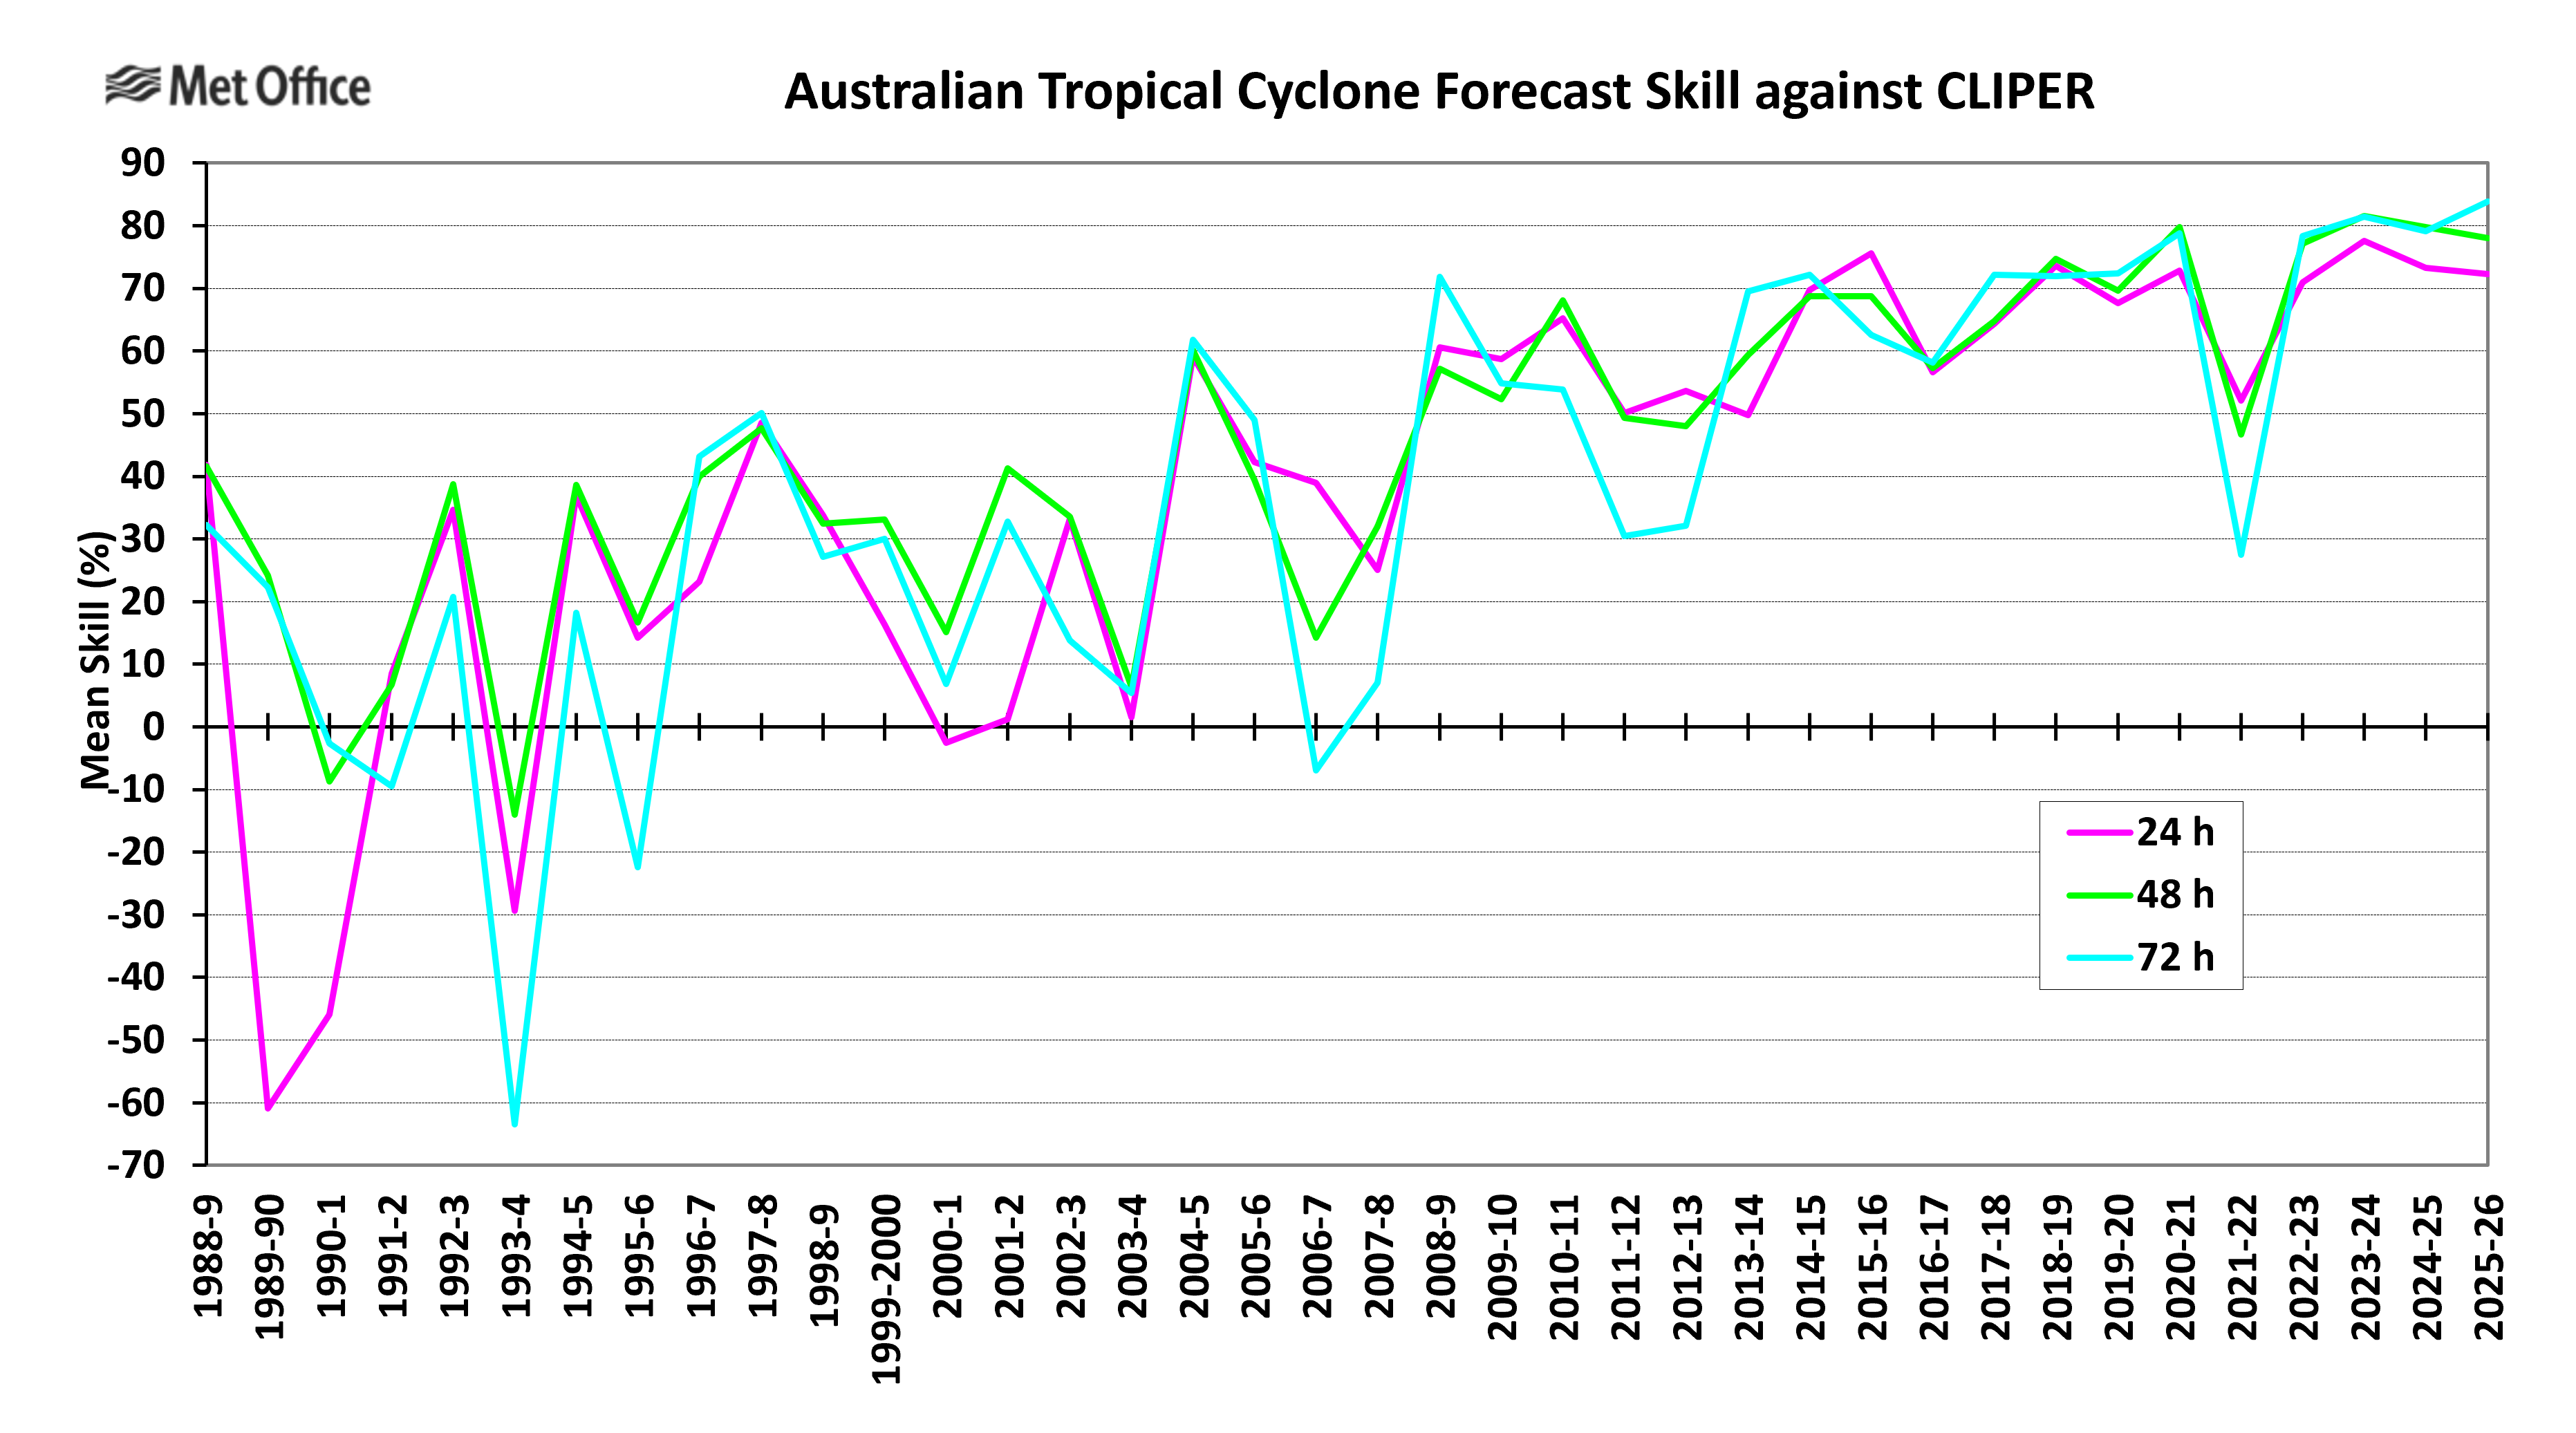
The graphs below show a variety of measures of forecast errors and forecast skill for the Met Office global model forecasts of tropical cyclones in the Australian region (south Indian Ocean west of 90 degrees east and south Pacific Ocean).

For those not familiar with the types of error statistics used in tropical cyclone forecast assessment and their sign conventions a diagrammatic explanation is available.

You might also like

  • Observed and forecast tracks: northern hemisphere 2015
    All tropical cyclones in the northern hemisphere season in 2015 are listed below including details of their start and end dates, lowest central pressure and maximum sustained wind (MSW).
    Read more
  • Tropical cyclone forecast verification - northern hemisphere 2016
    A summary of tropical cyclone activity in the Northern Hemisphere for the 2016 season together with an assessment of the performance of the Met Office global model in predicting the track and intensity of these tropical cyclones.
    Read more
  • Observed and forecast tracks: southern hemisphere 2014-15
    All tropical cyclones in the southern hemisphere season in 2014-15 are listed below including details of their start and end dates and maximum sustained wind (MSW). Qualitative comments are included on the performance of the Met O
    Read more

Help us improve our website

Take our short survey
Met Office
  • Met Office College
  • National Meteorological Library & Archive
  • Weather Observations Website (WOW)
  • Accessibility
  • Privacy policy
  • Cookie policy
  • Legal
  • Email updates
  • RSS
Get it on Google Play Download on the App Store
© Crown Copyright
Met Office Logo

© Crown Copyright