
Airfield climate data
This page displays airfield climate statistics for 48 UK airports including occurrences of Low Visibility Procedures, temperature, low cloud base, significant weather, visibility and wind.
Average conditions at the airfield have been derived which can be used as a planning tool to determine which of several airfields will best meet your requirements, or in which months it may be suitable to use a certain airfield.
This data is historical and provides an indication of average weather conditions at each site. Consequently, valid pre-flight briefing documentation still needs to be obtained for each flight.
The statistics on this page are derived from weather observations made over a number of years by meterological observers and automated weather stations at each airfield. Data from 1990 to 2021 has been used to allow comparison to the most recent climatological reference period (Charting the UK;s changing climate - Met Office). Where this full period is not available, the maximum range is used using data from METARs recorded at each airfield. The number of observations for each statistic and the period of observation is displayed on each plot individually.
The Charts
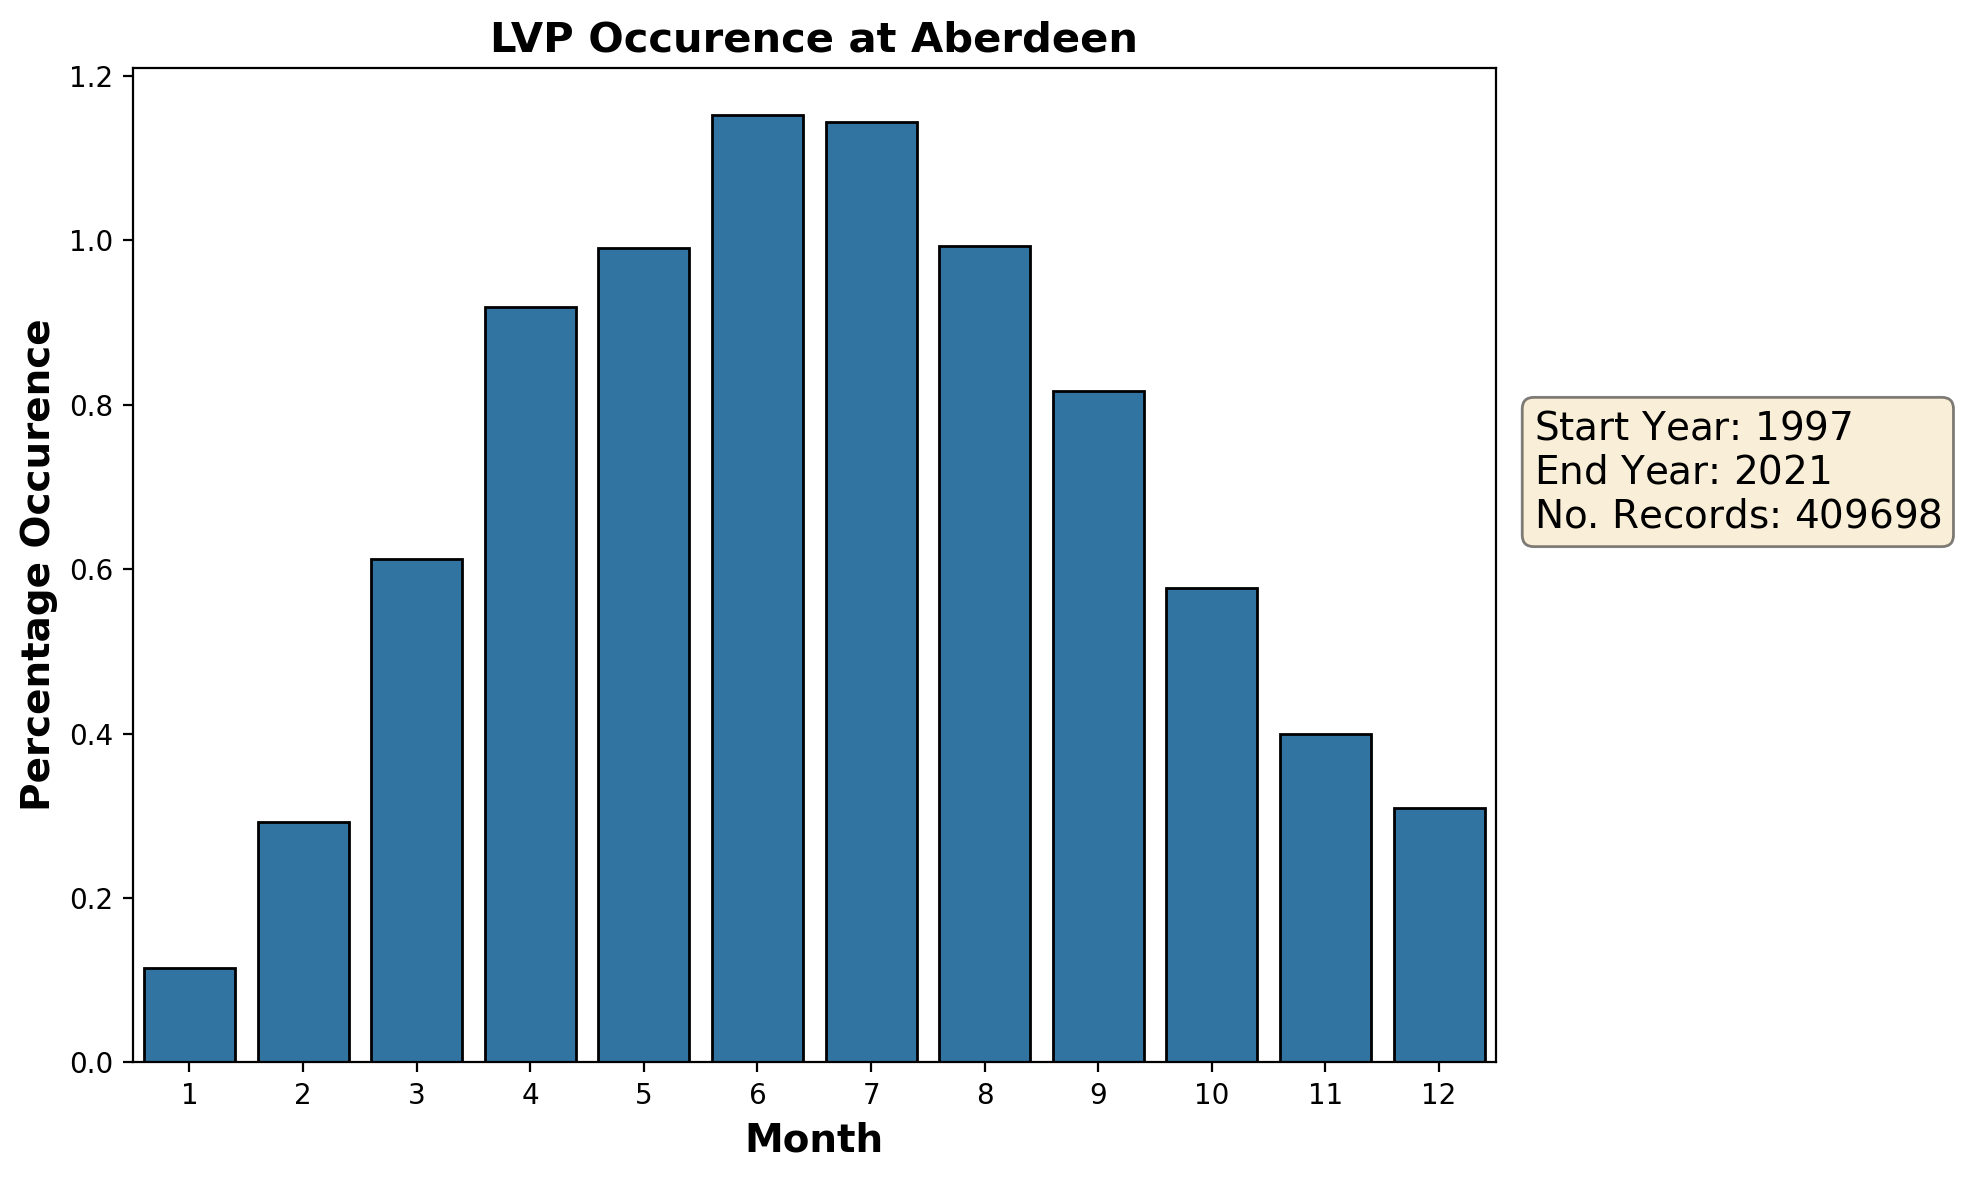
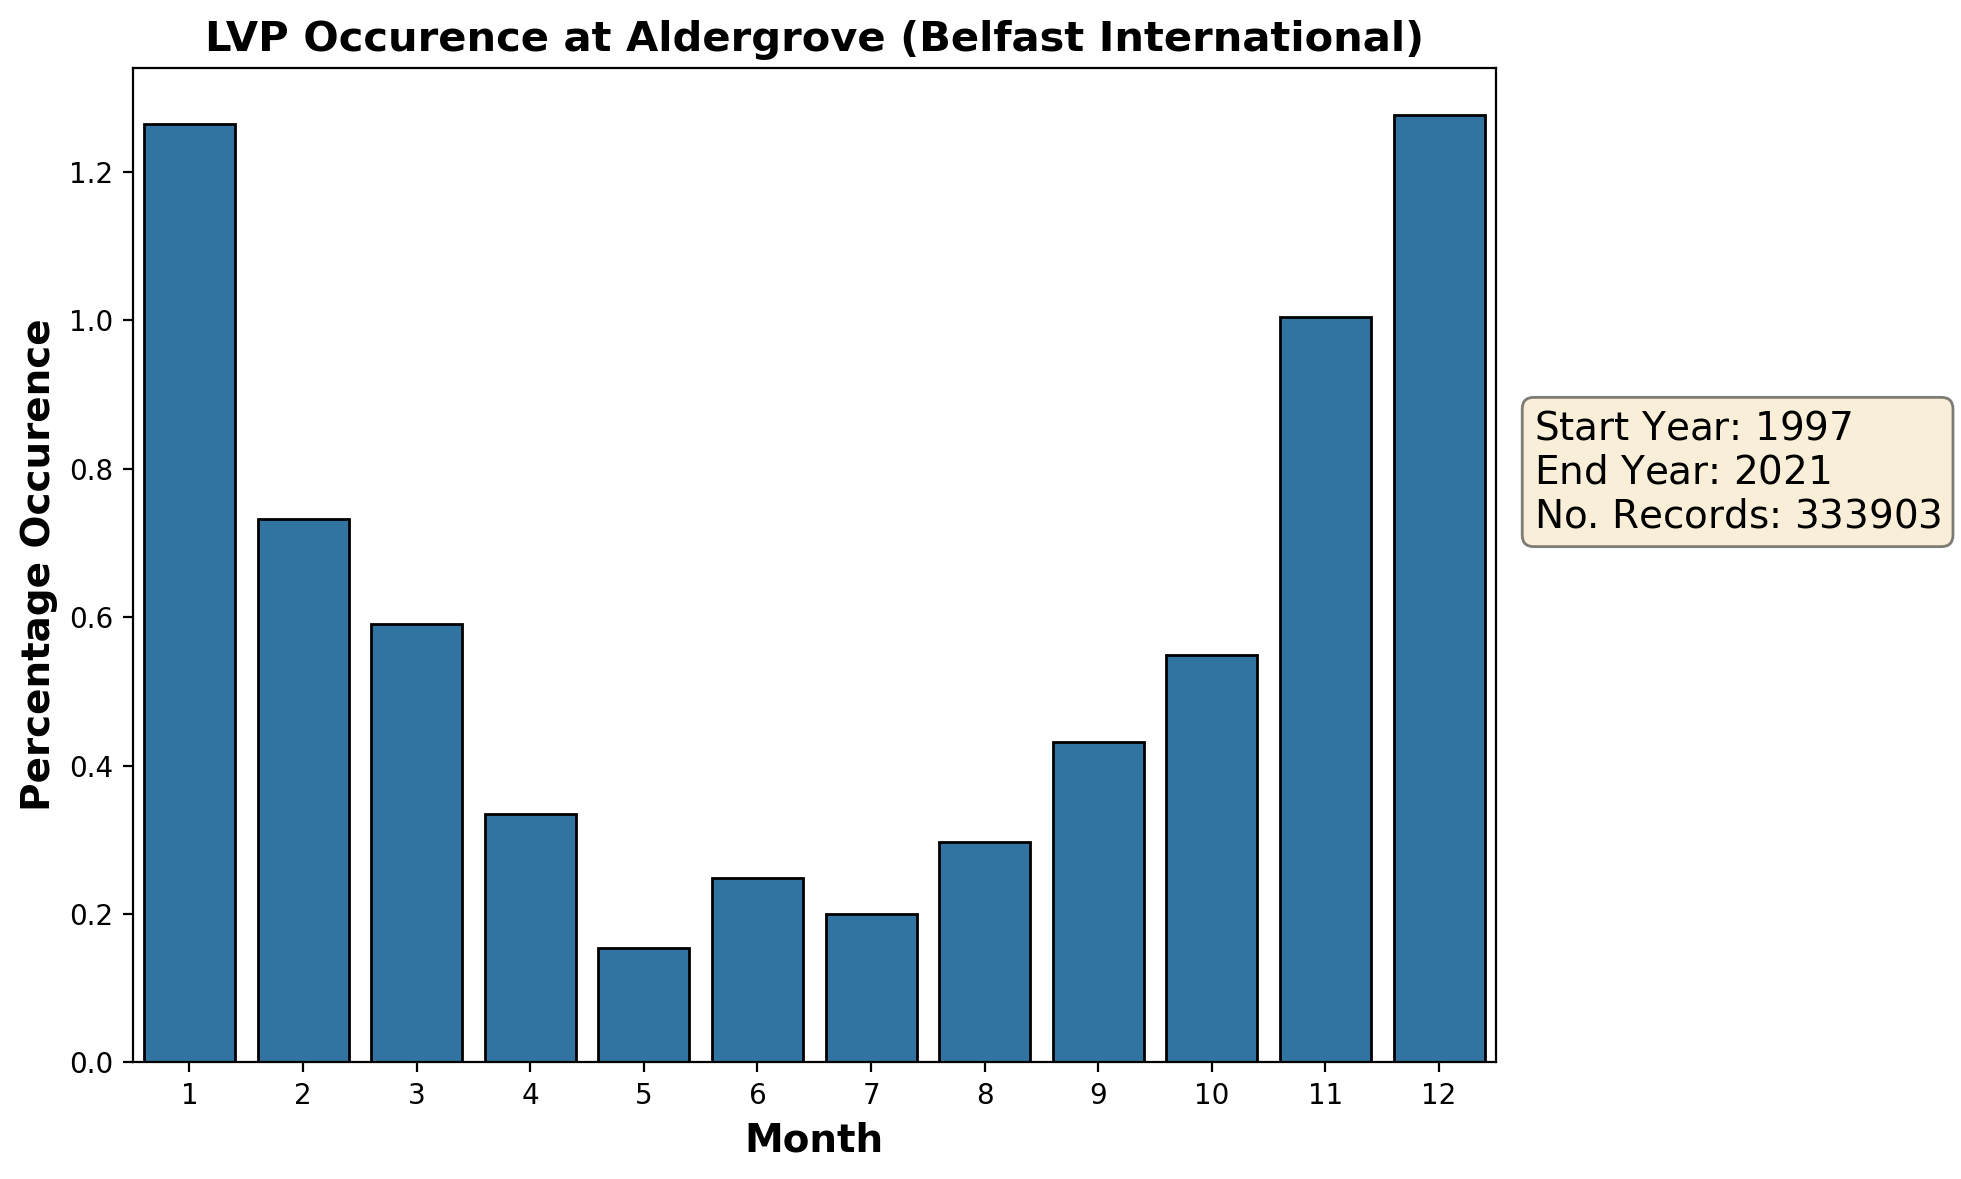
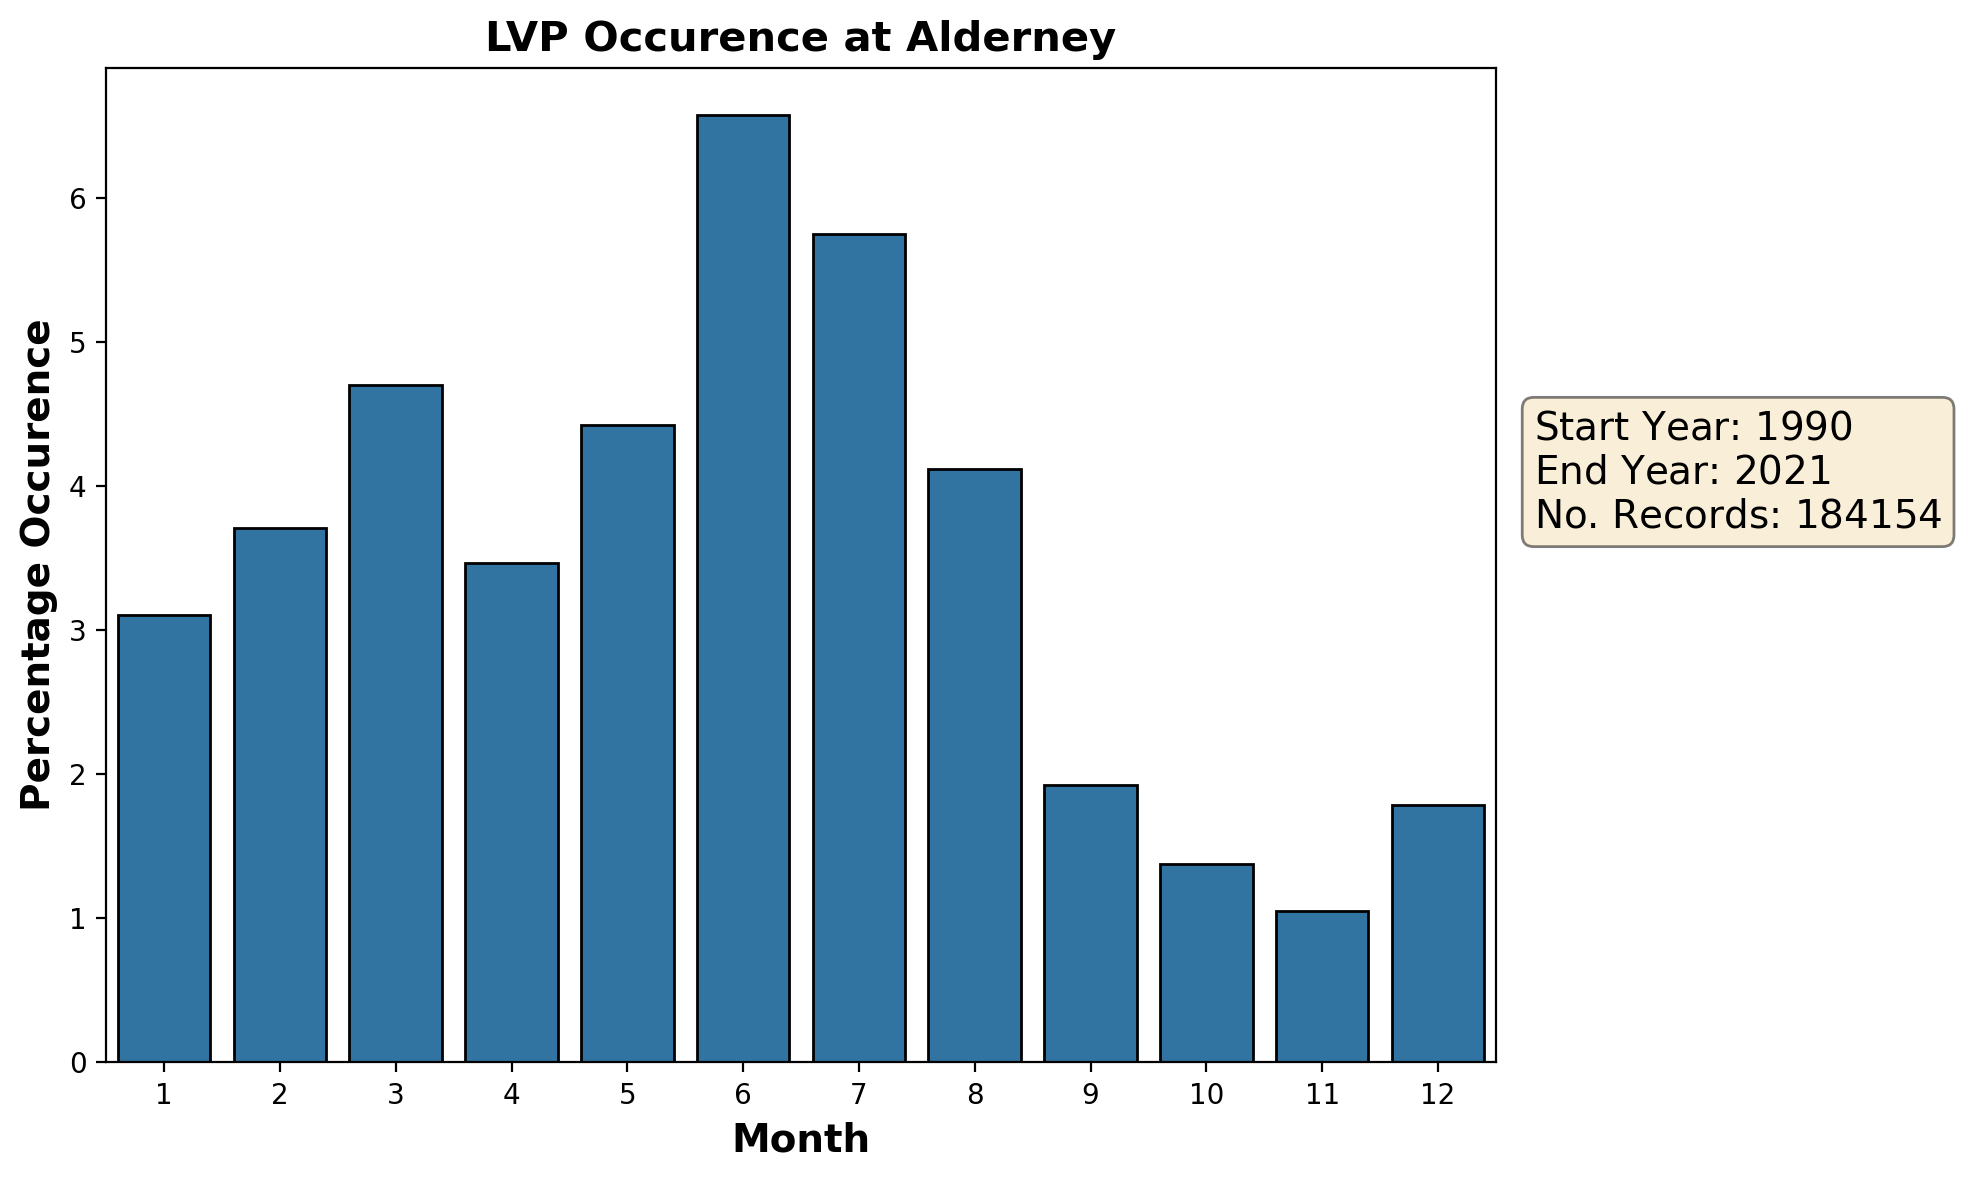
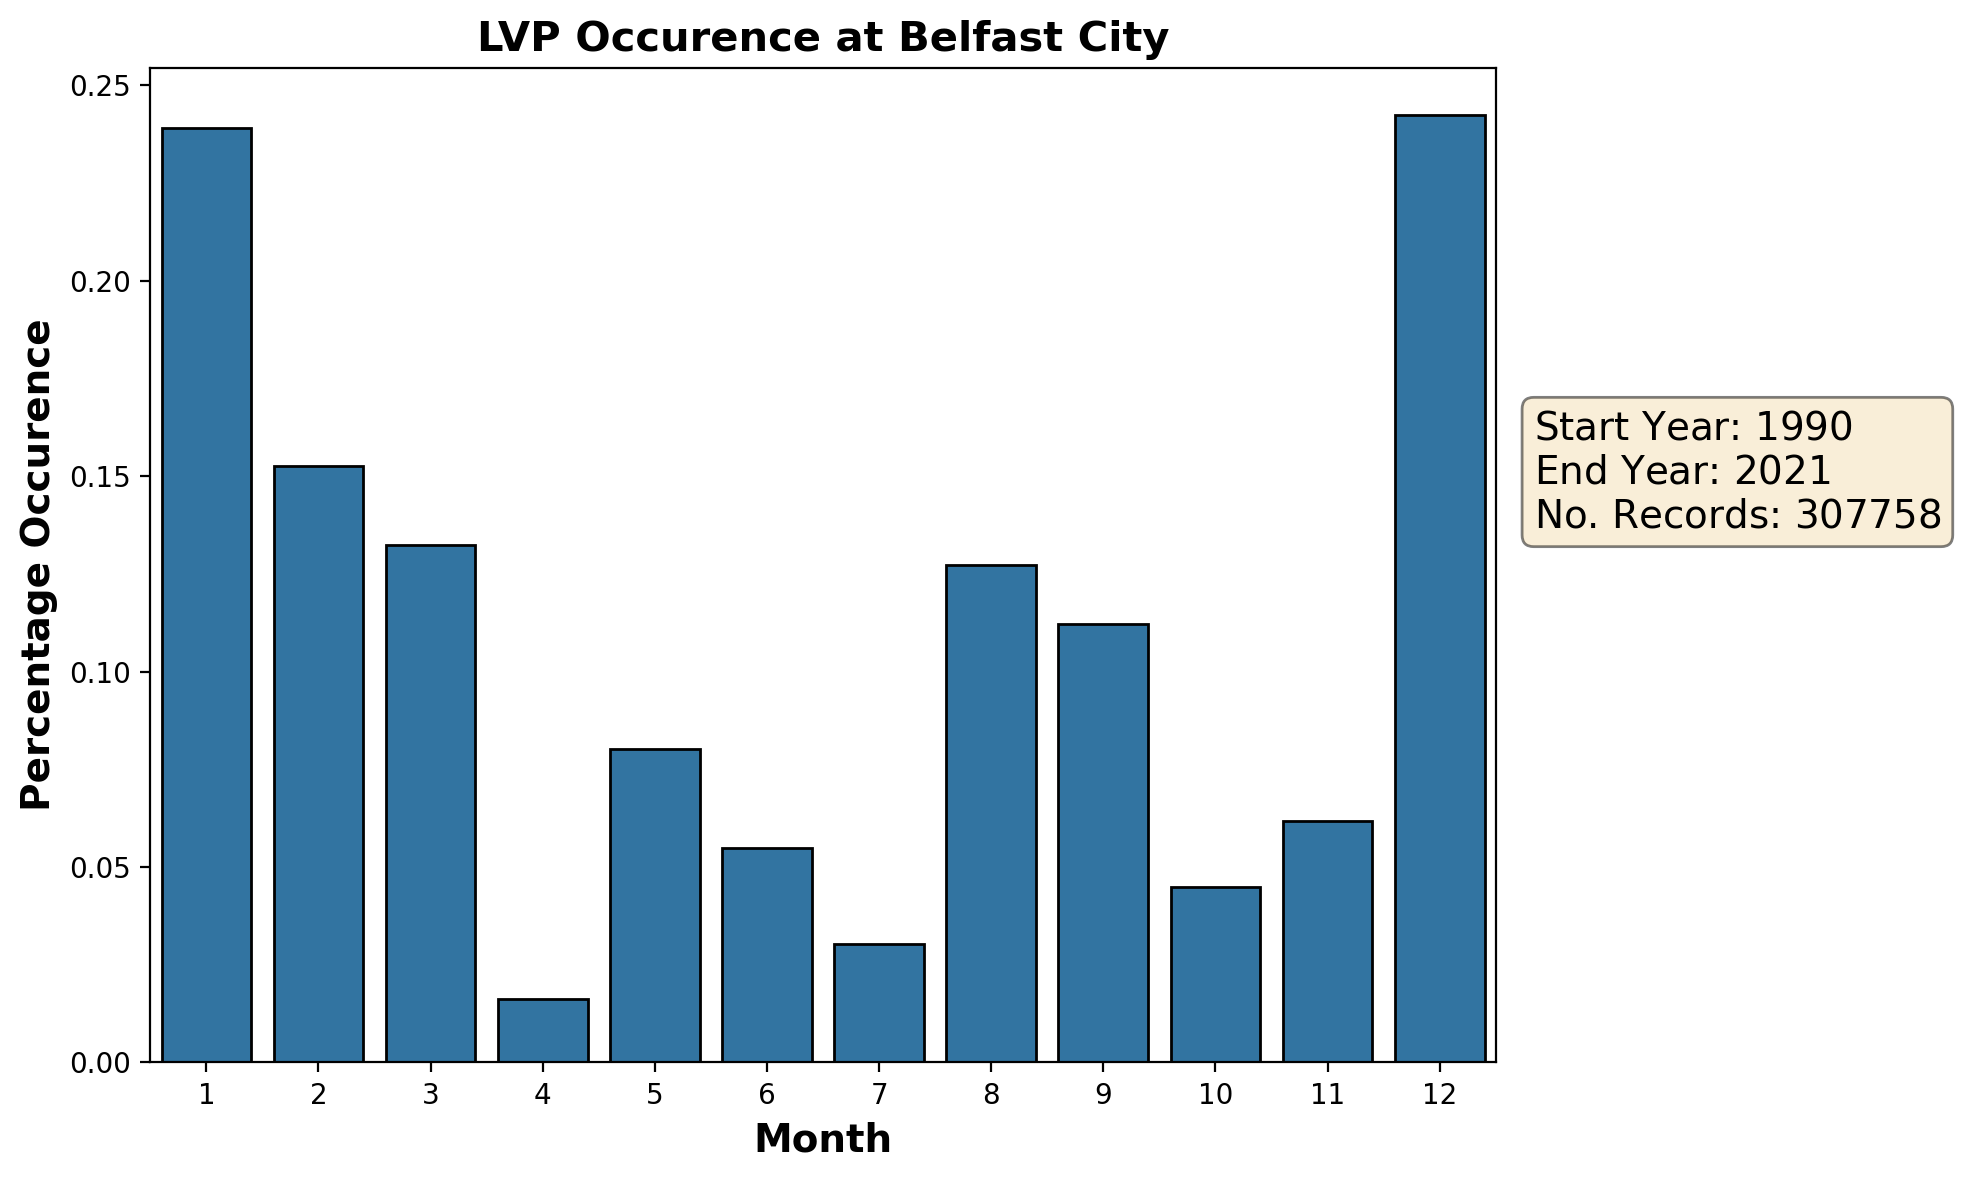
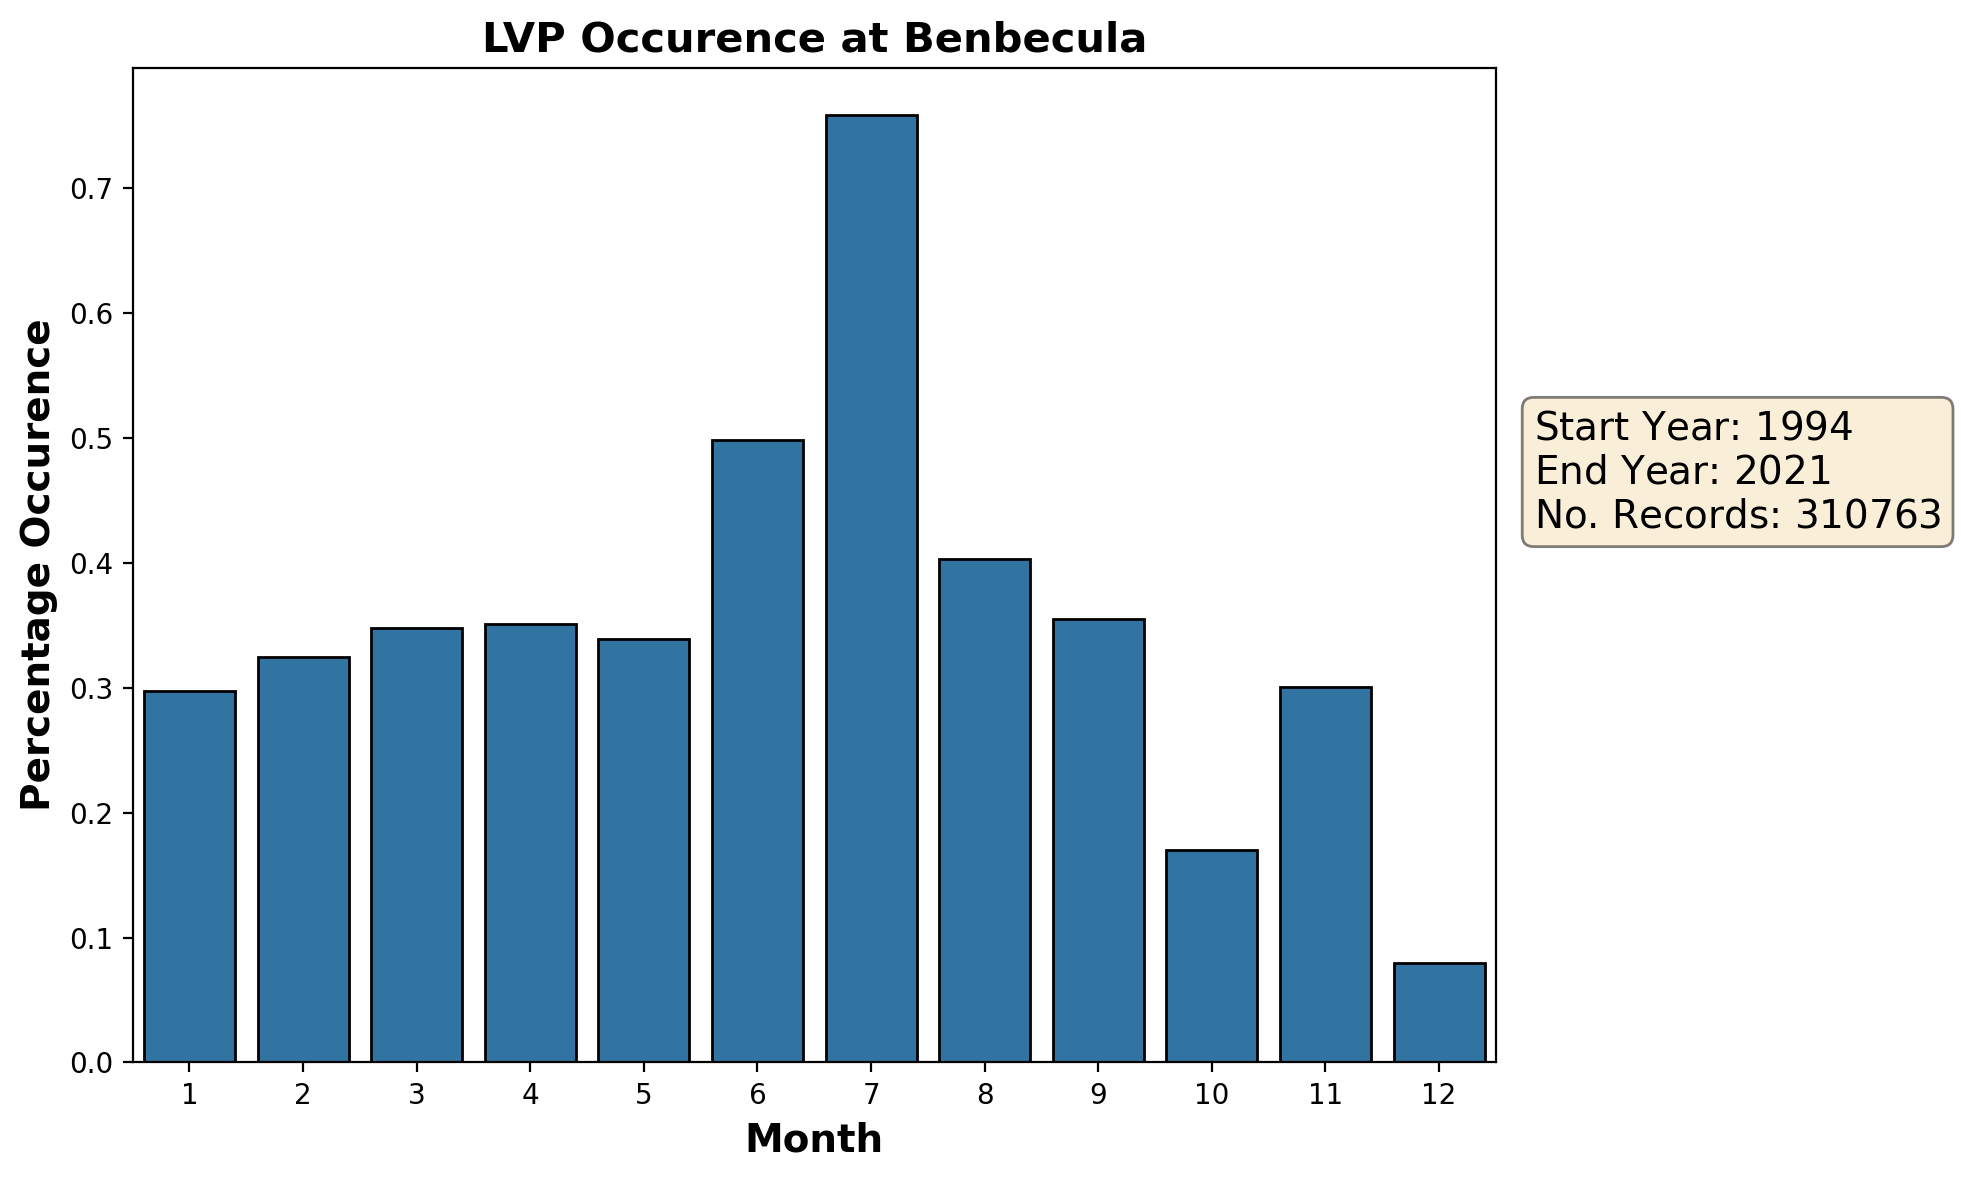
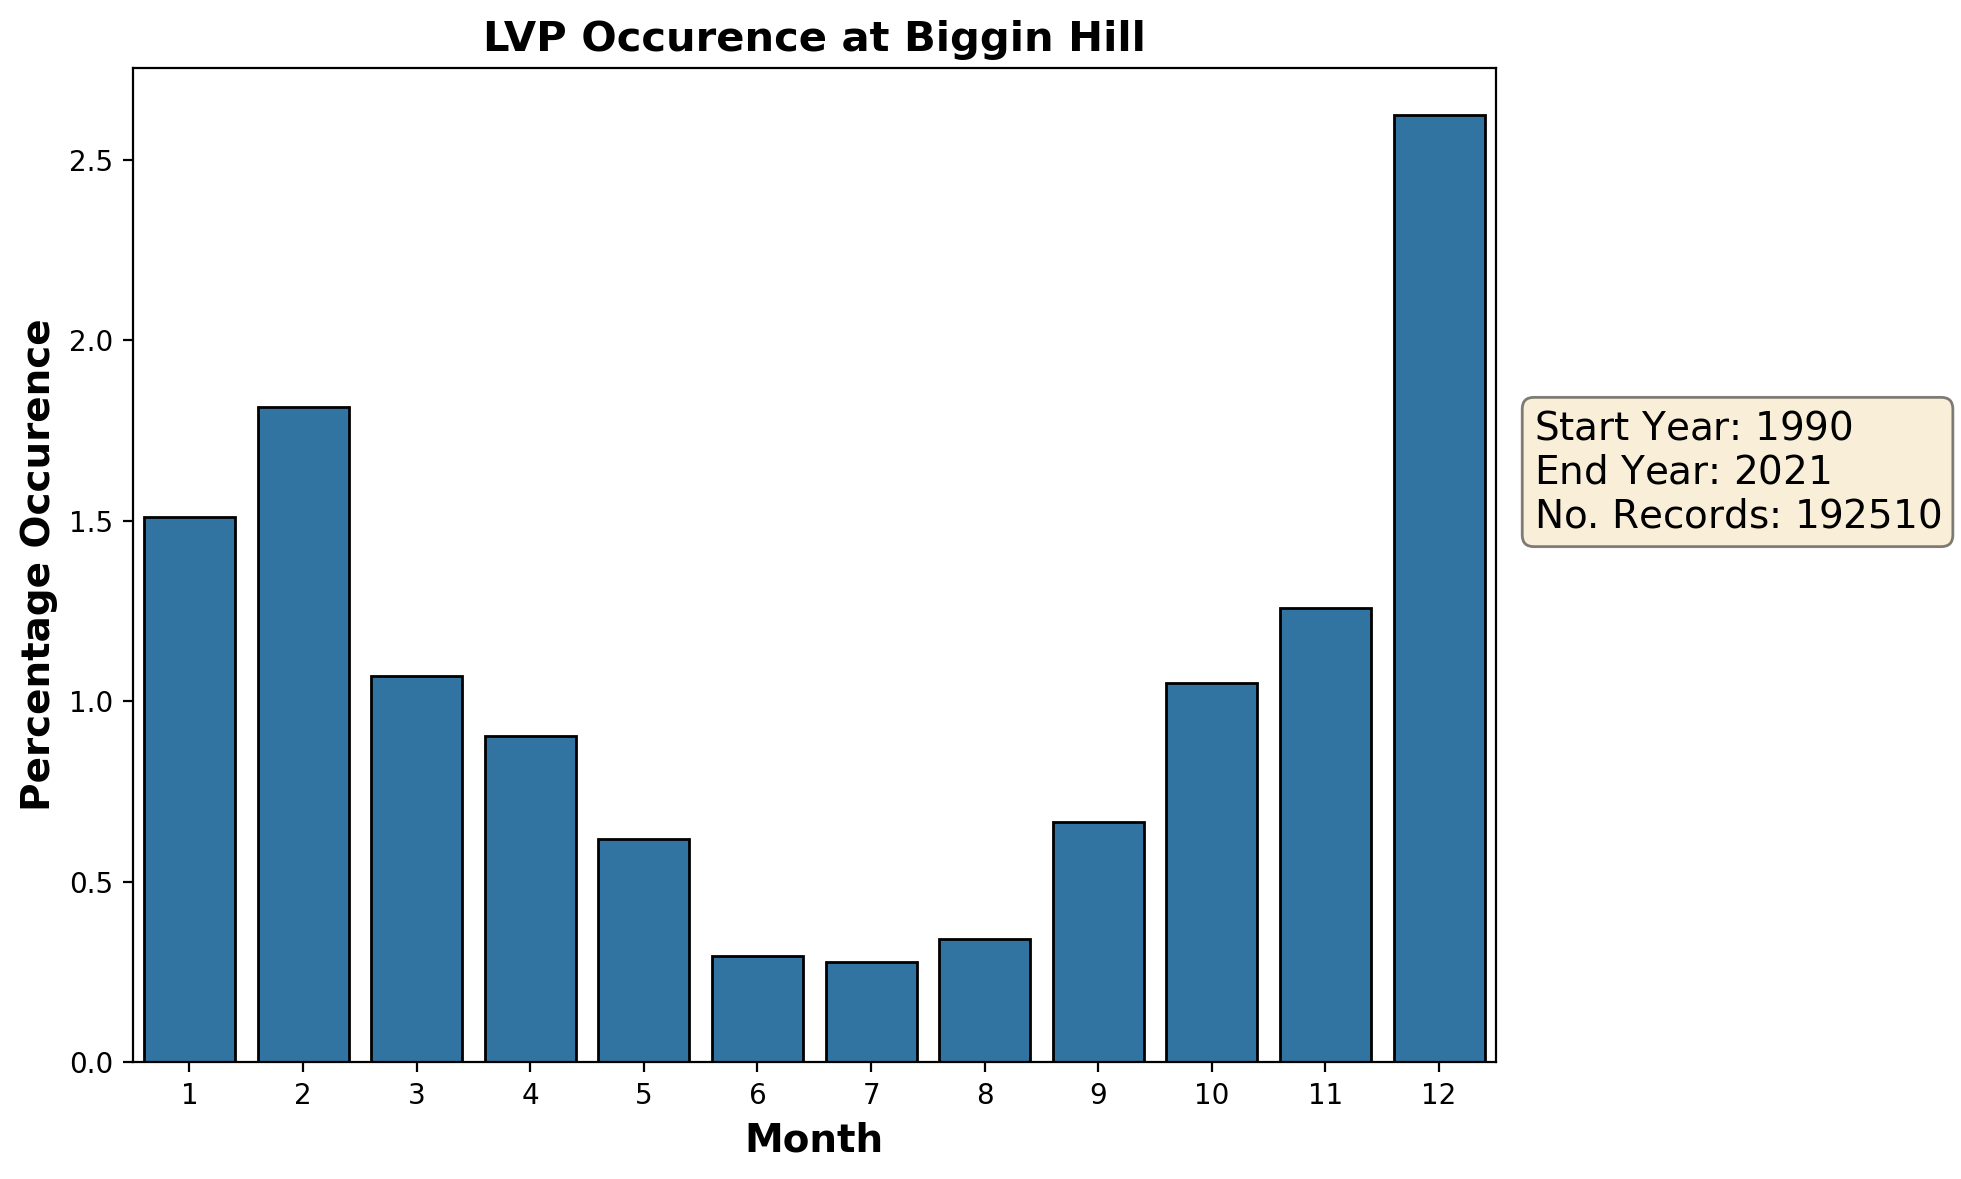
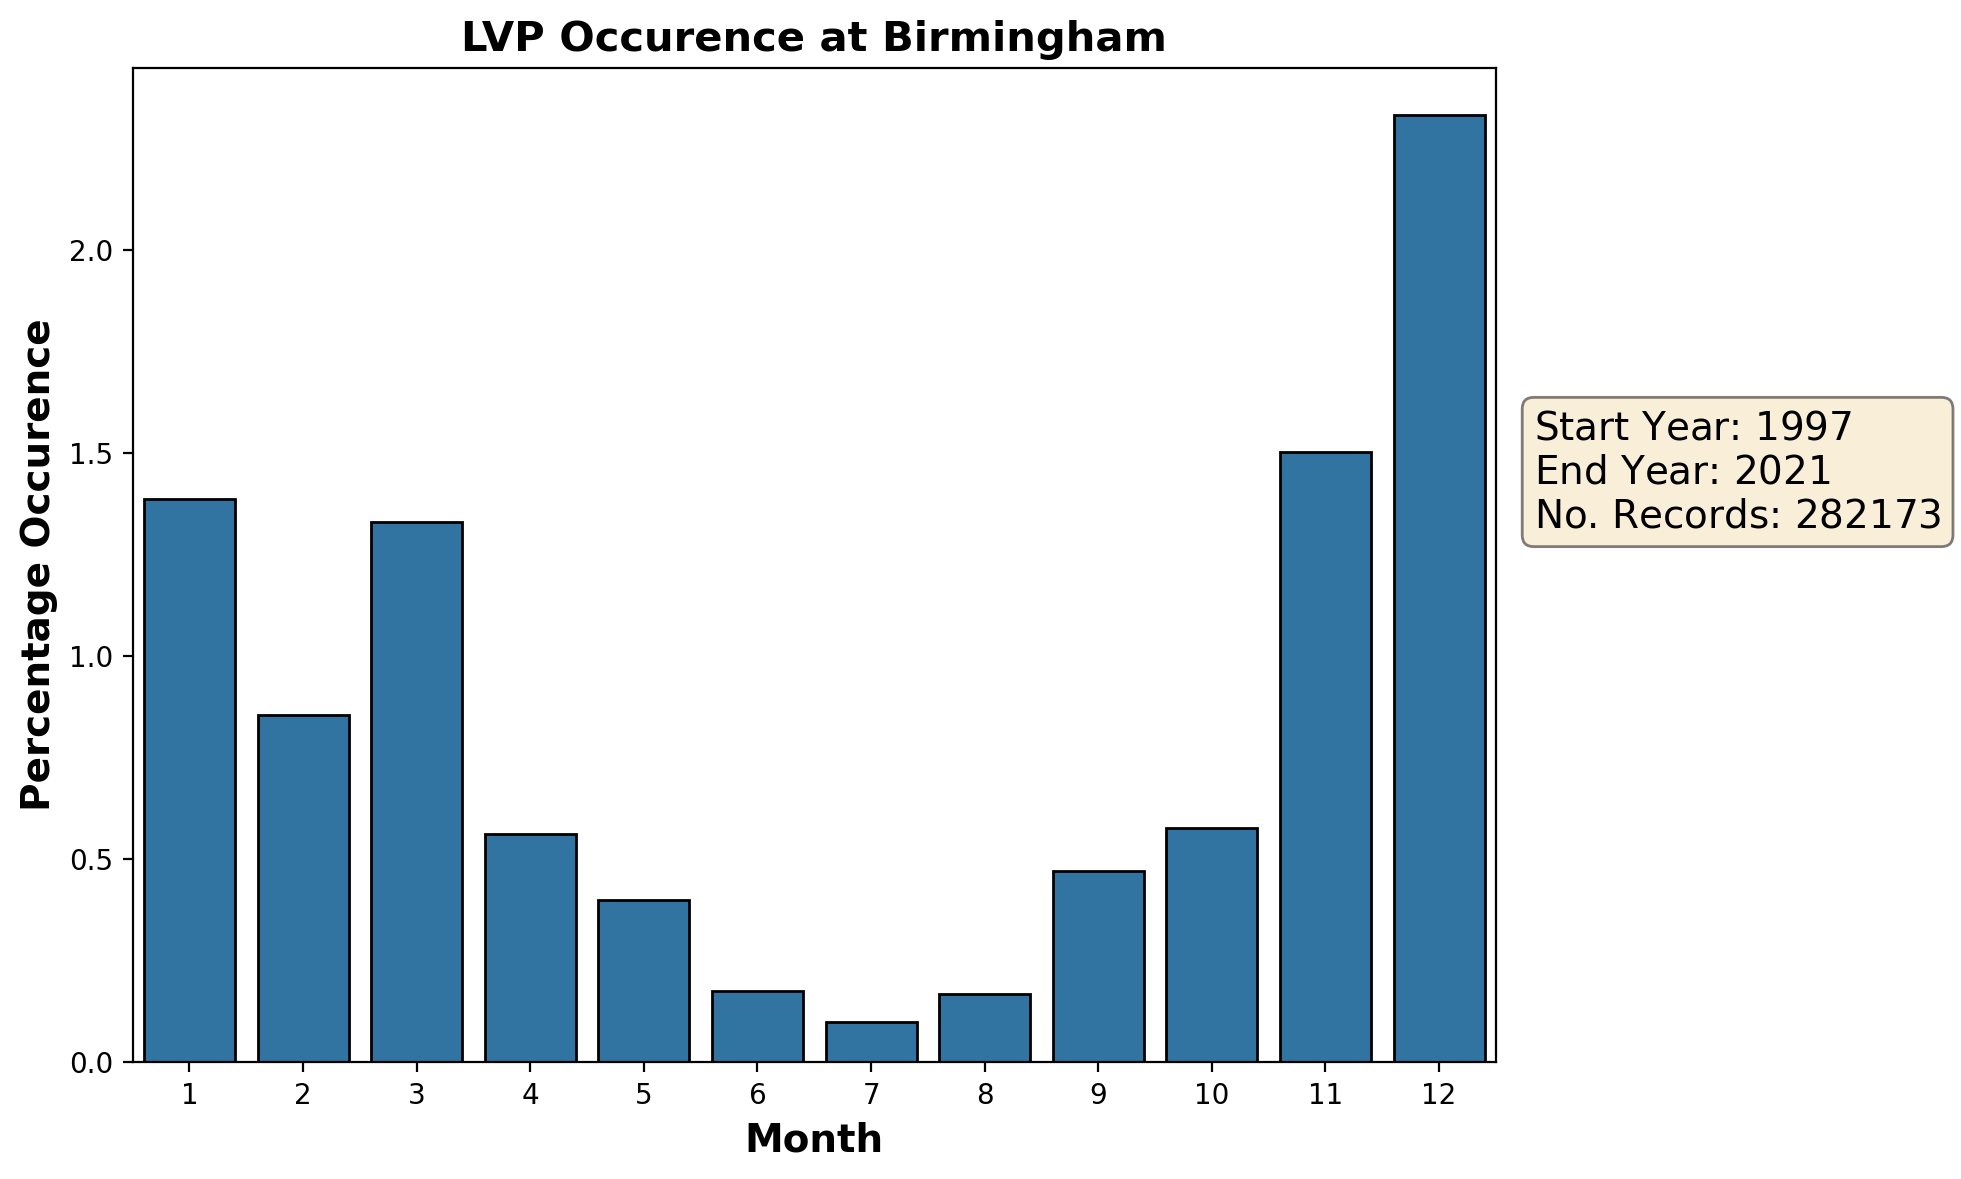
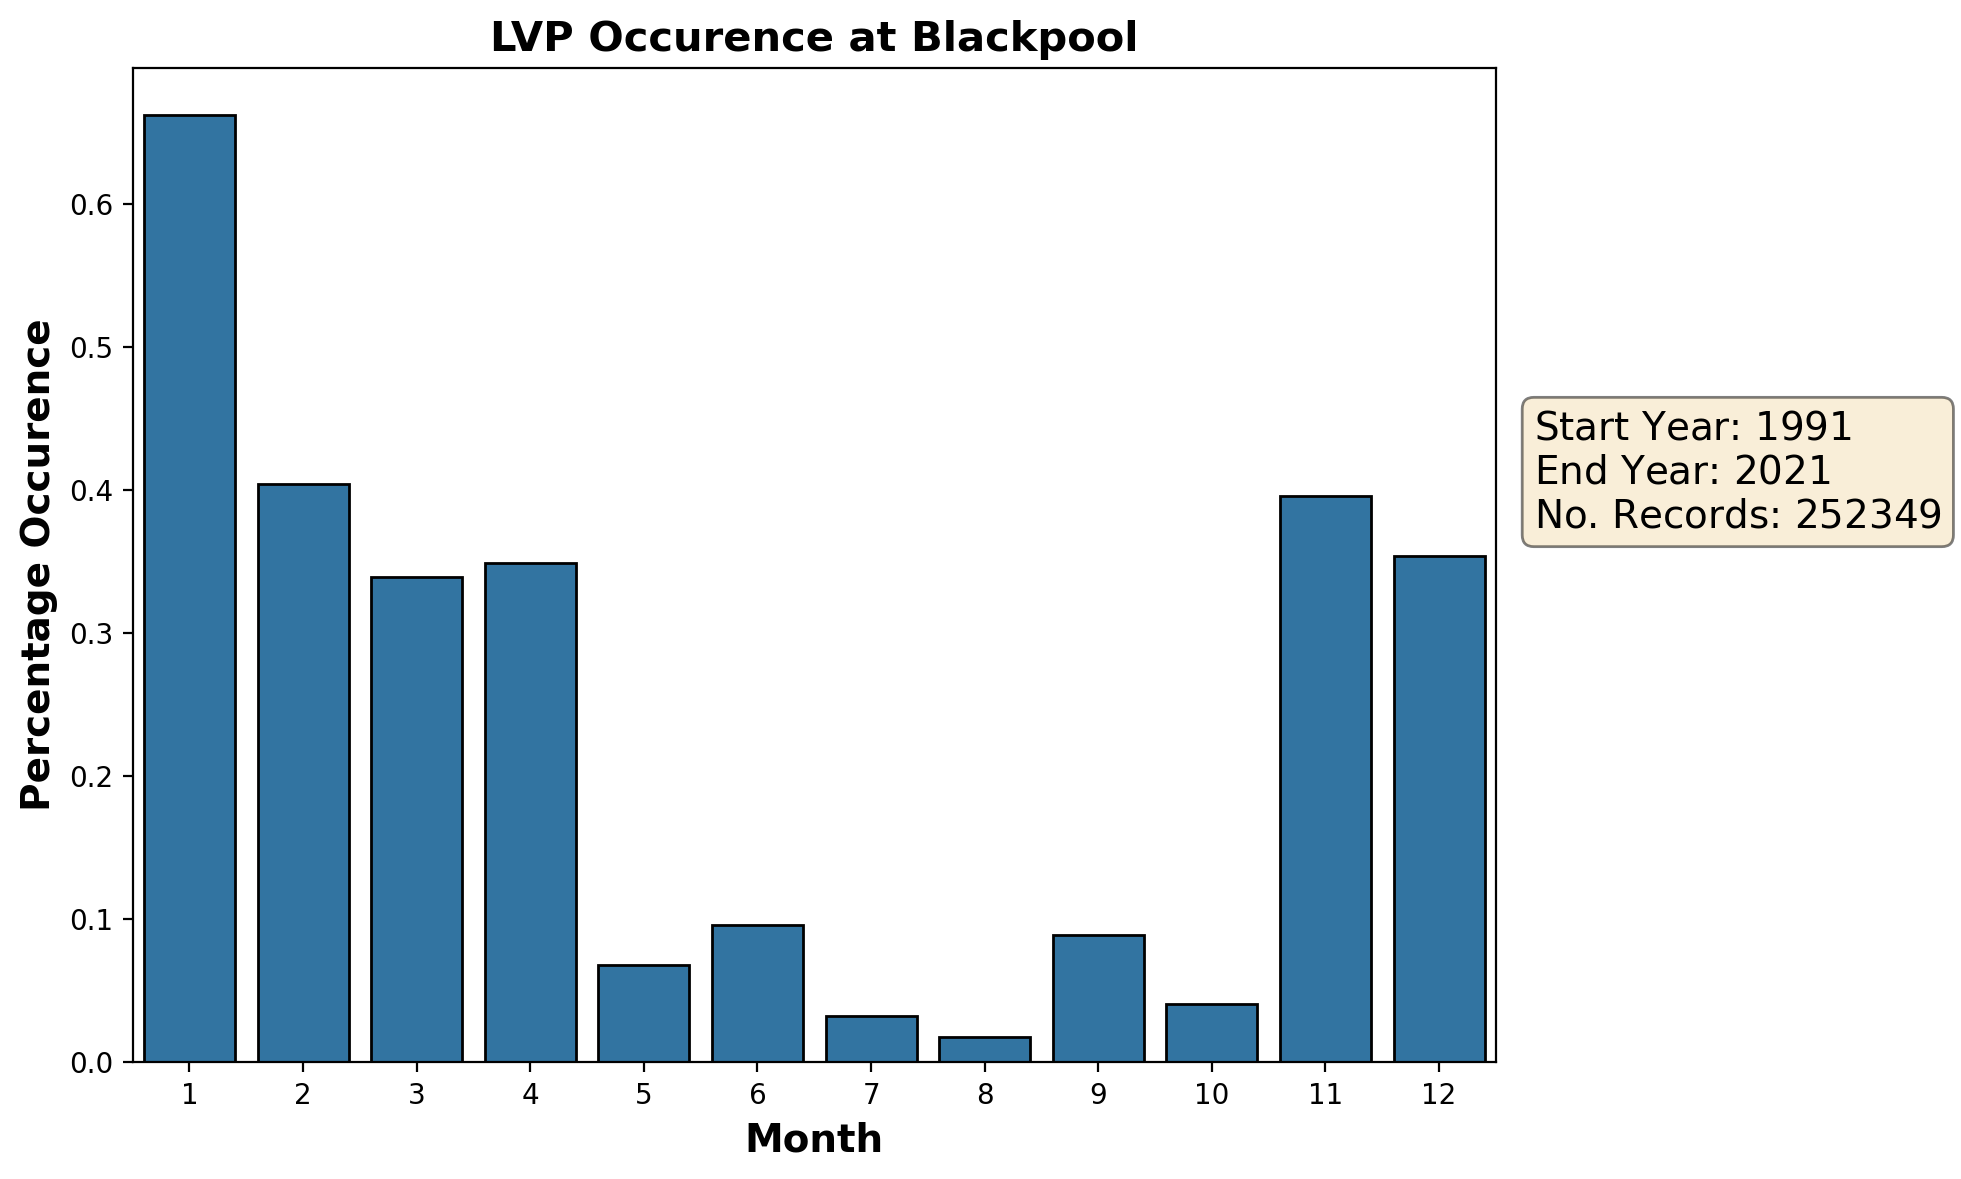
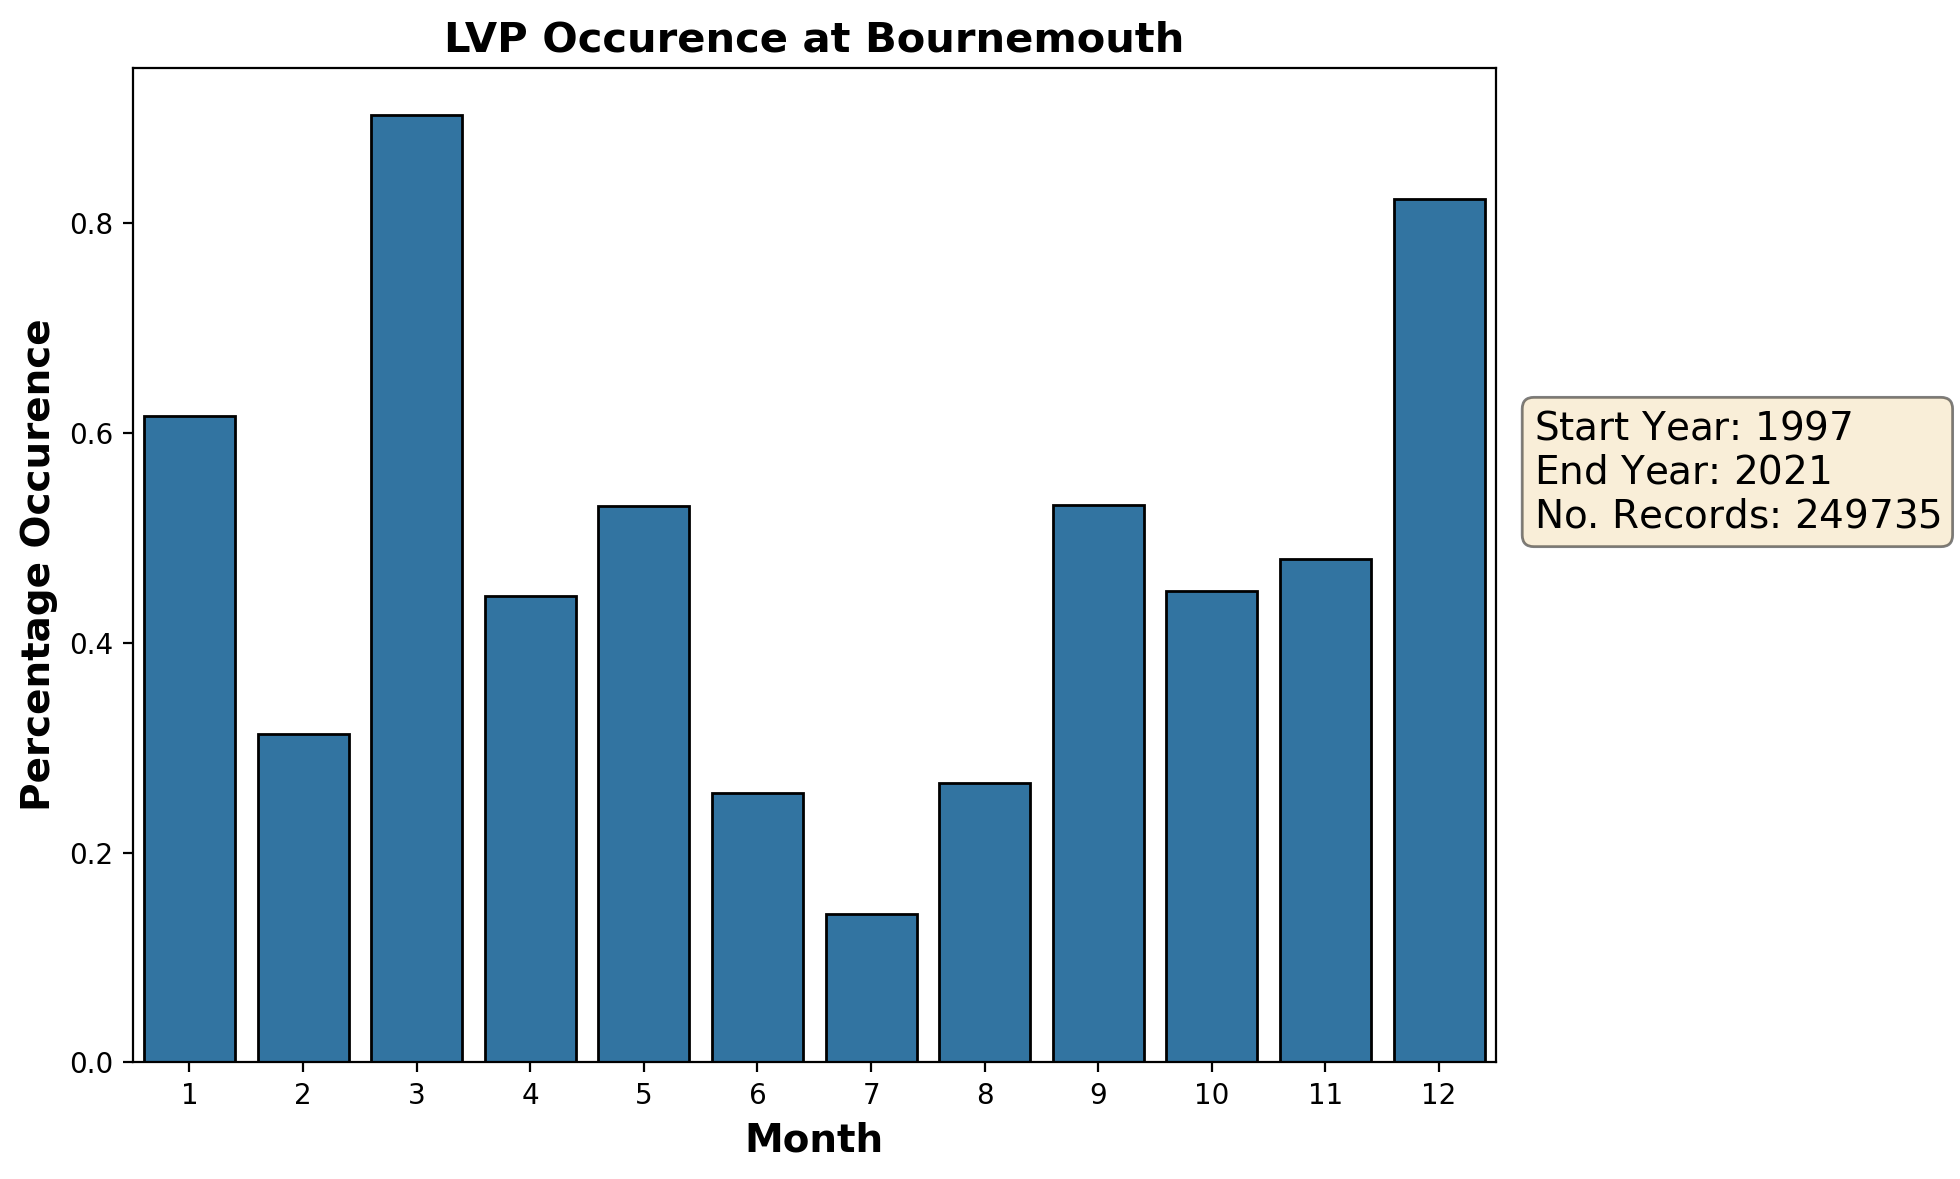
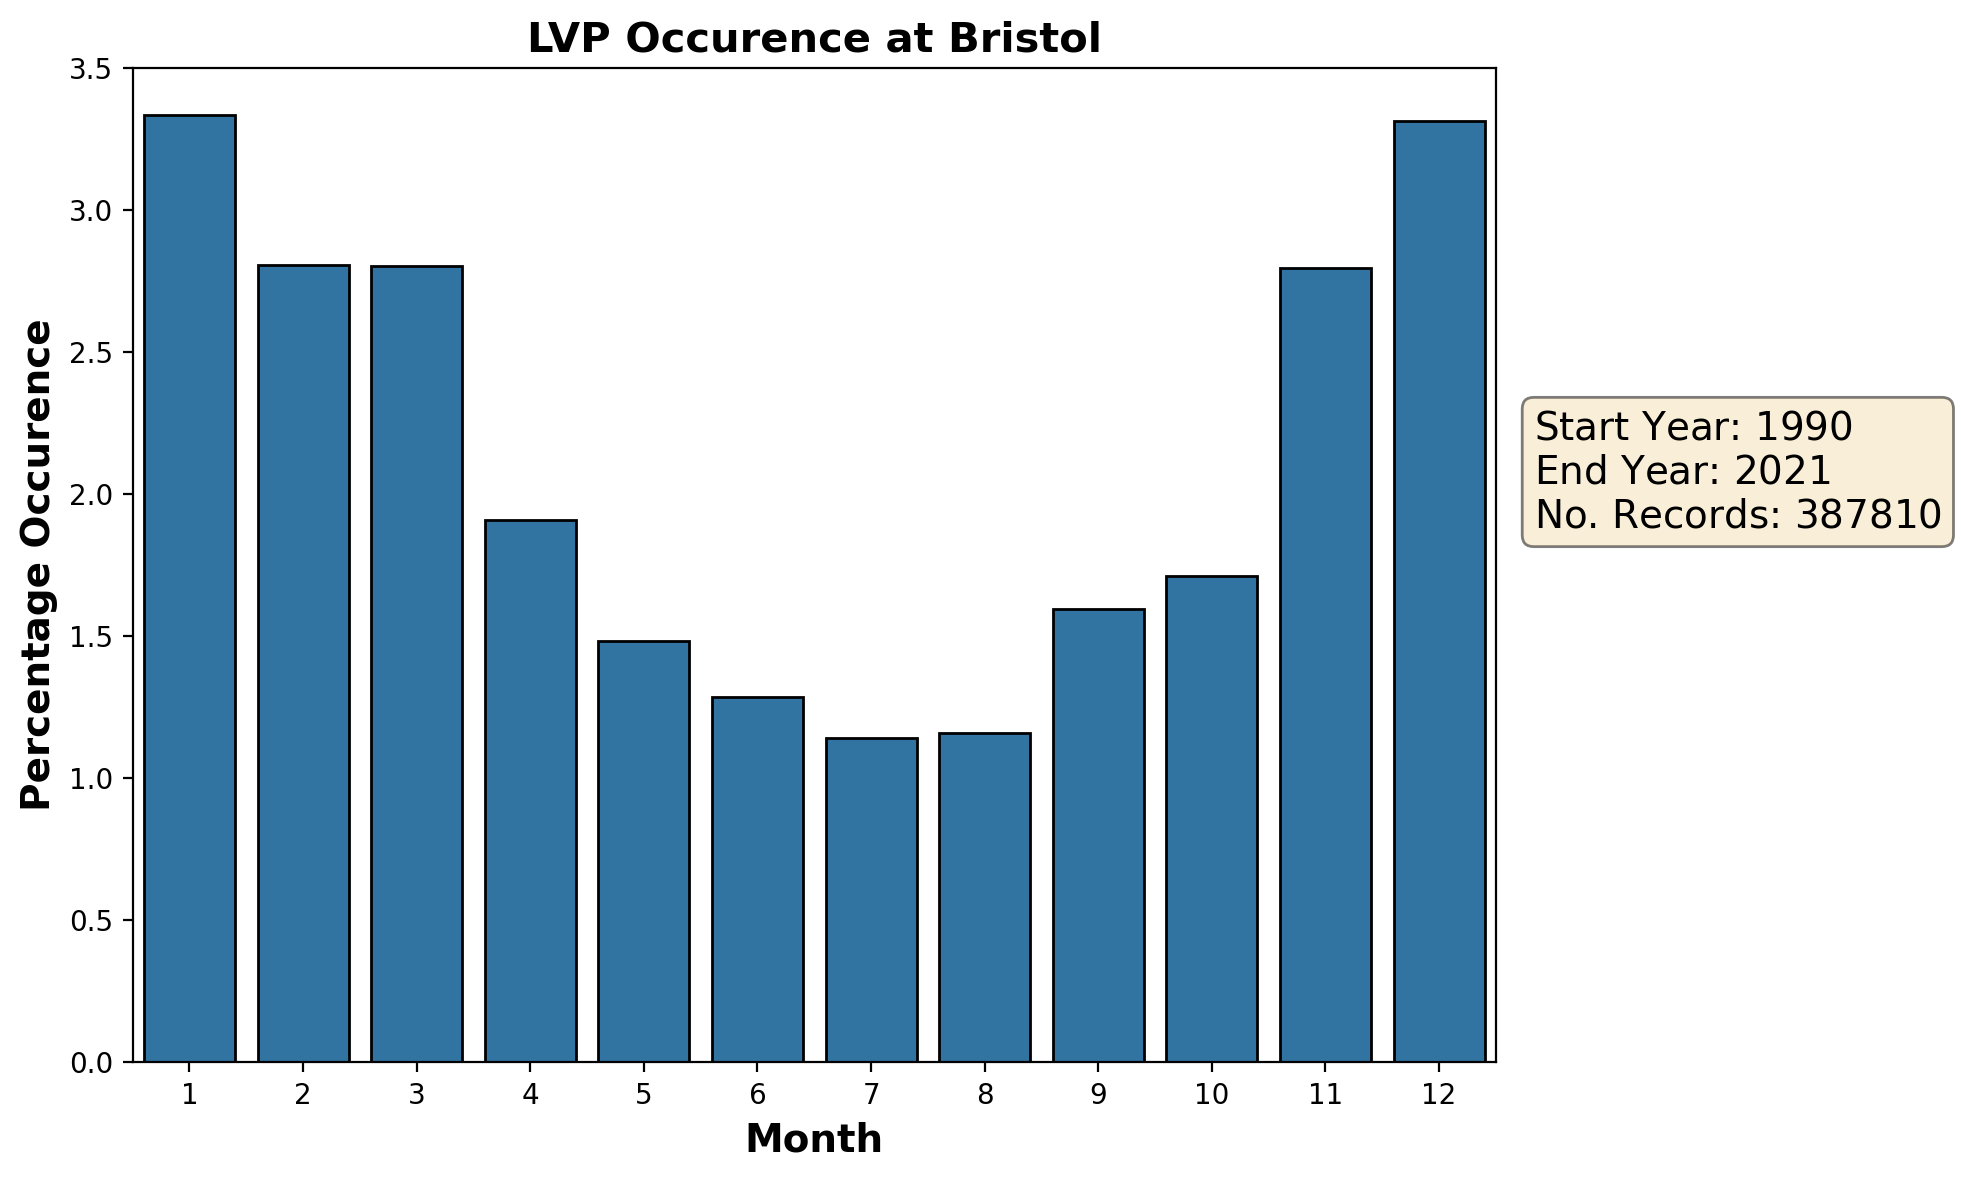
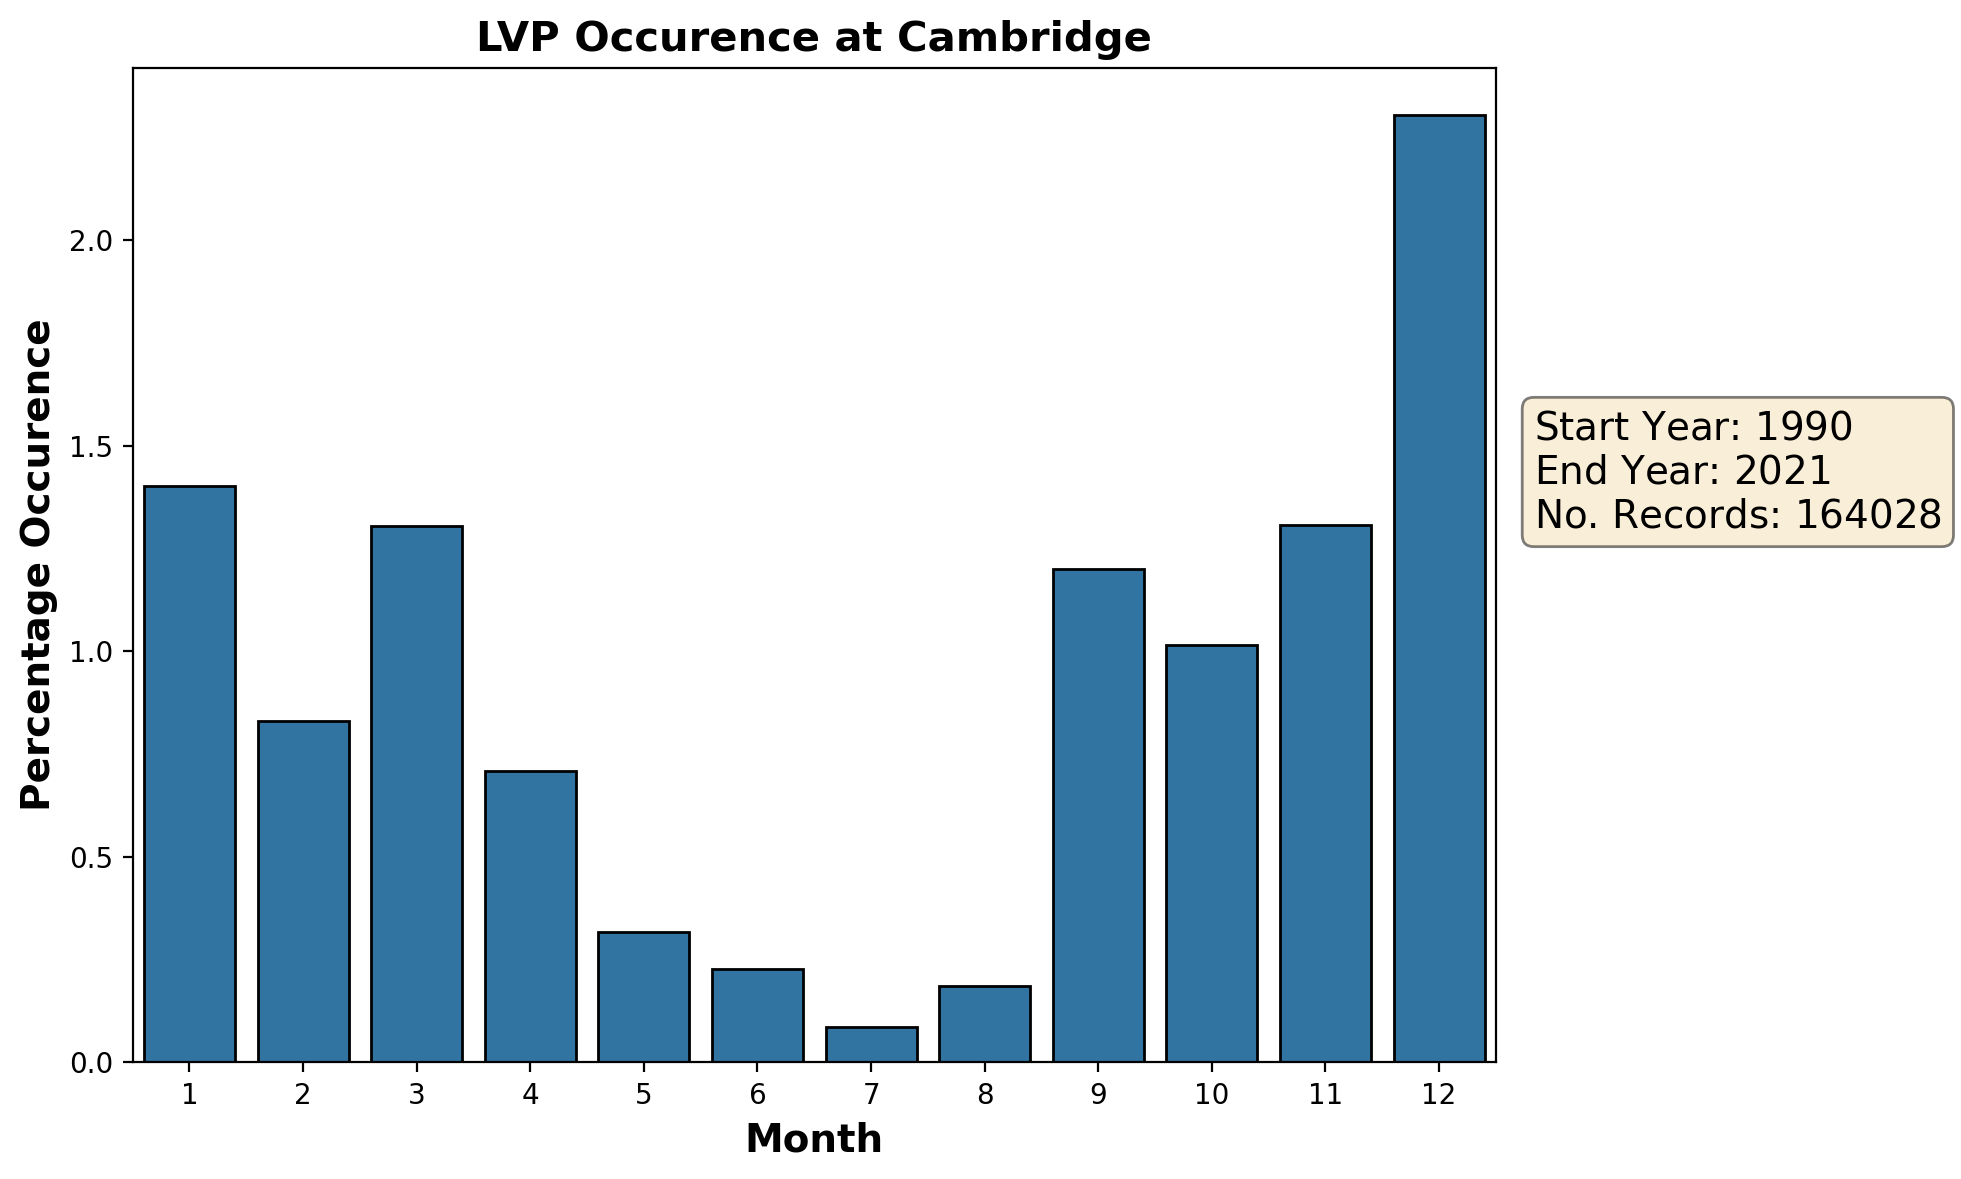
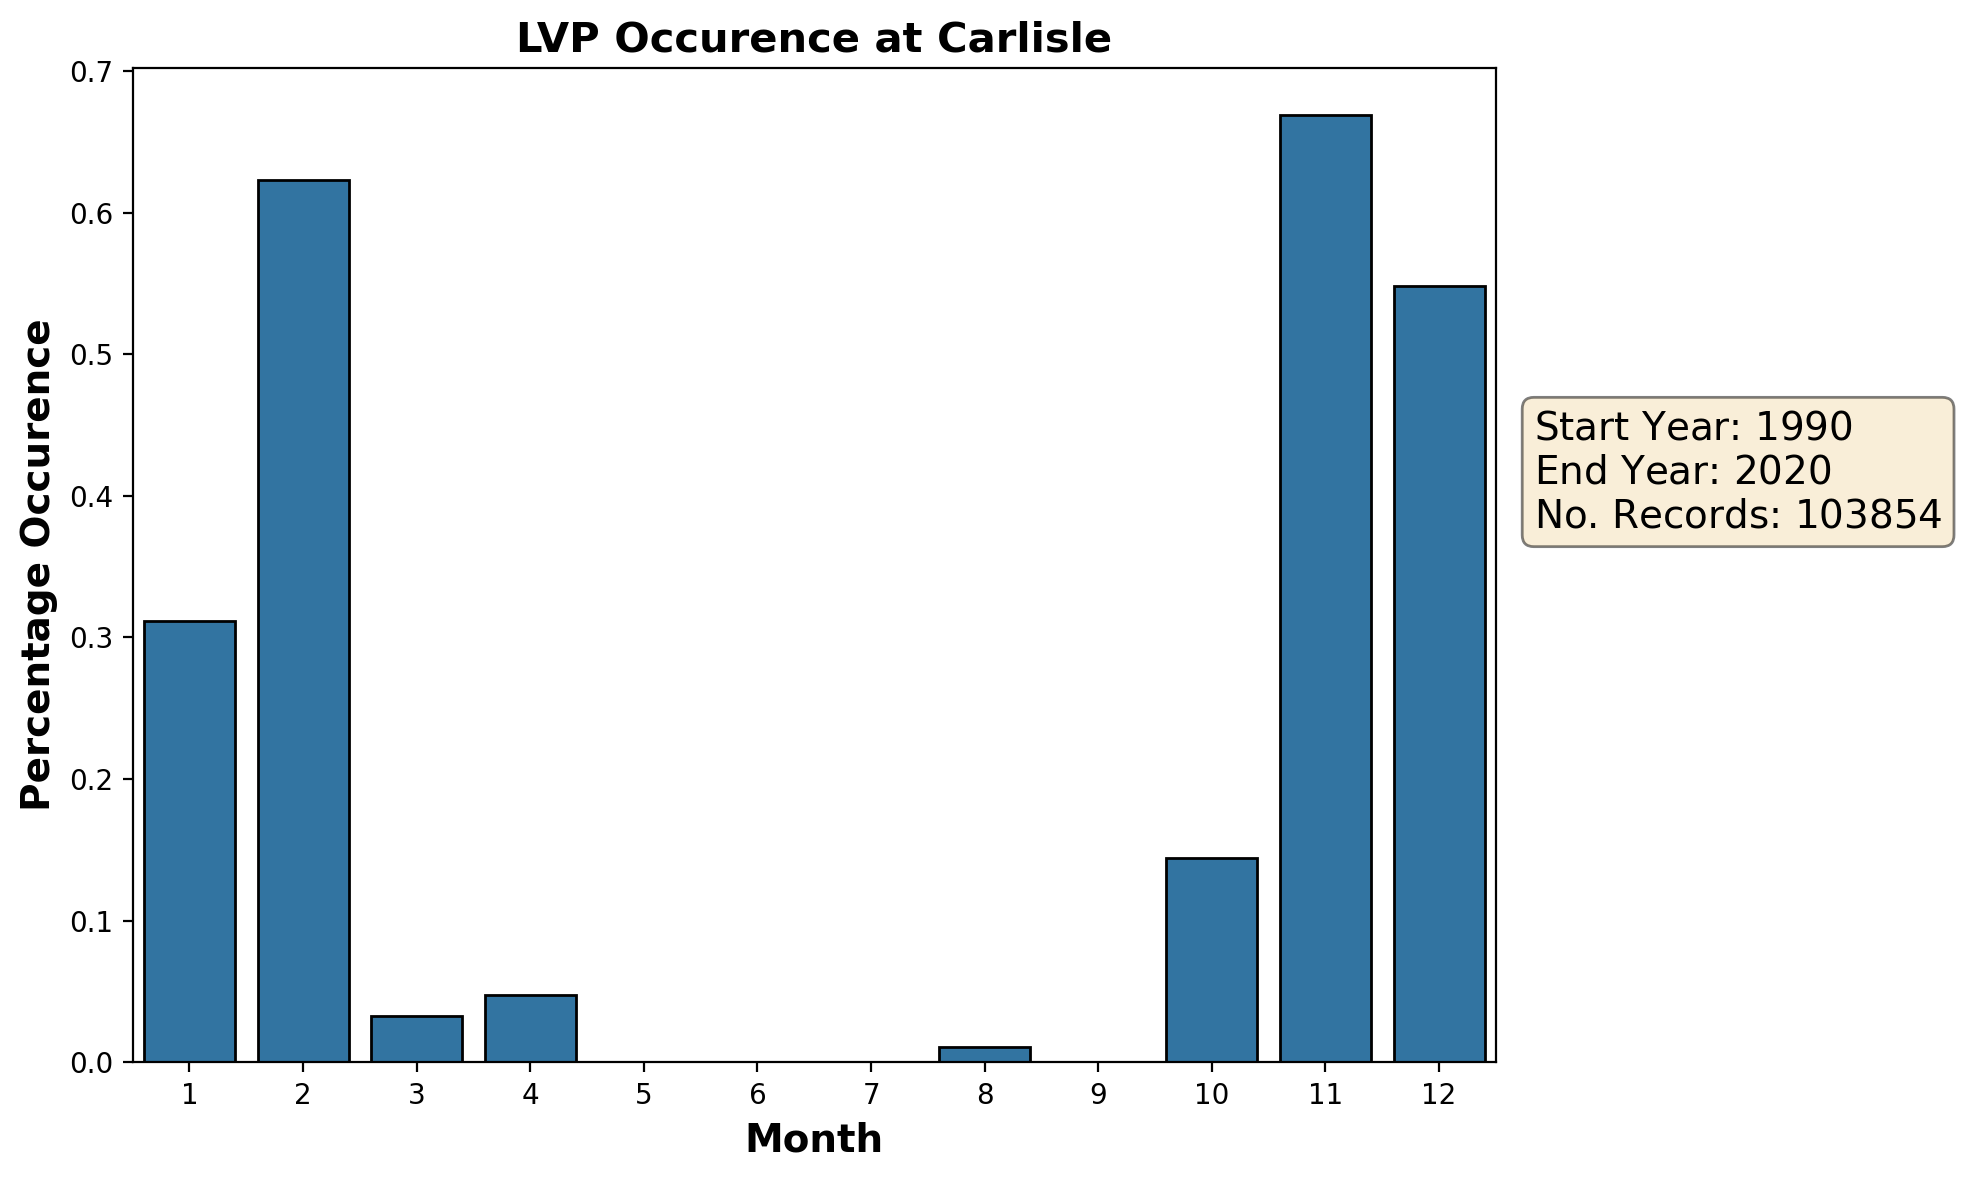
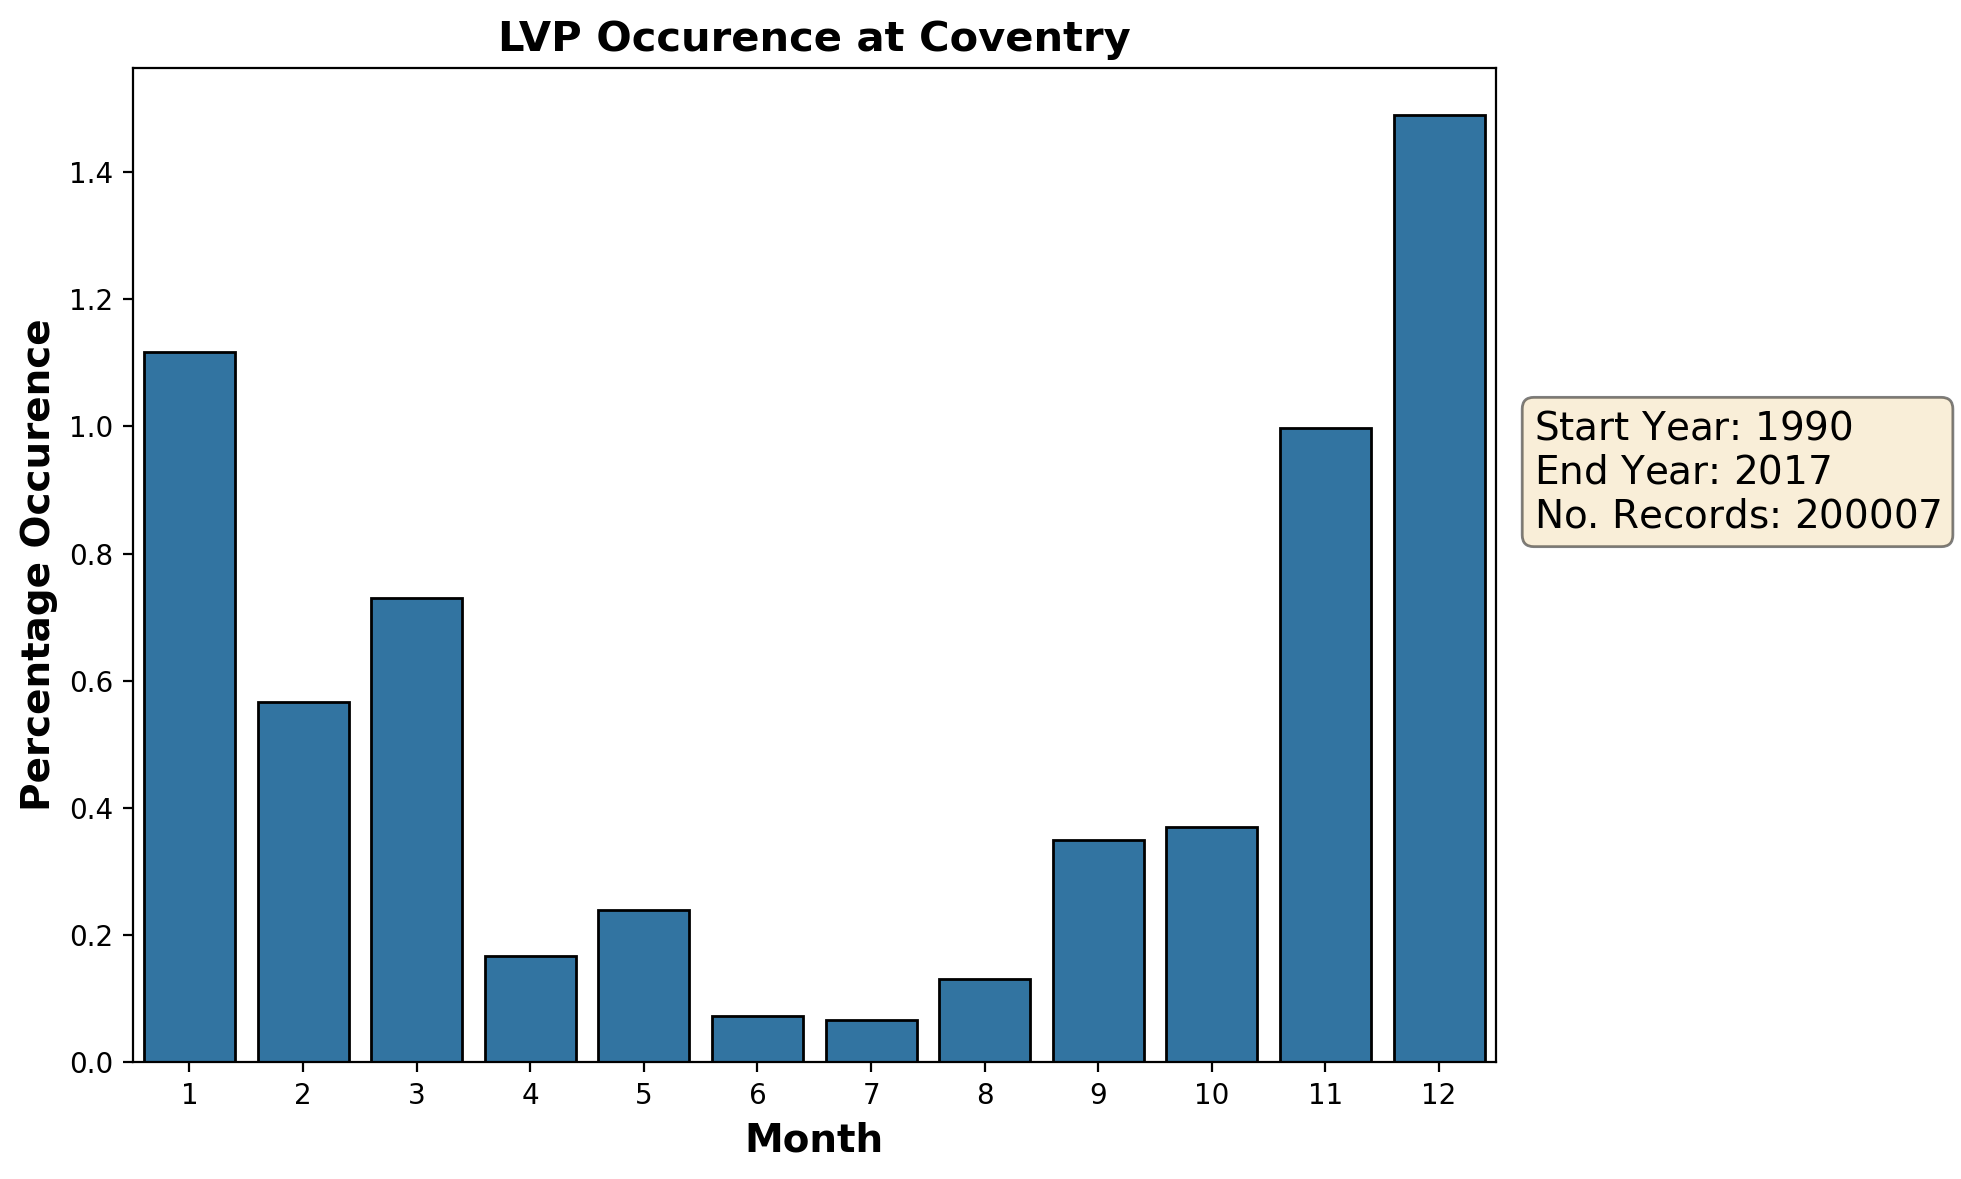
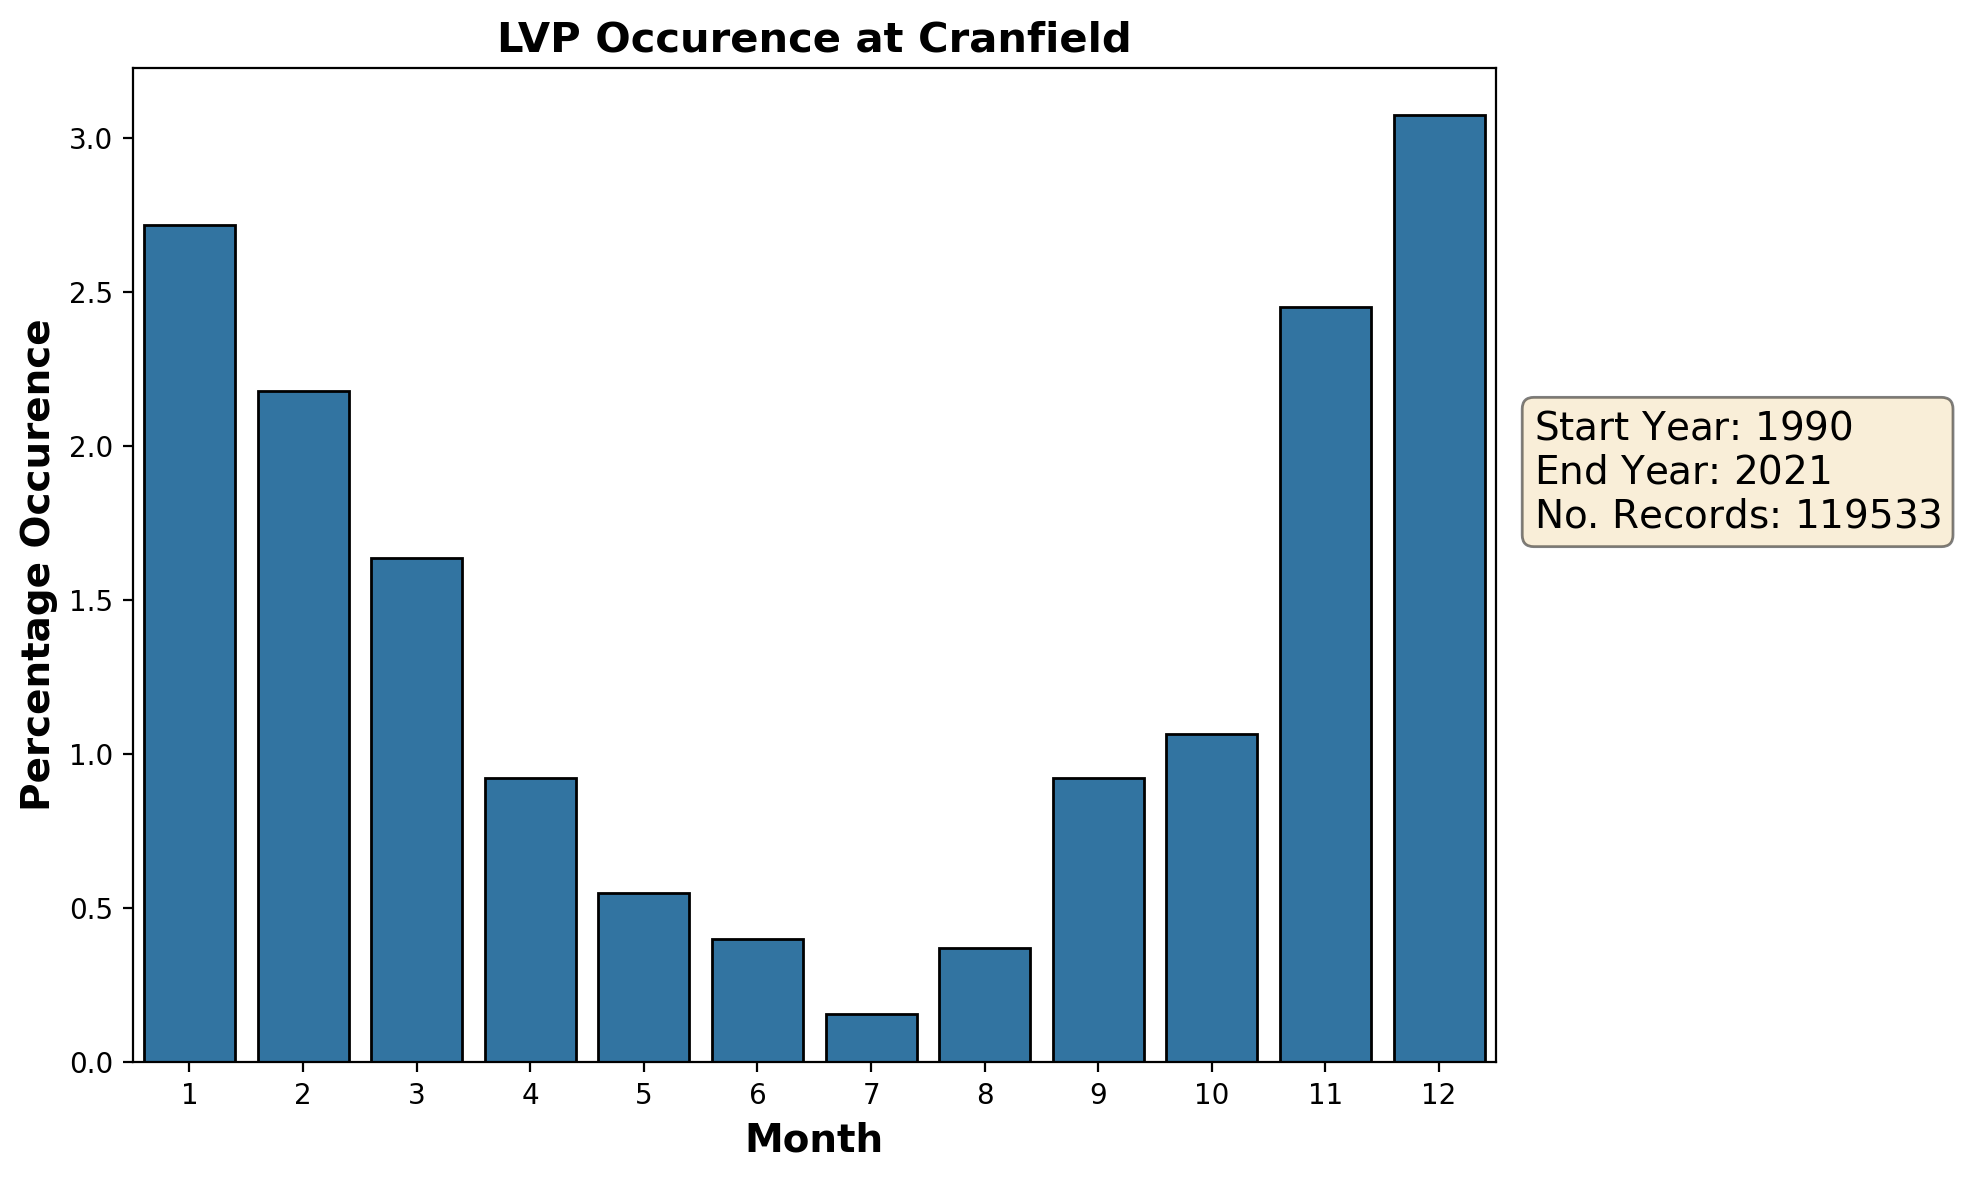
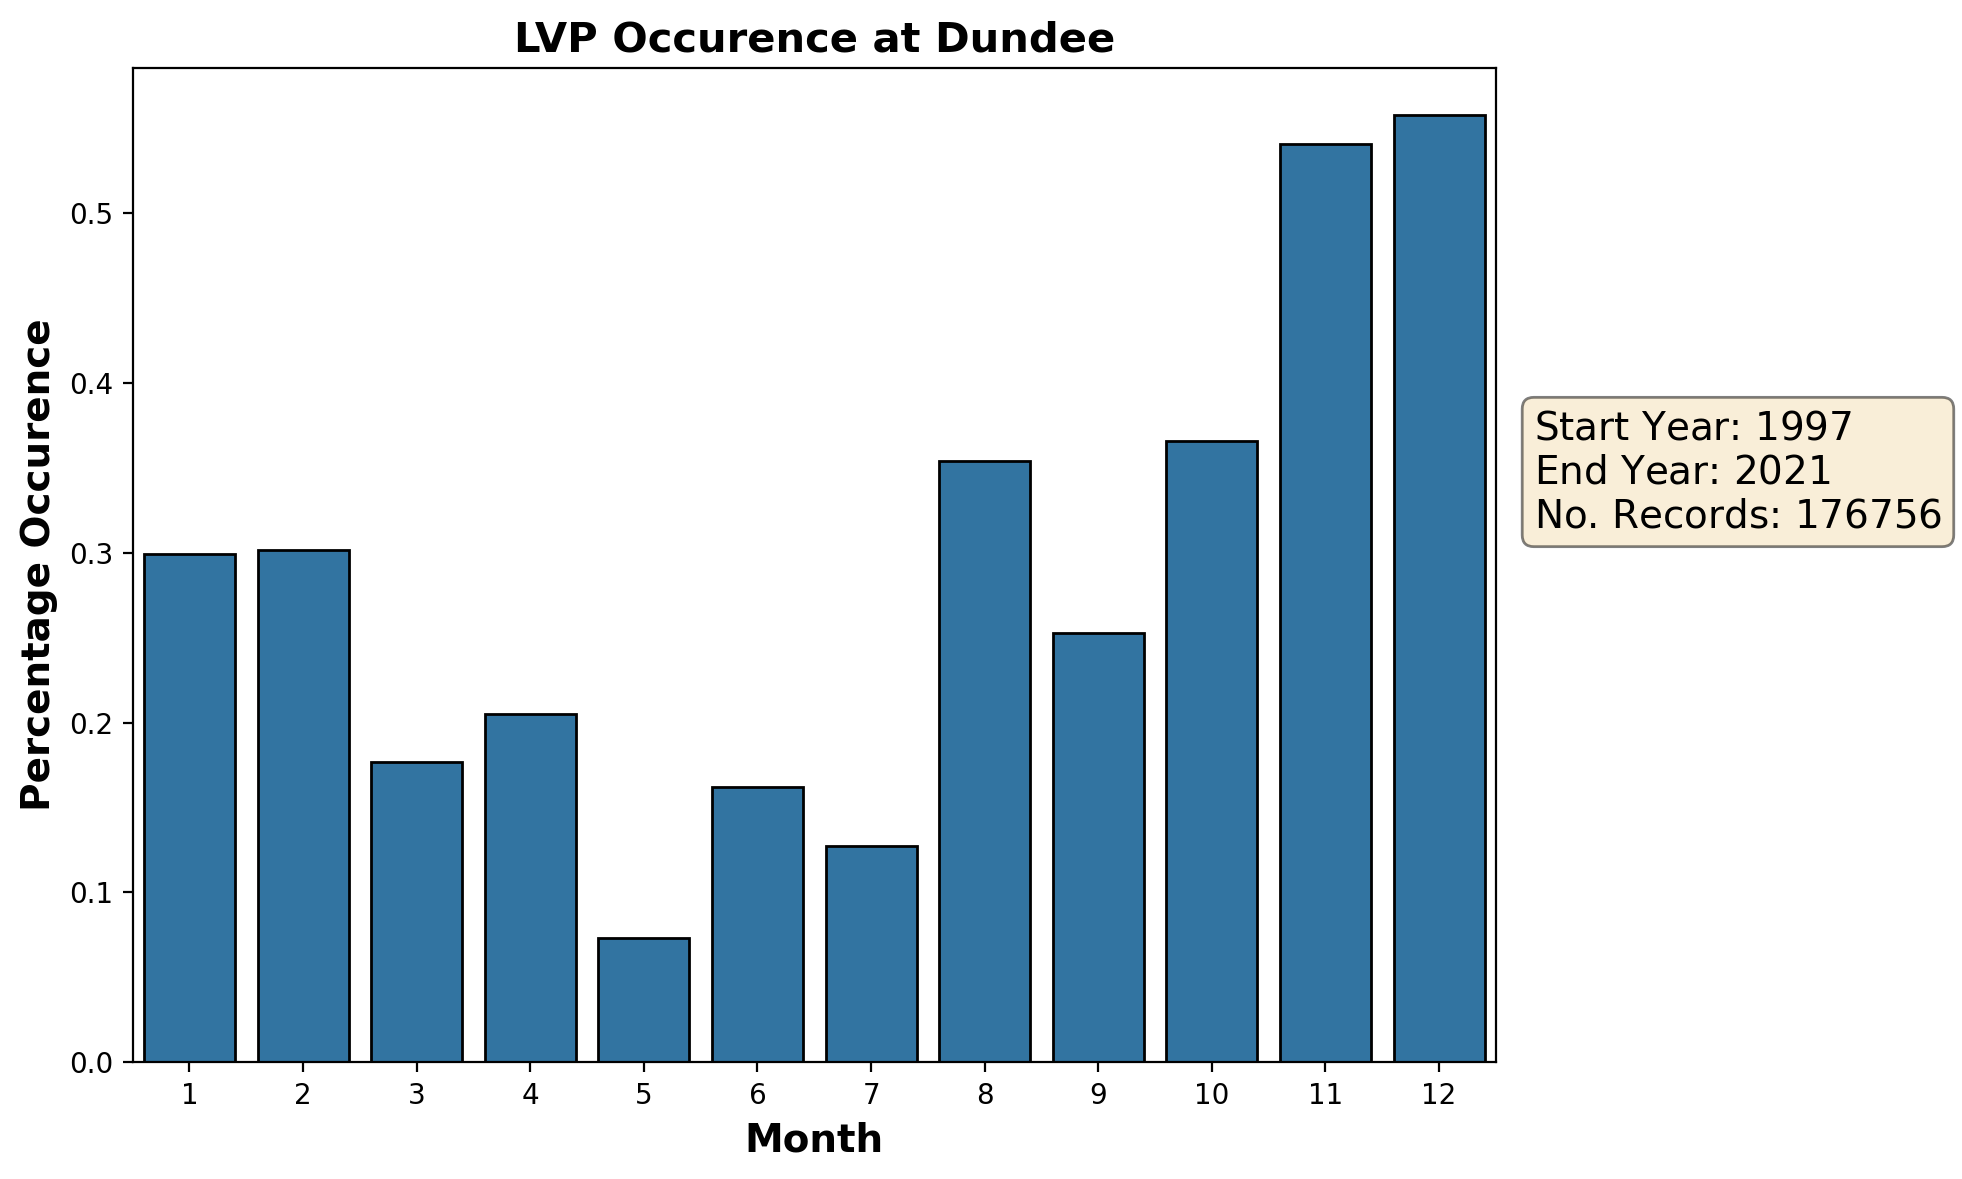
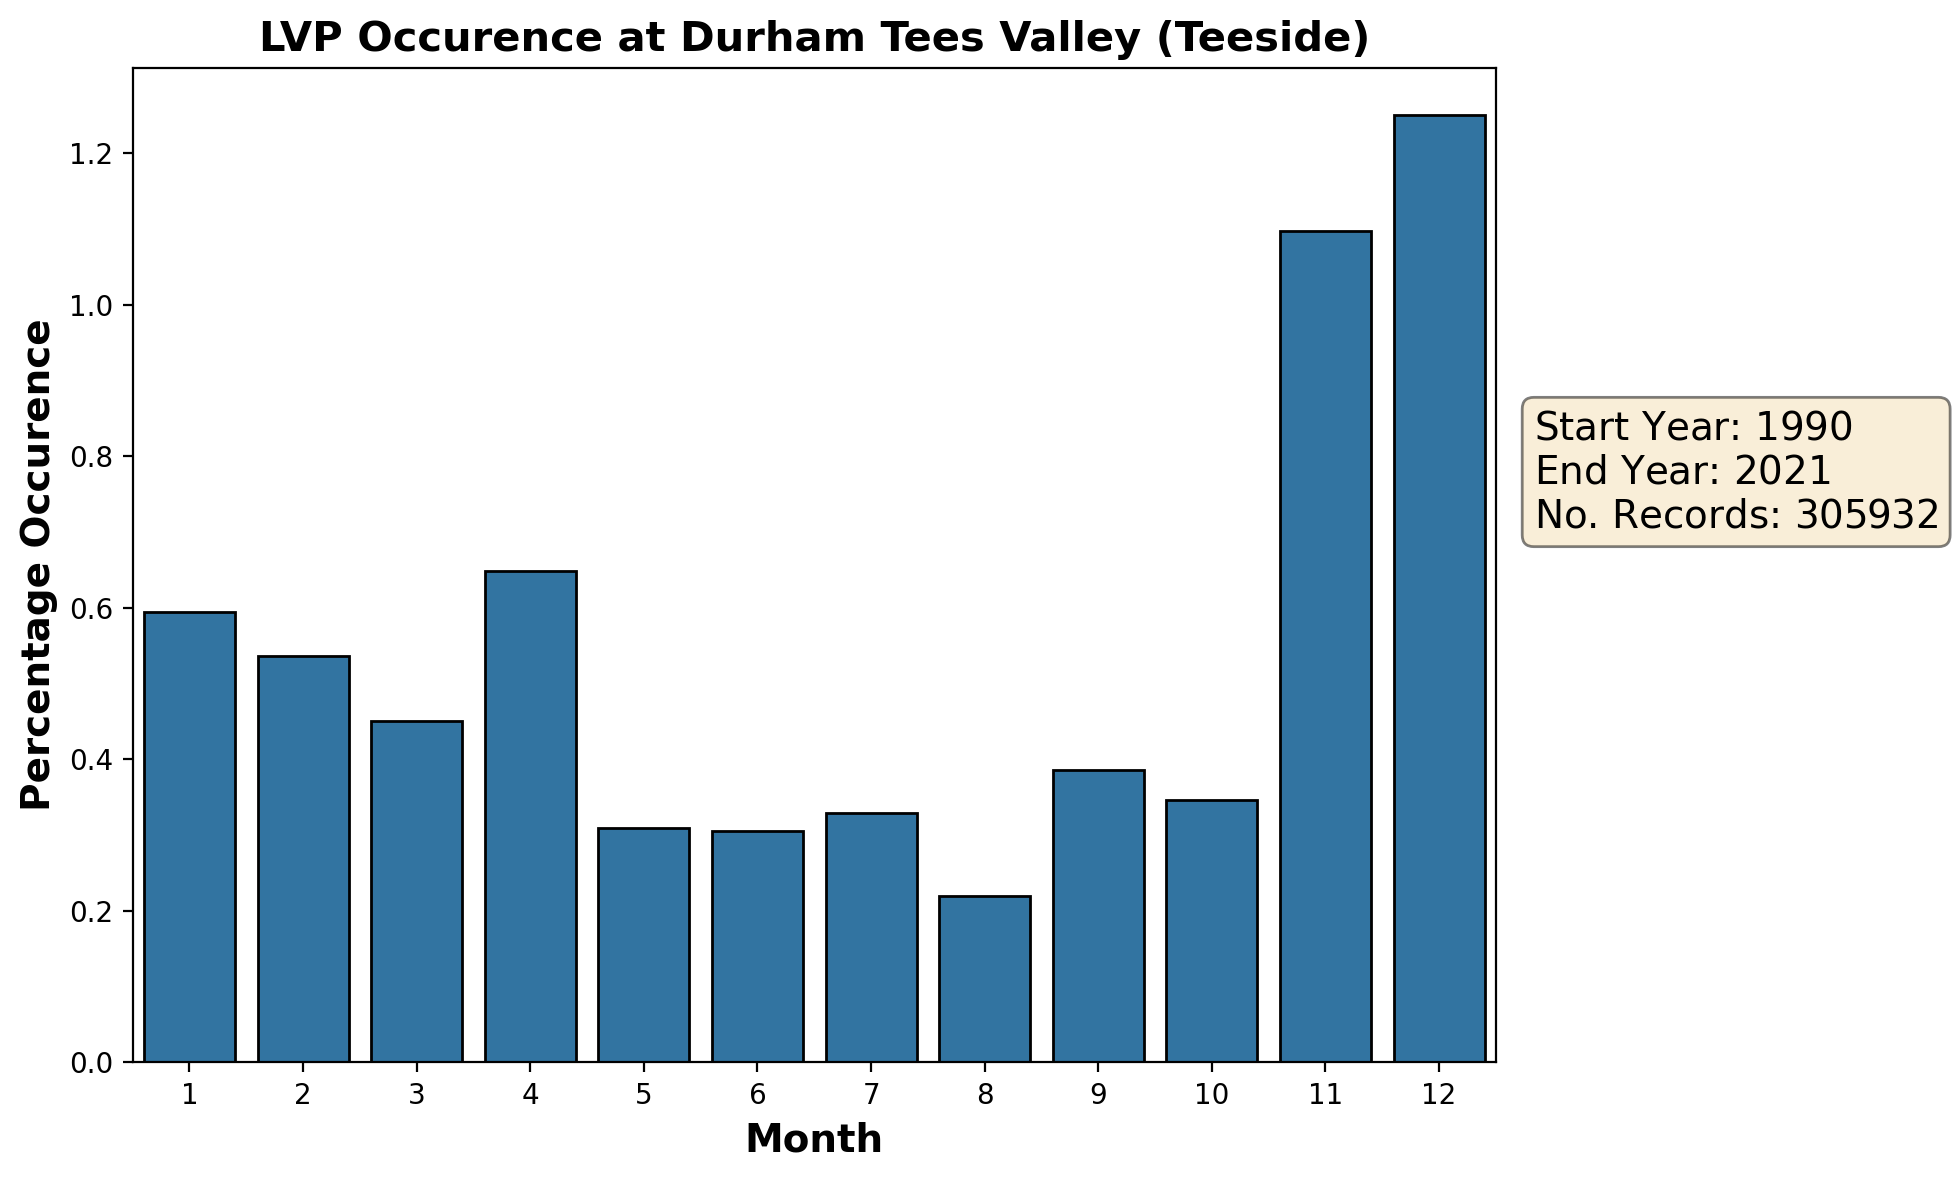
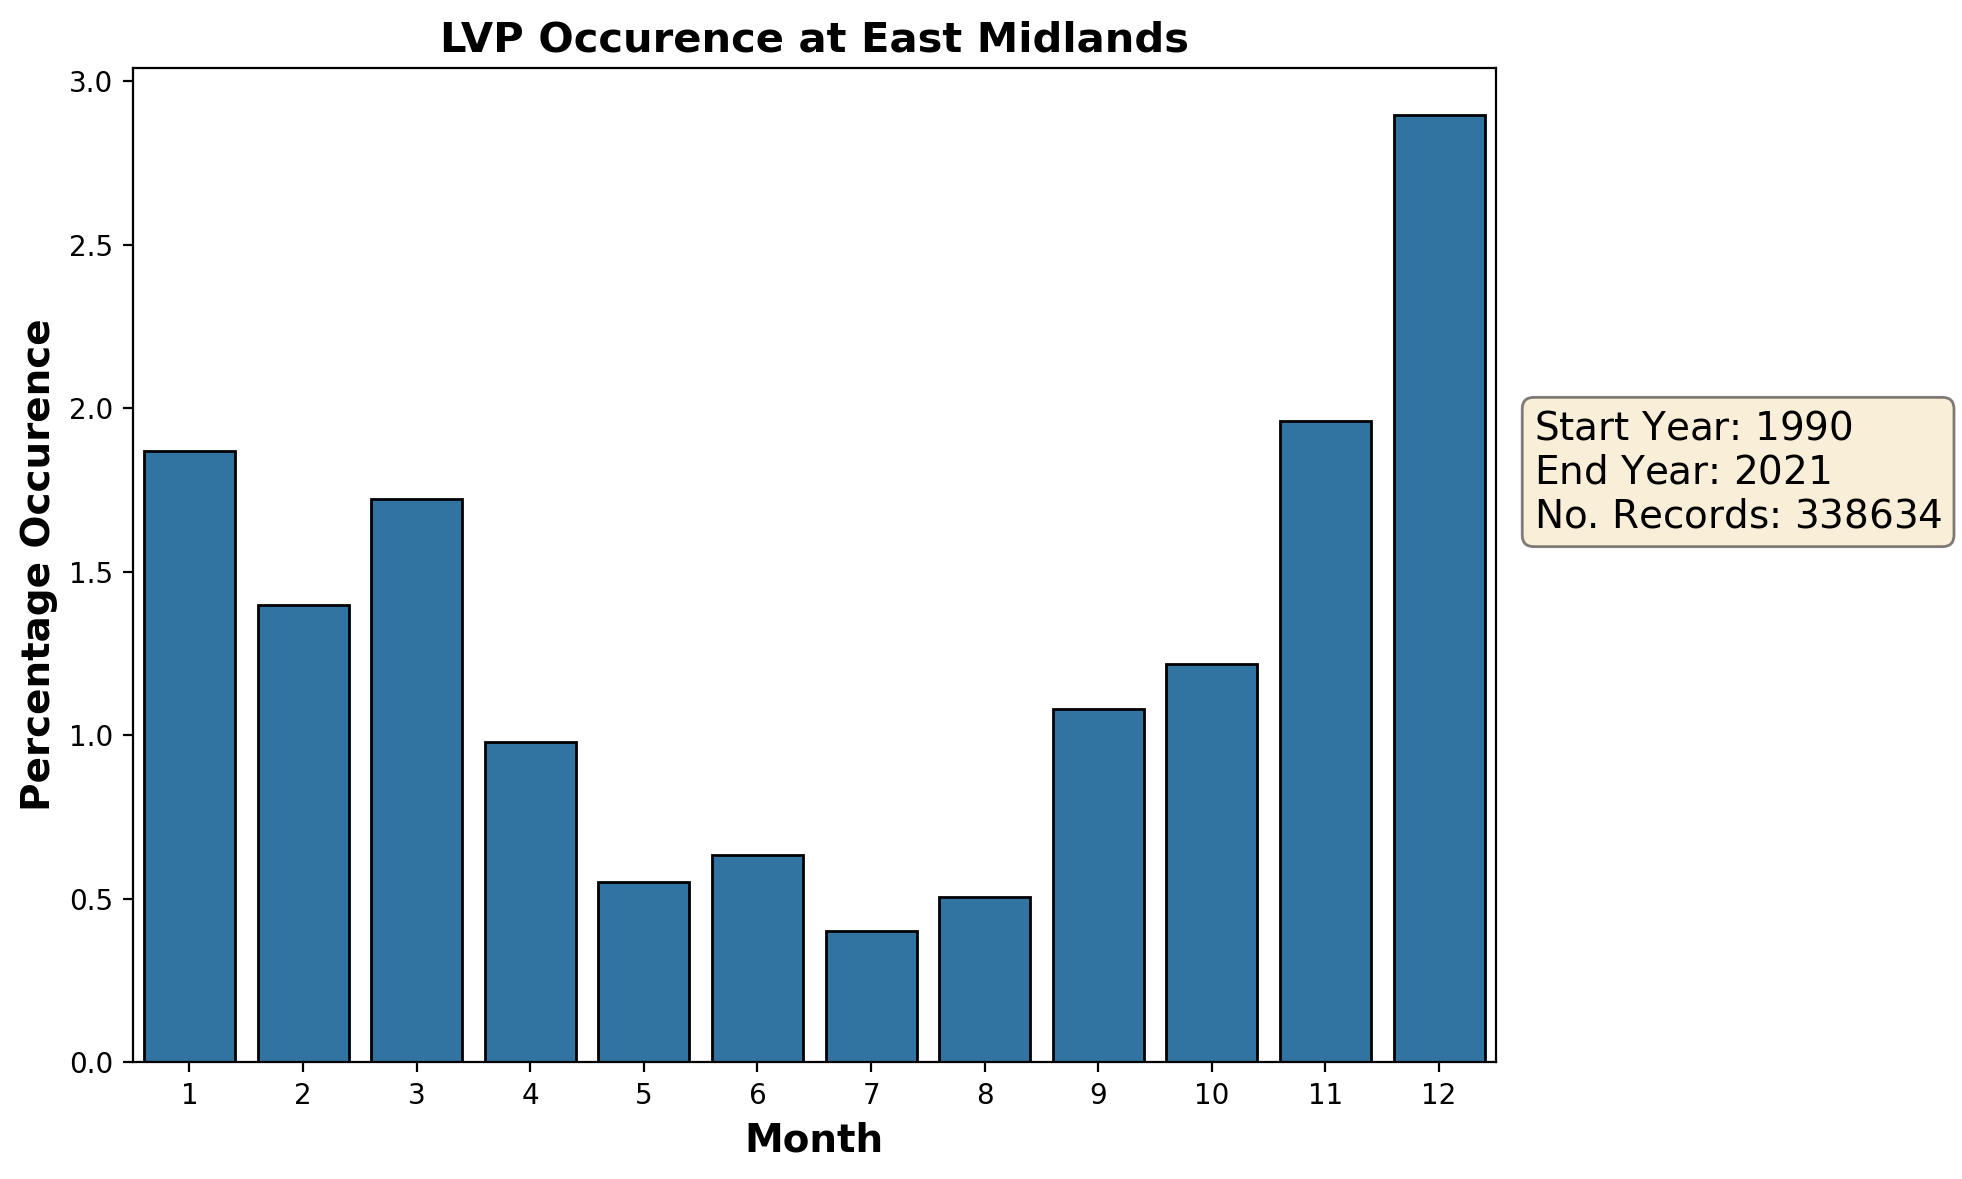
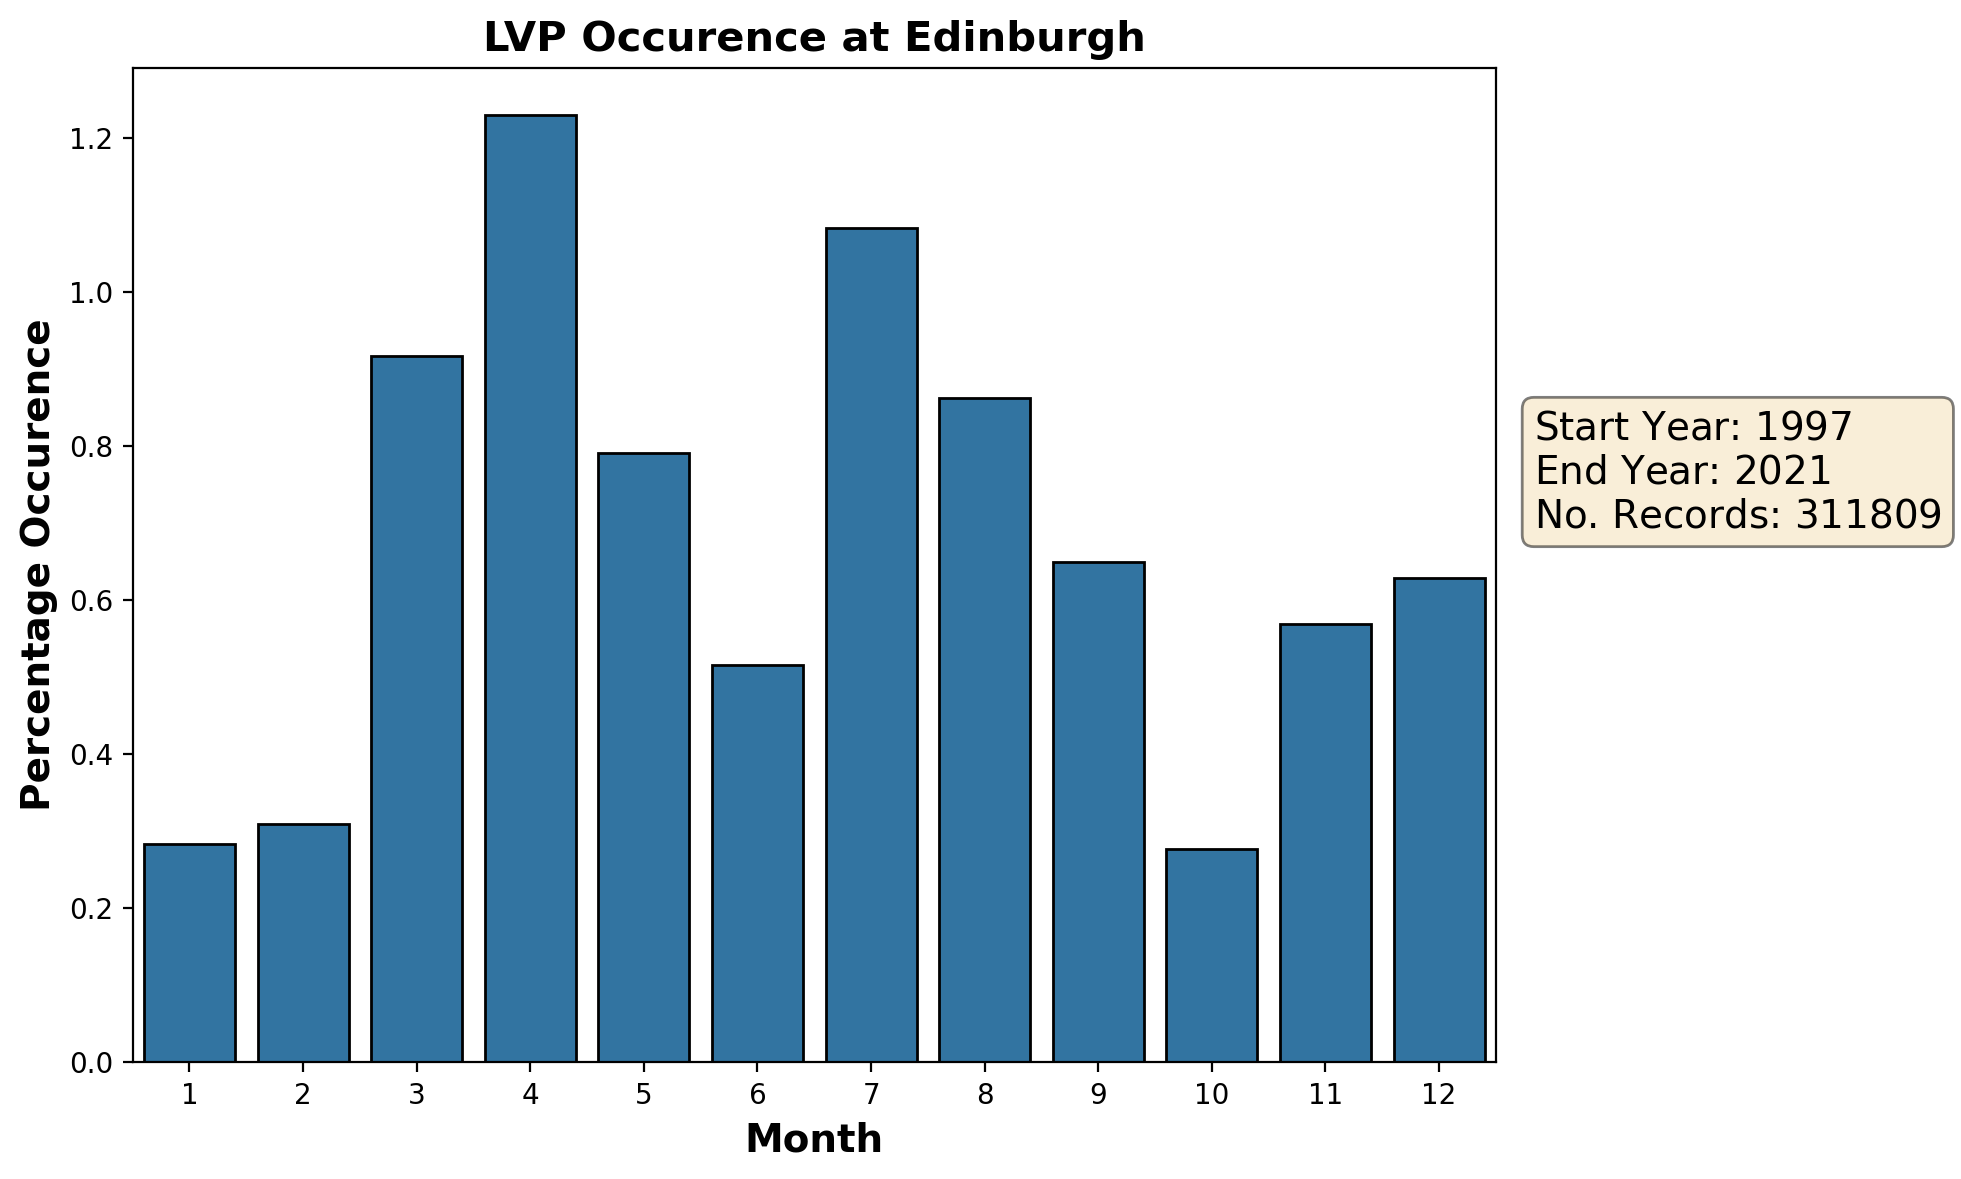
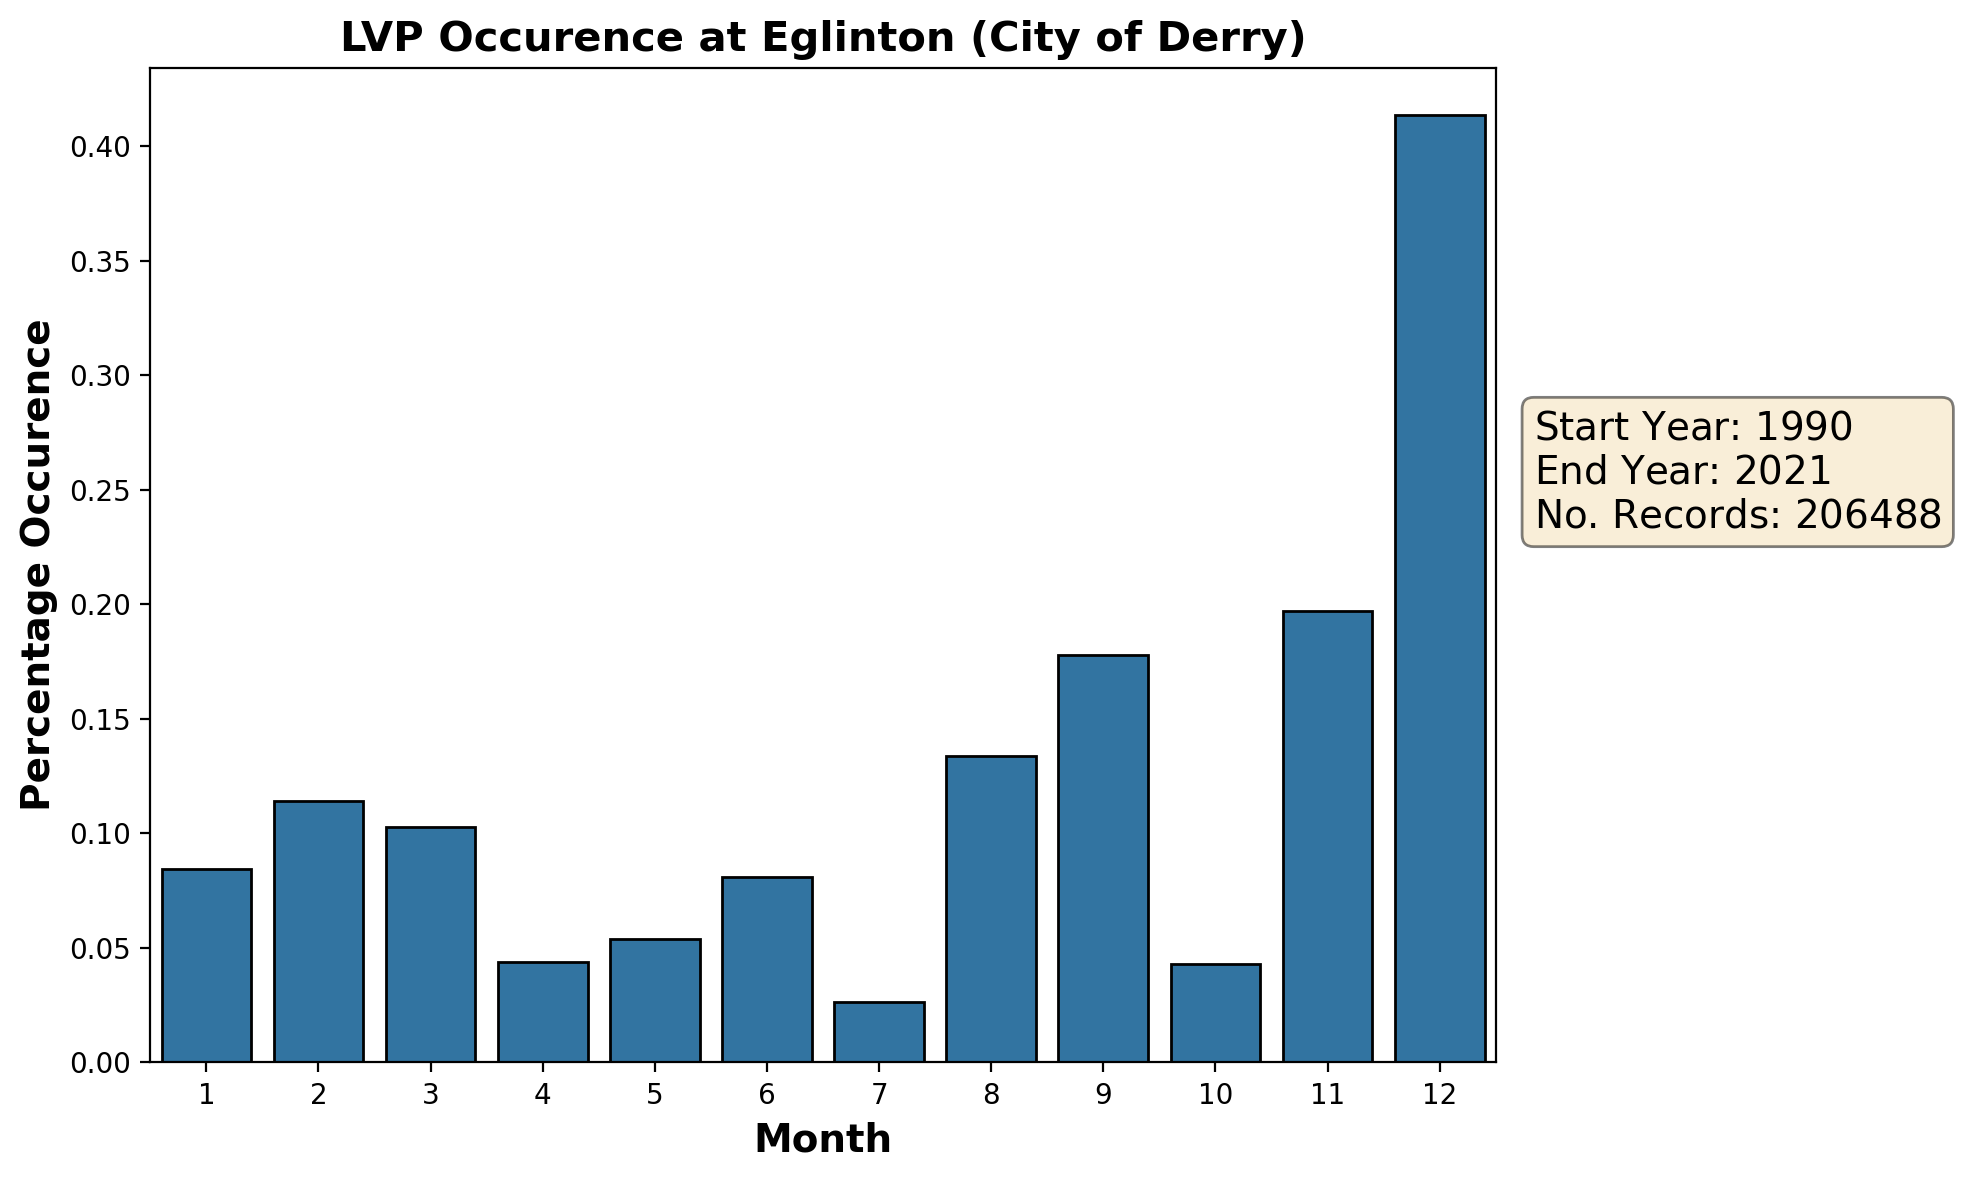
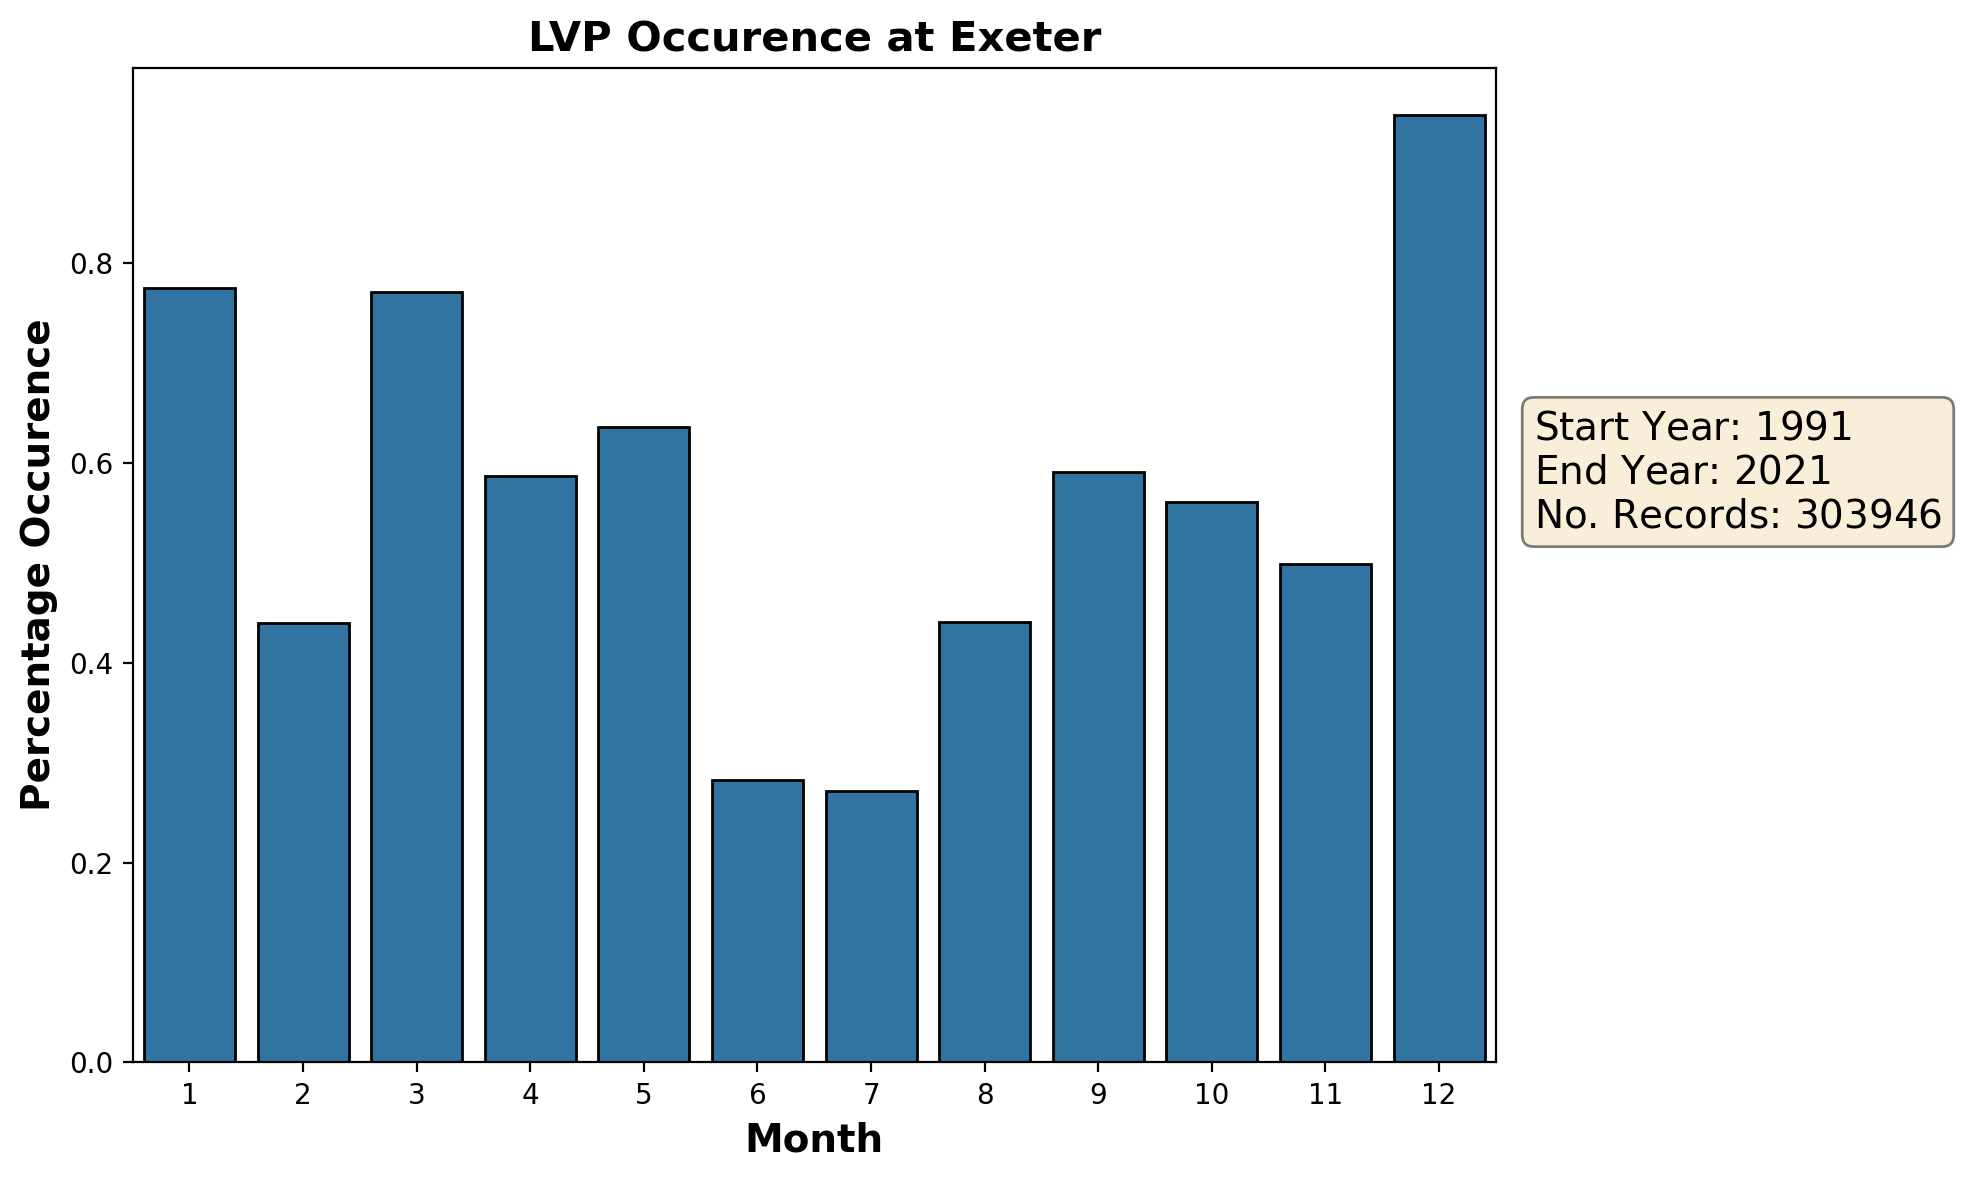
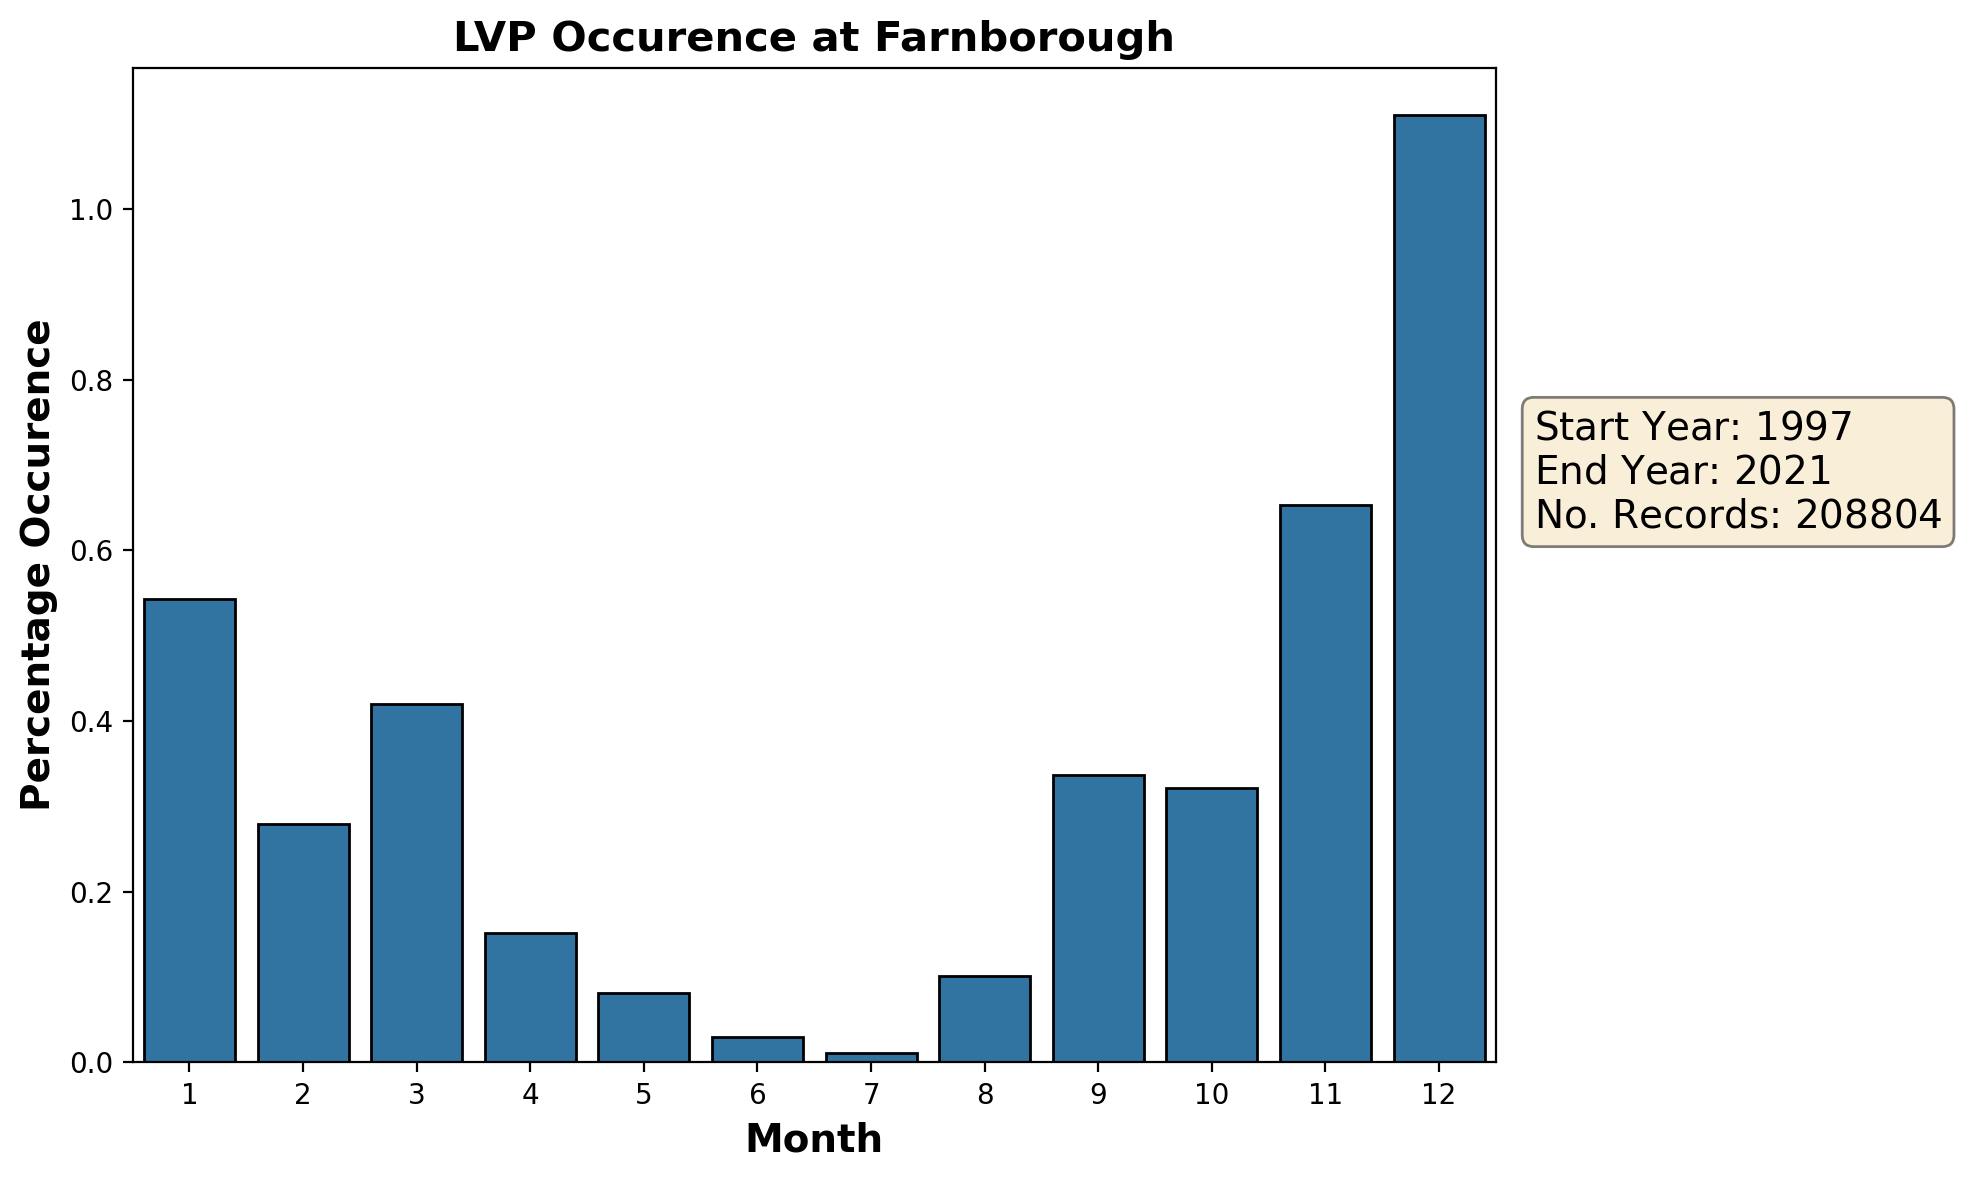
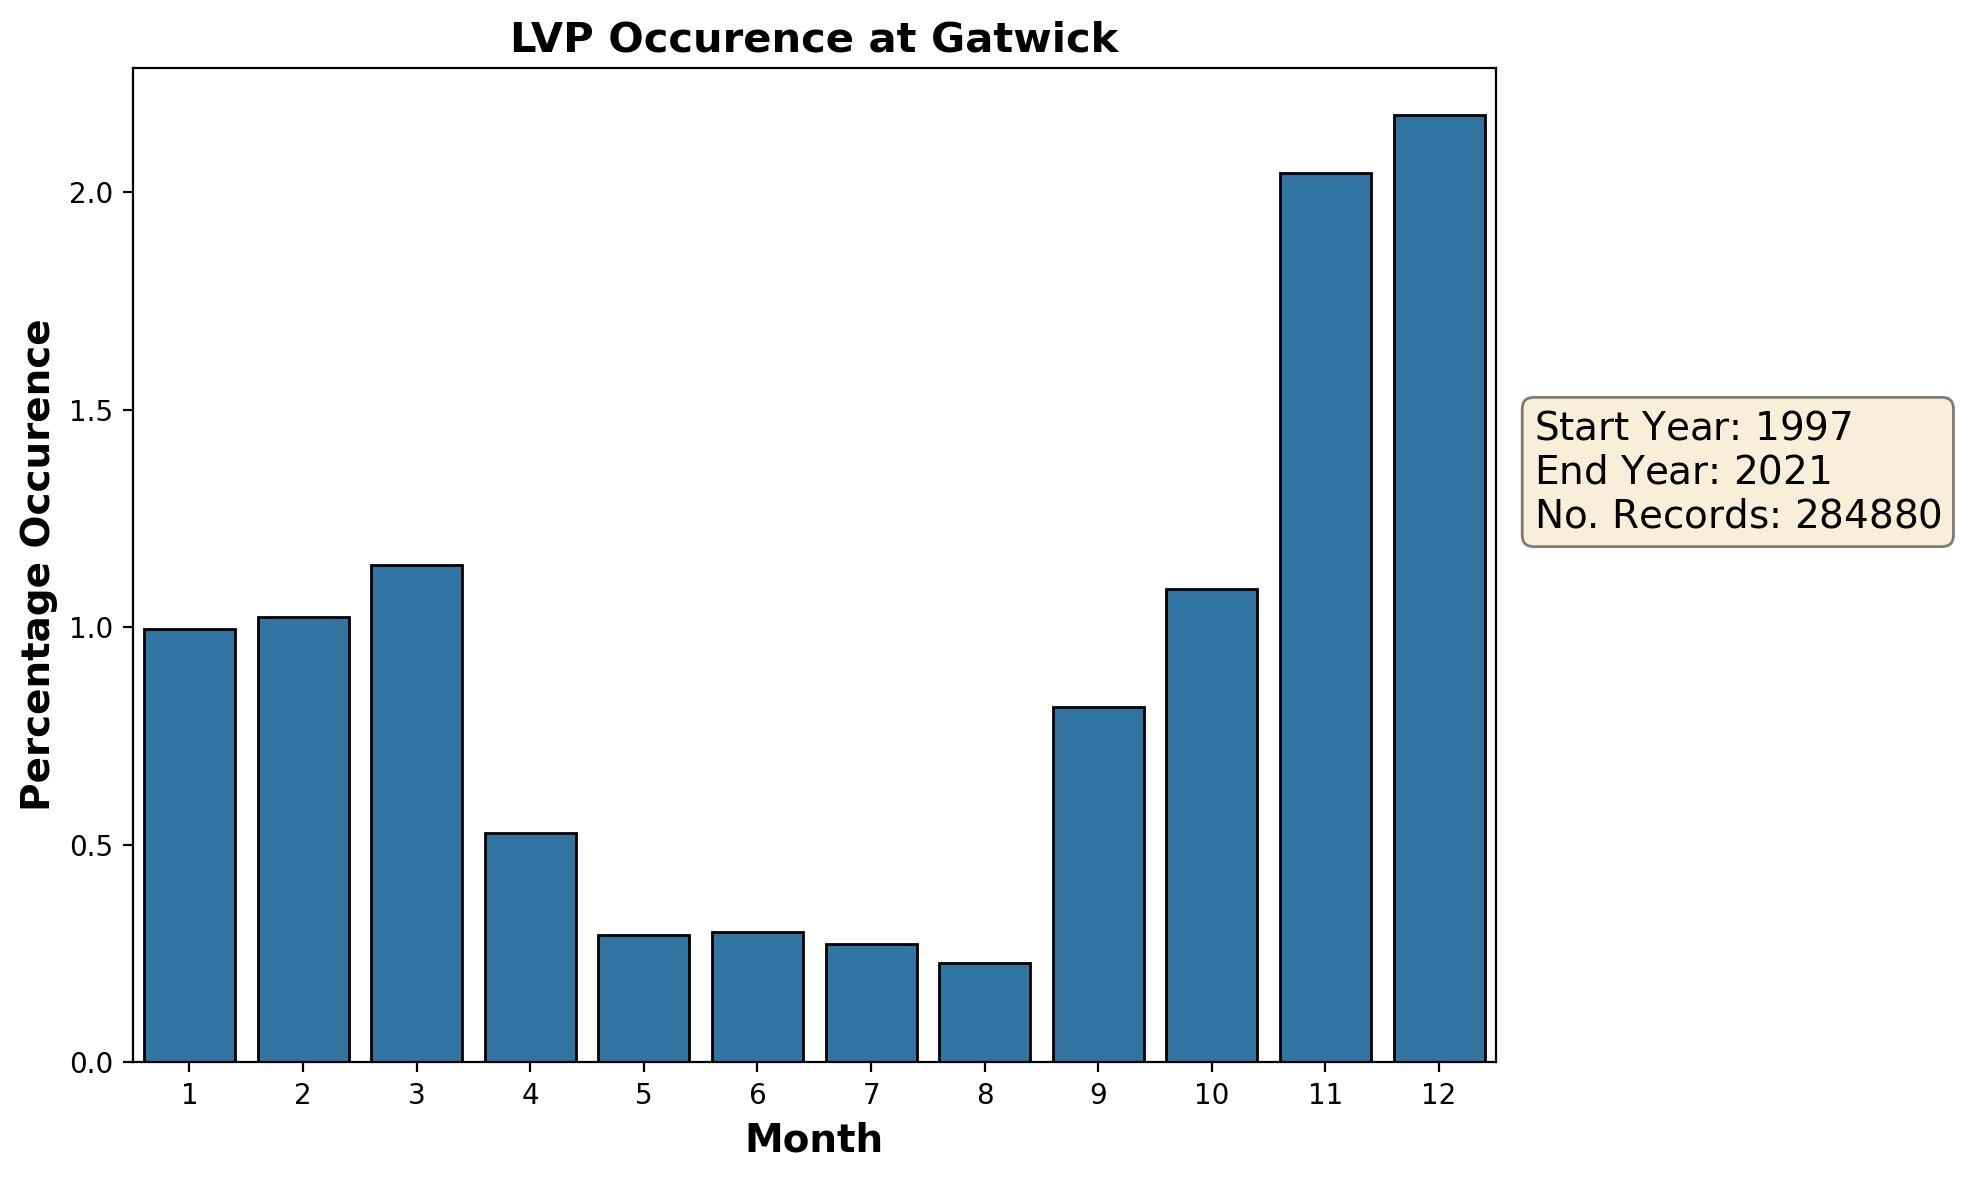
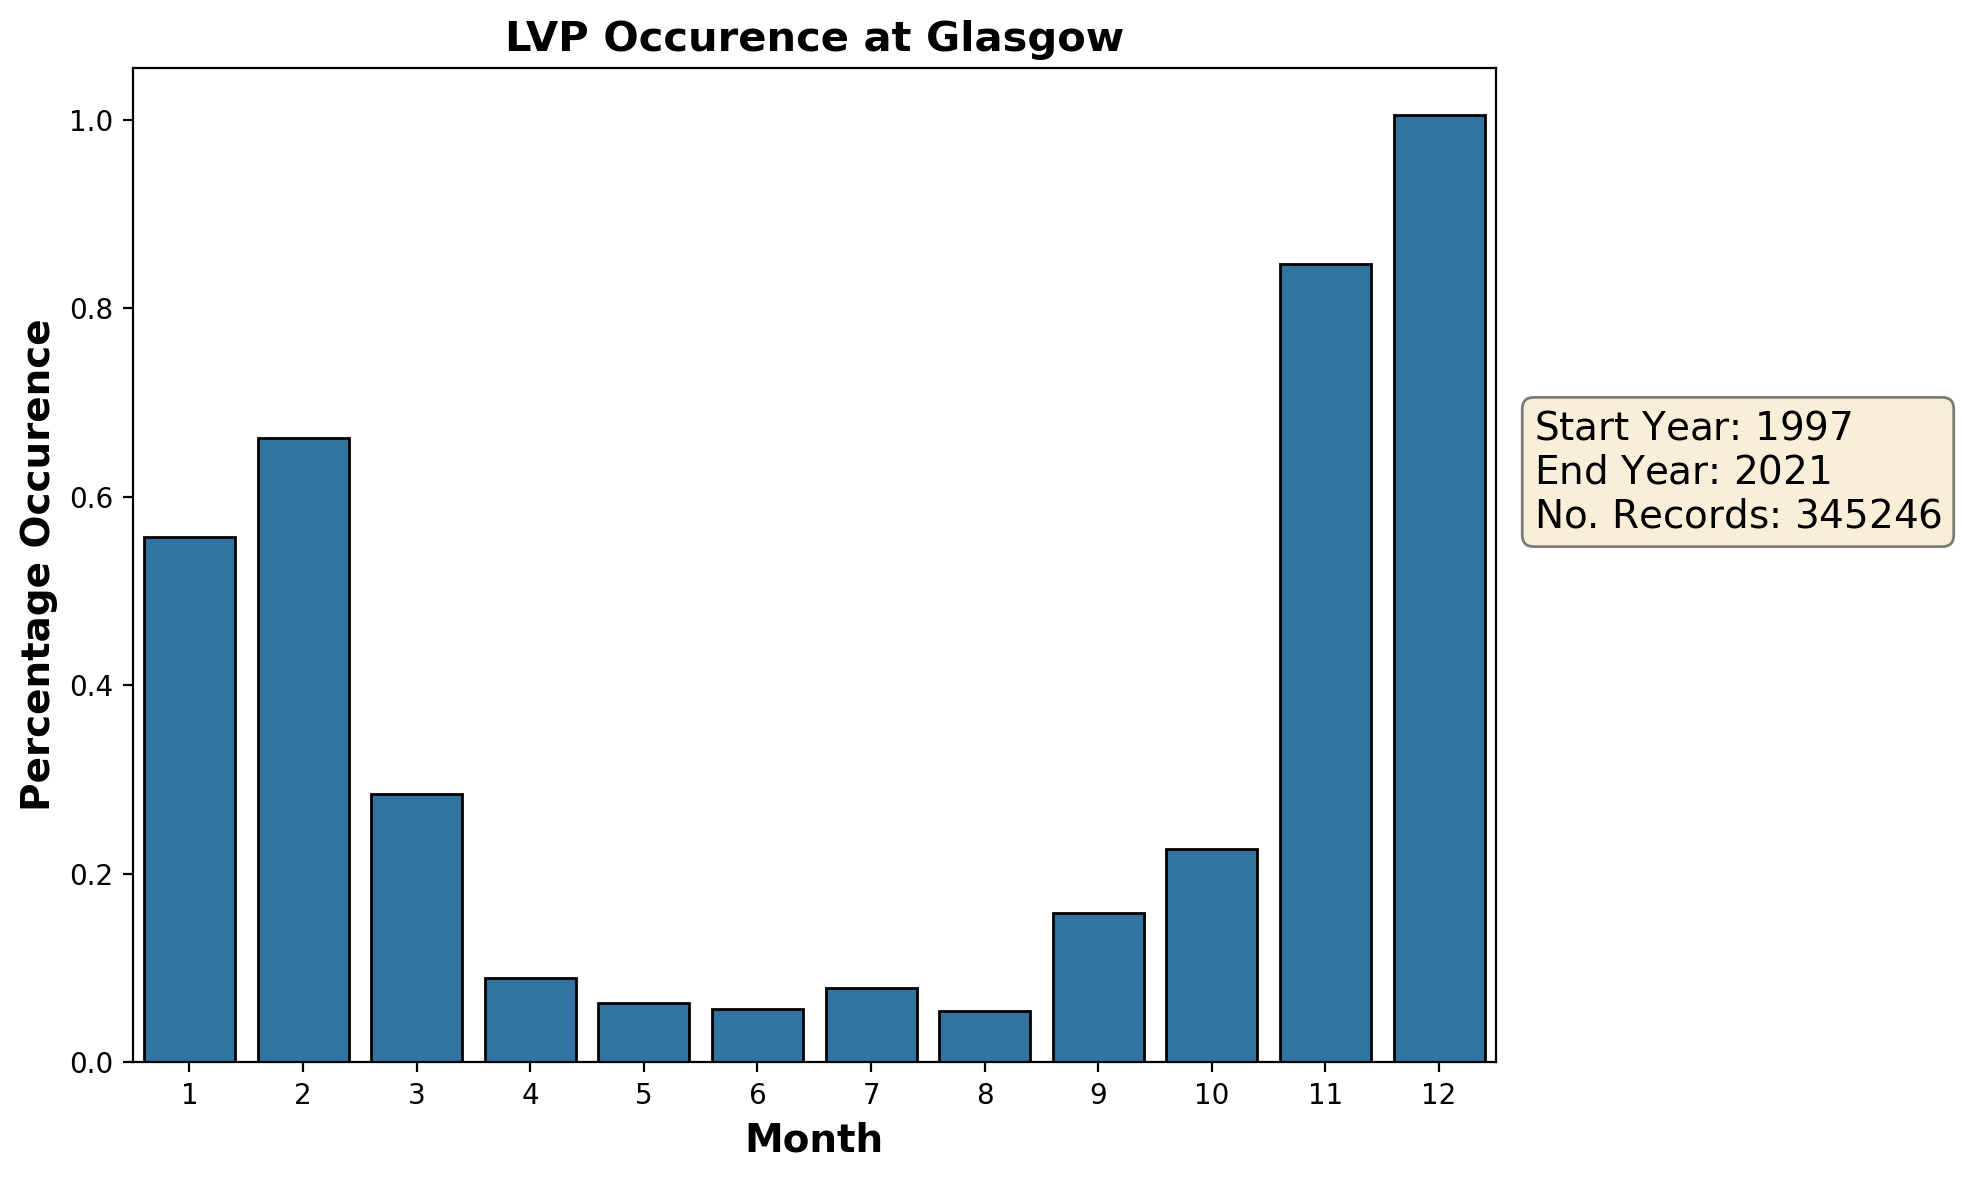
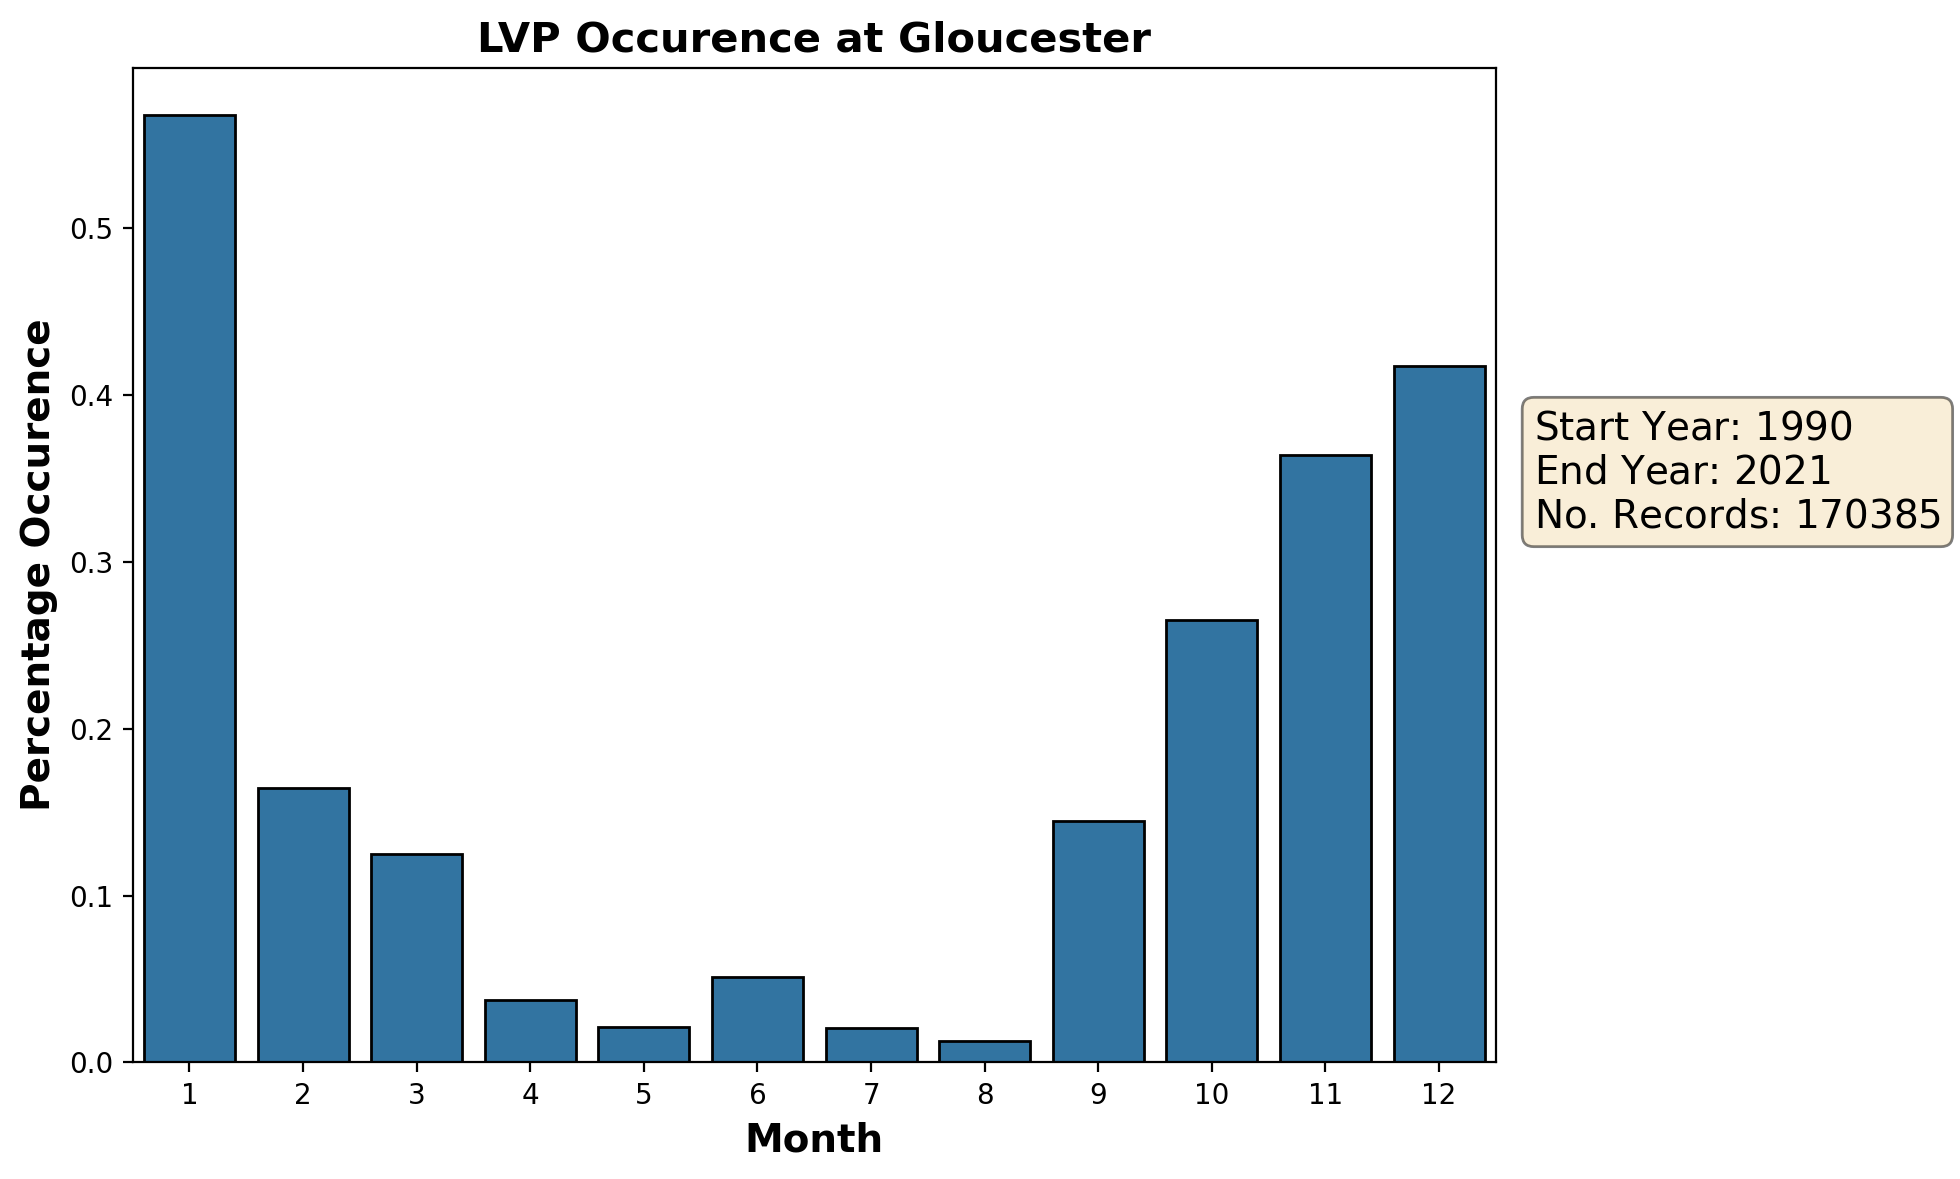
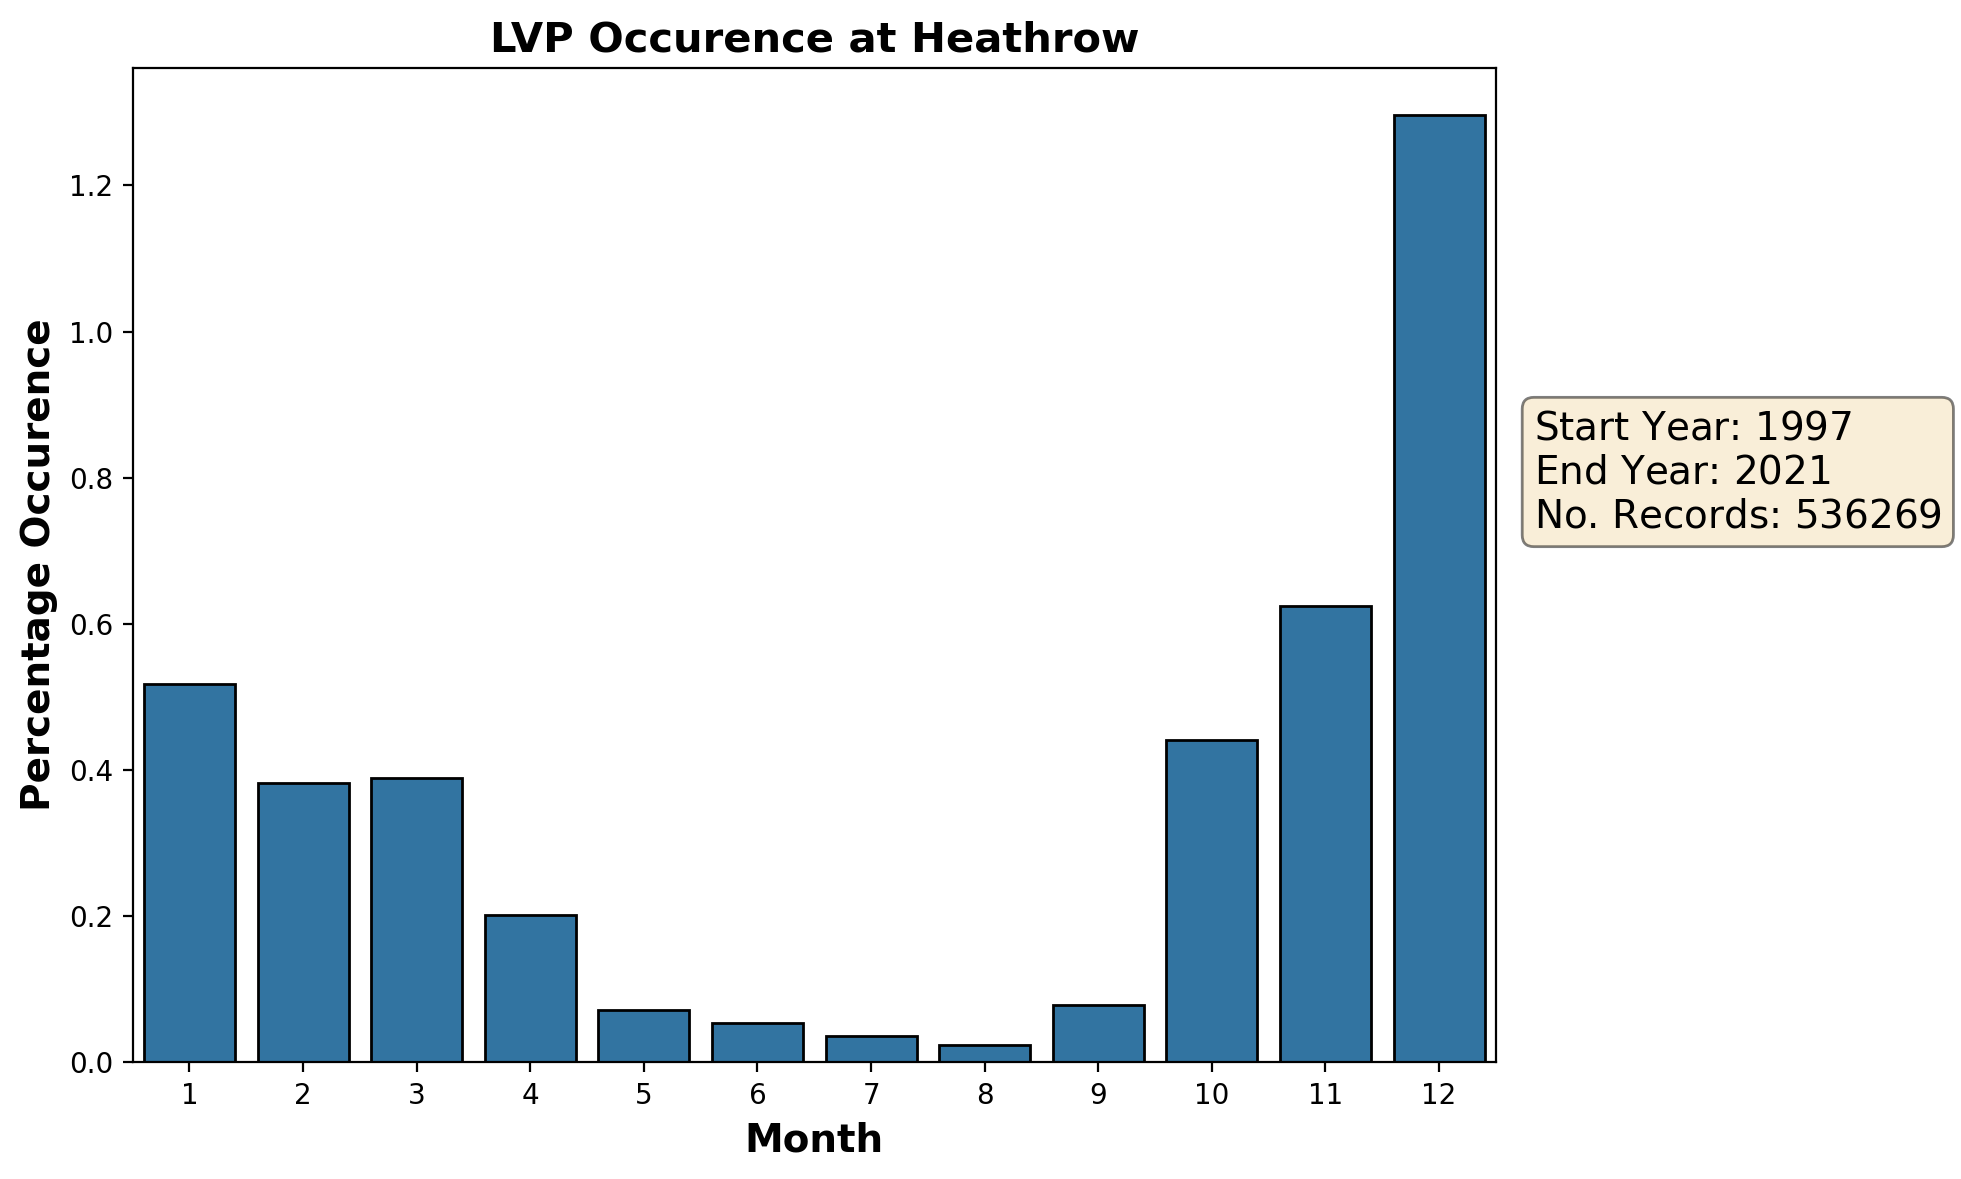
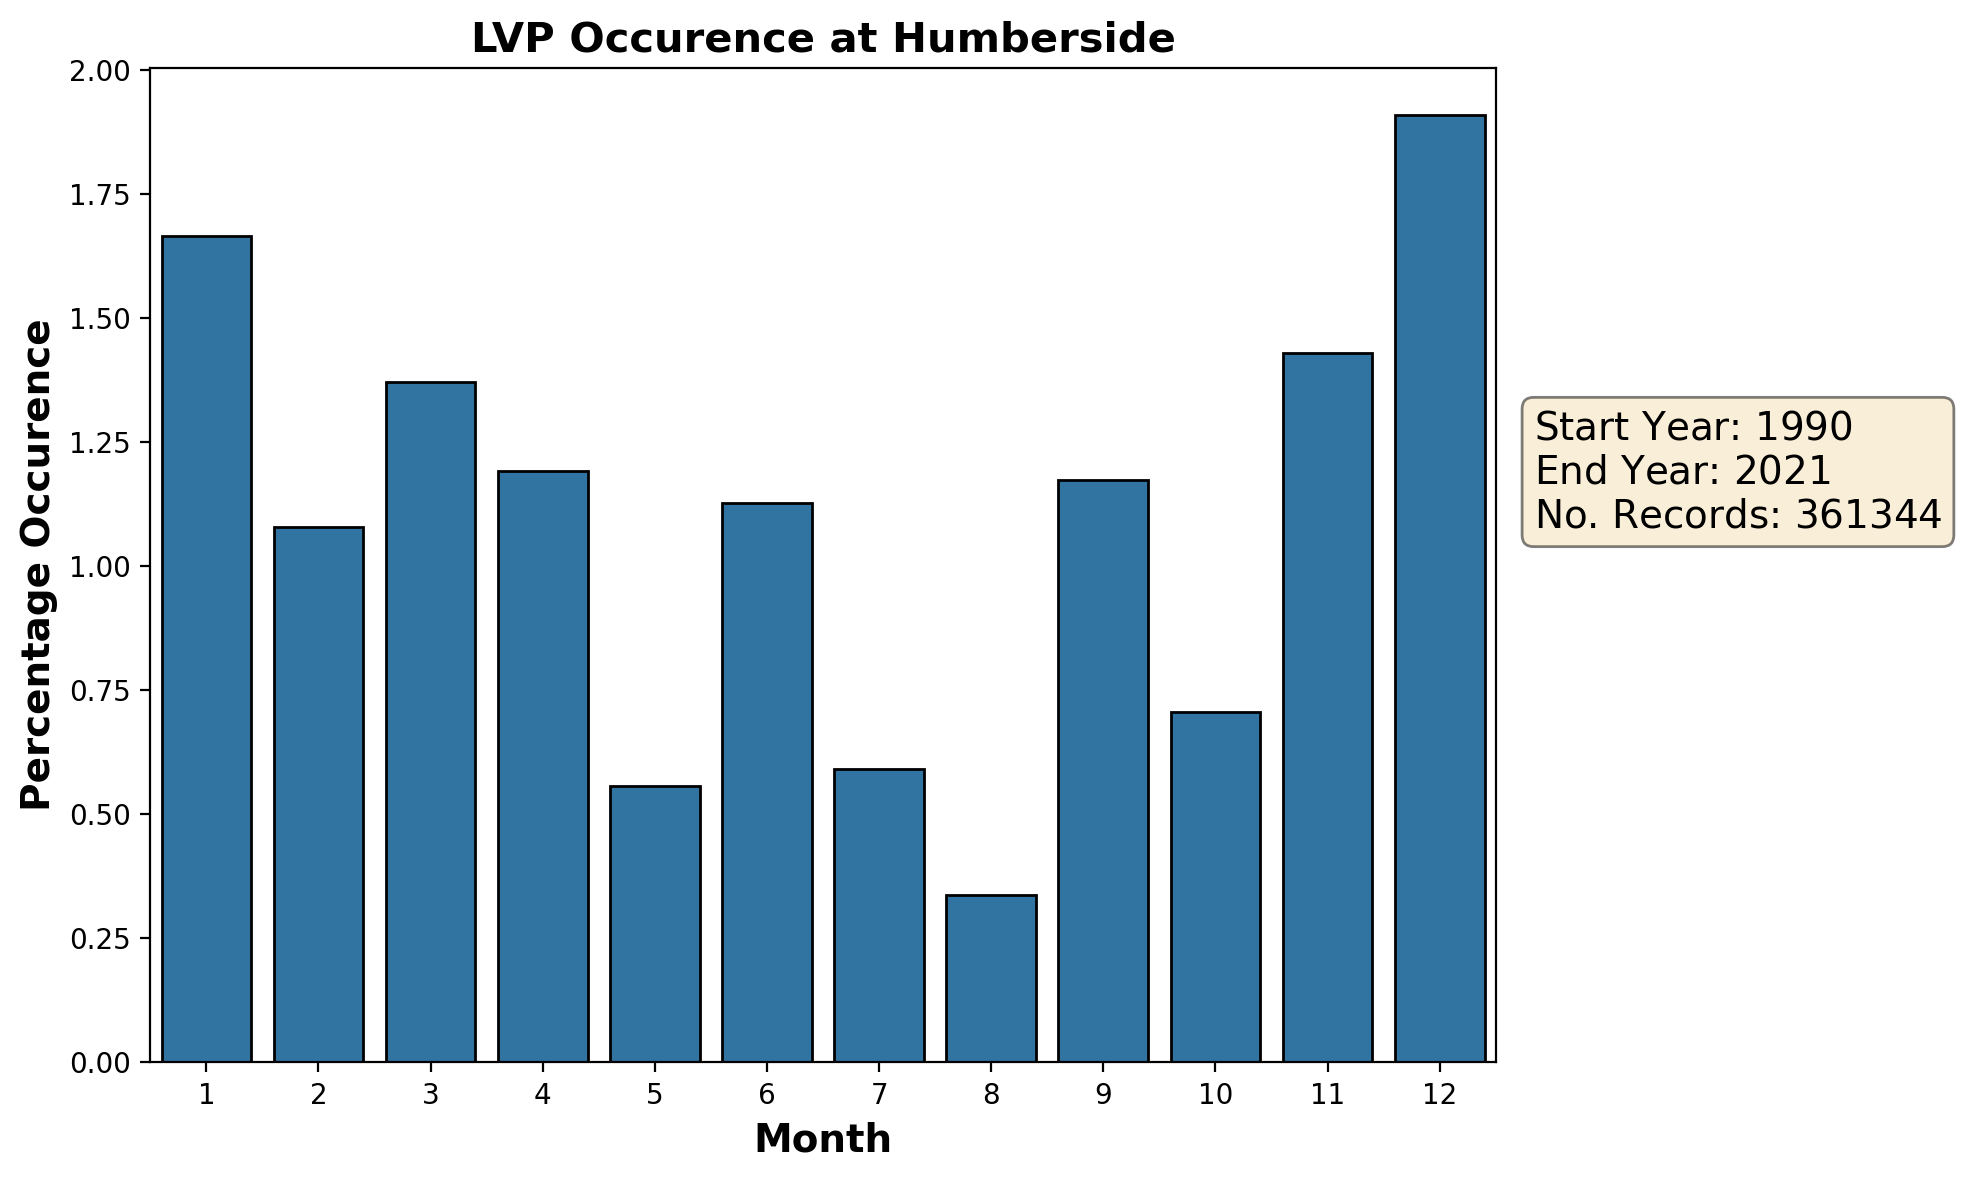
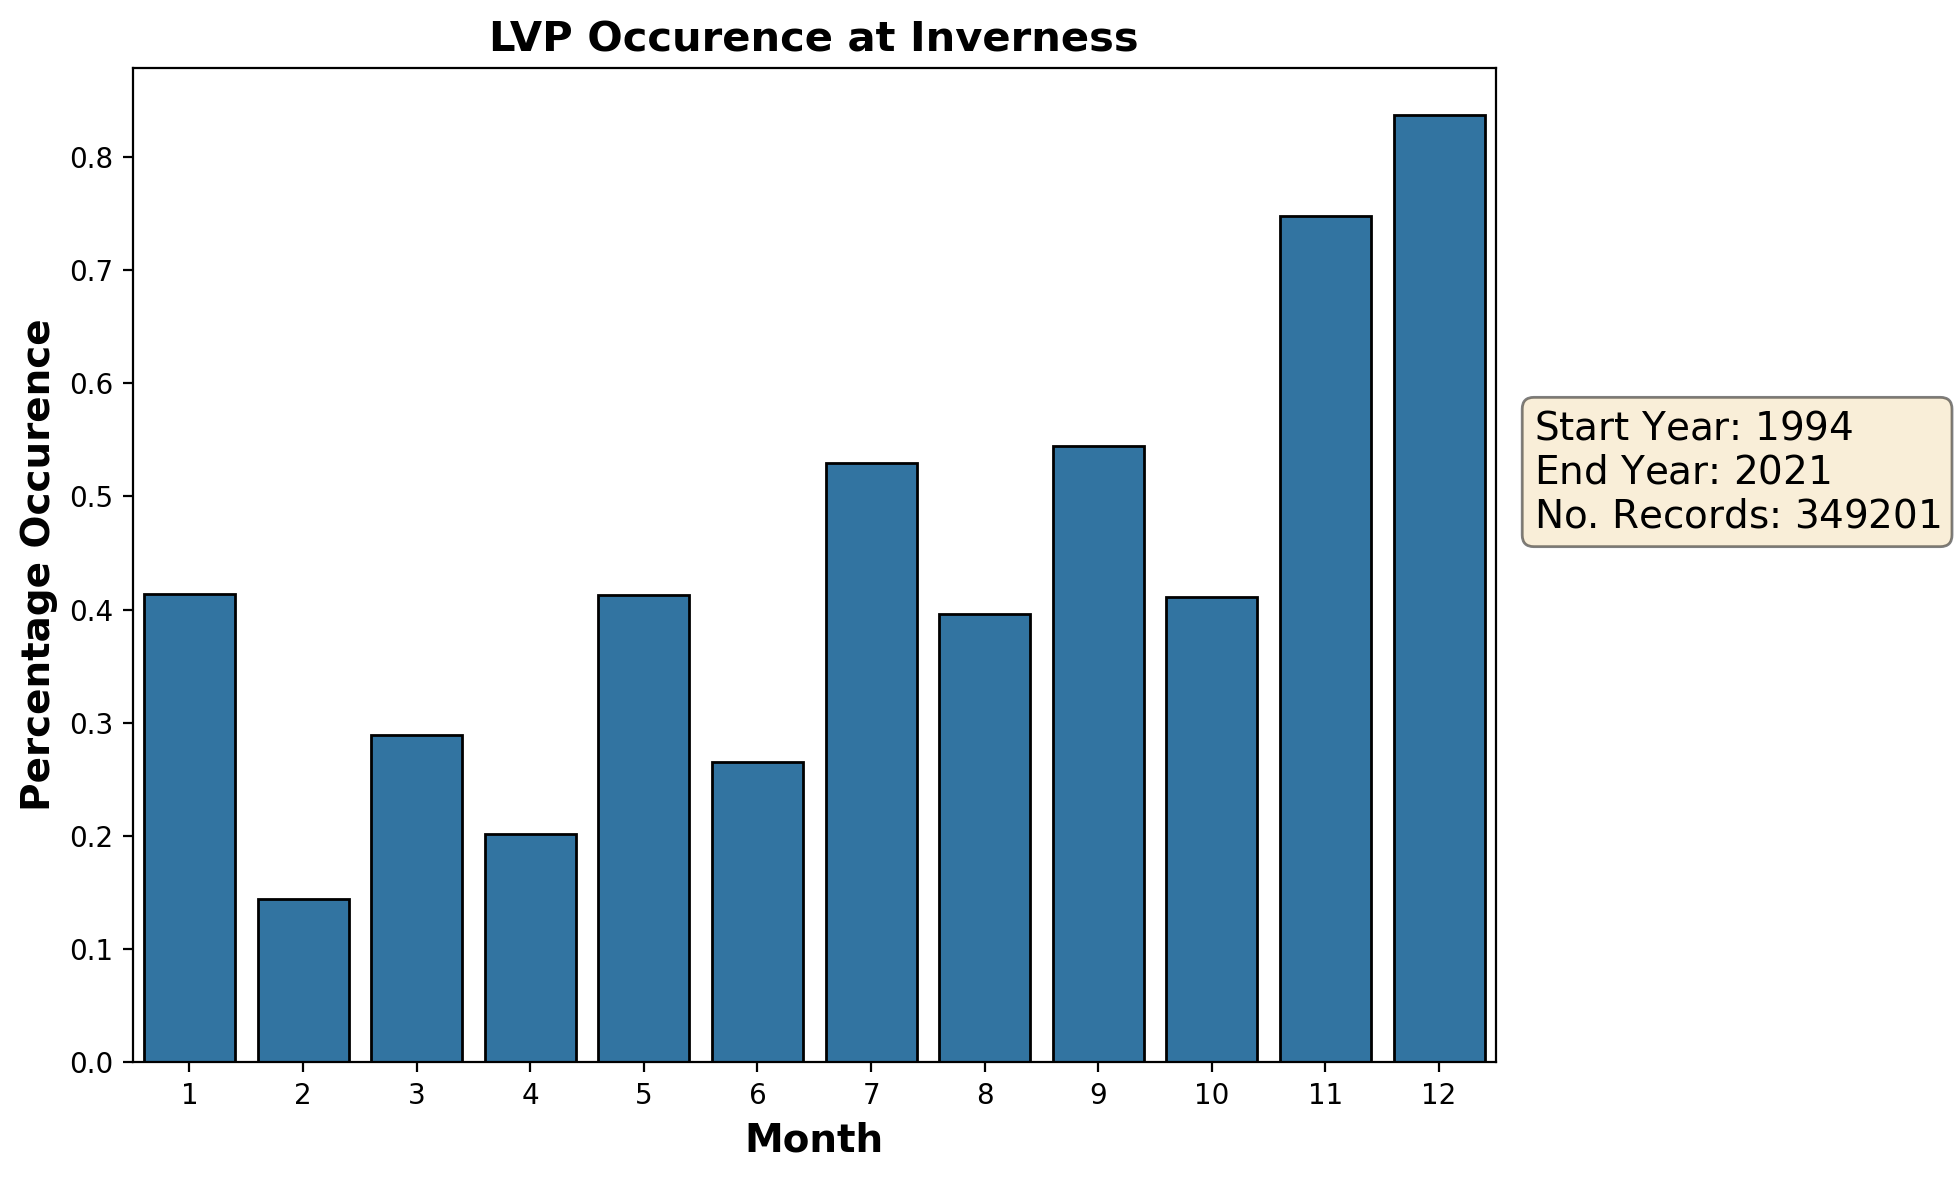
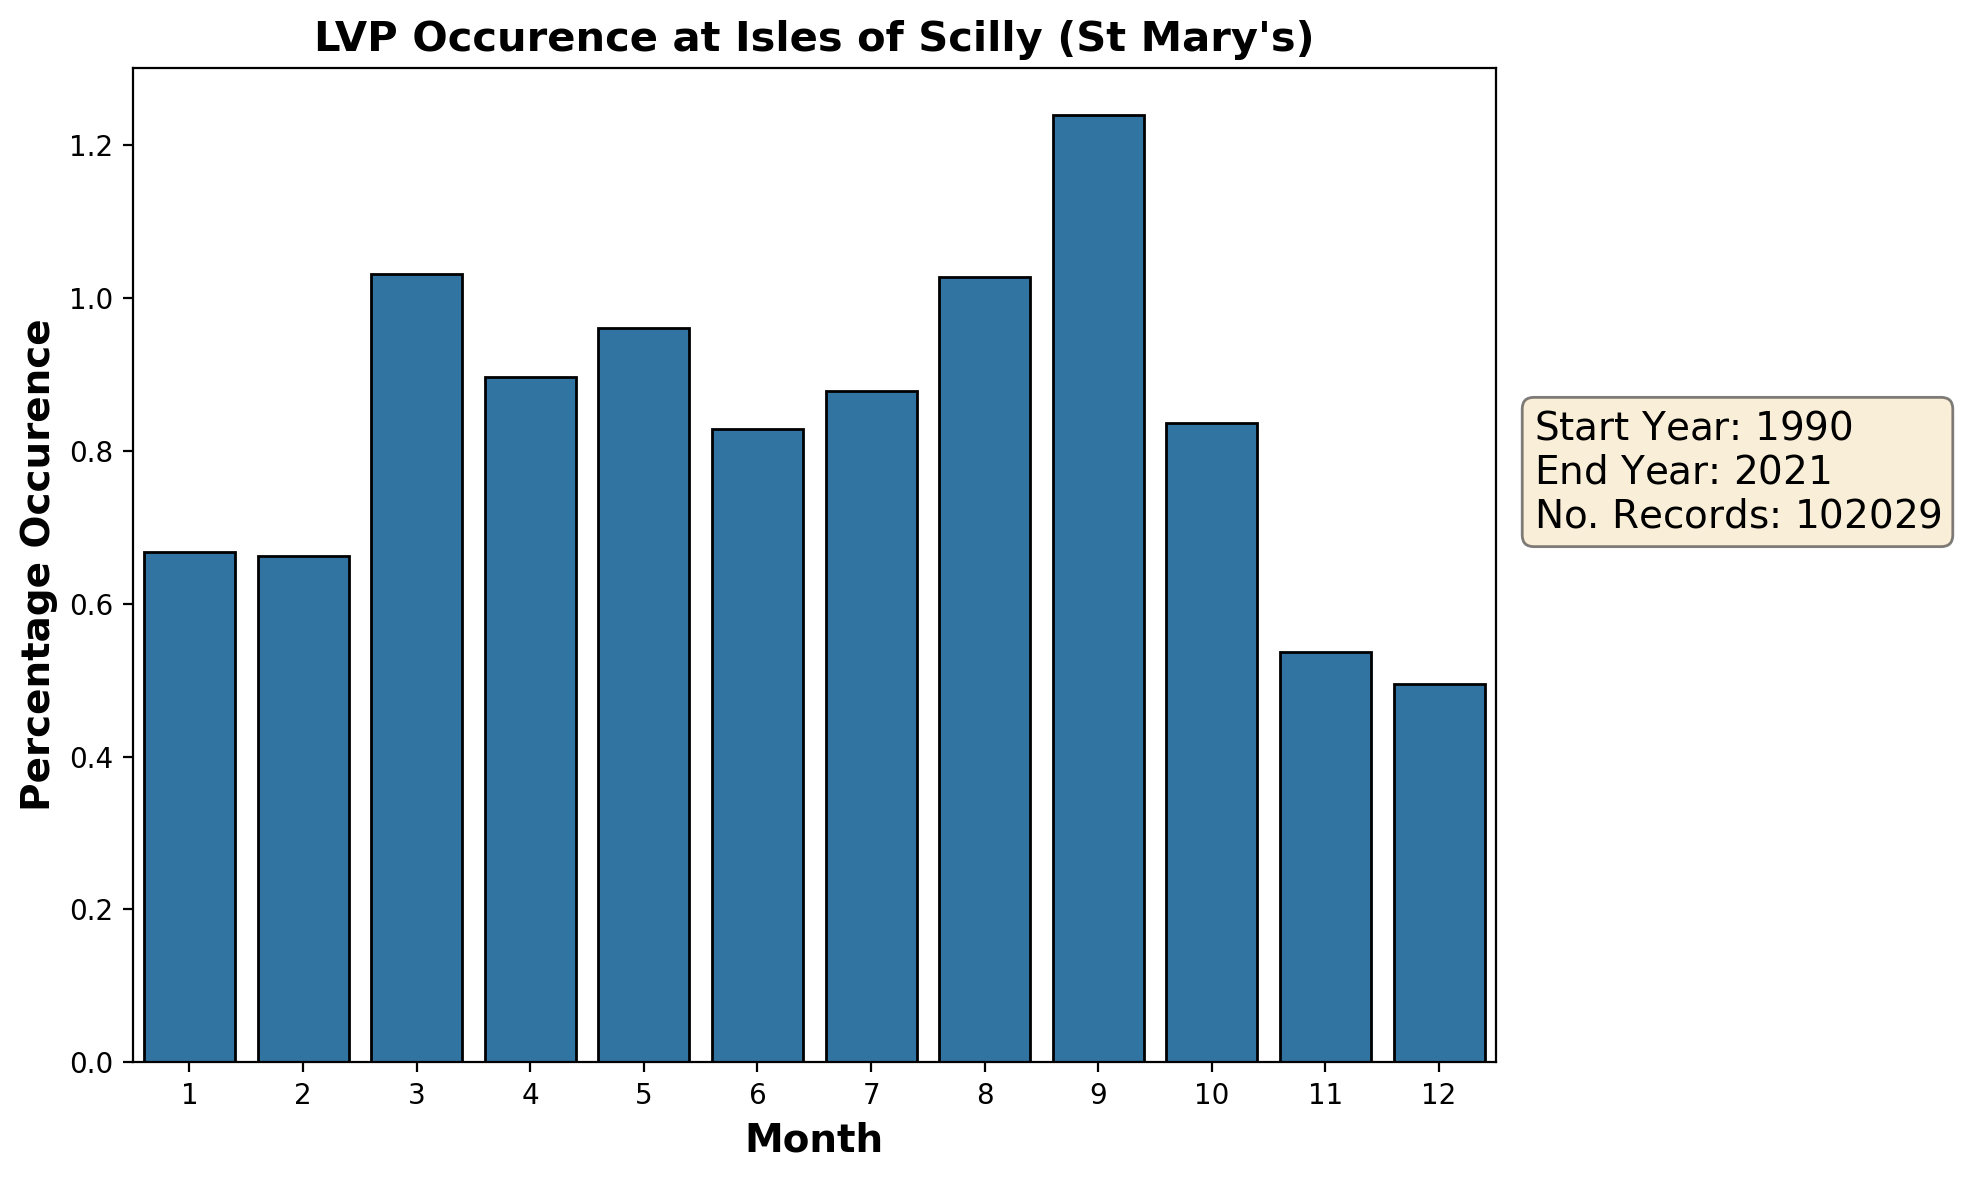
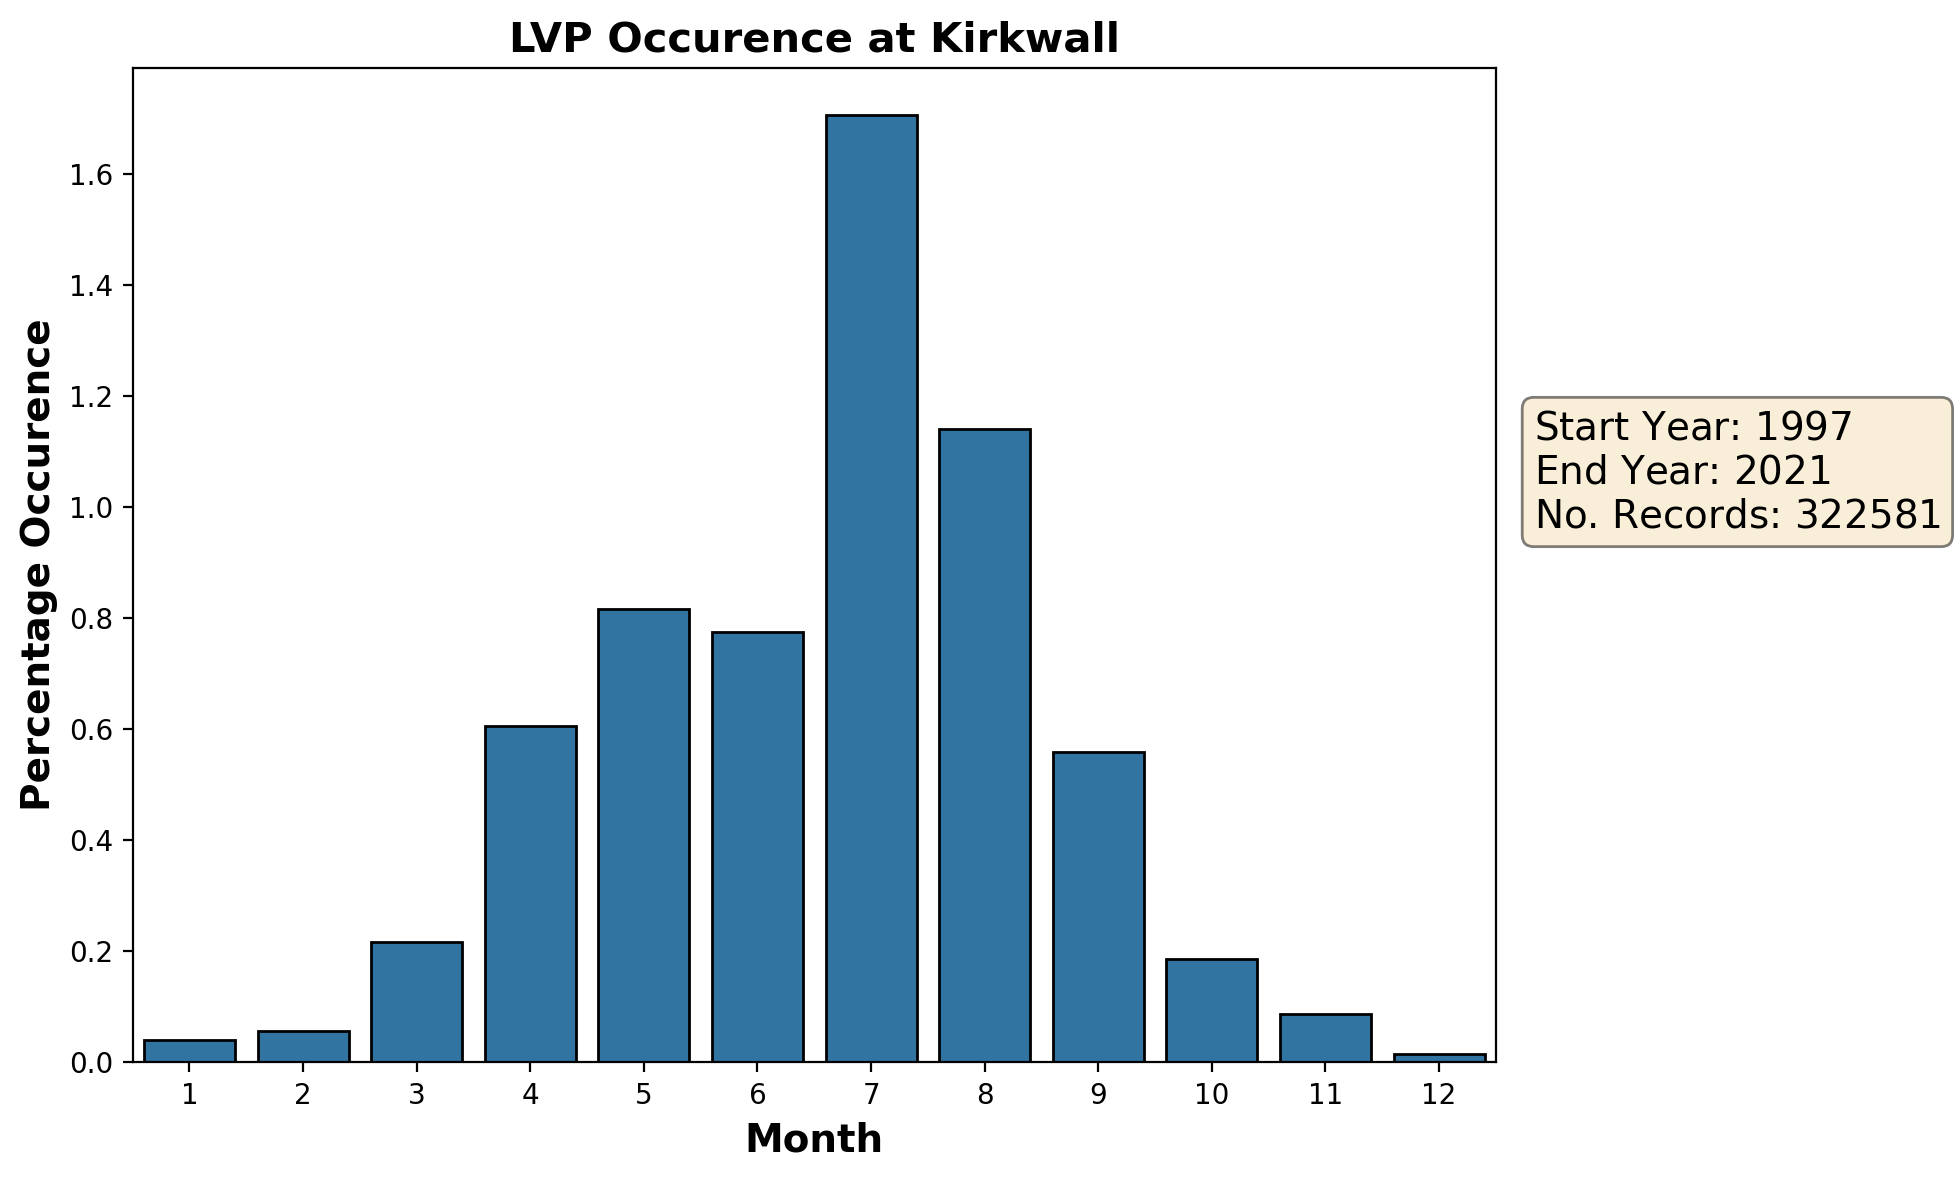
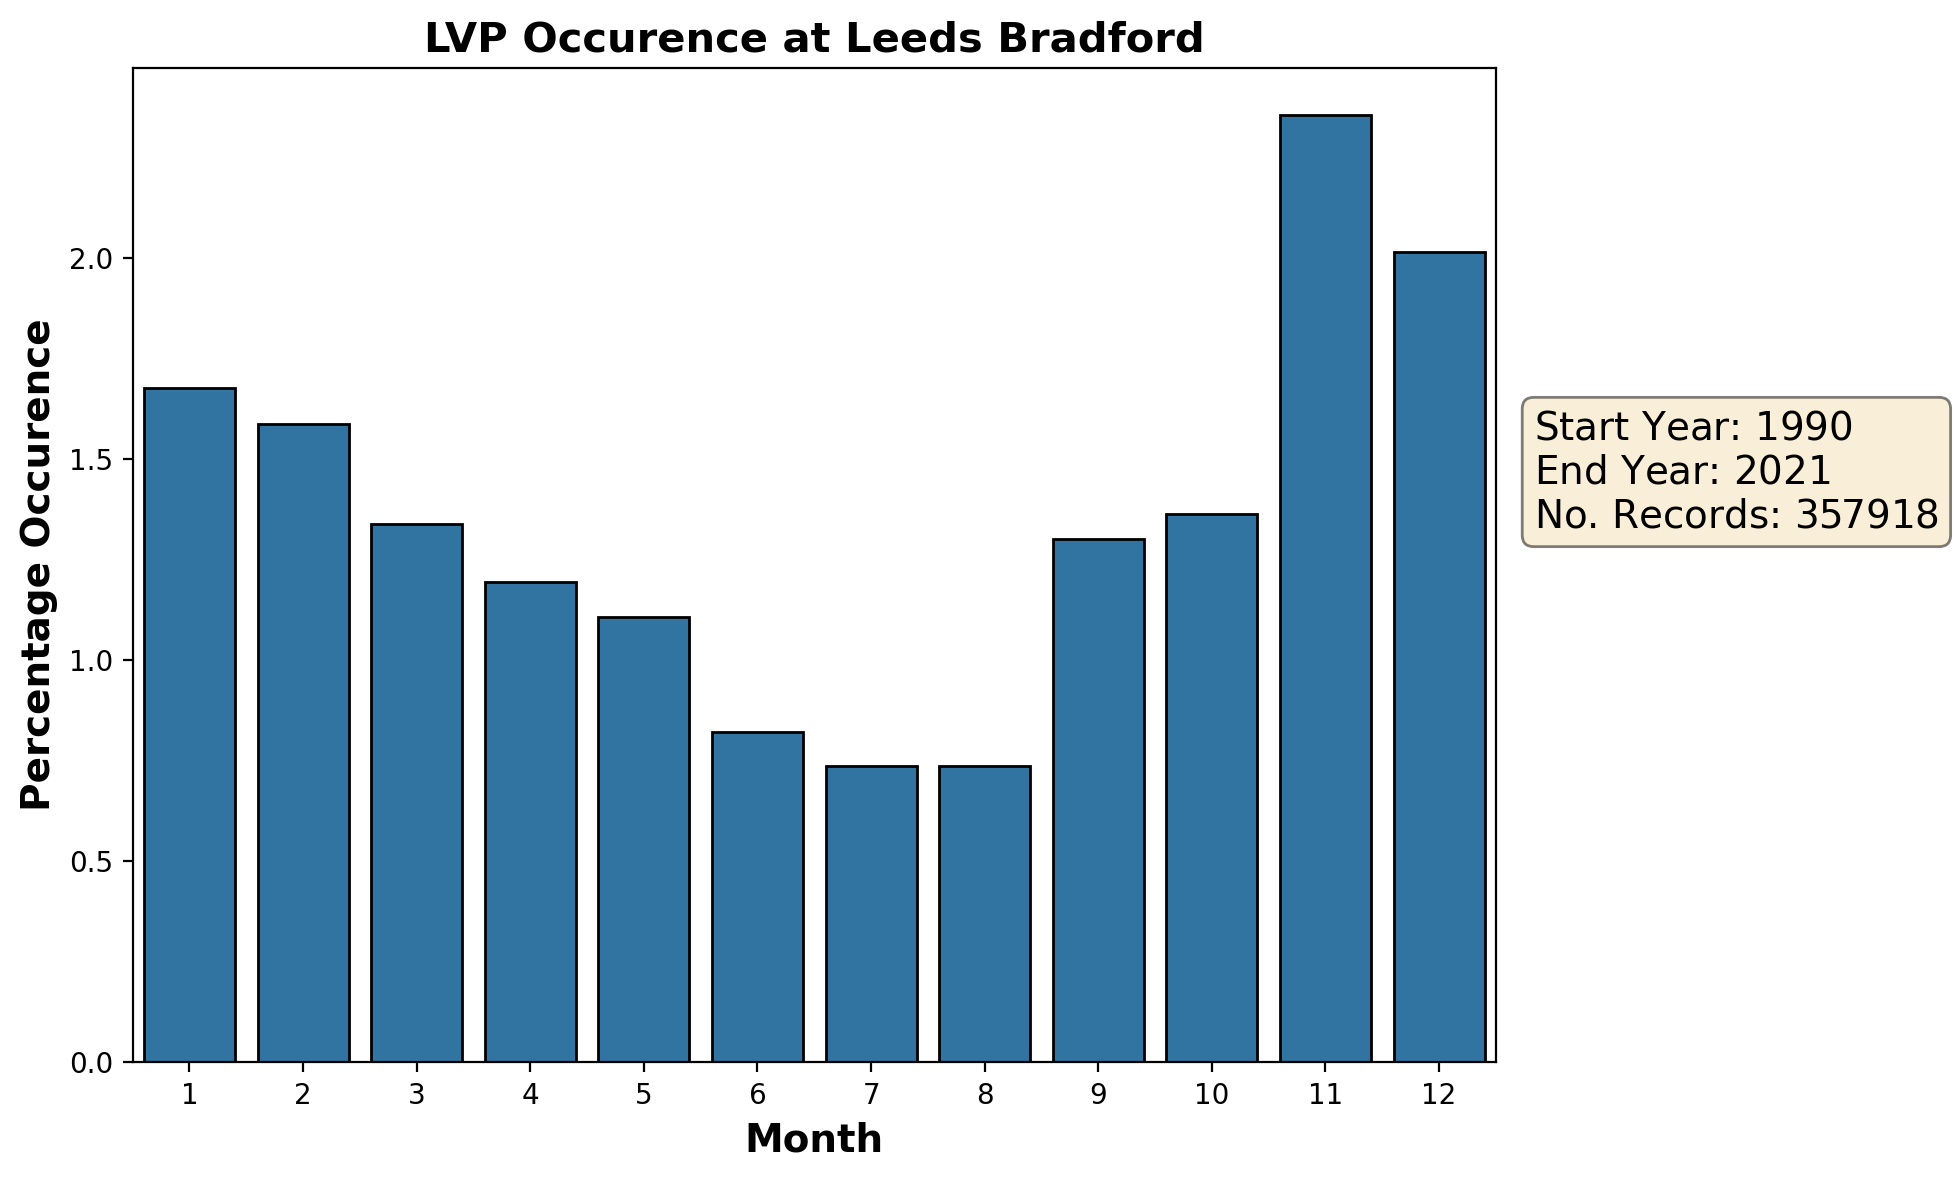
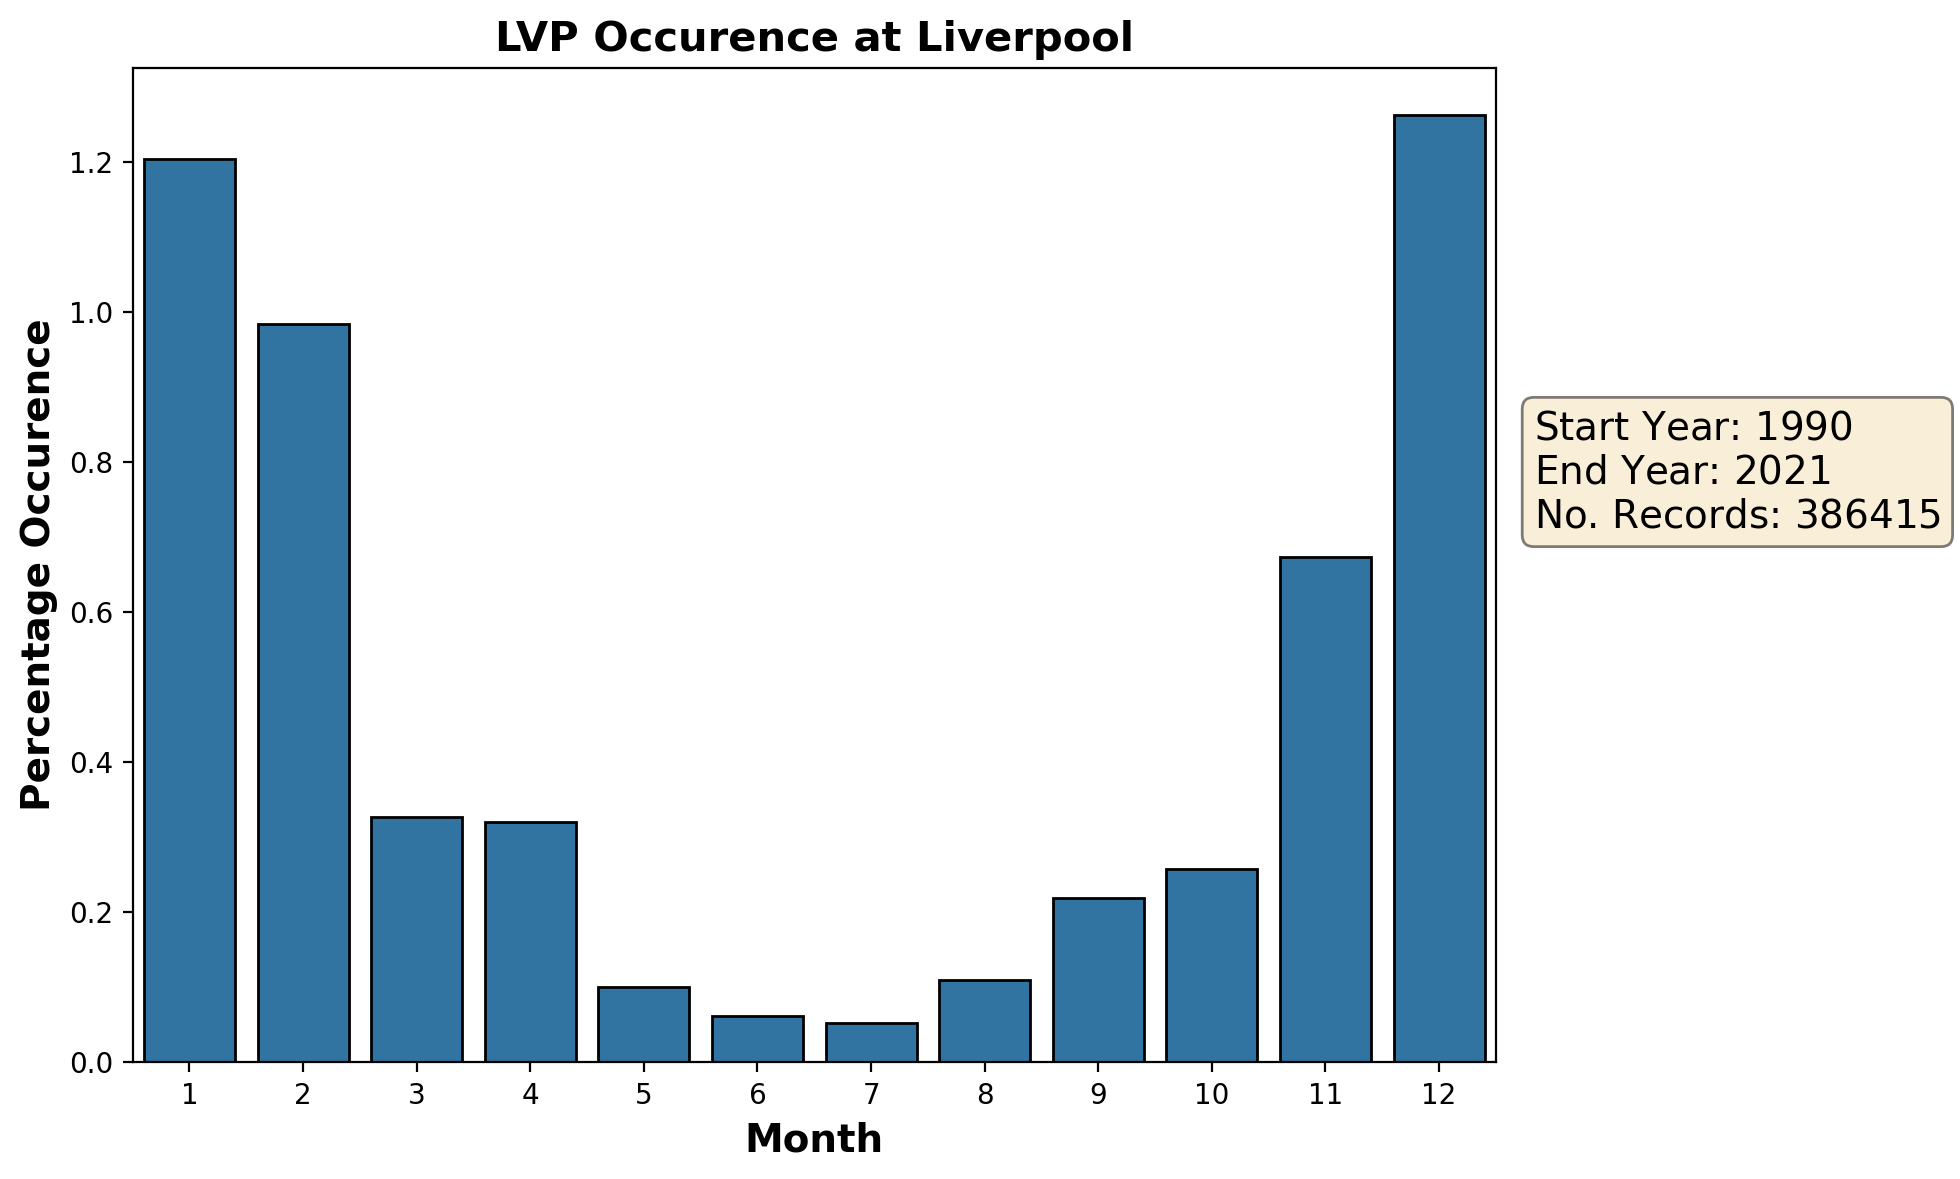
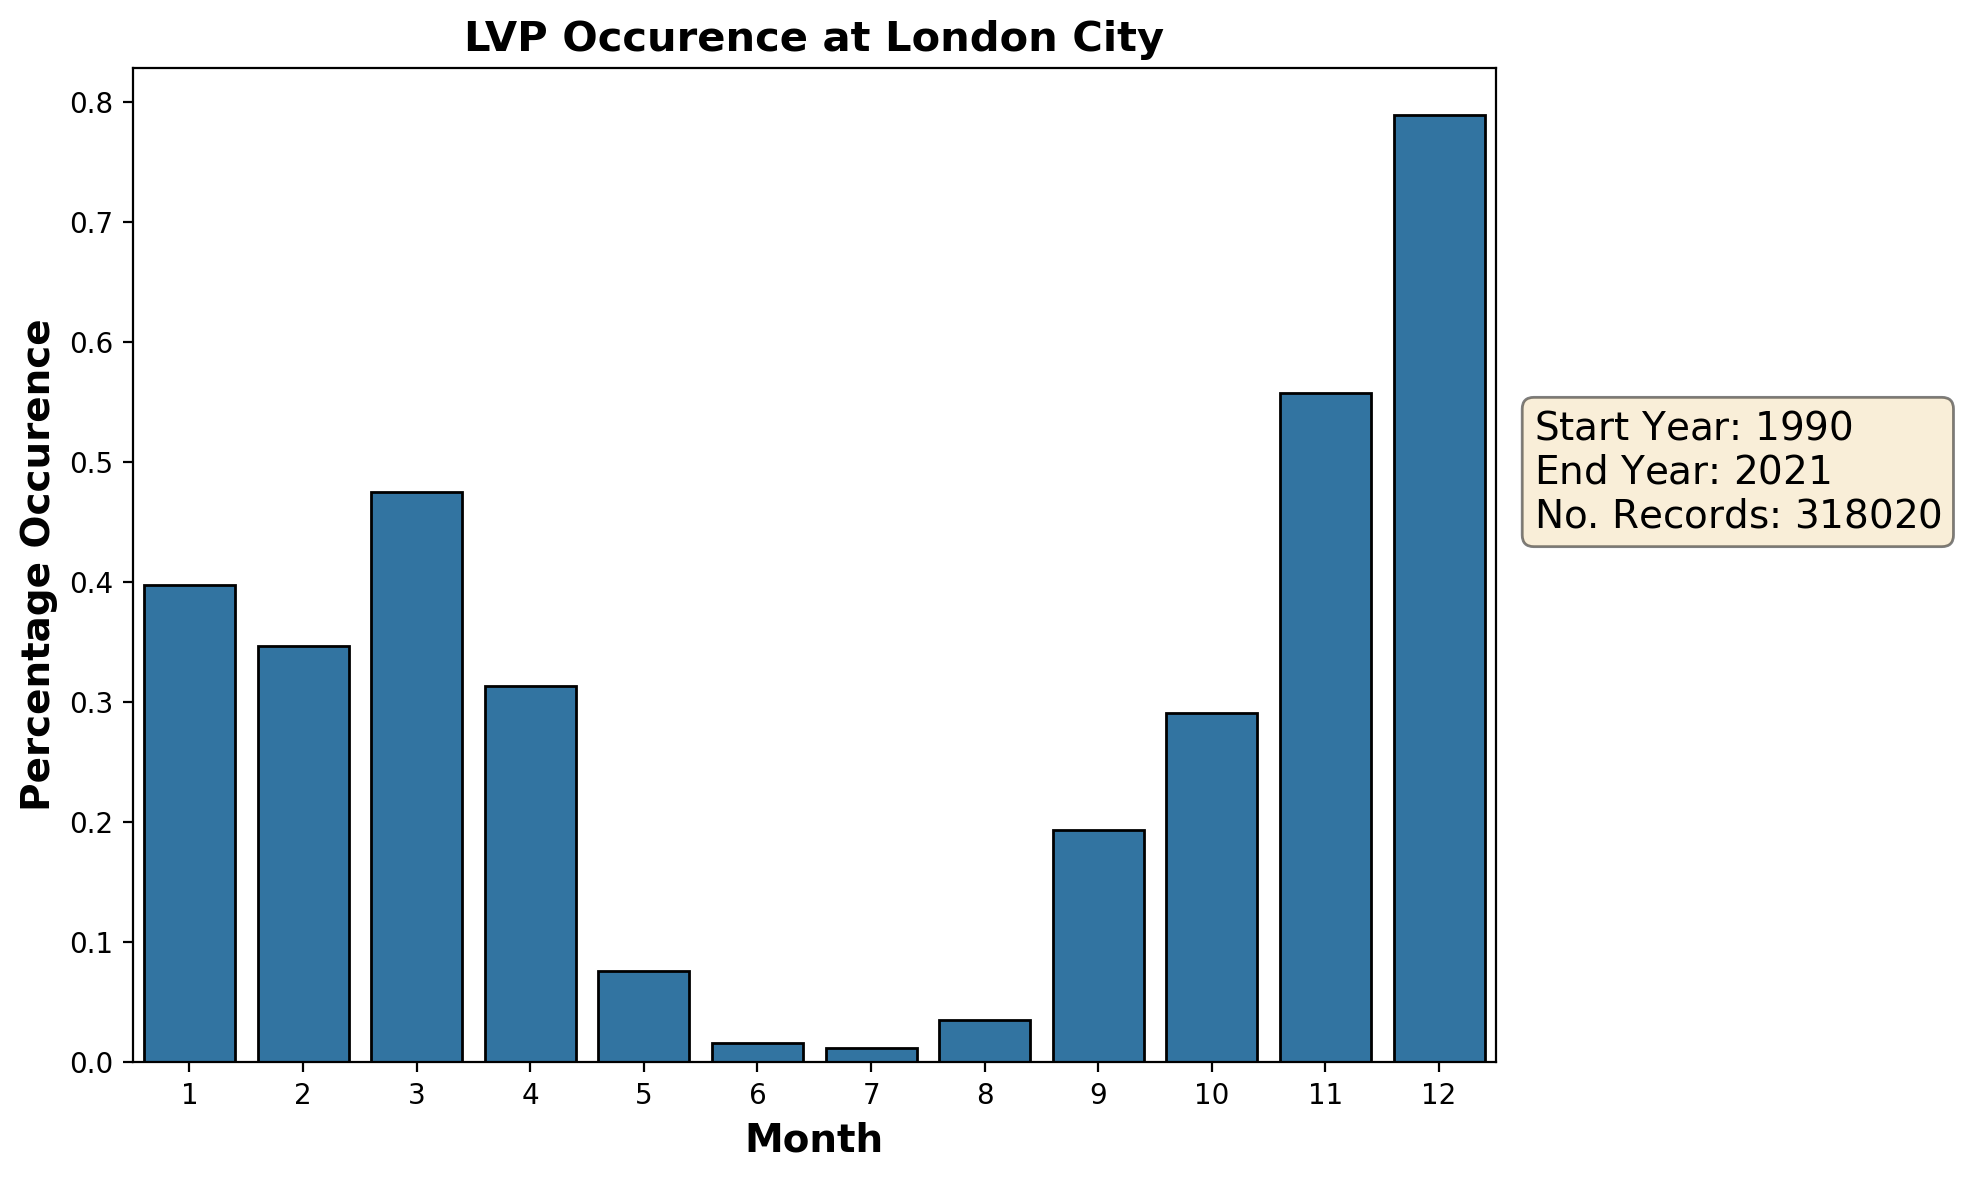
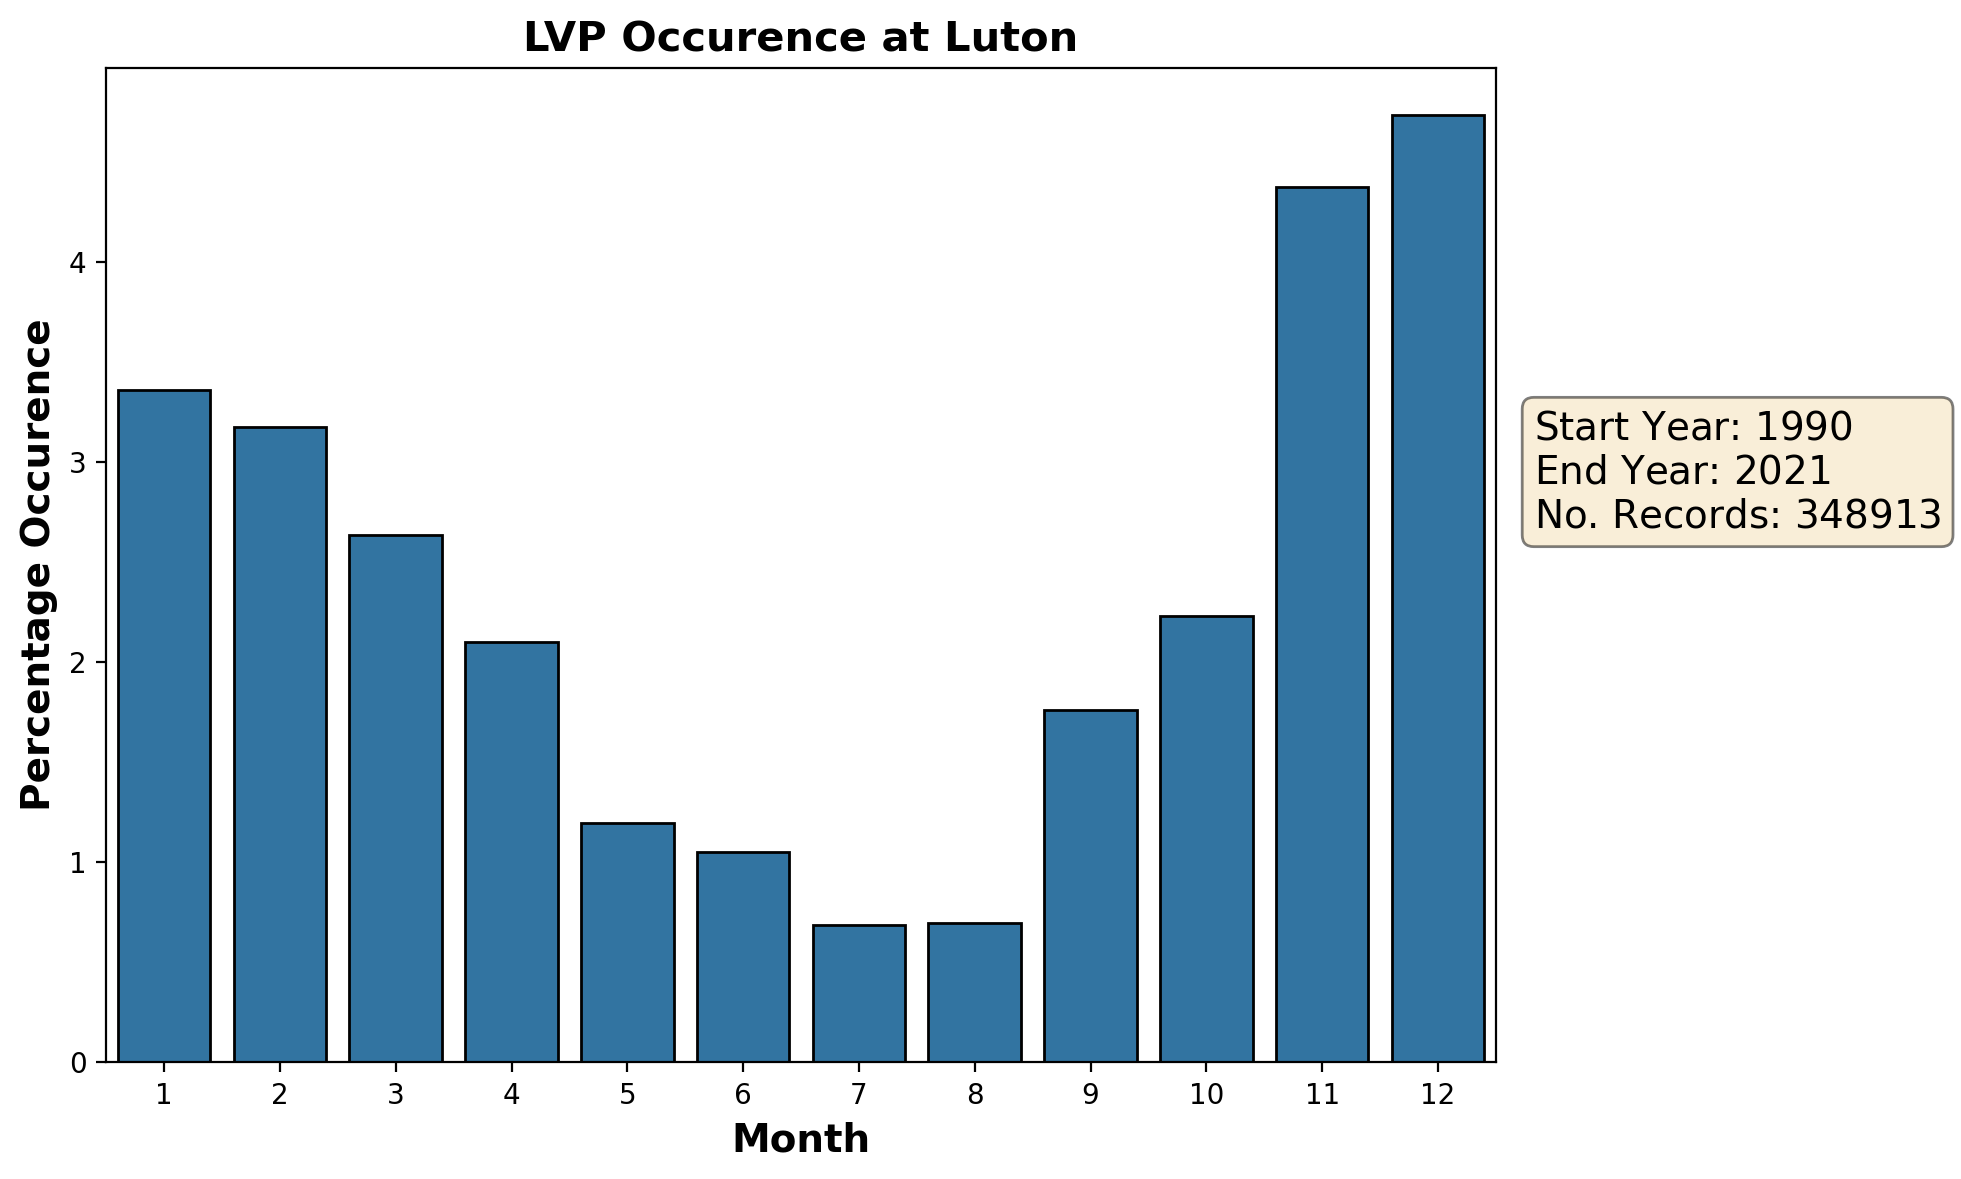
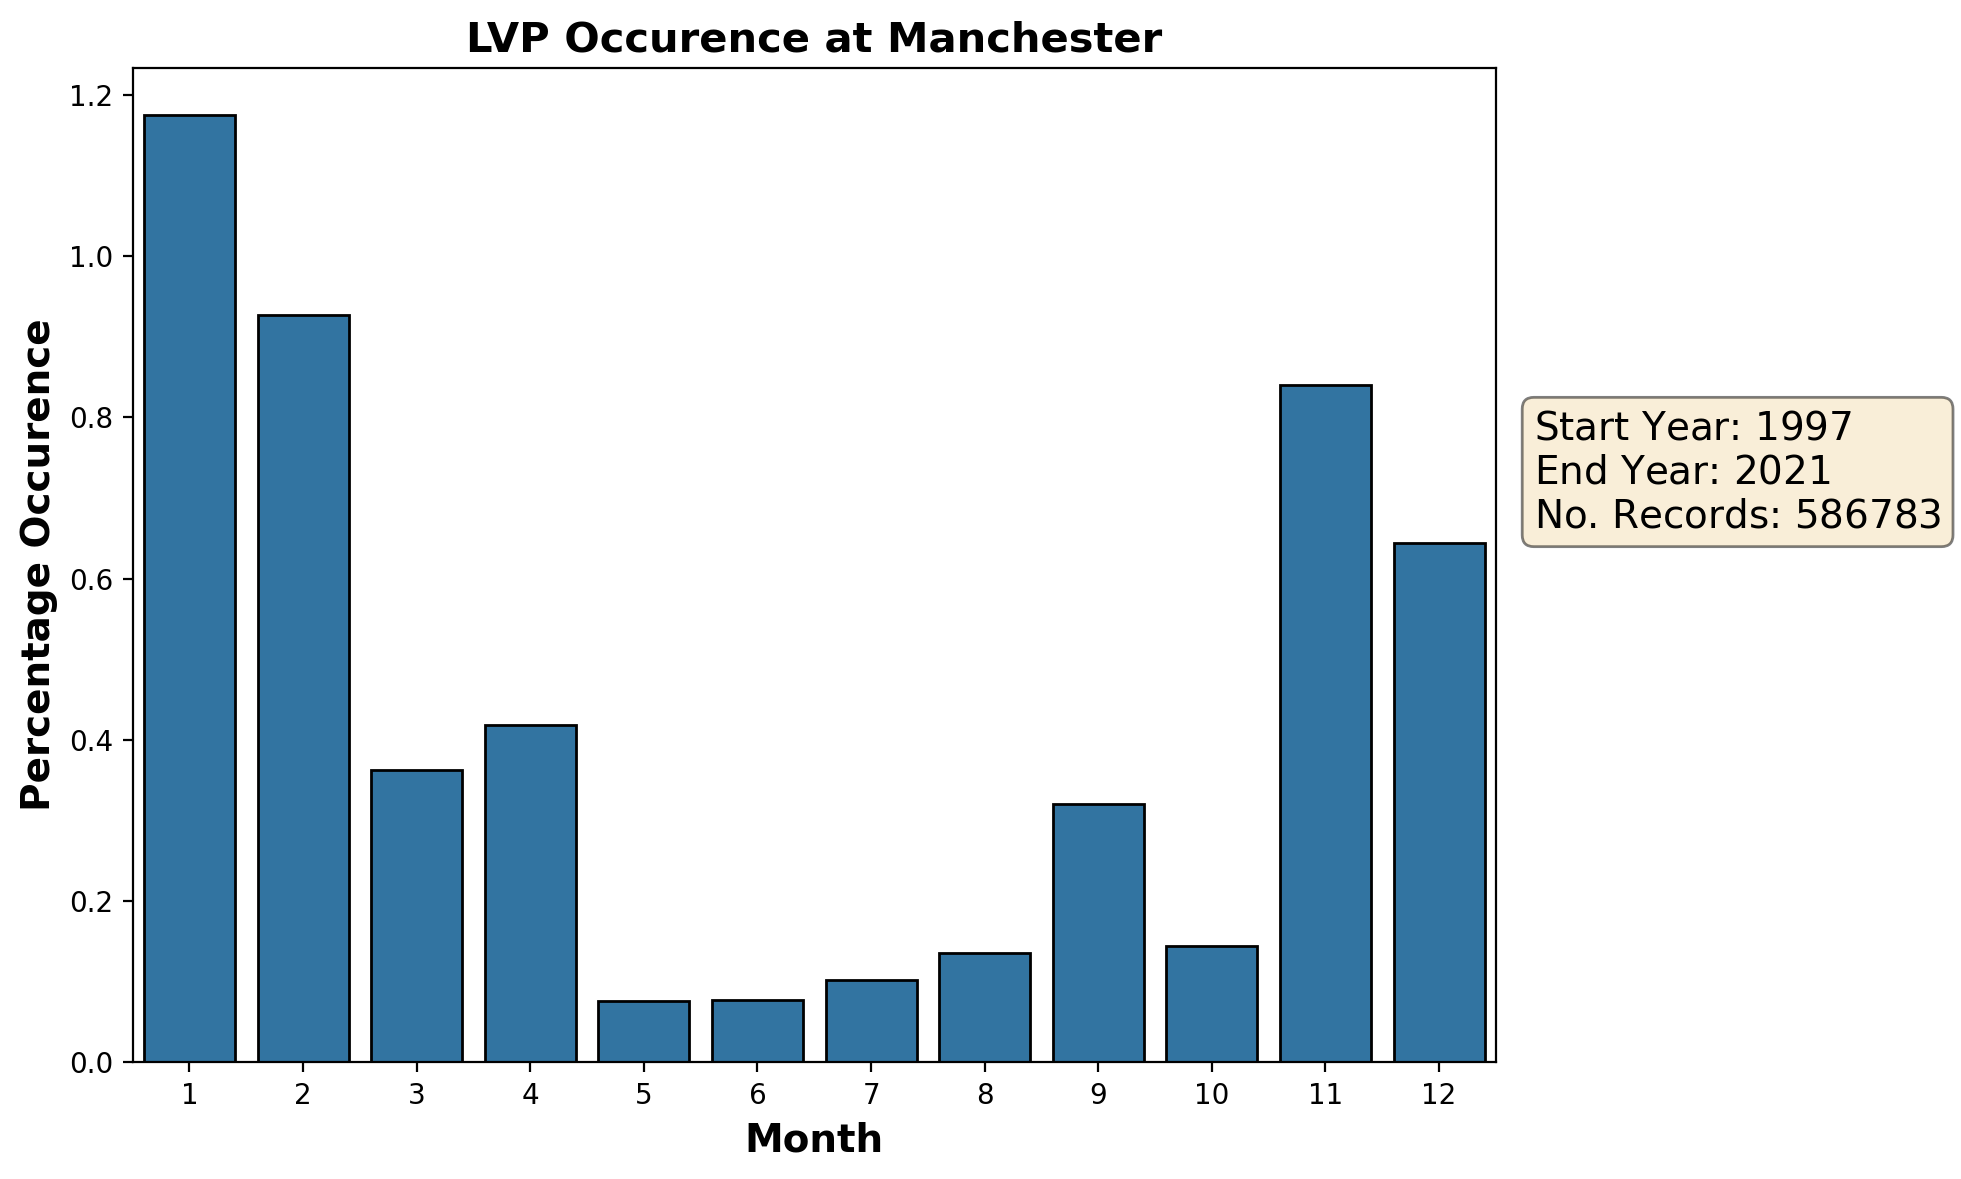
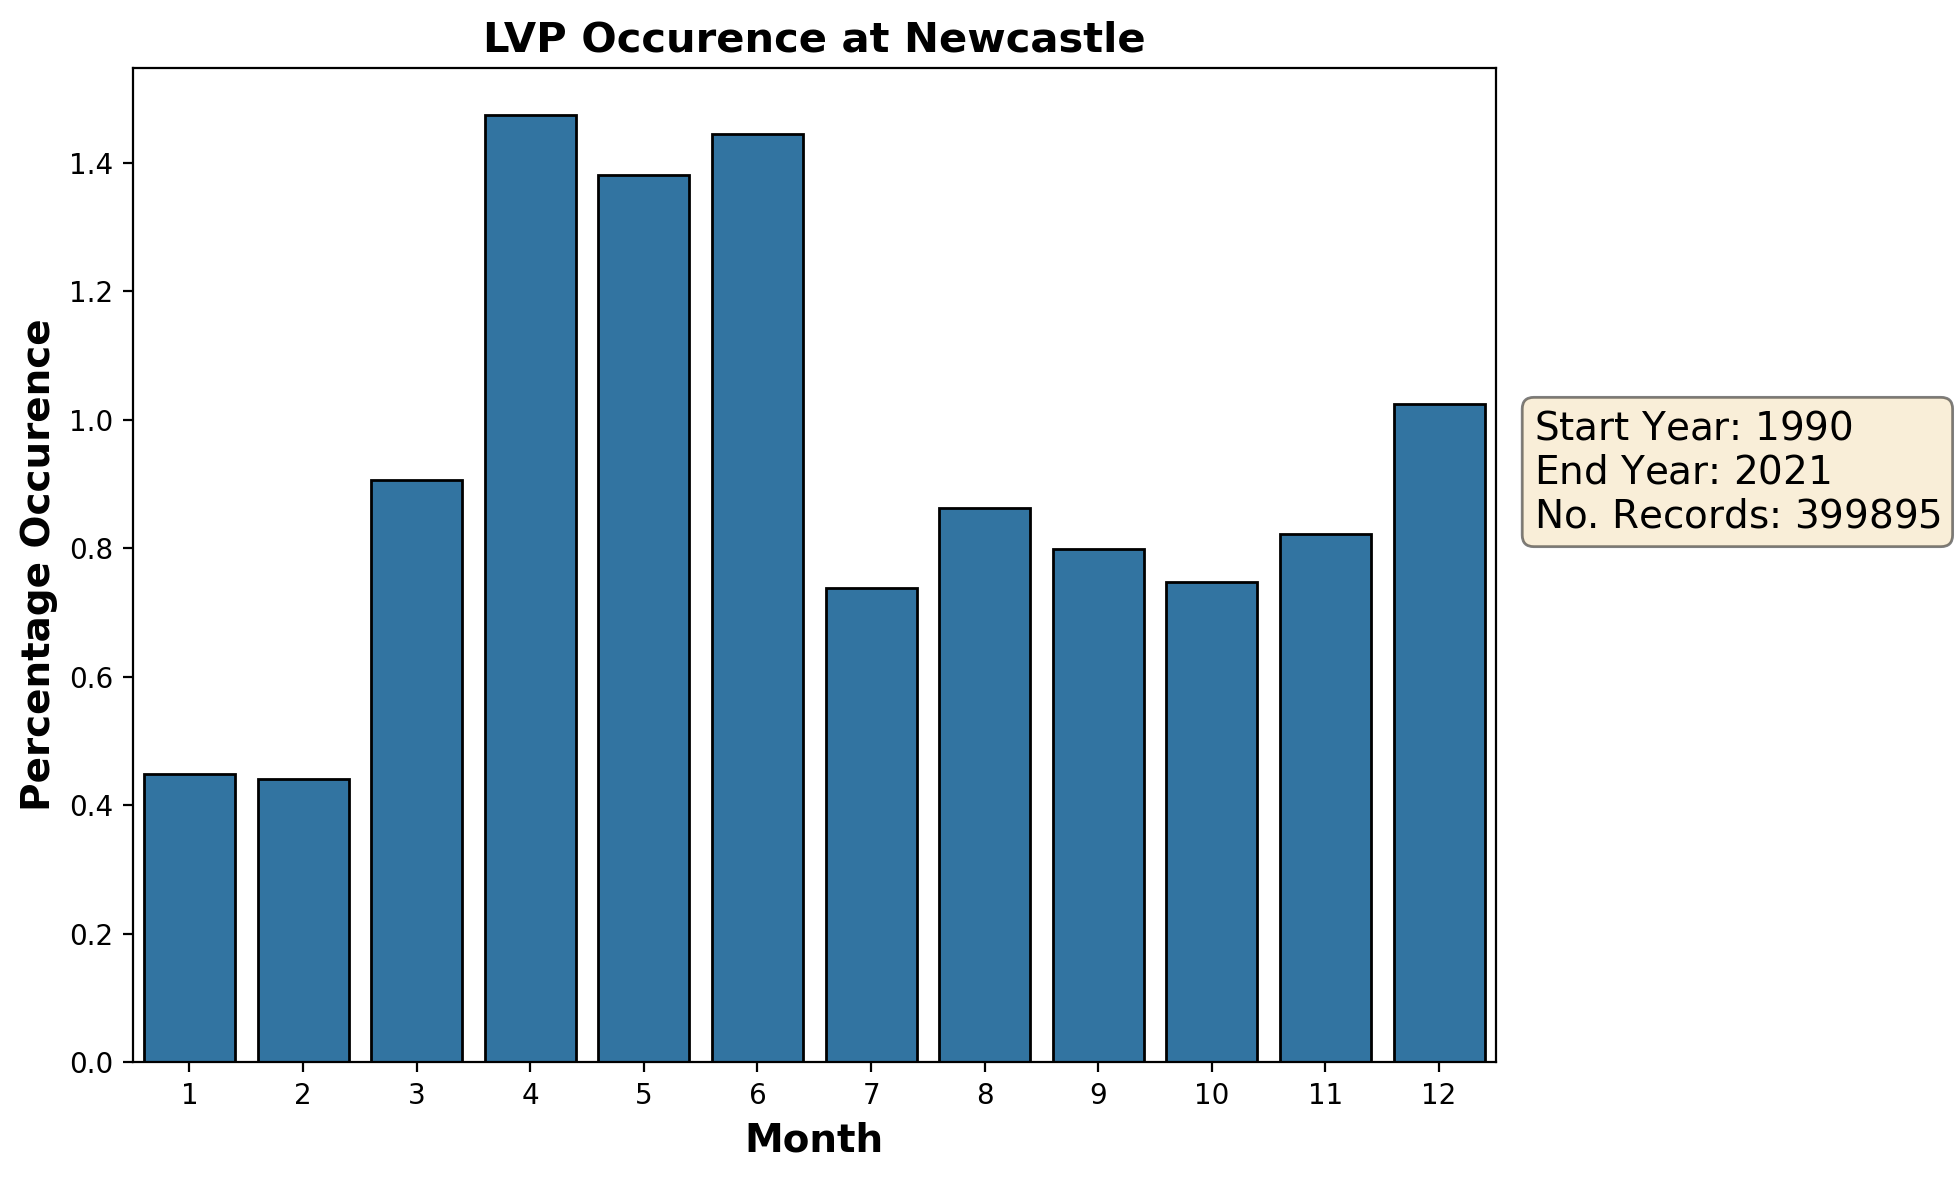
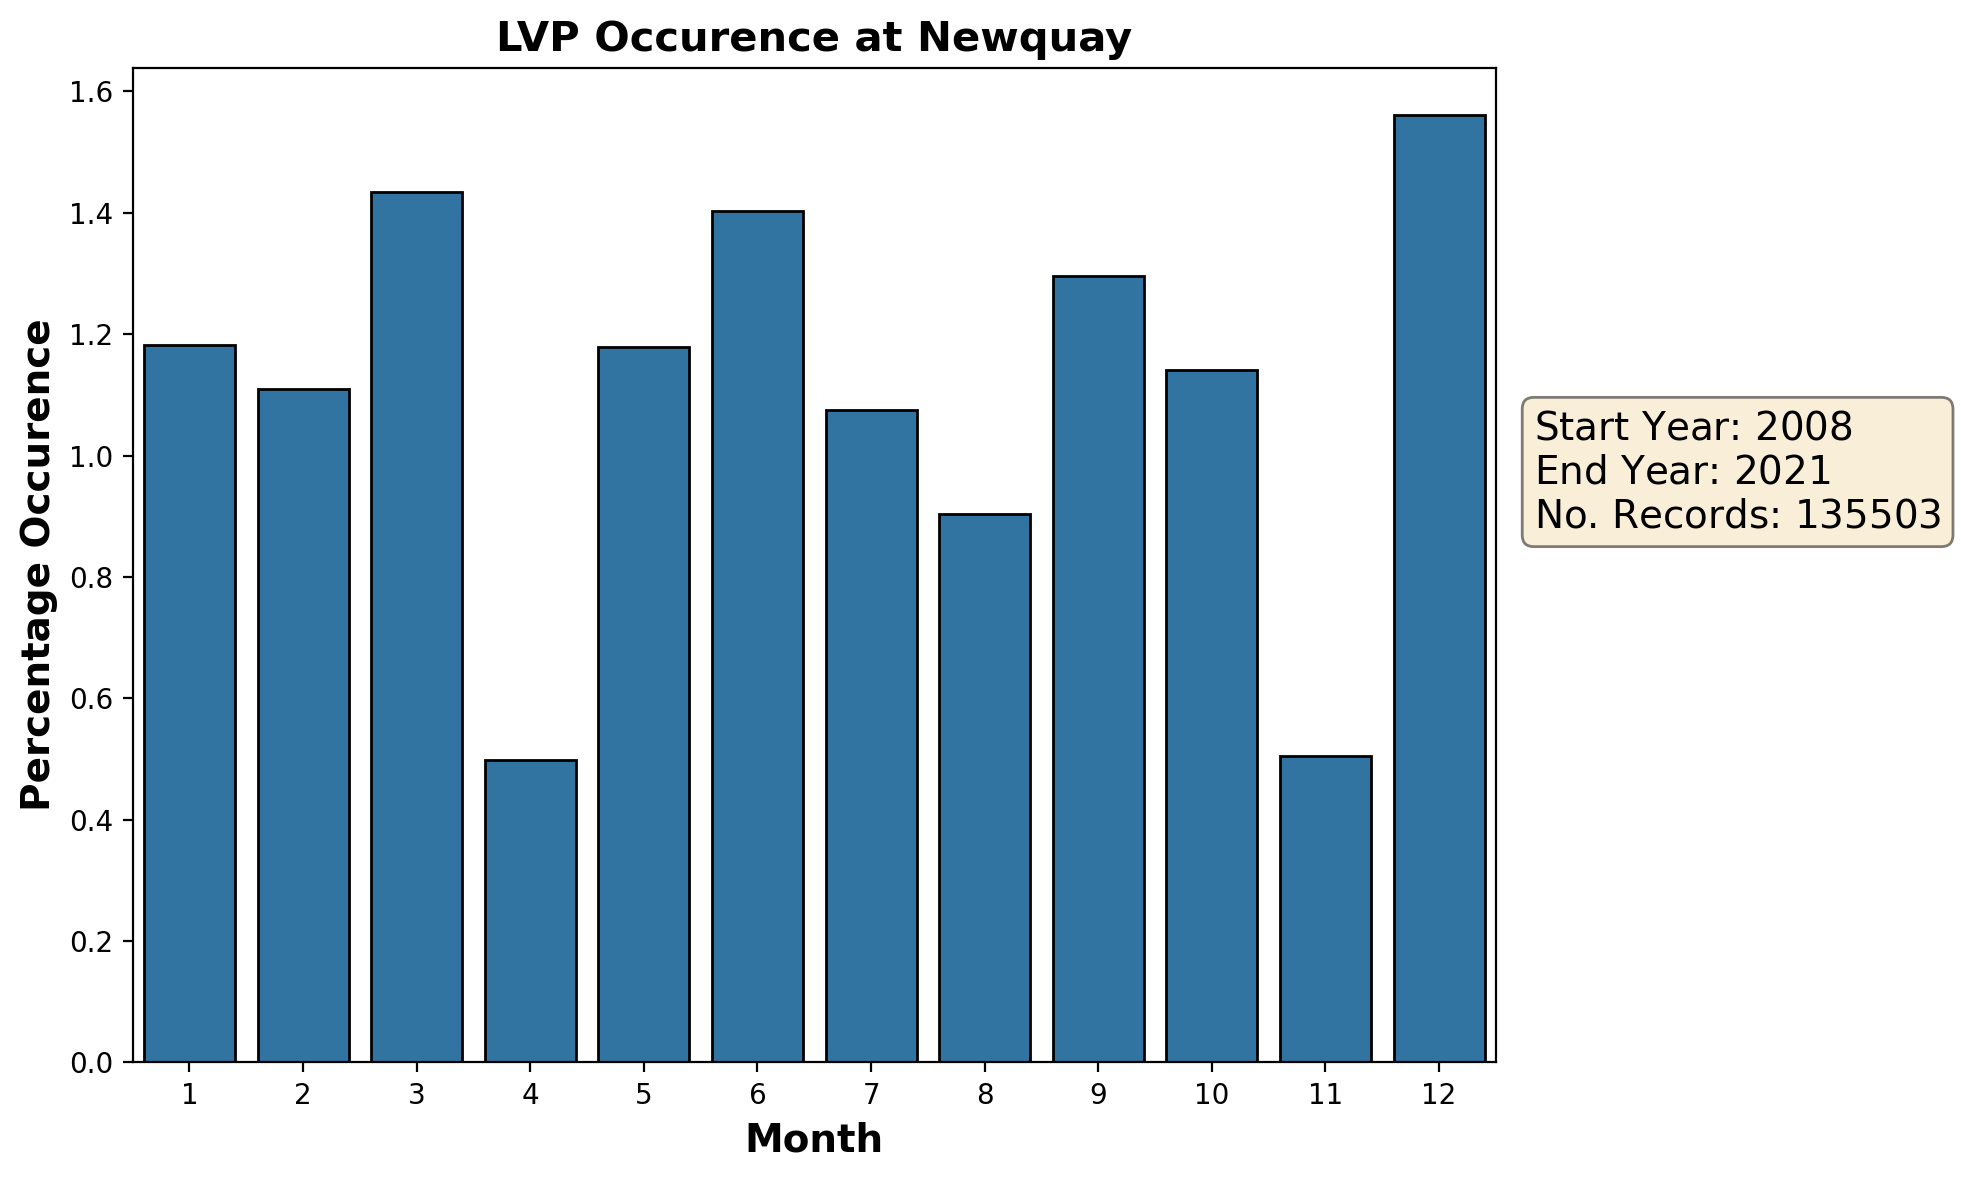
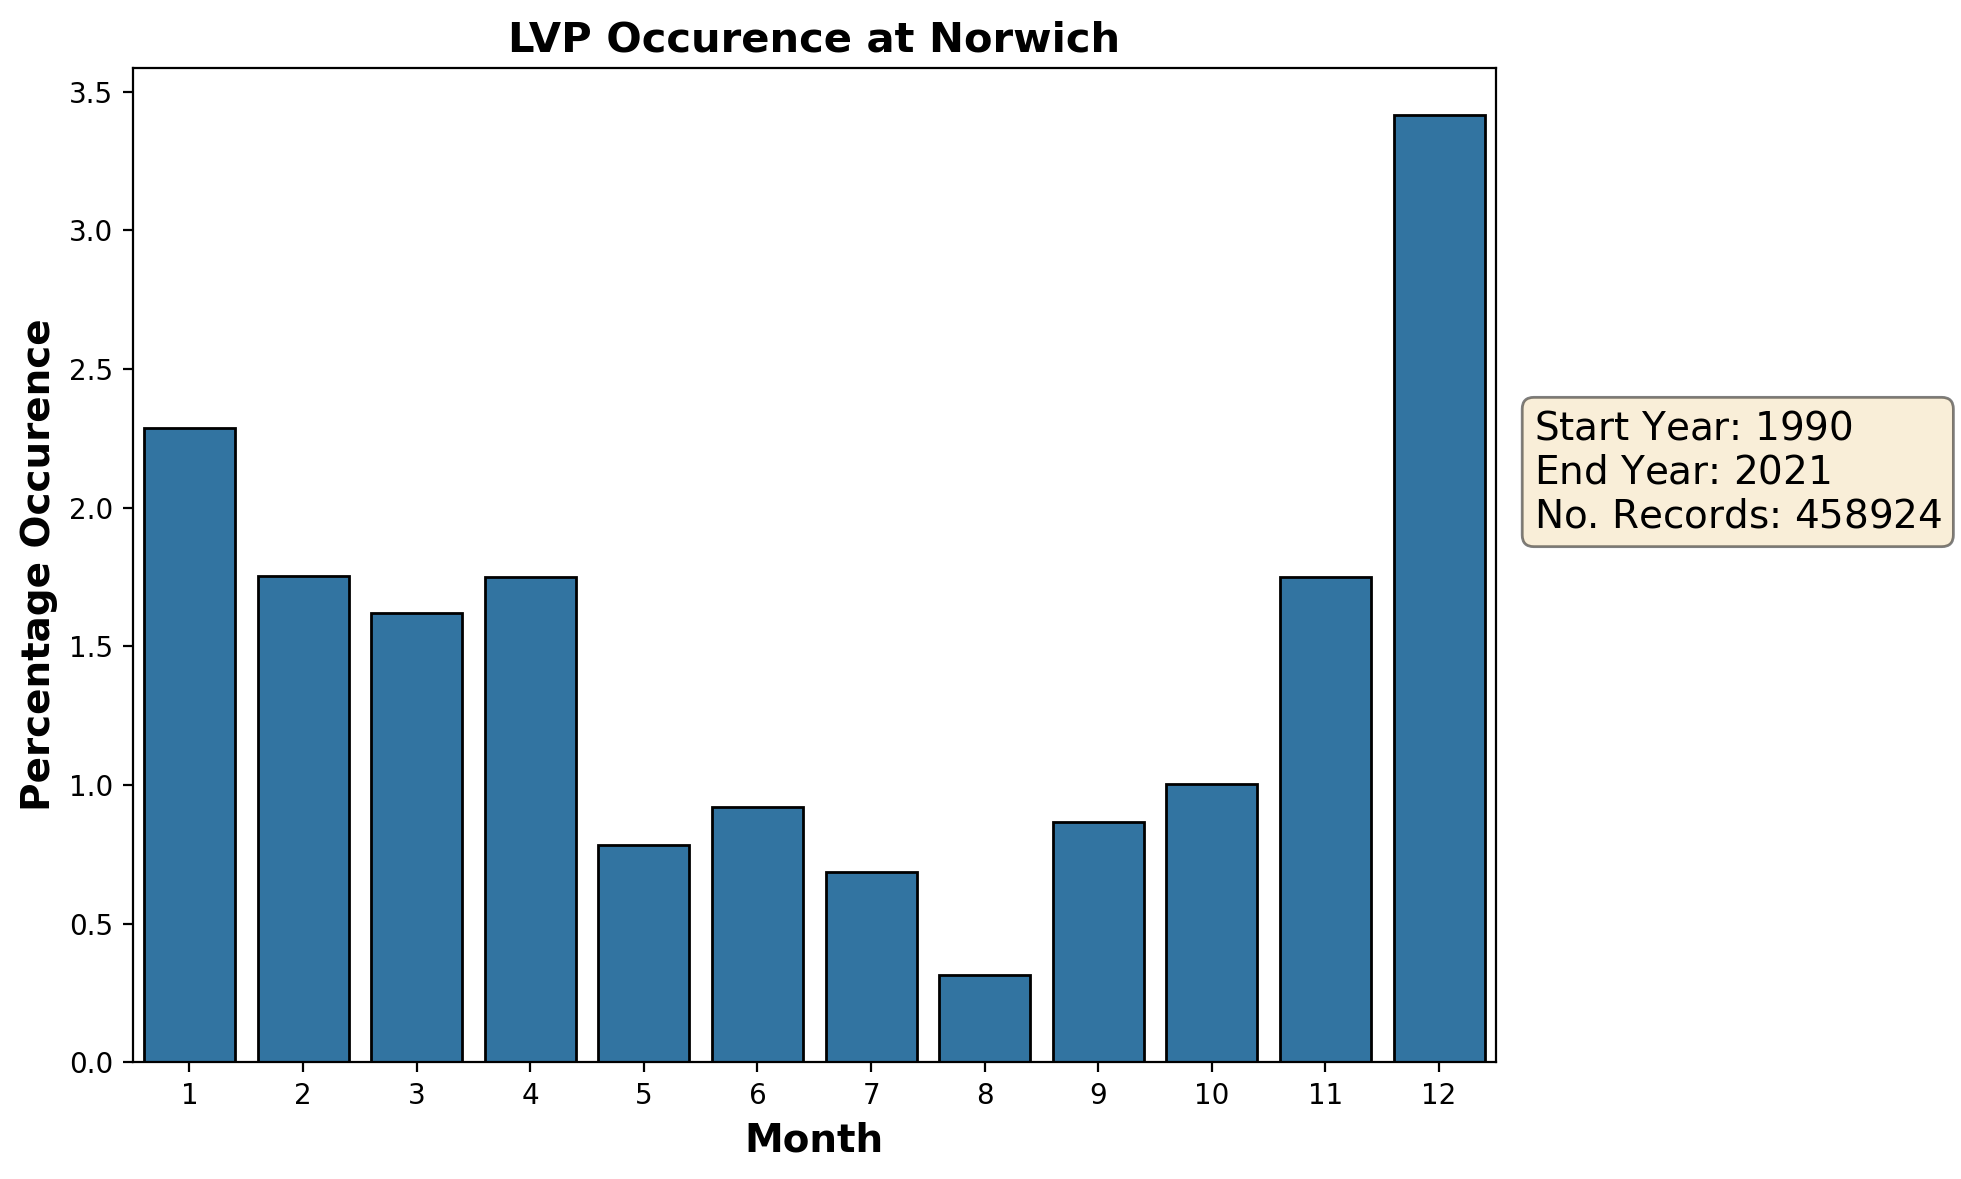
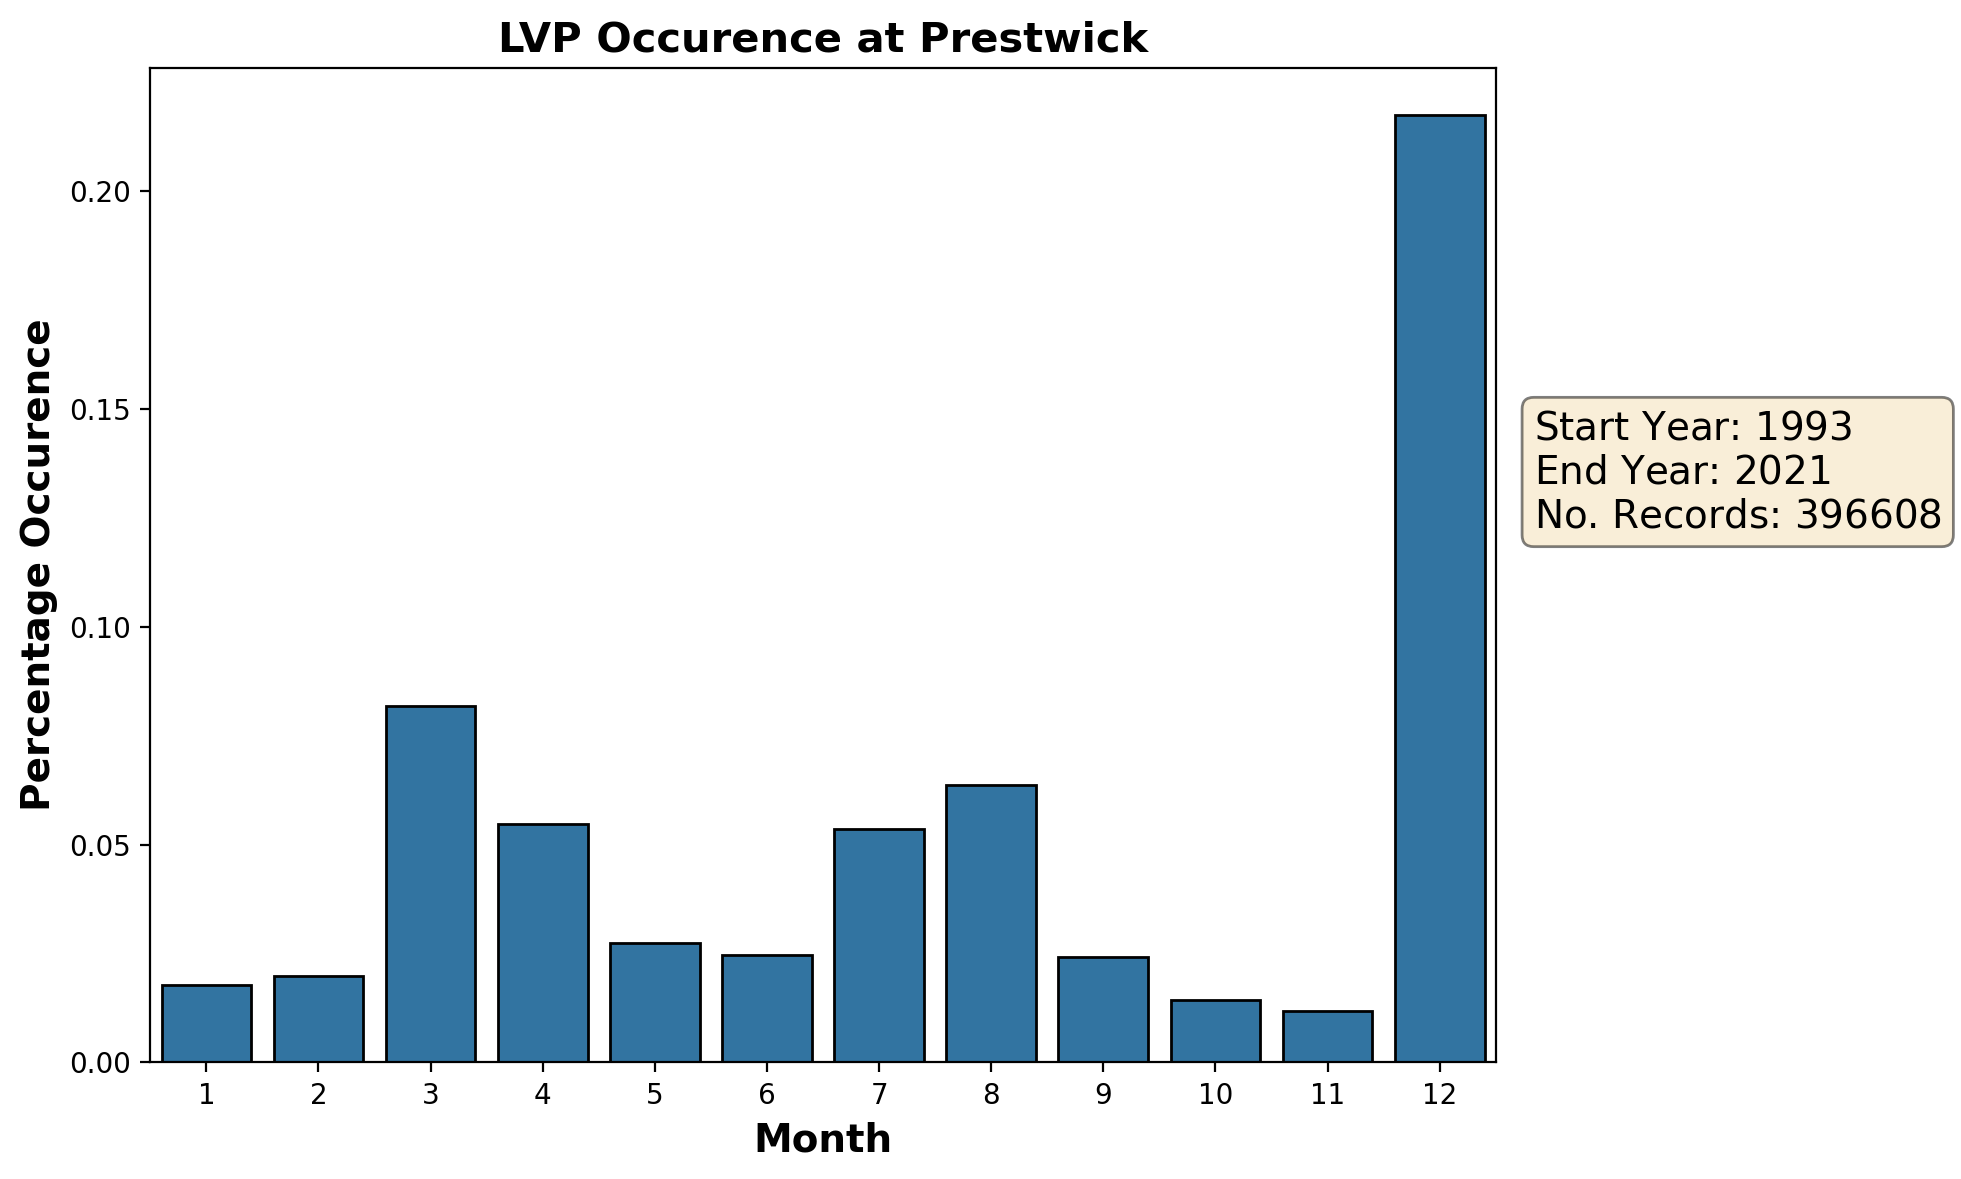
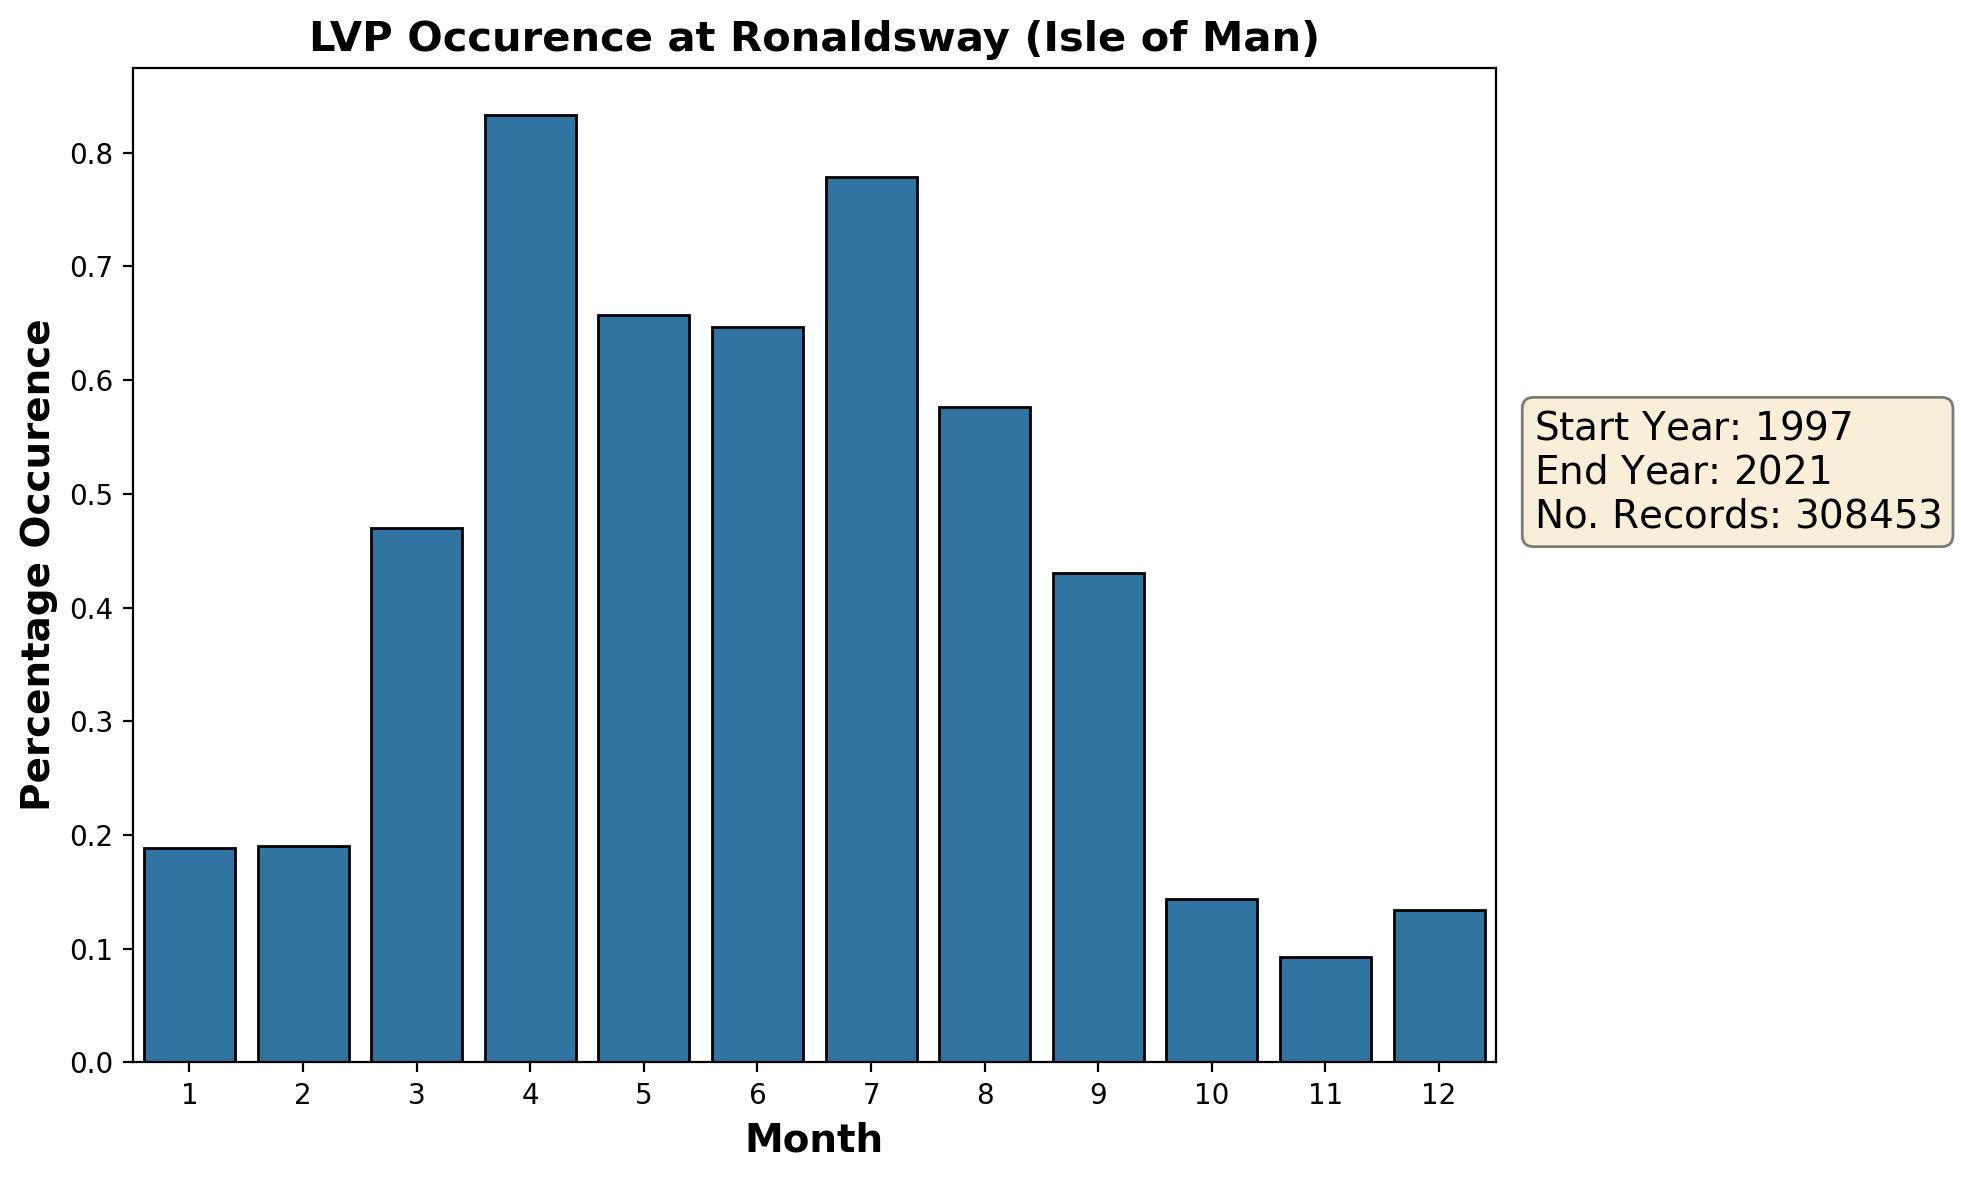
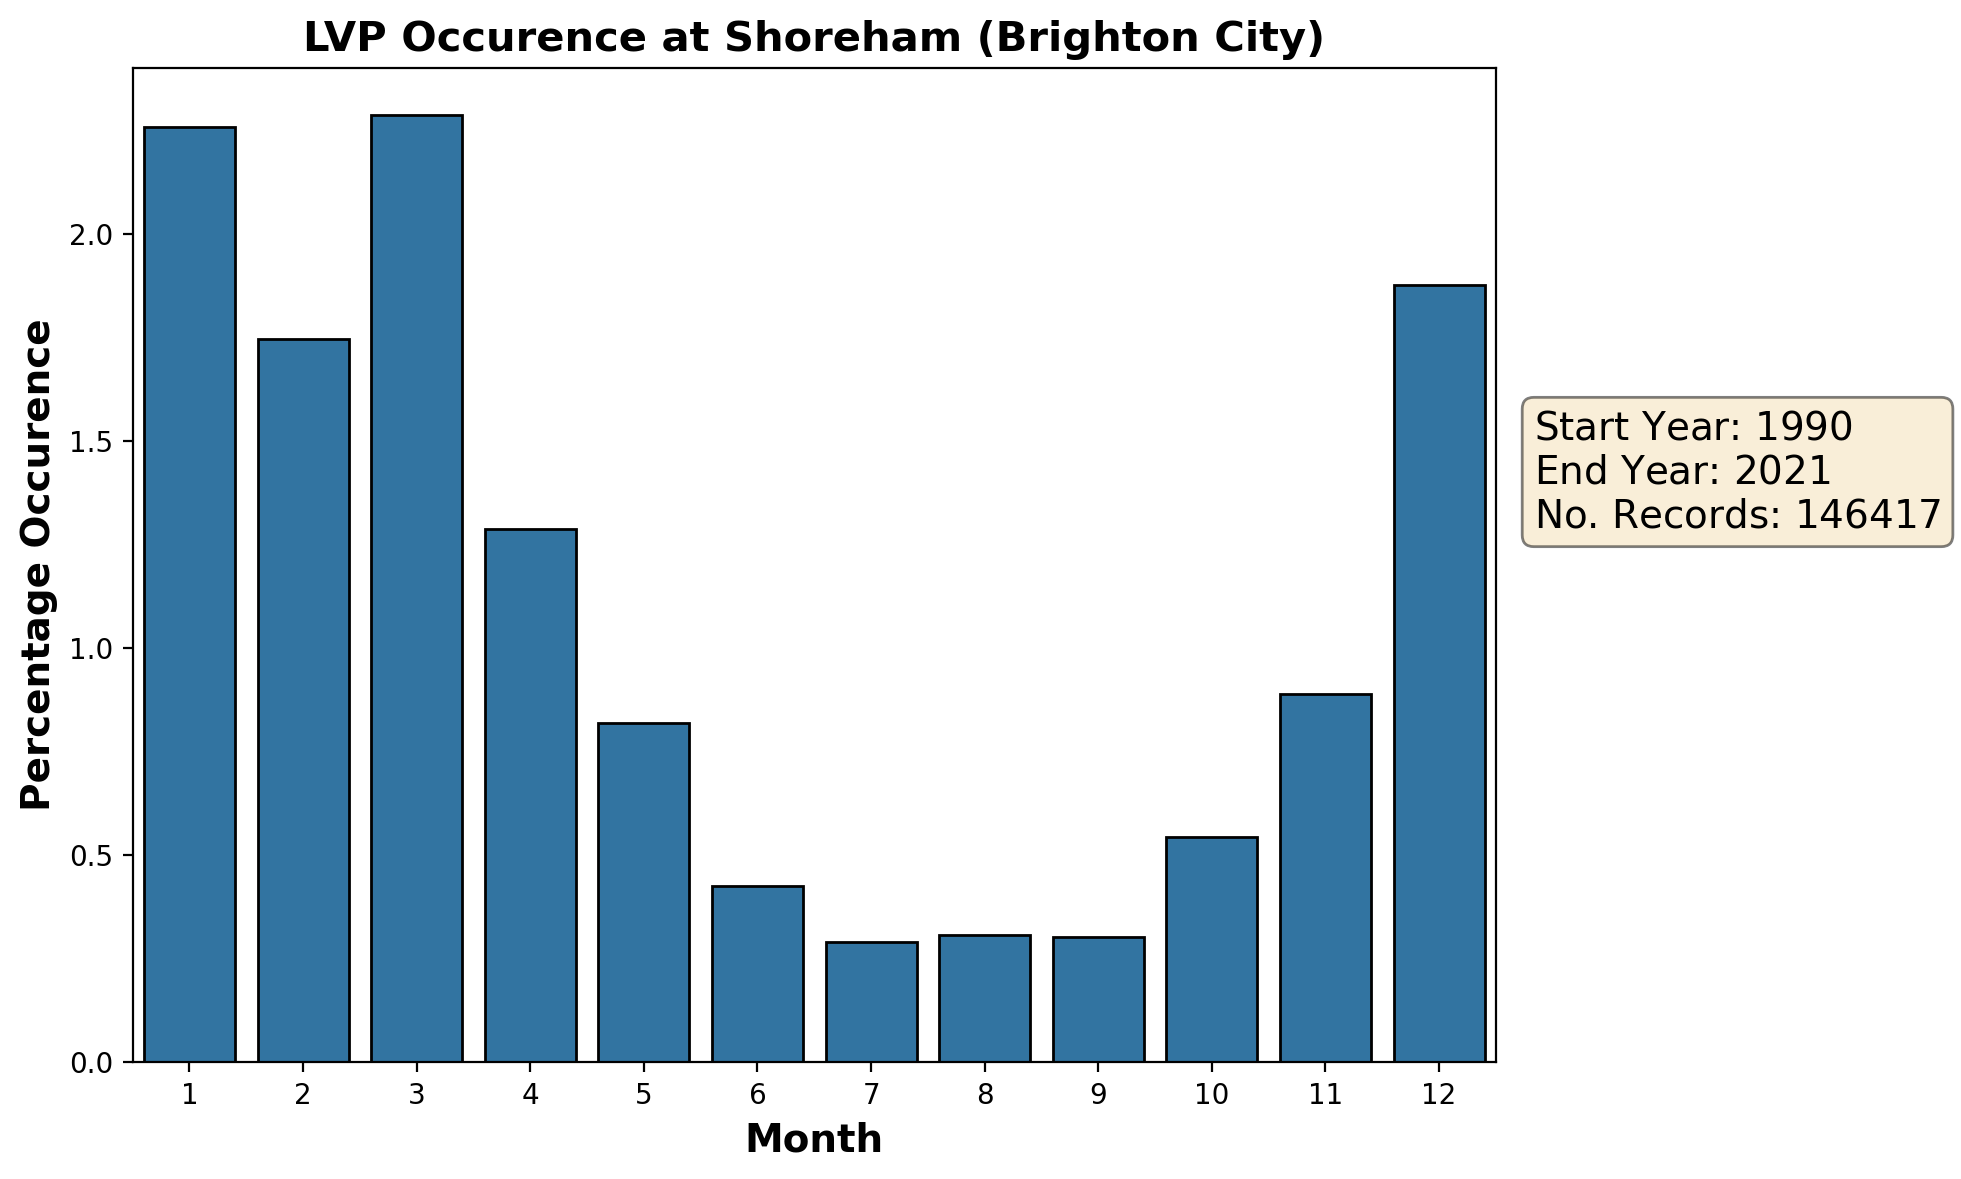
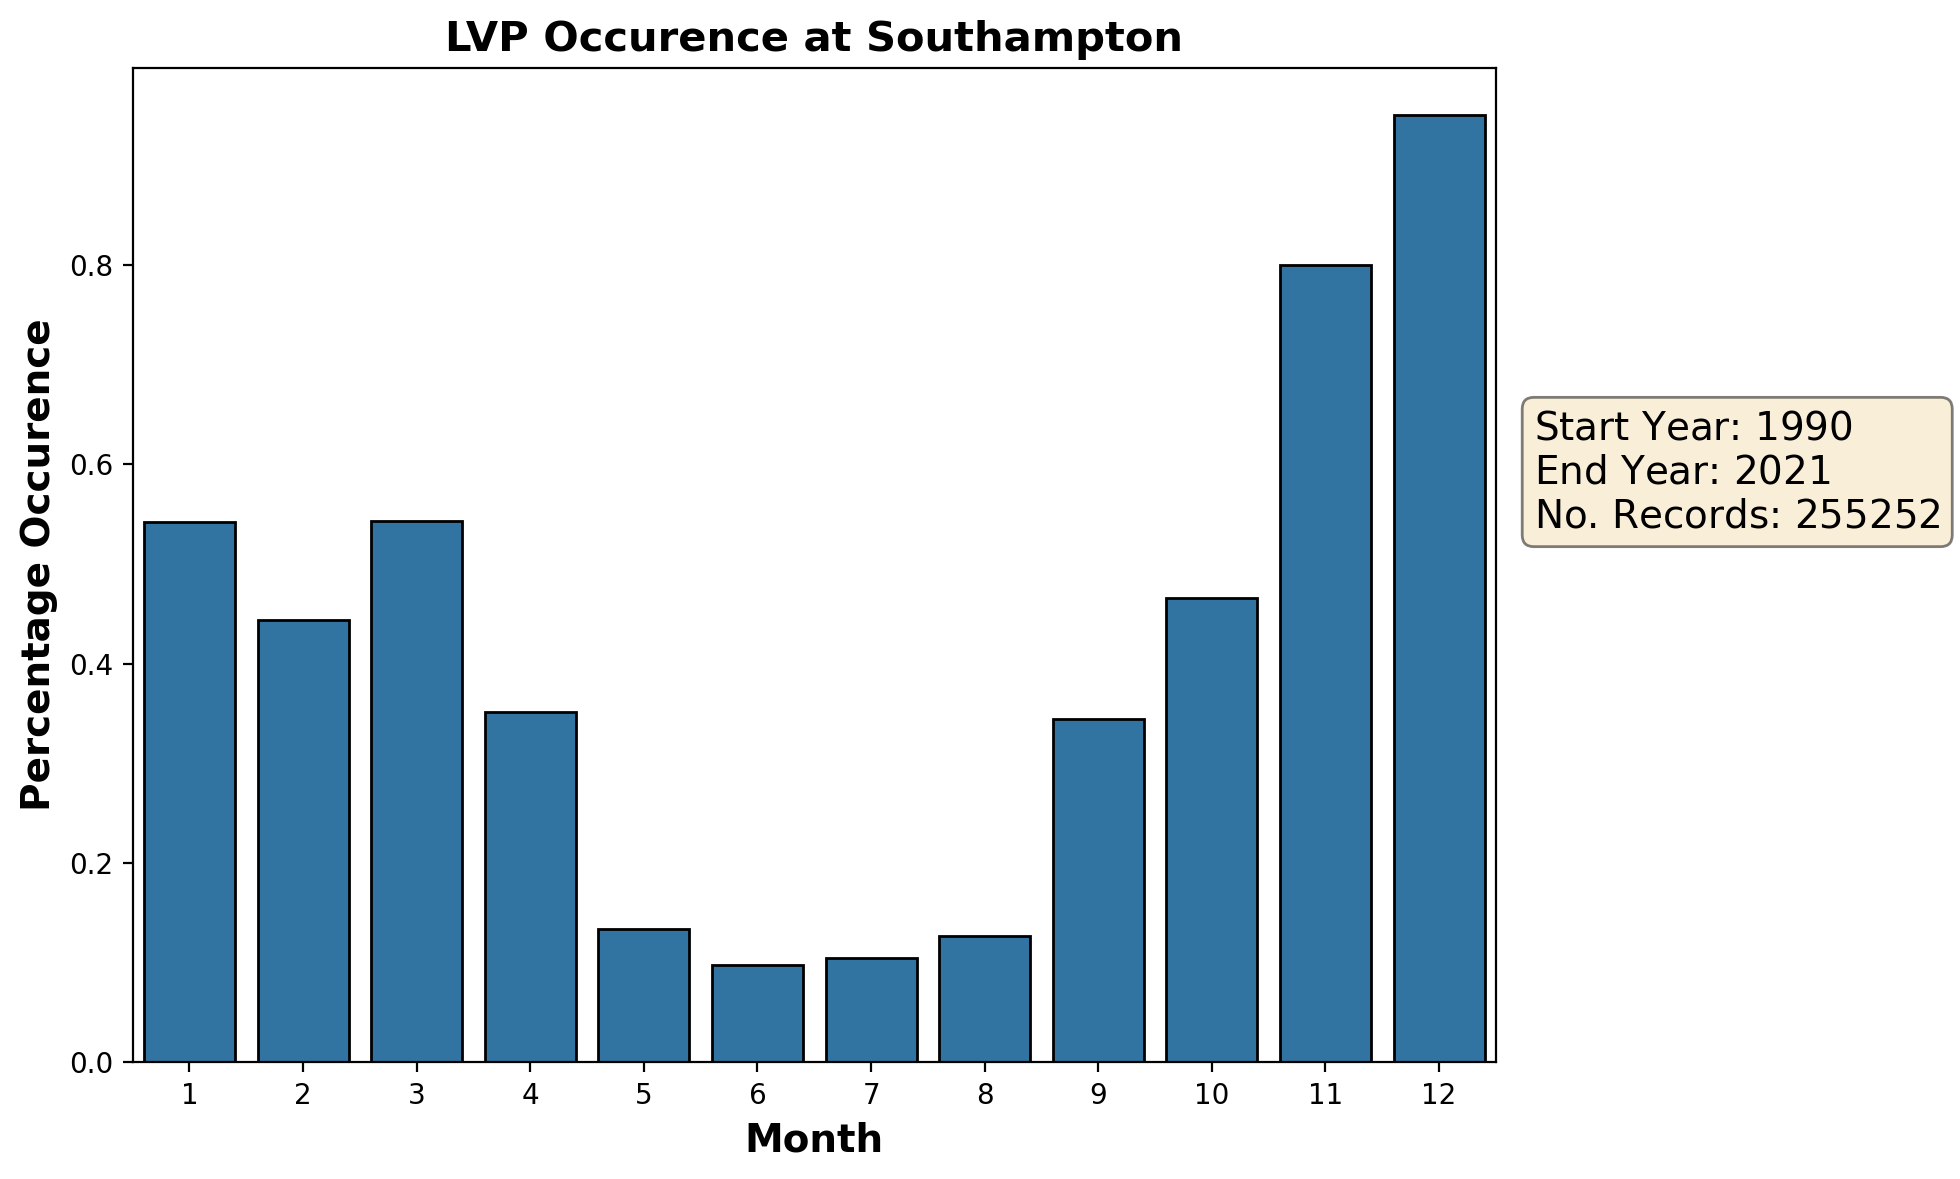
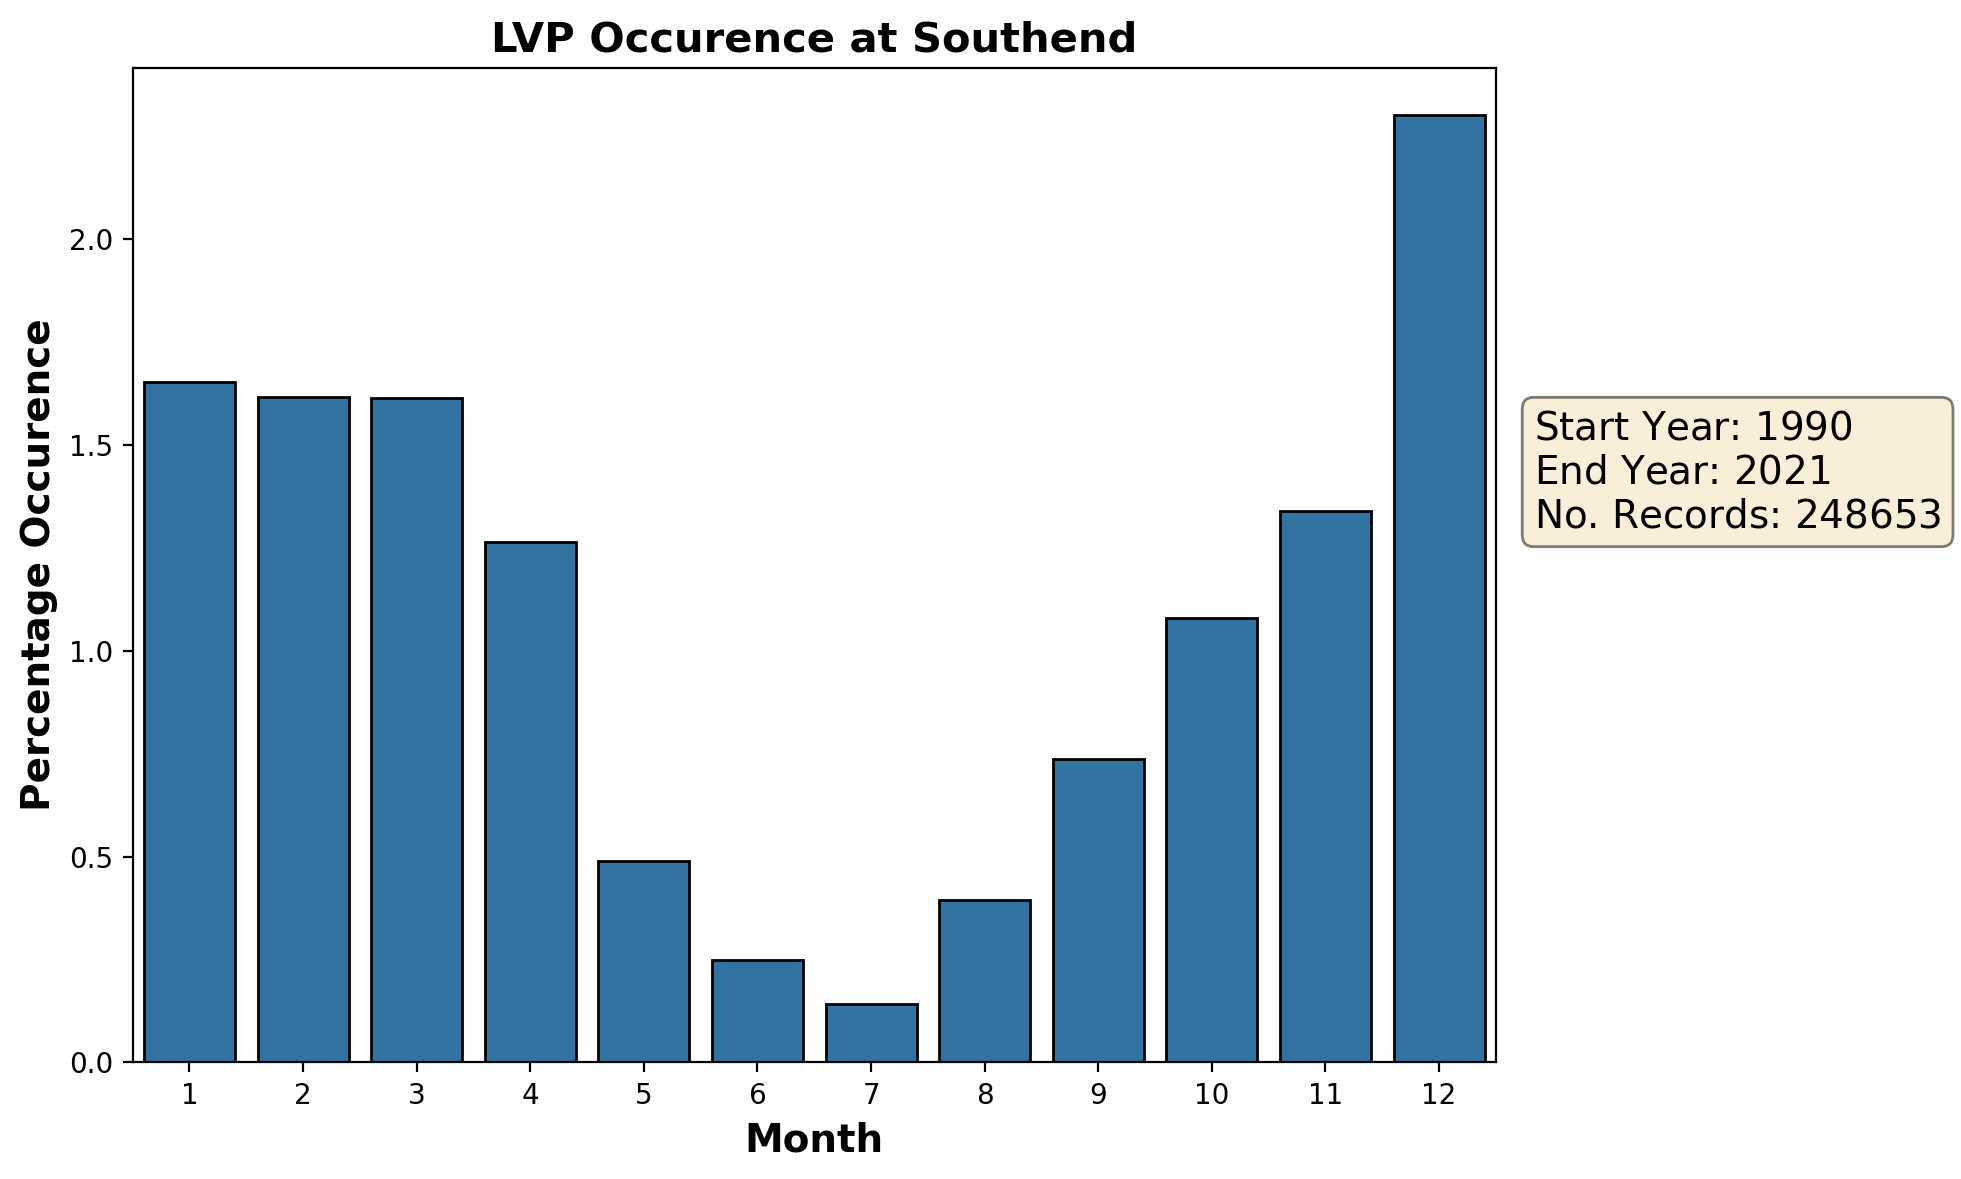
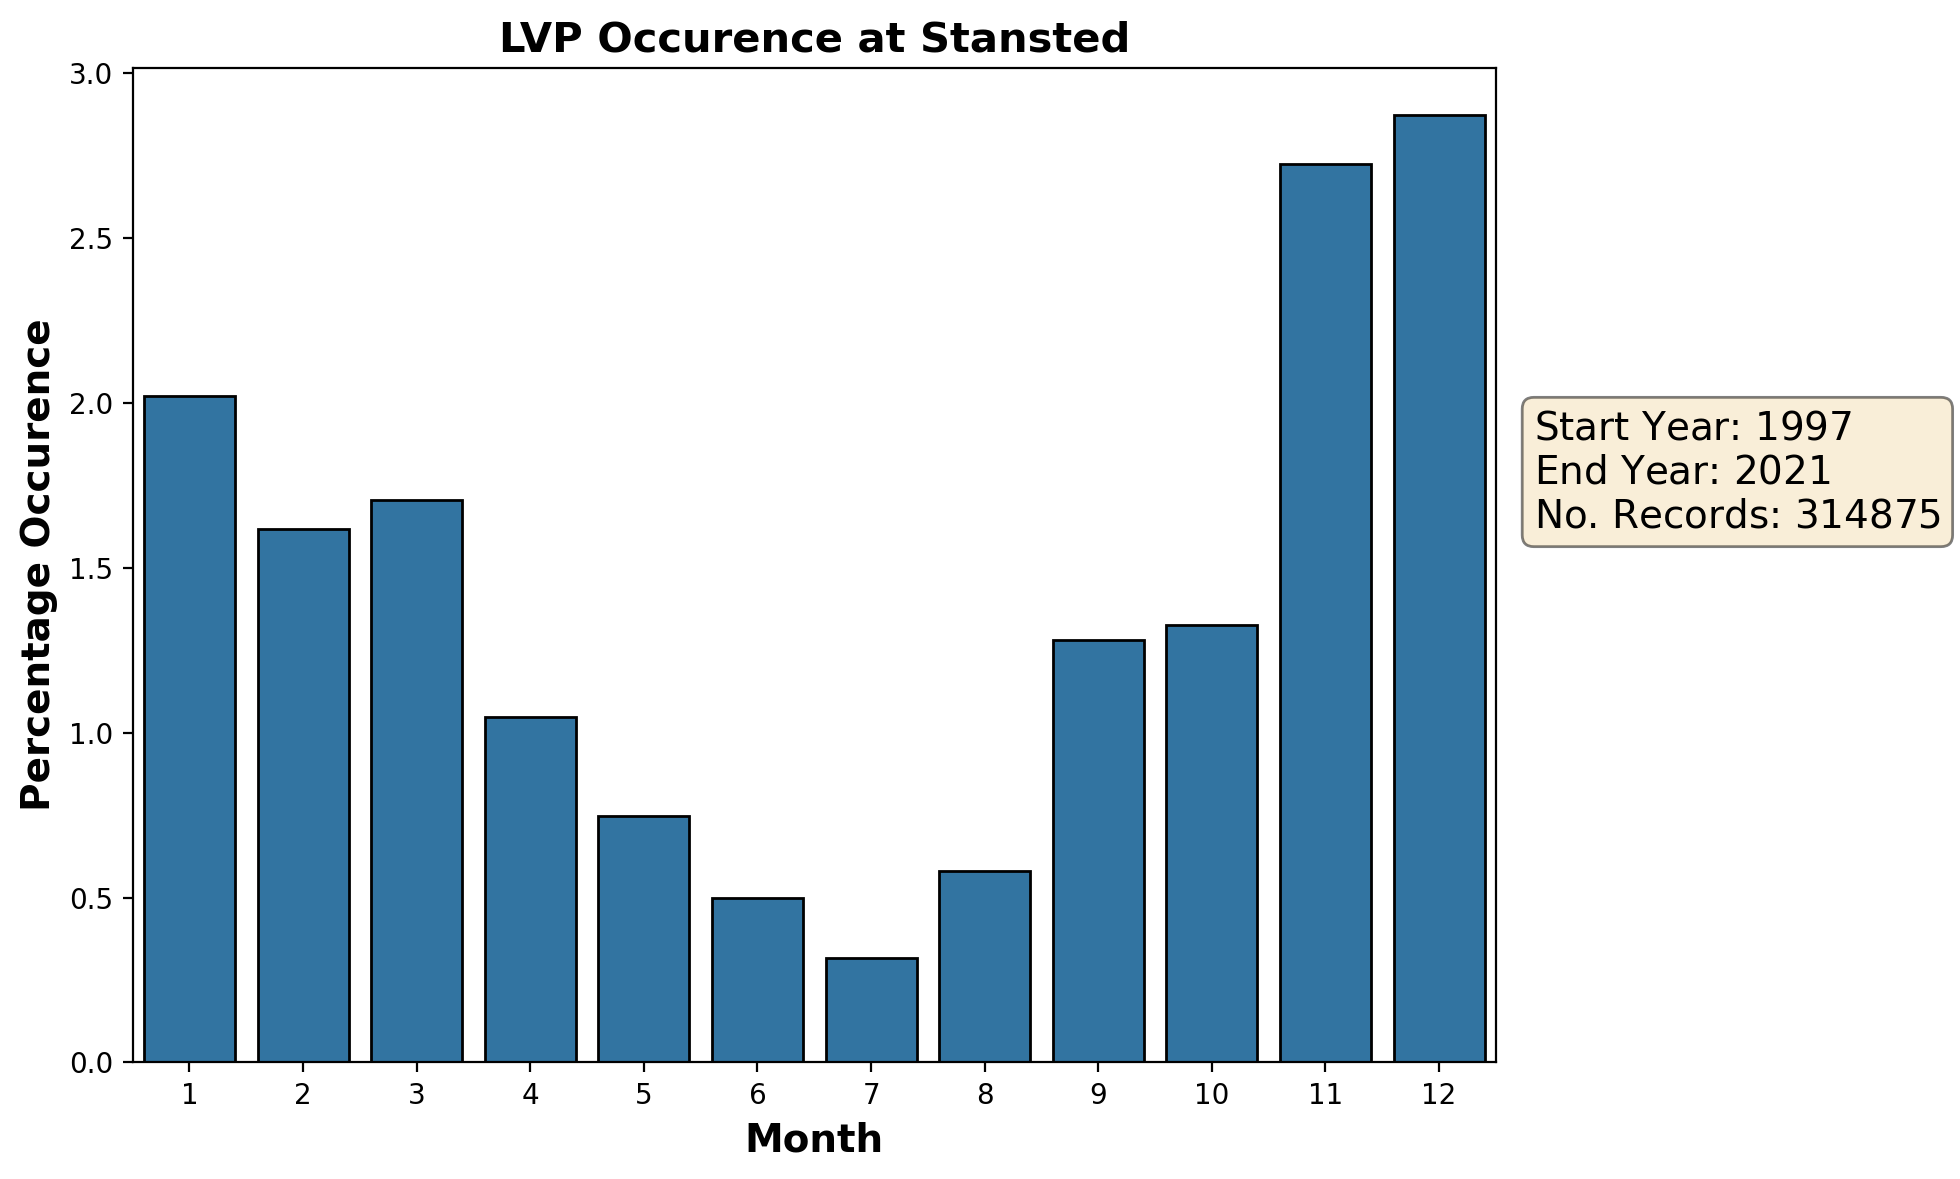
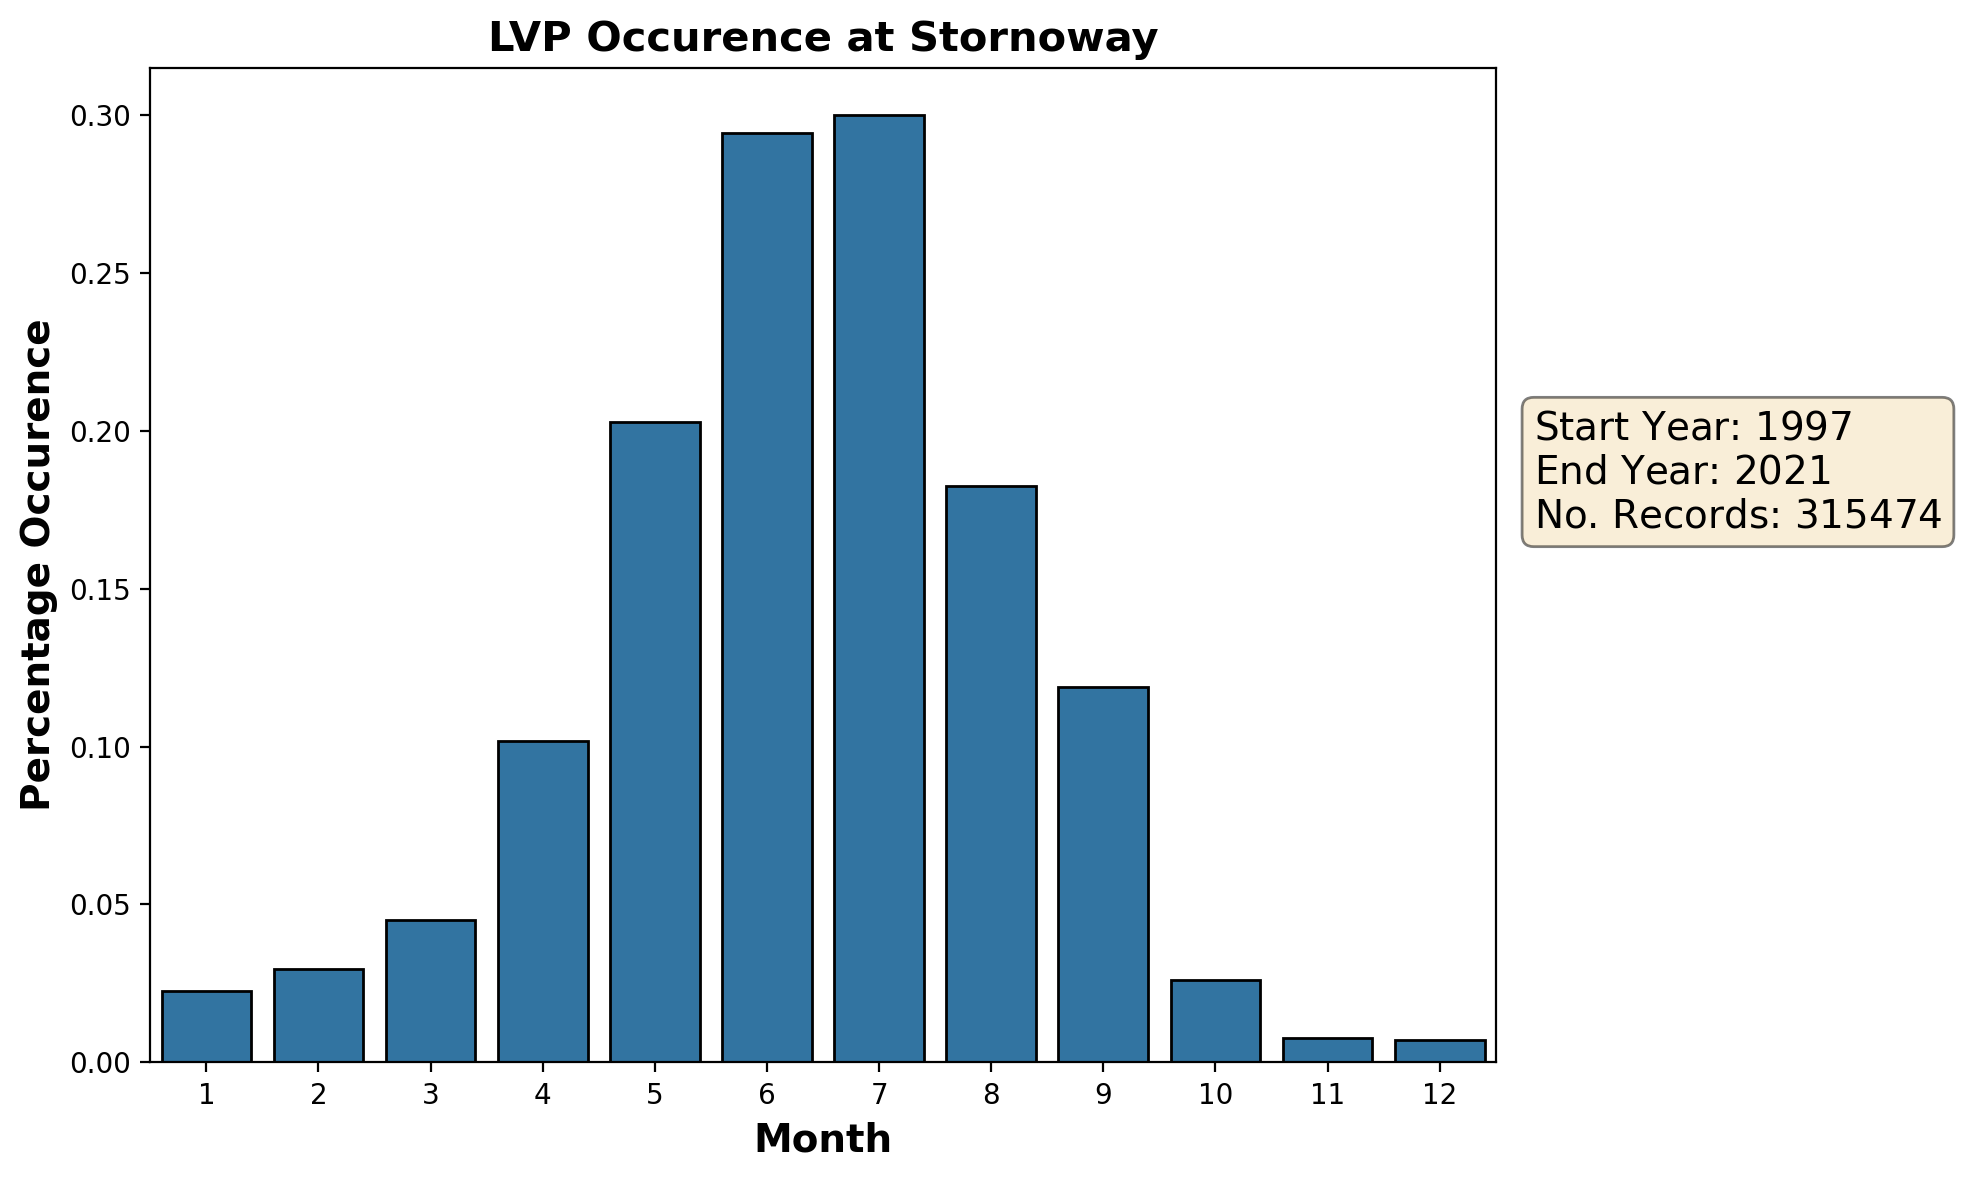
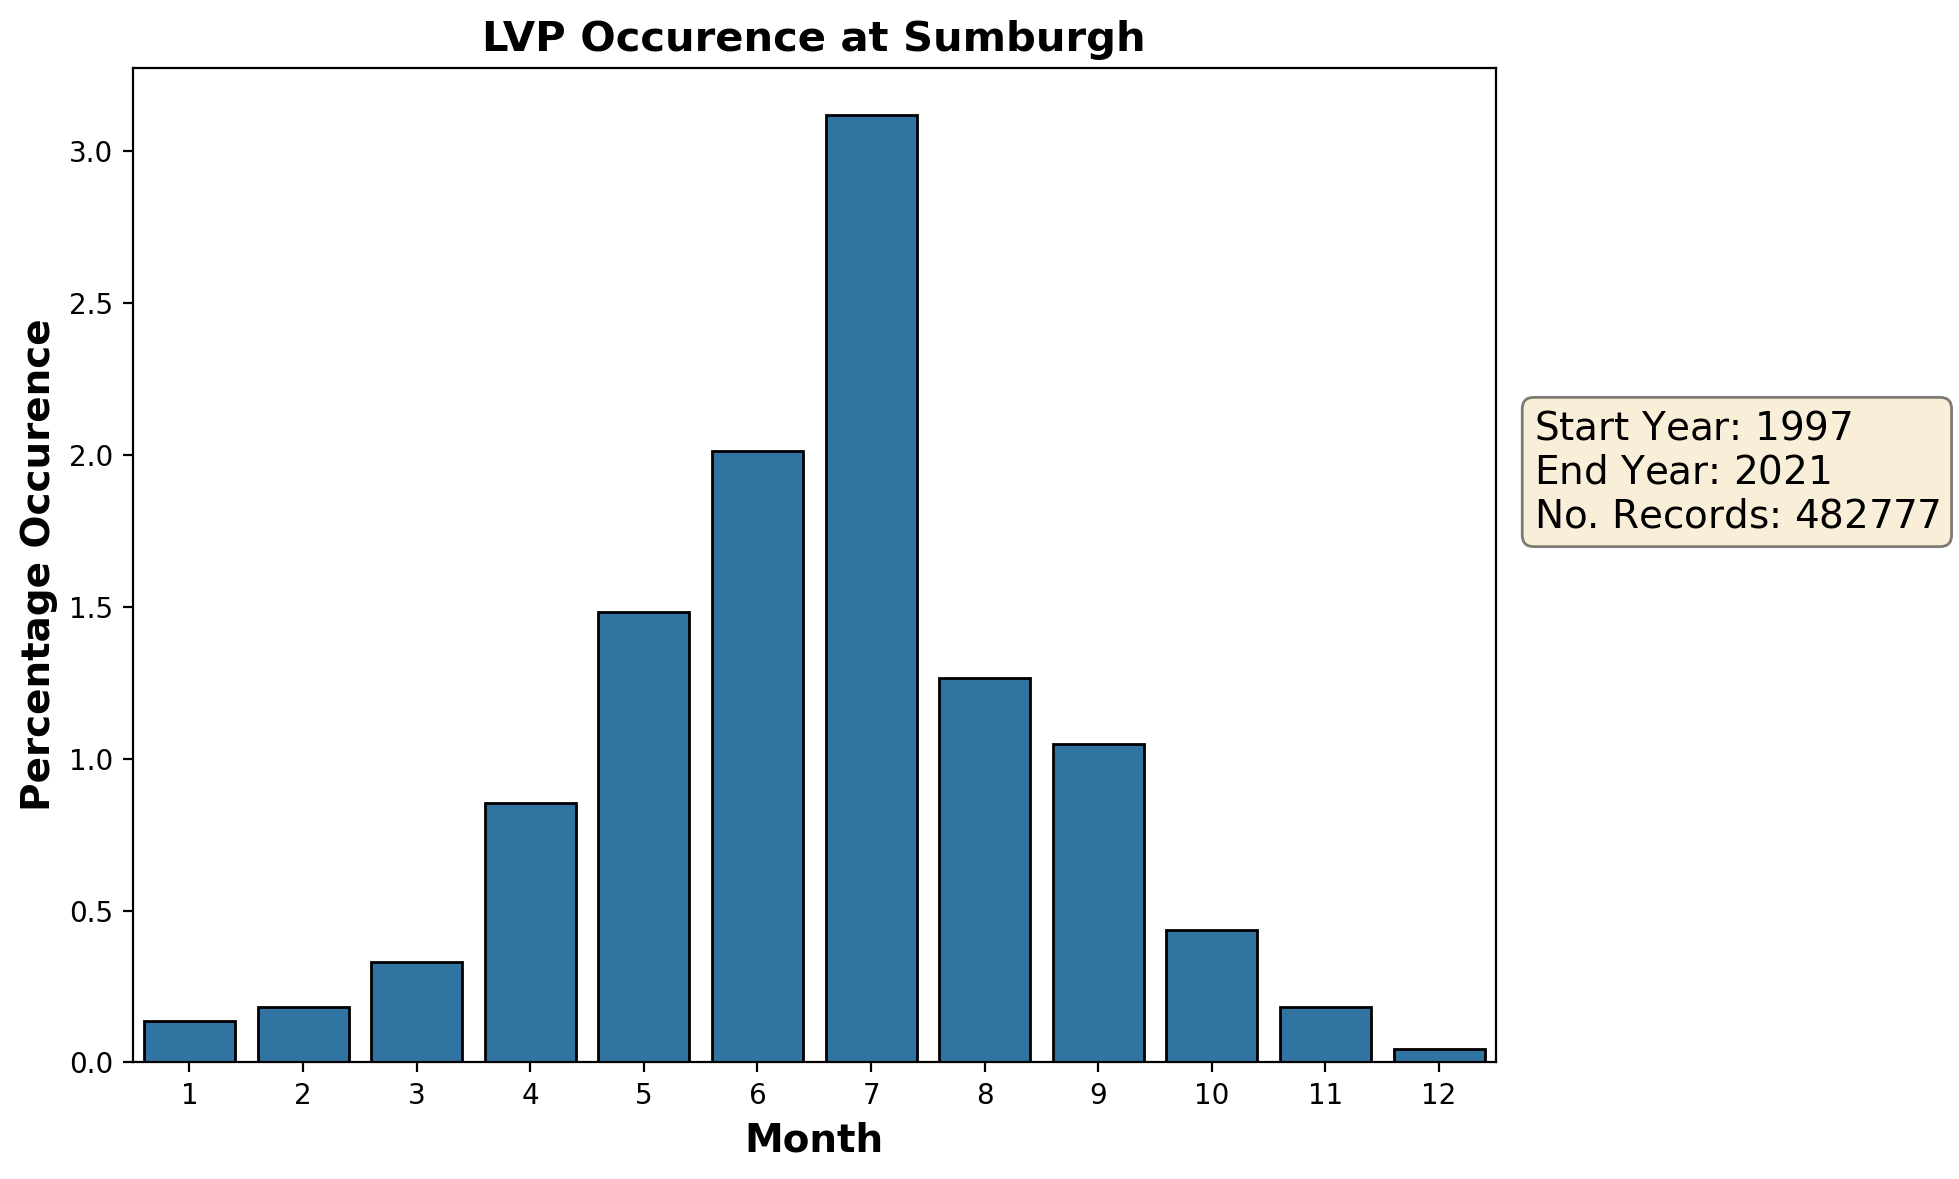
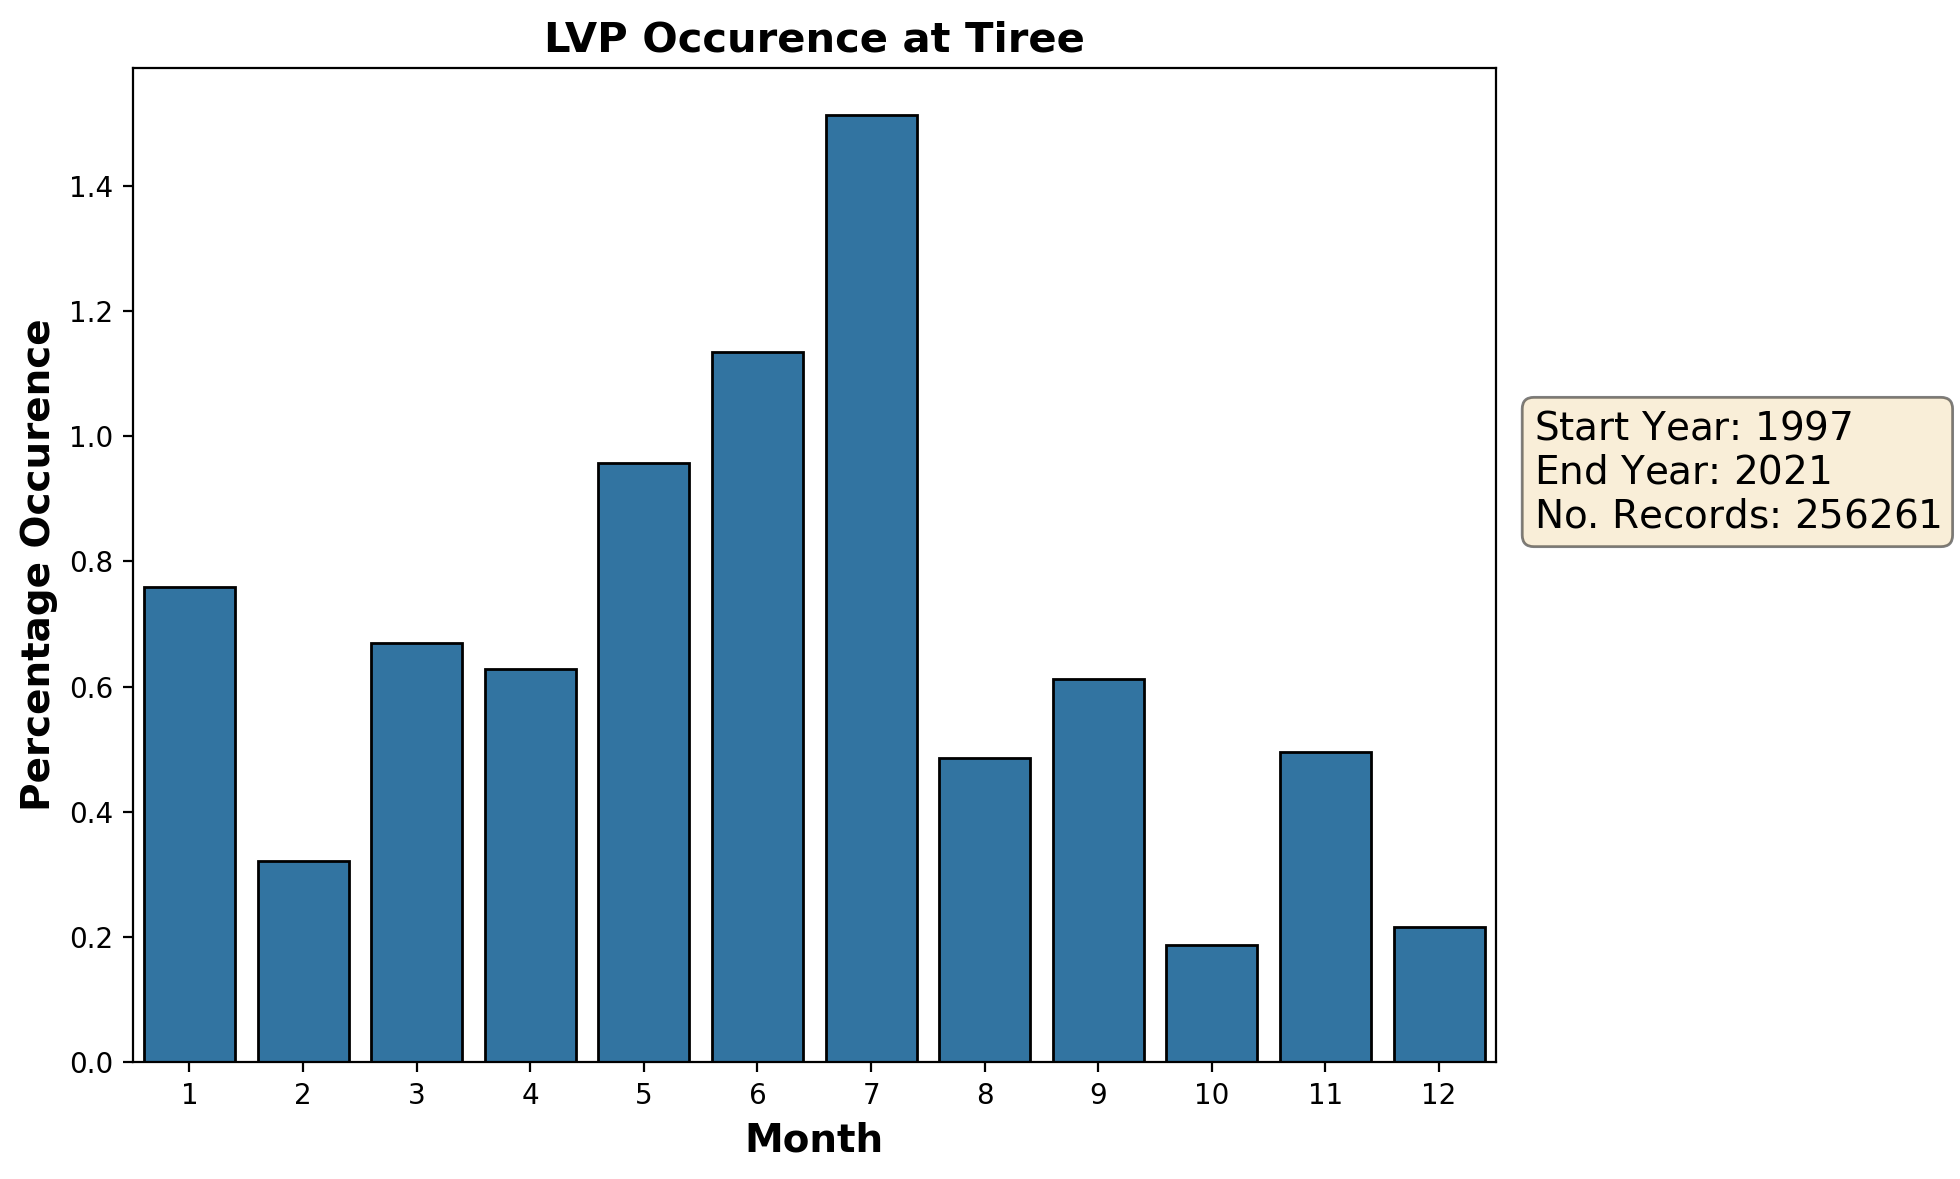
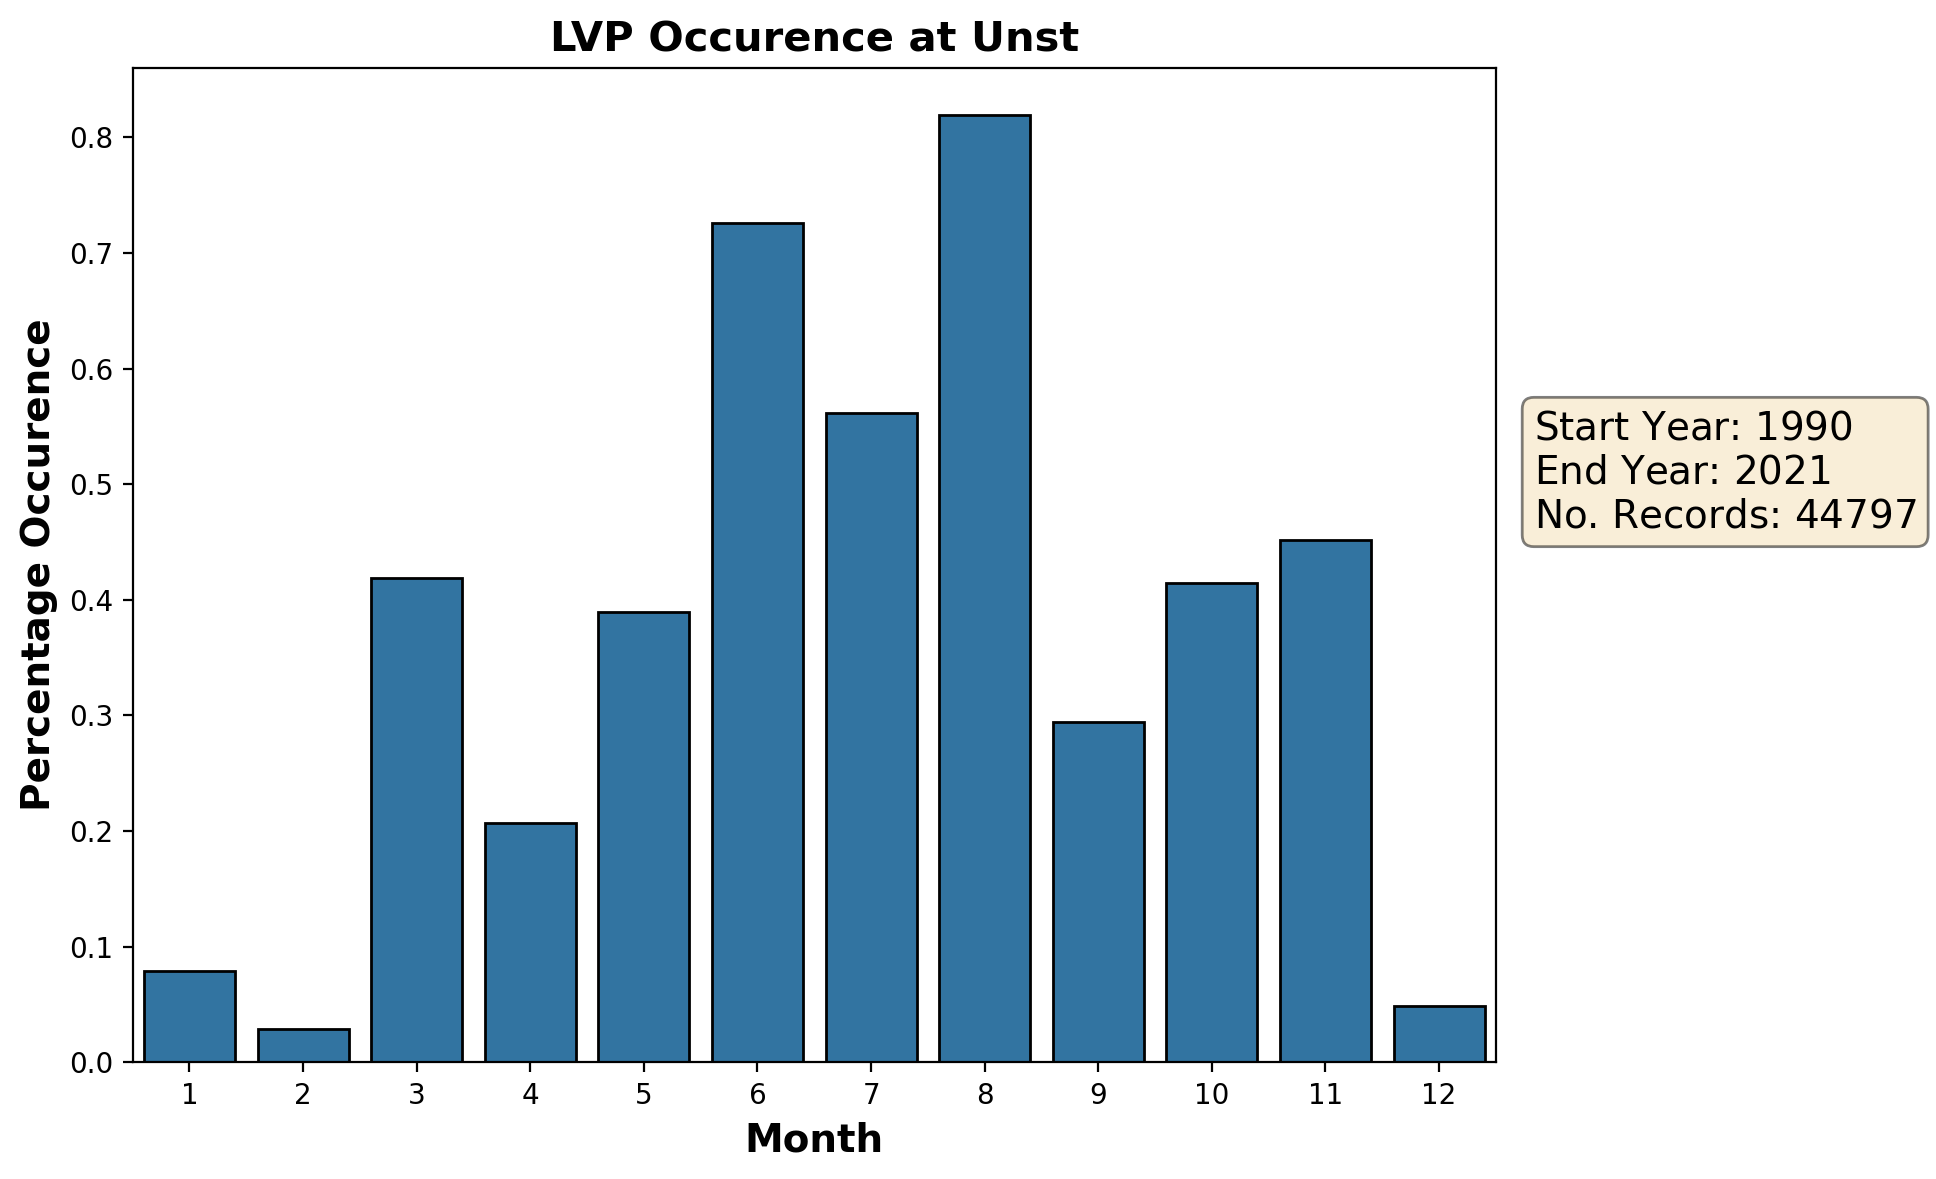
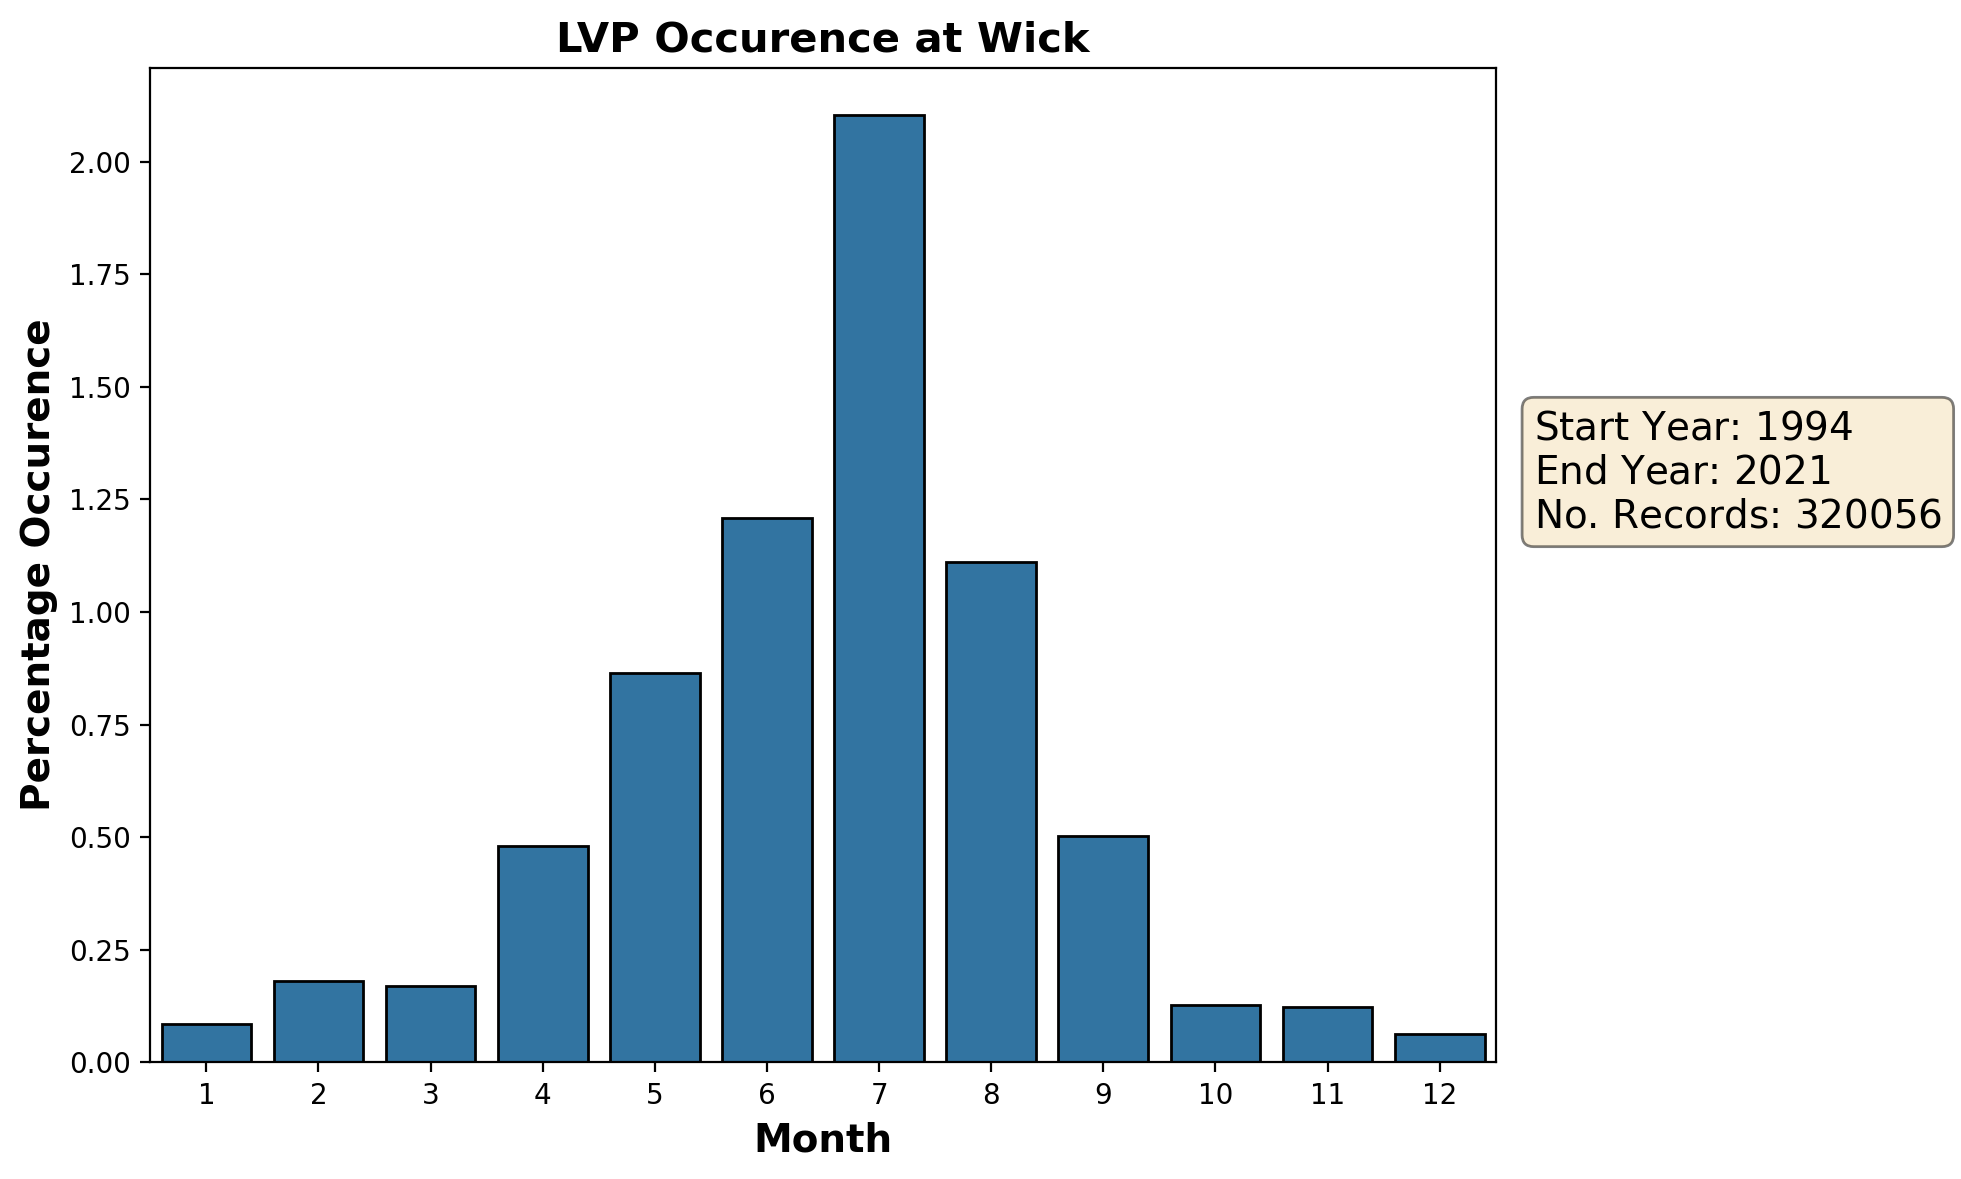
Occurrence of LVPs
This plot shows the percentage occurence of Low Visibility Procedures (LVPs) at each airfield by month. The LVP criteria* is met when cloud base falls below 300 feet (at least 5 oktas coverage) and visibility falls below 1500 metres.
*airports can determine their own LVP thresholds, so these statistics should be regarded as a broad guide.
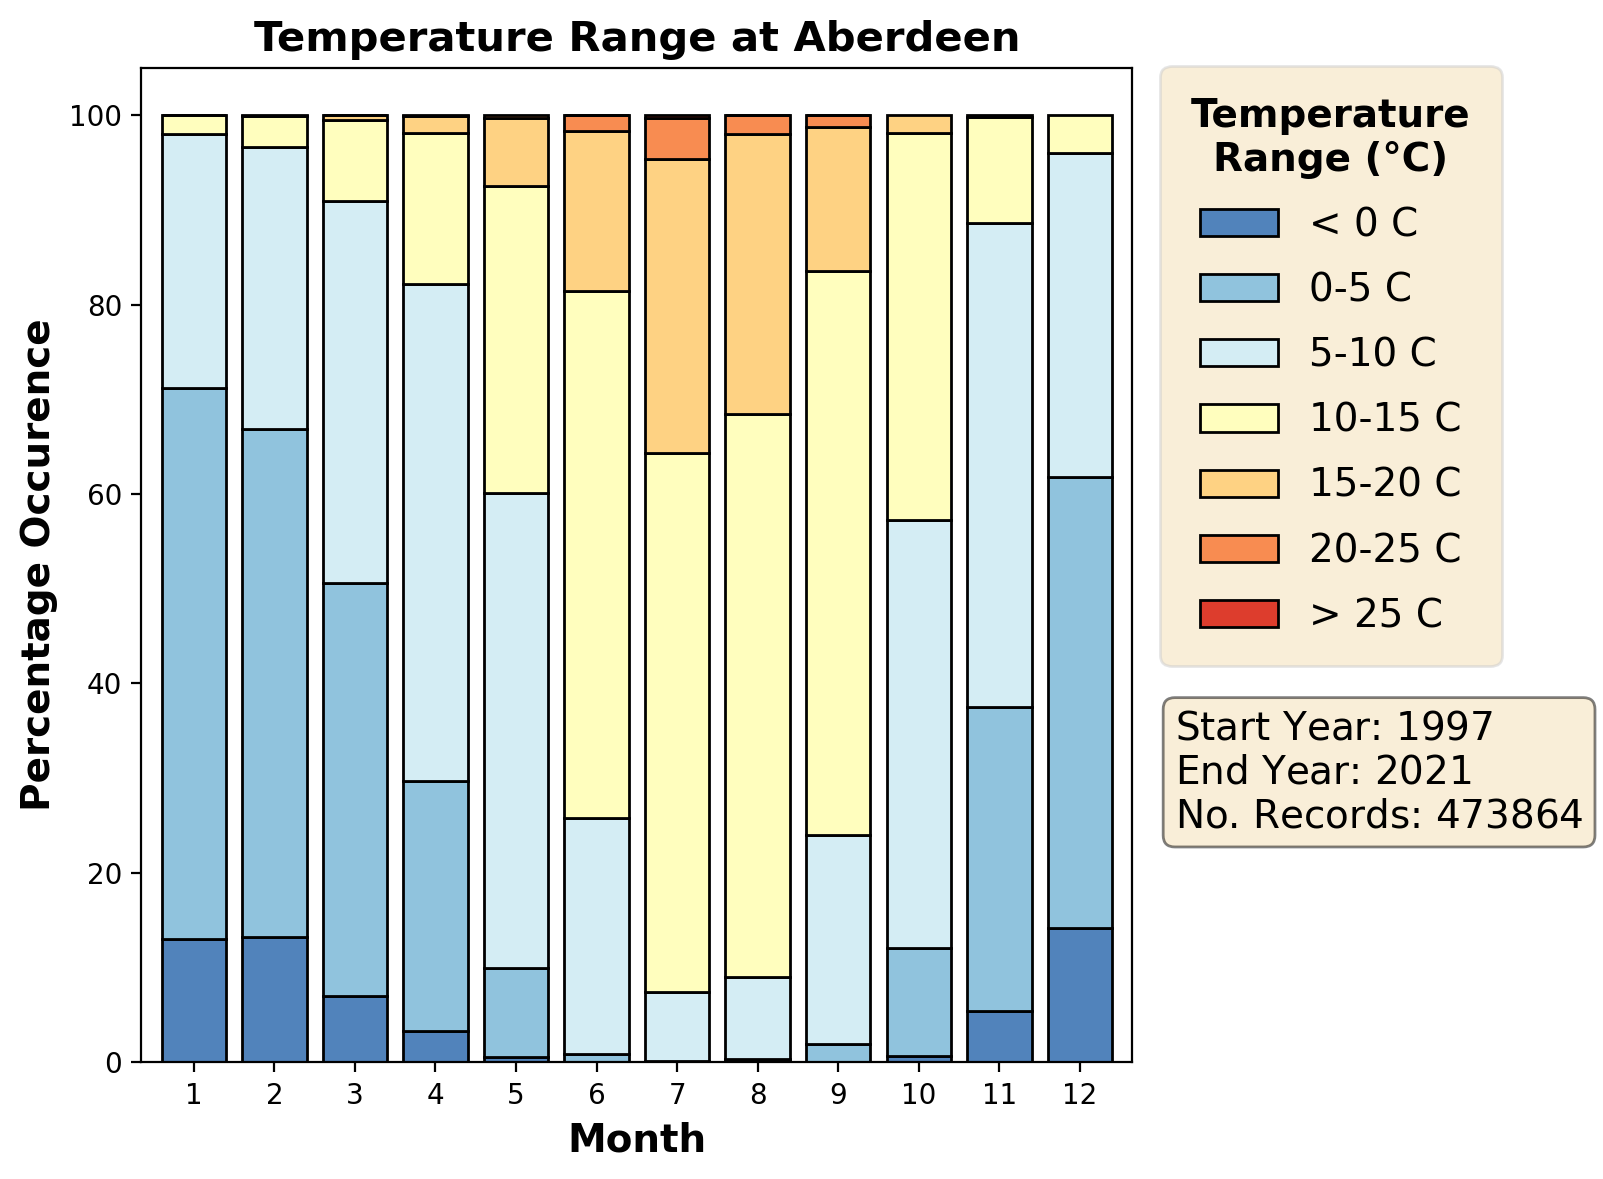
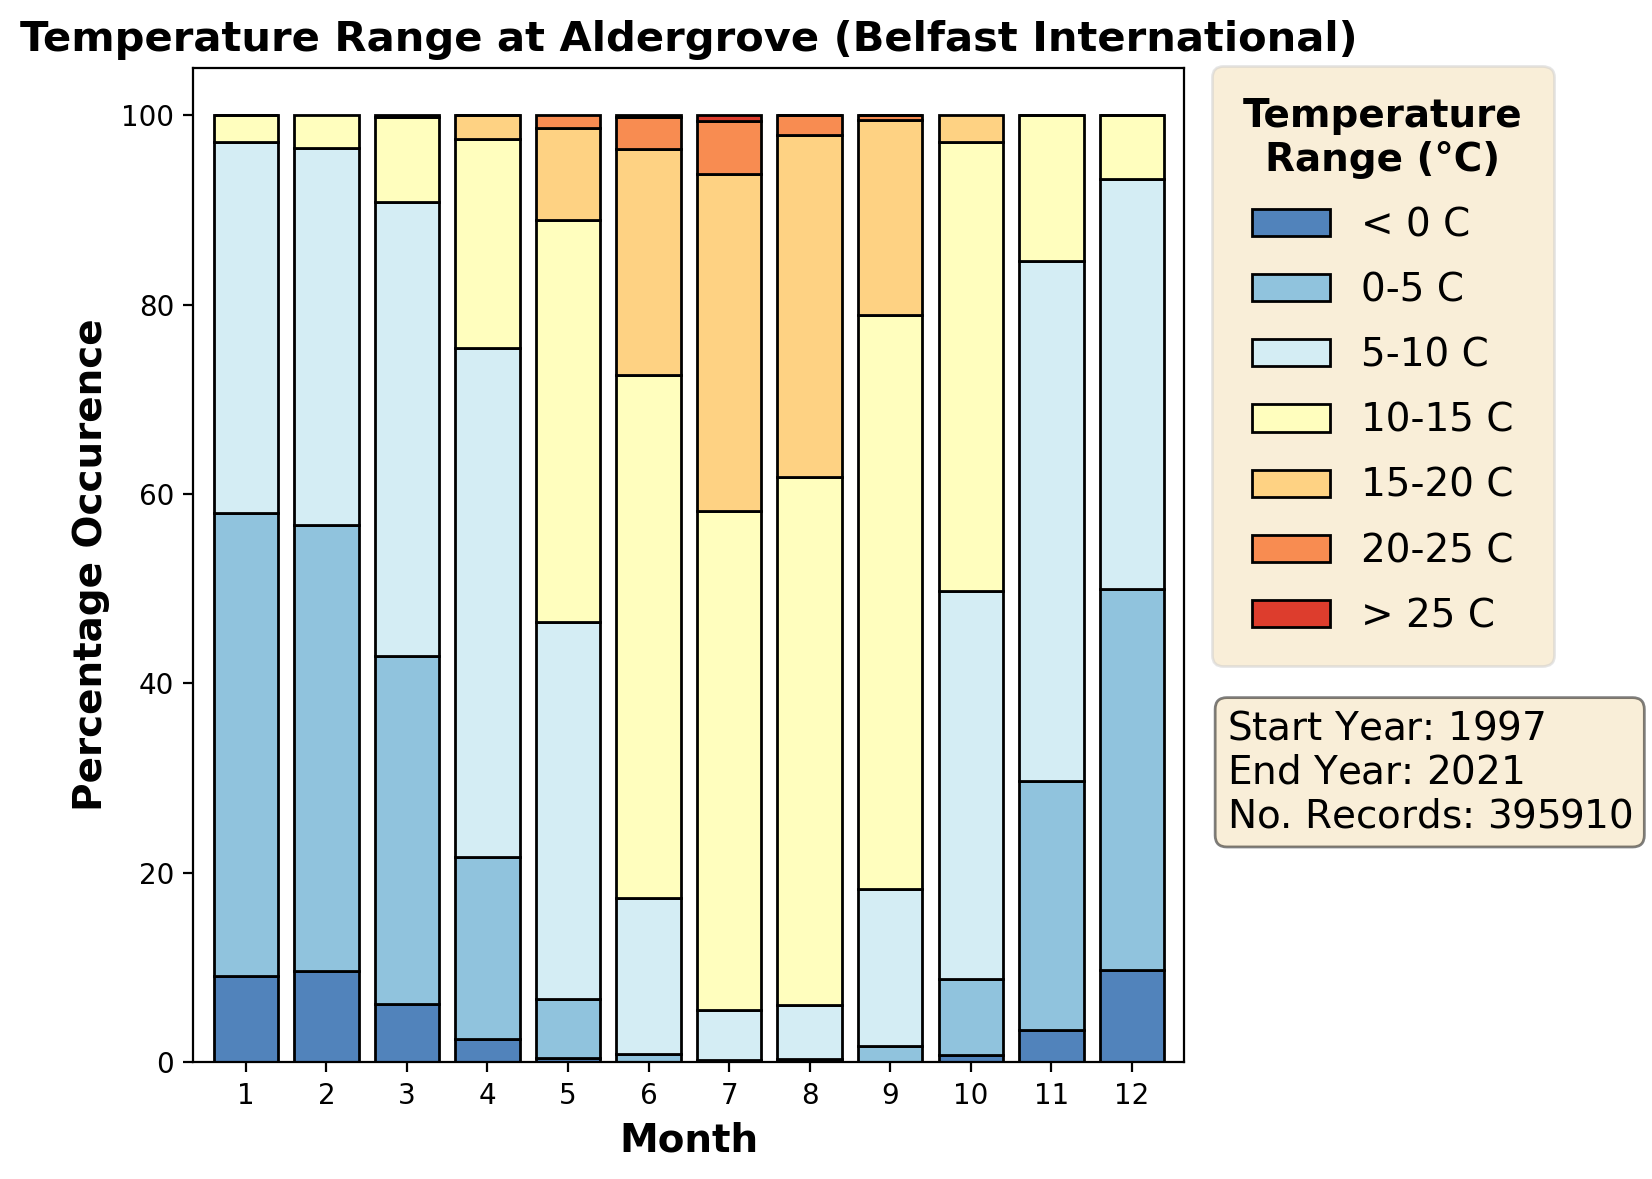
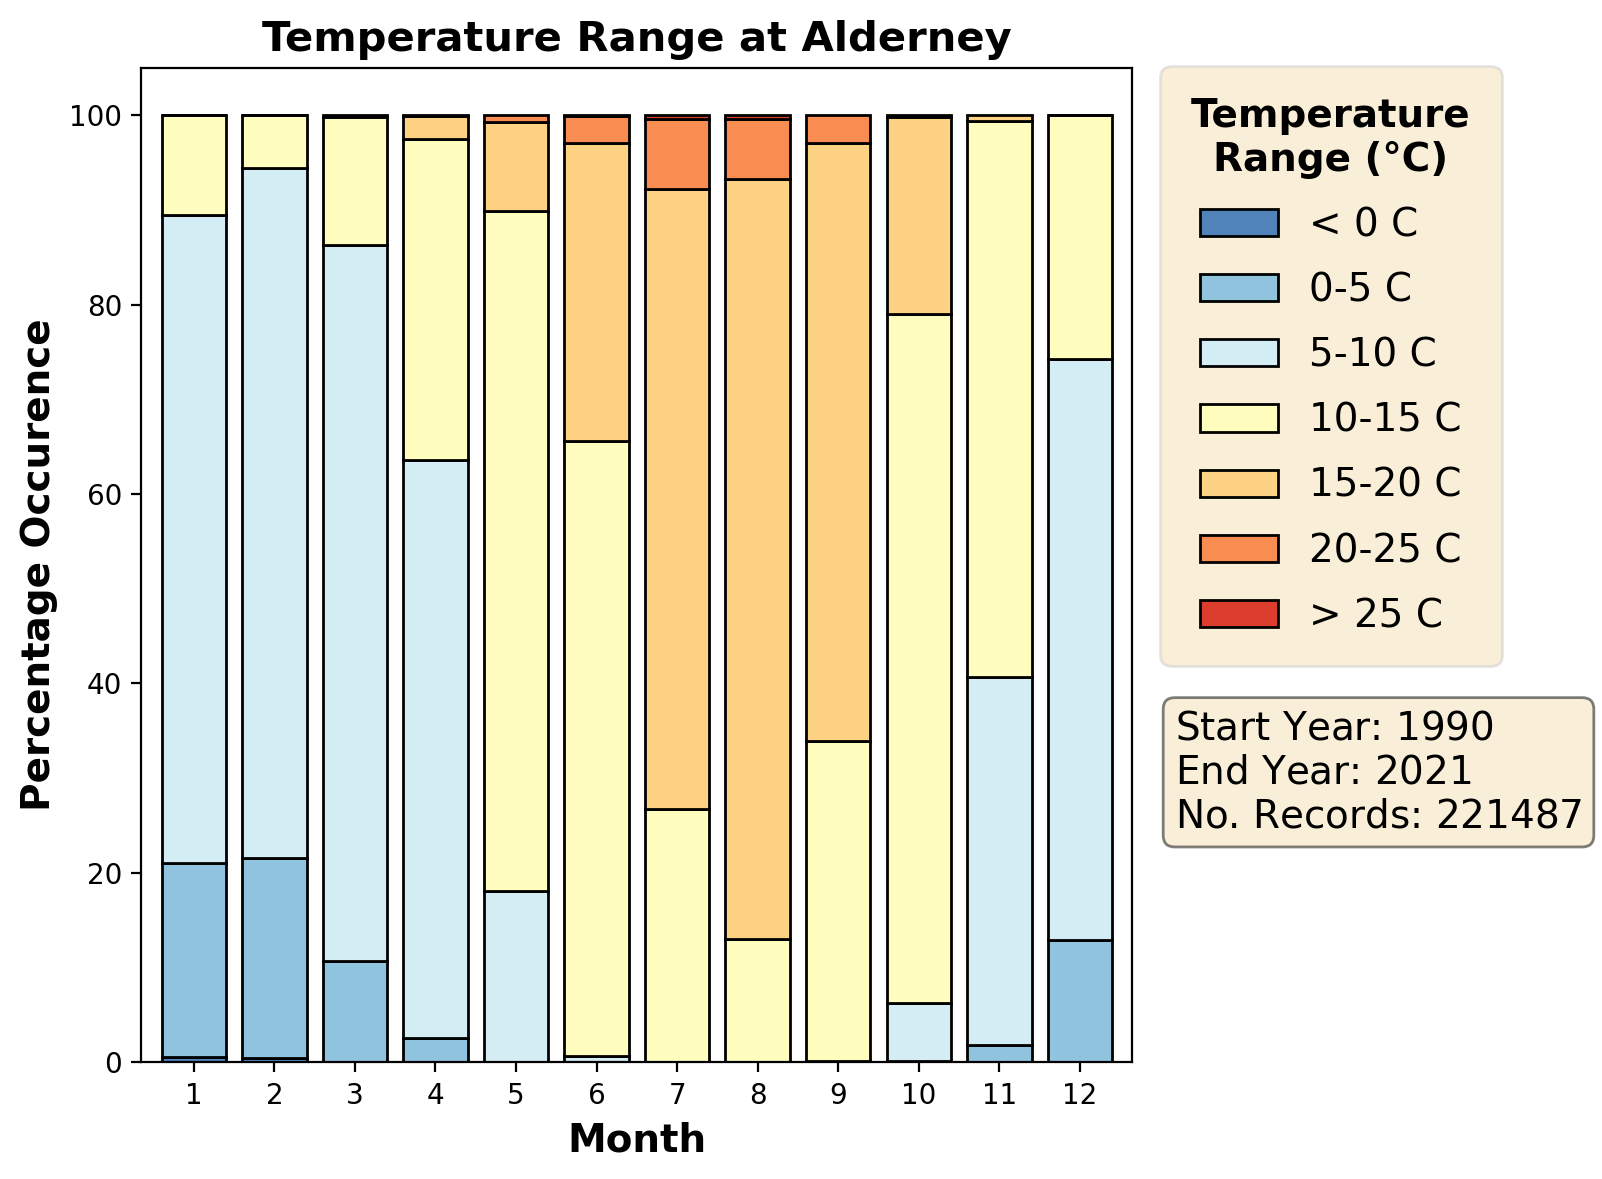
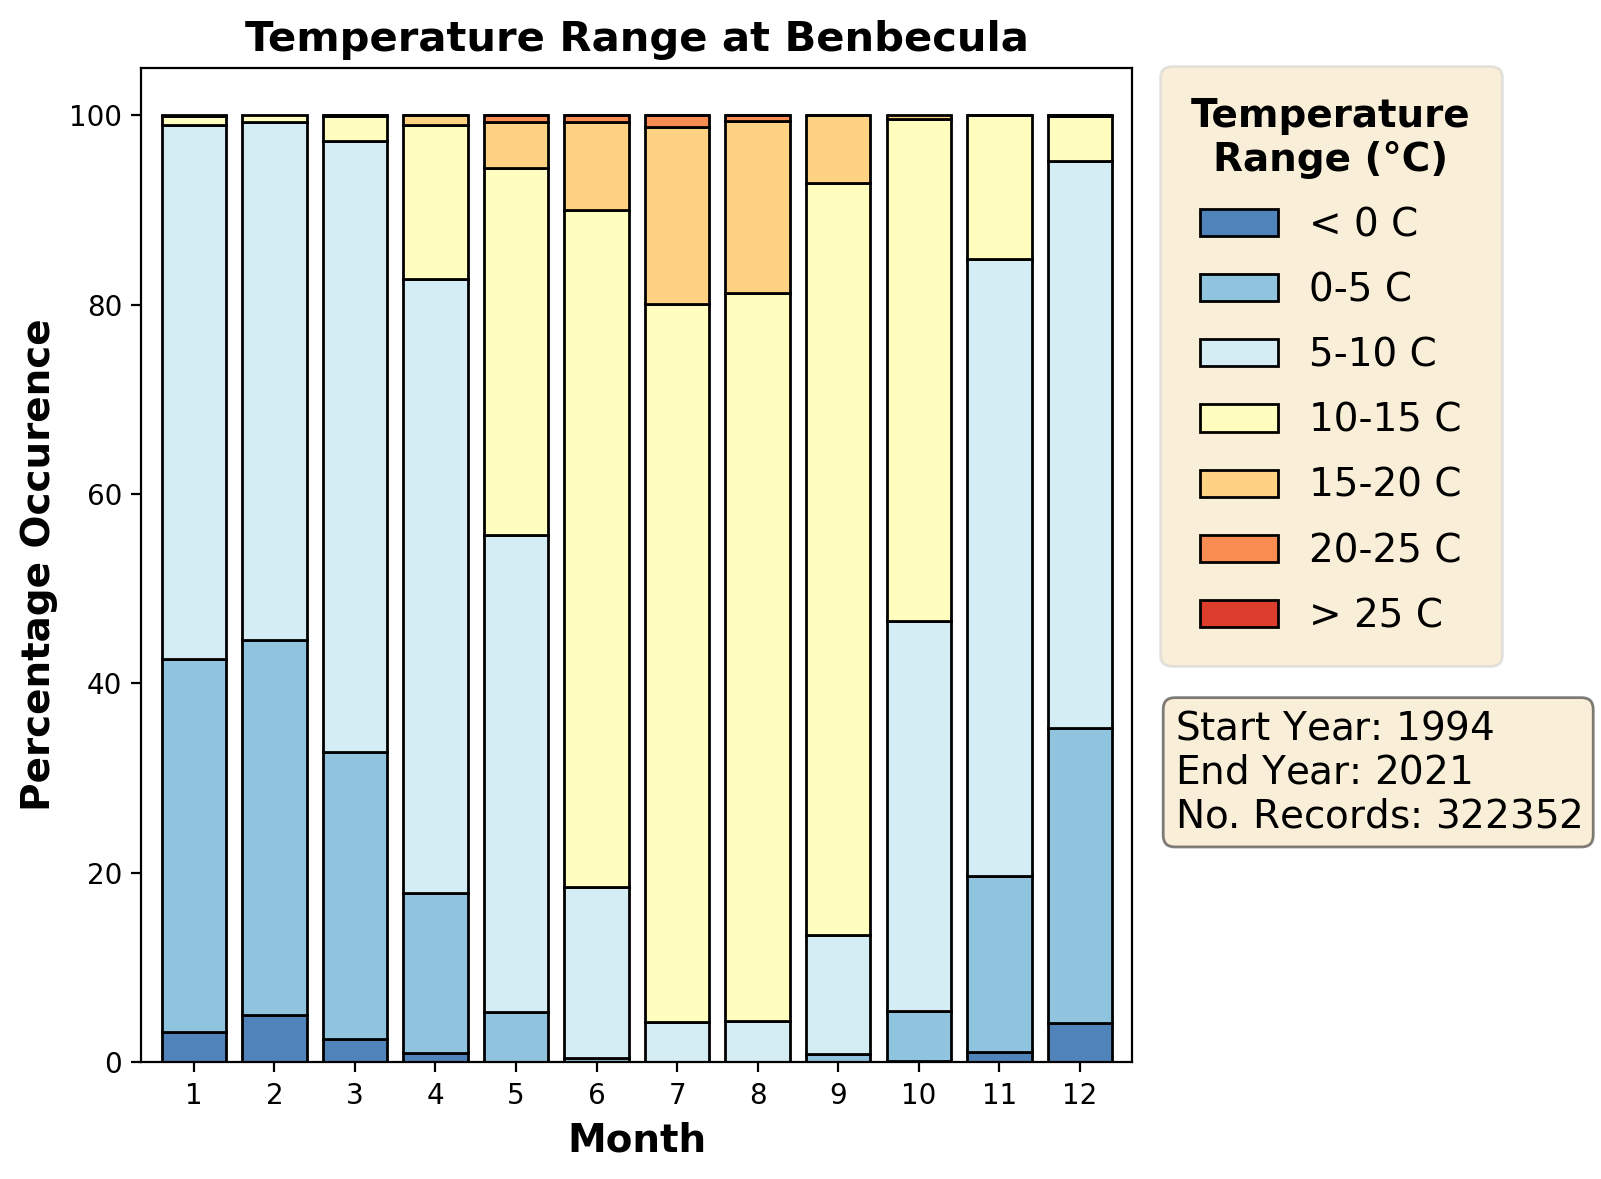
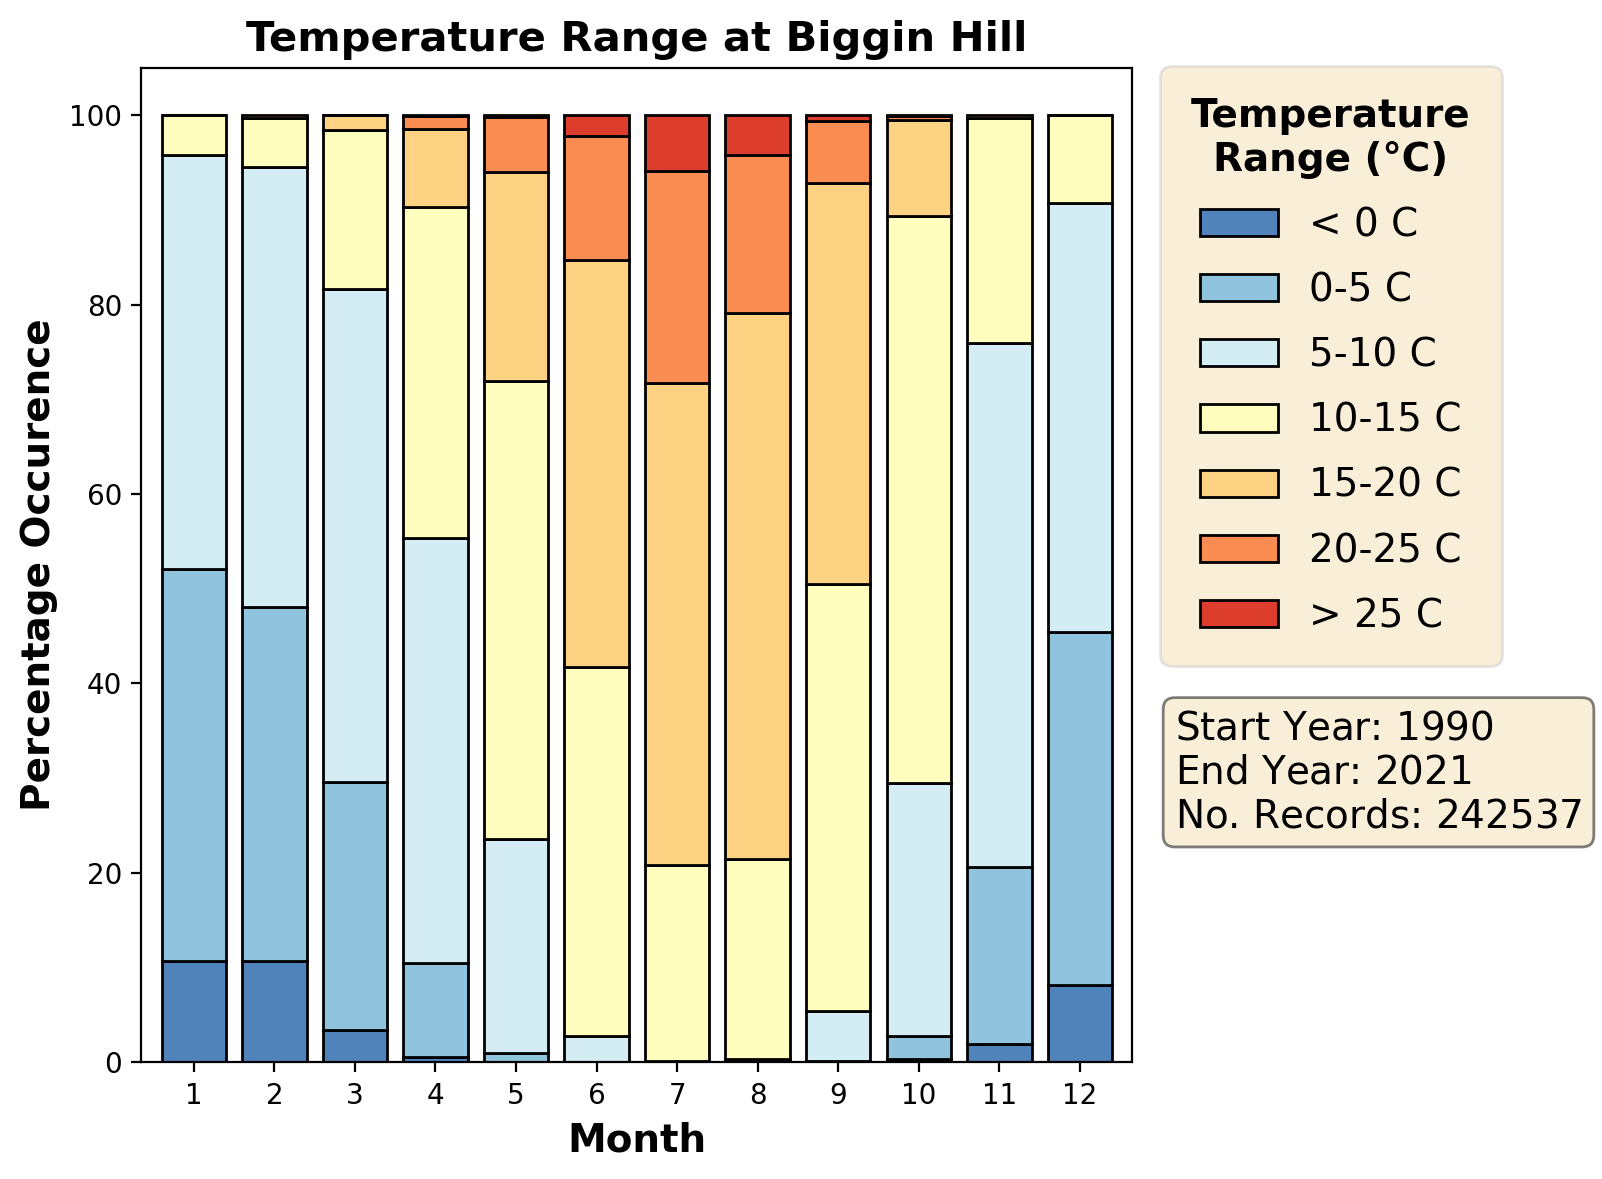
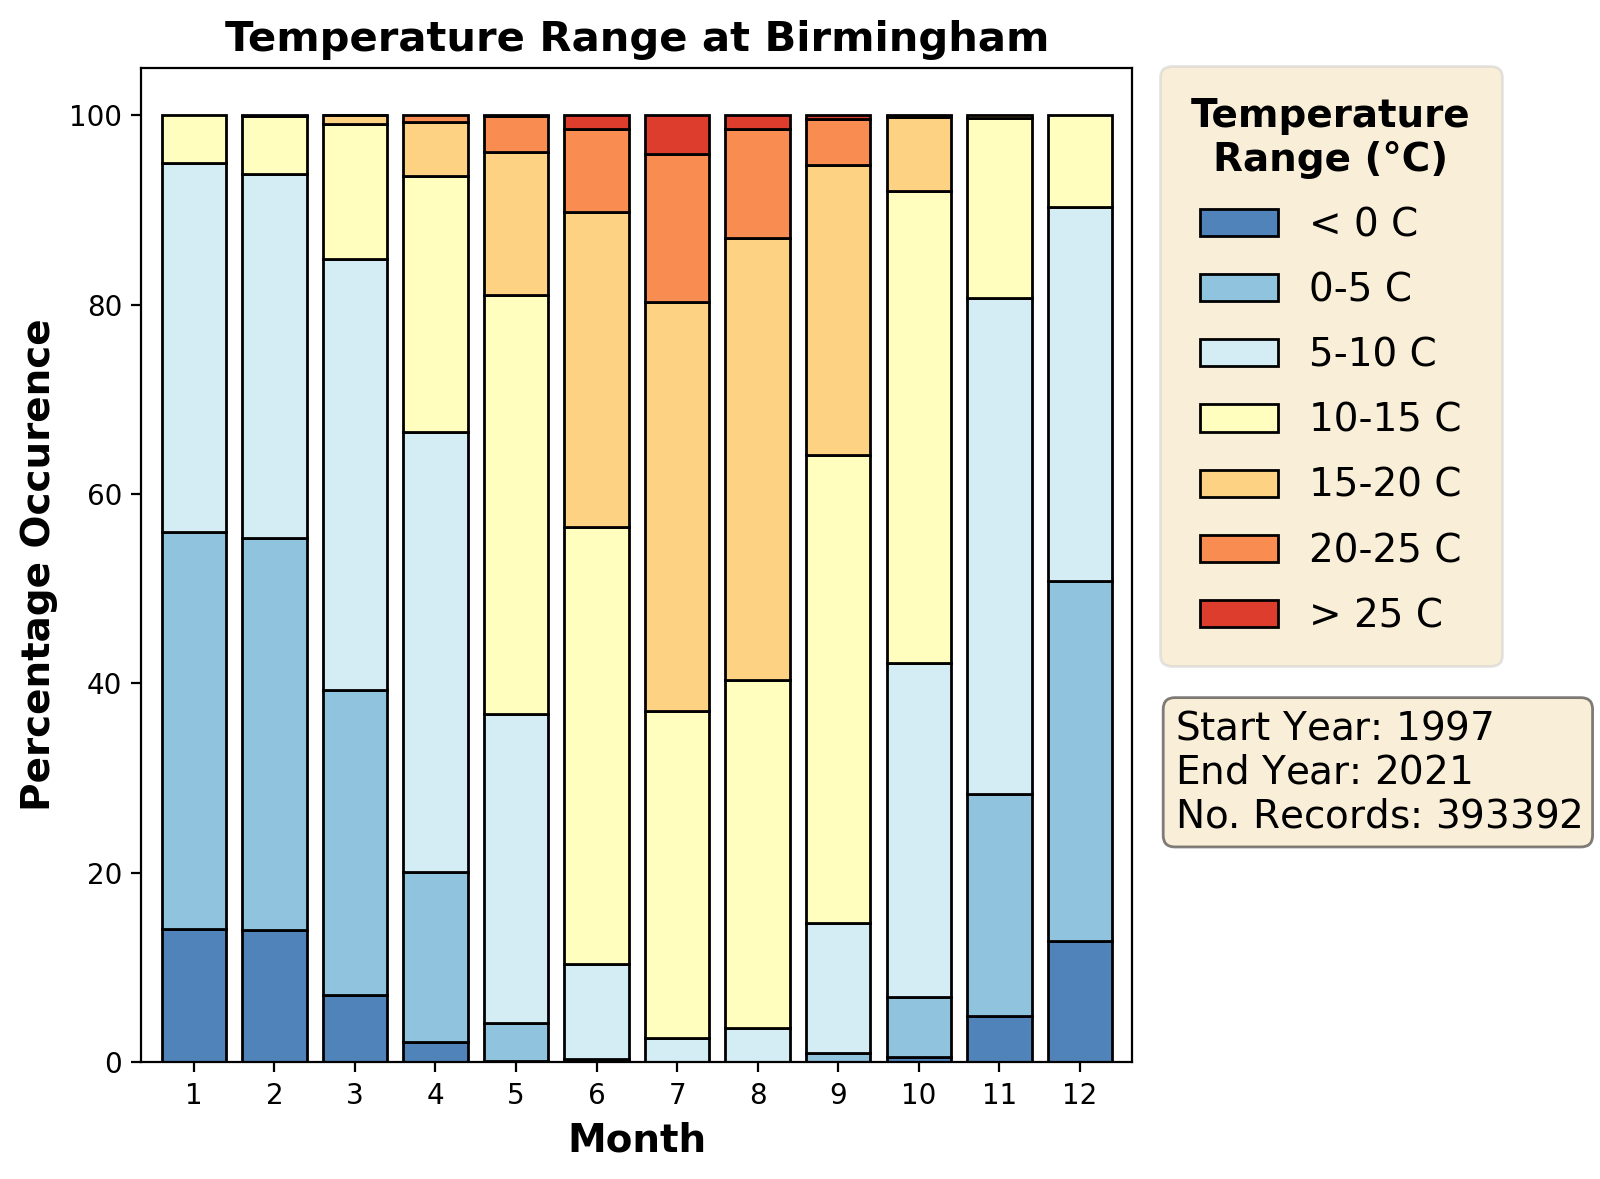
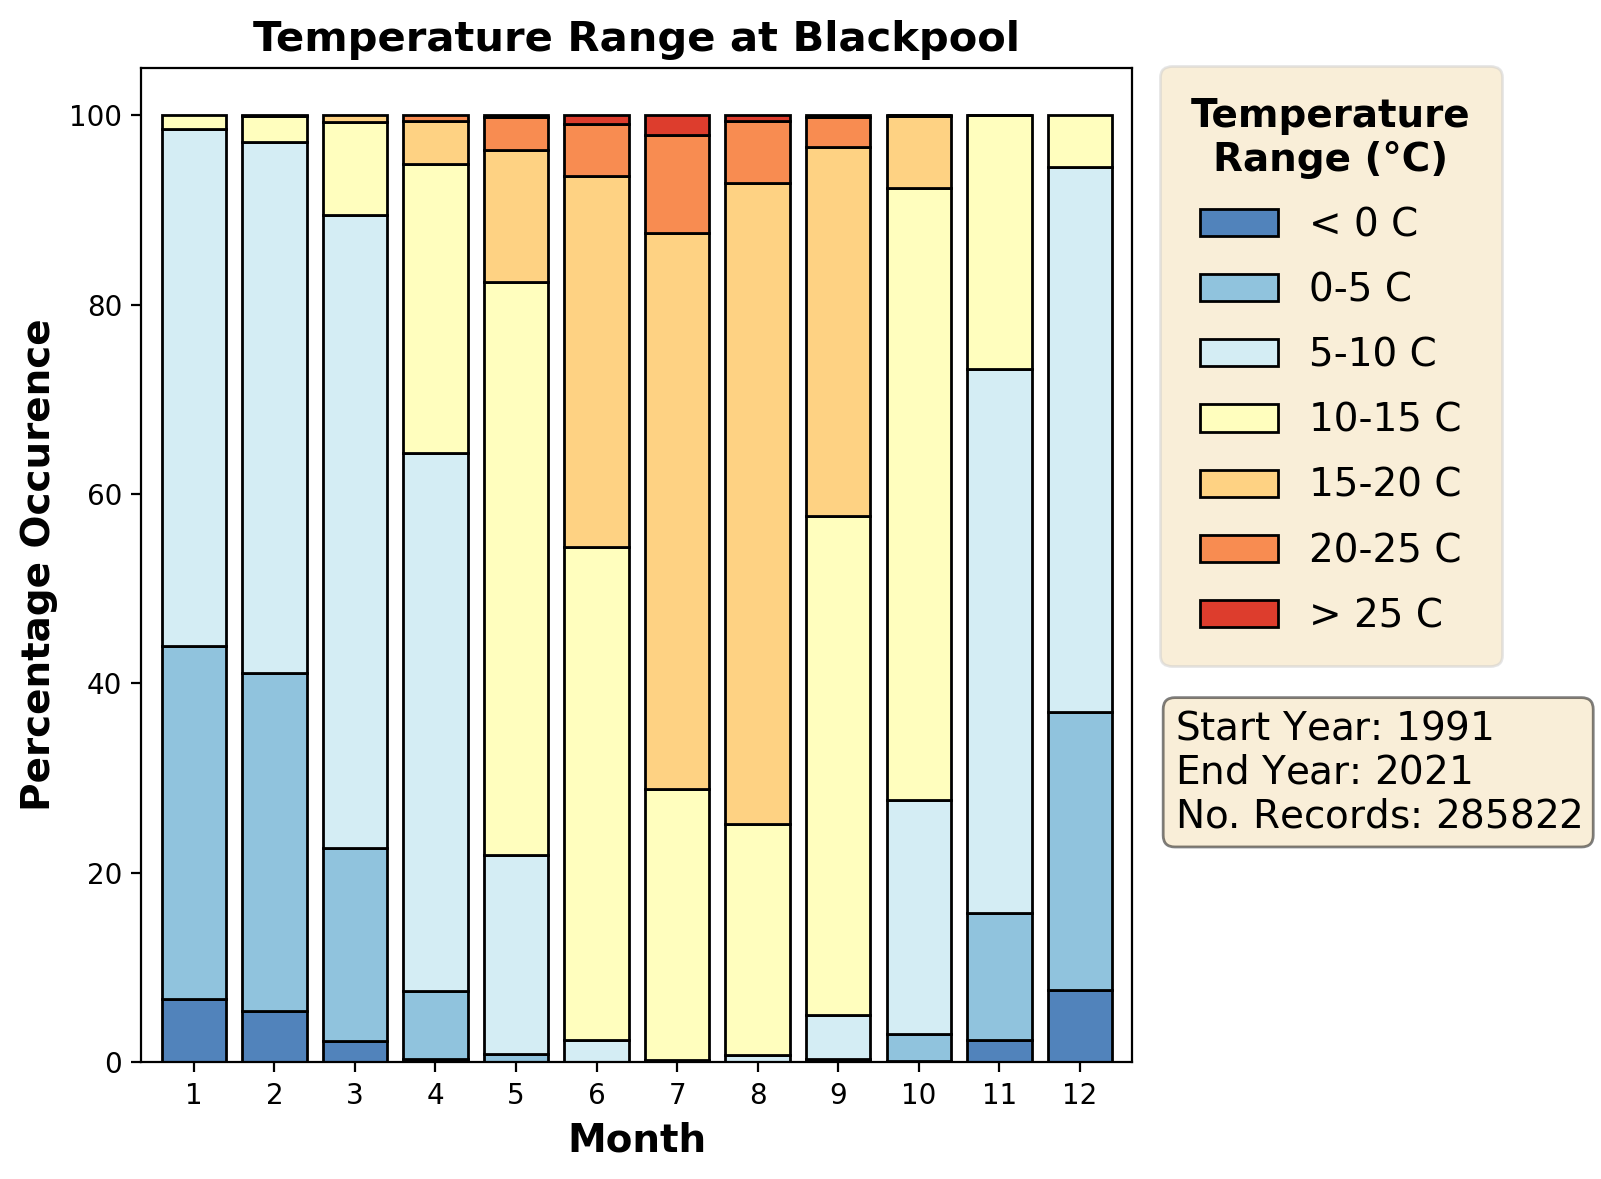
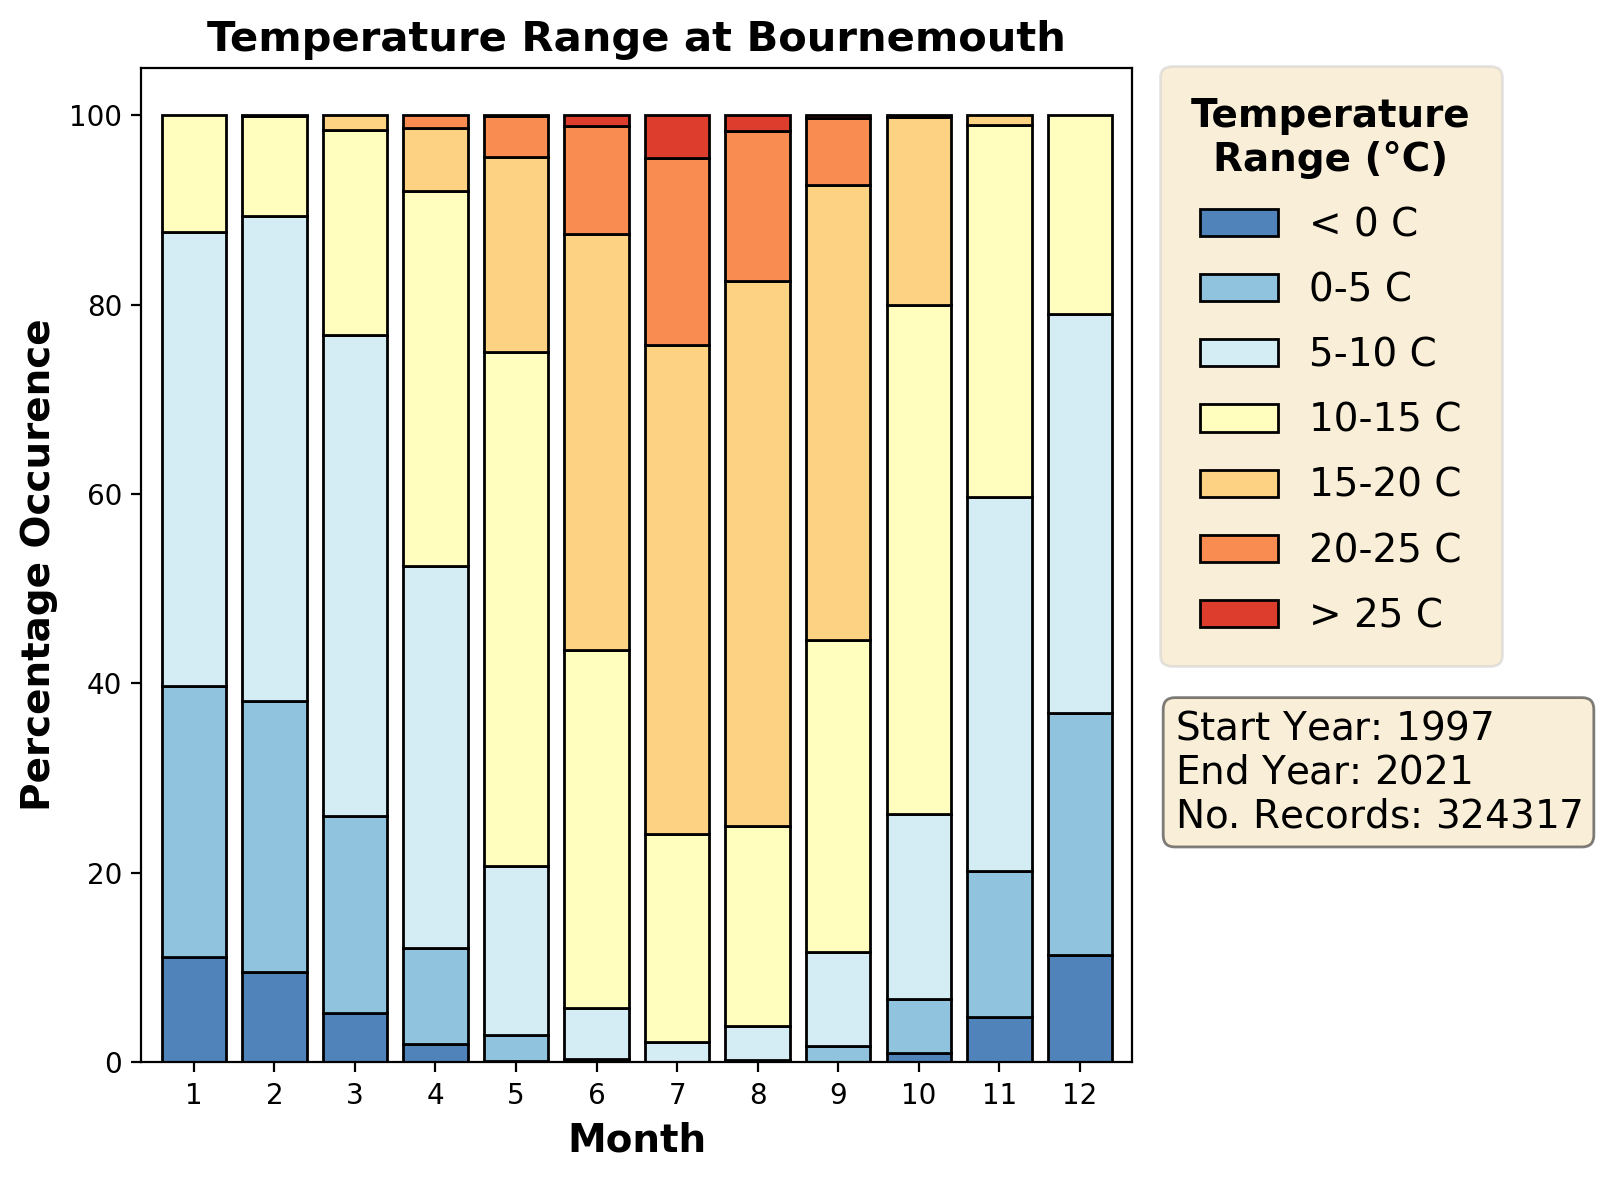
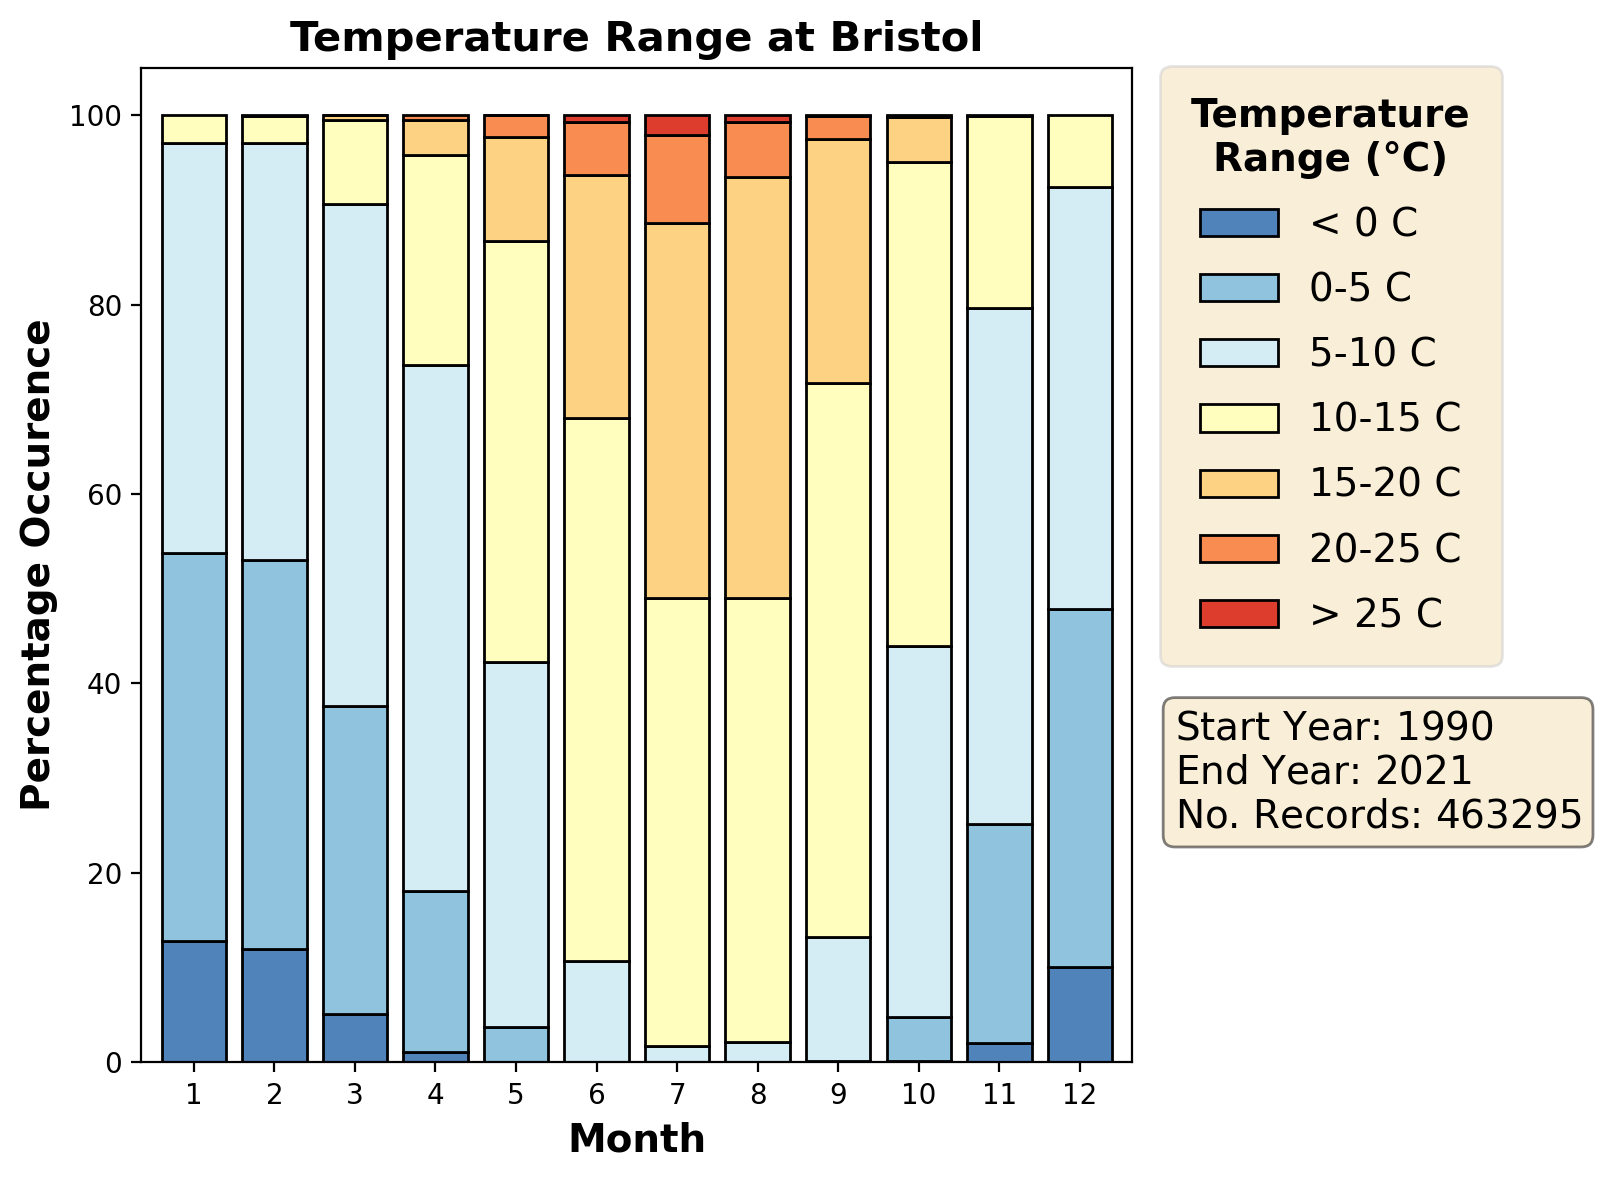
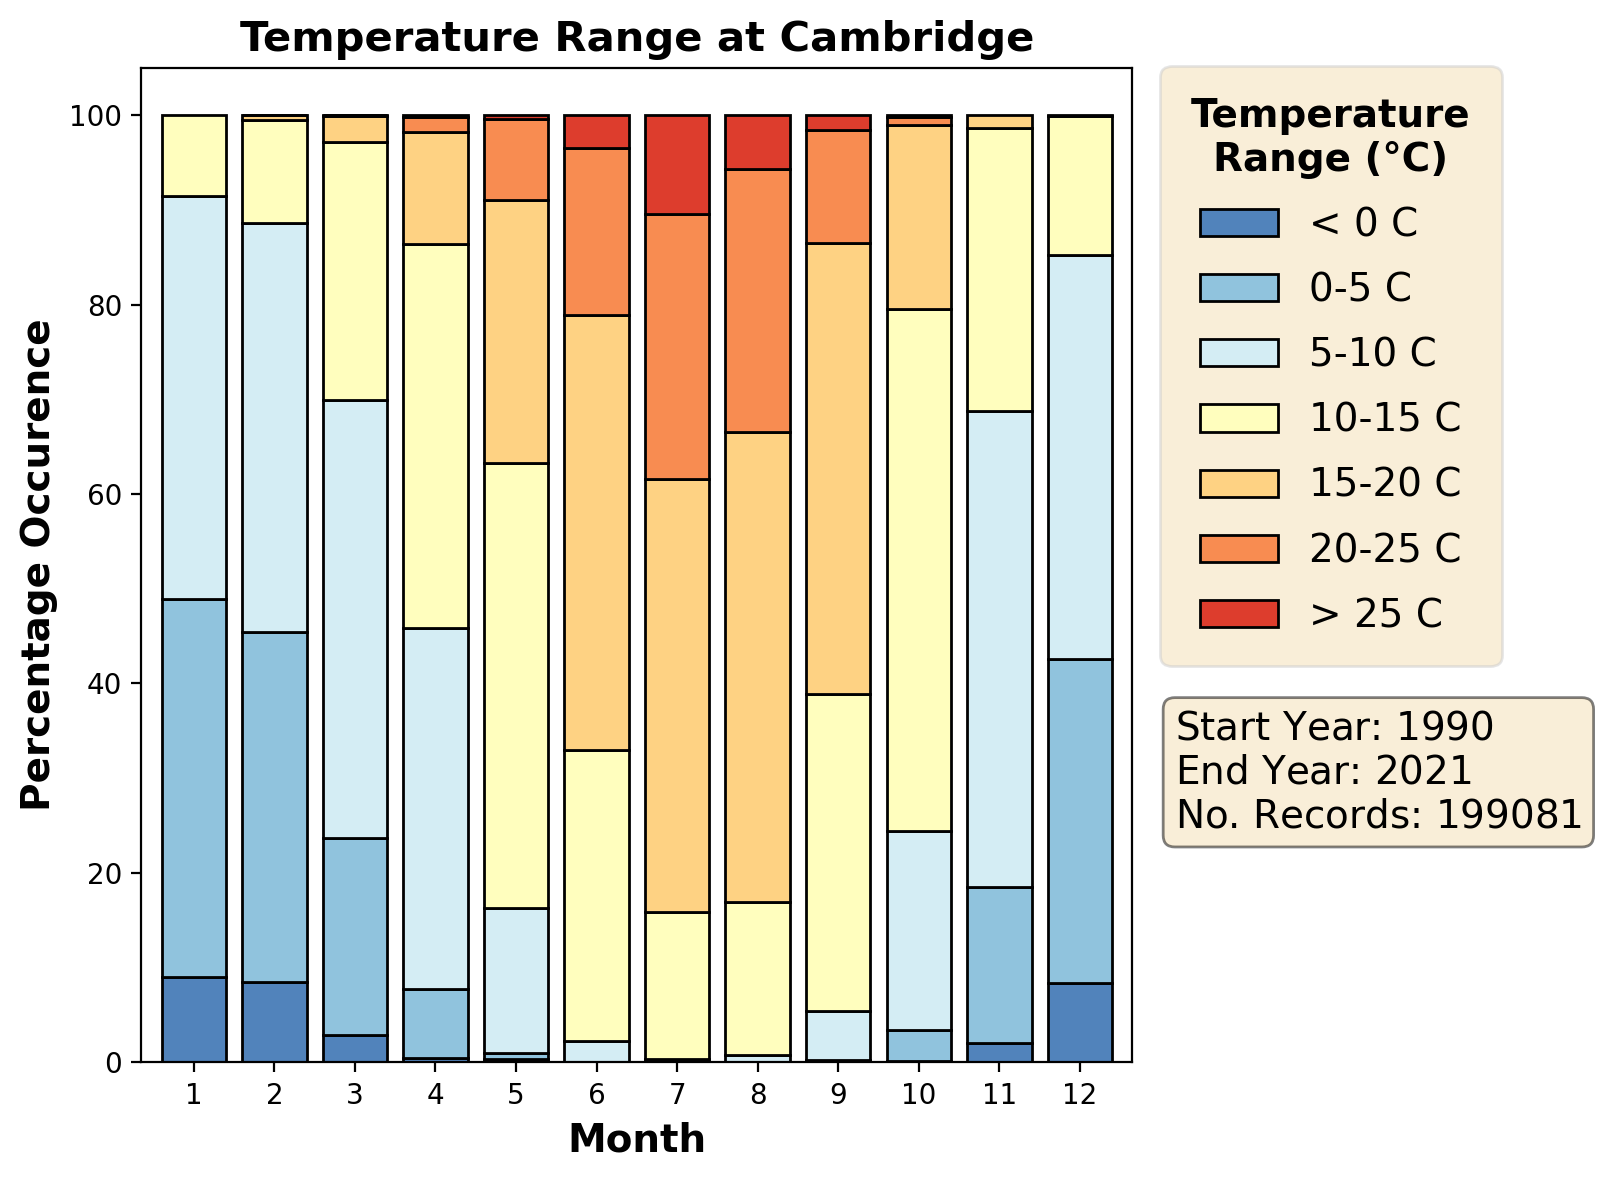
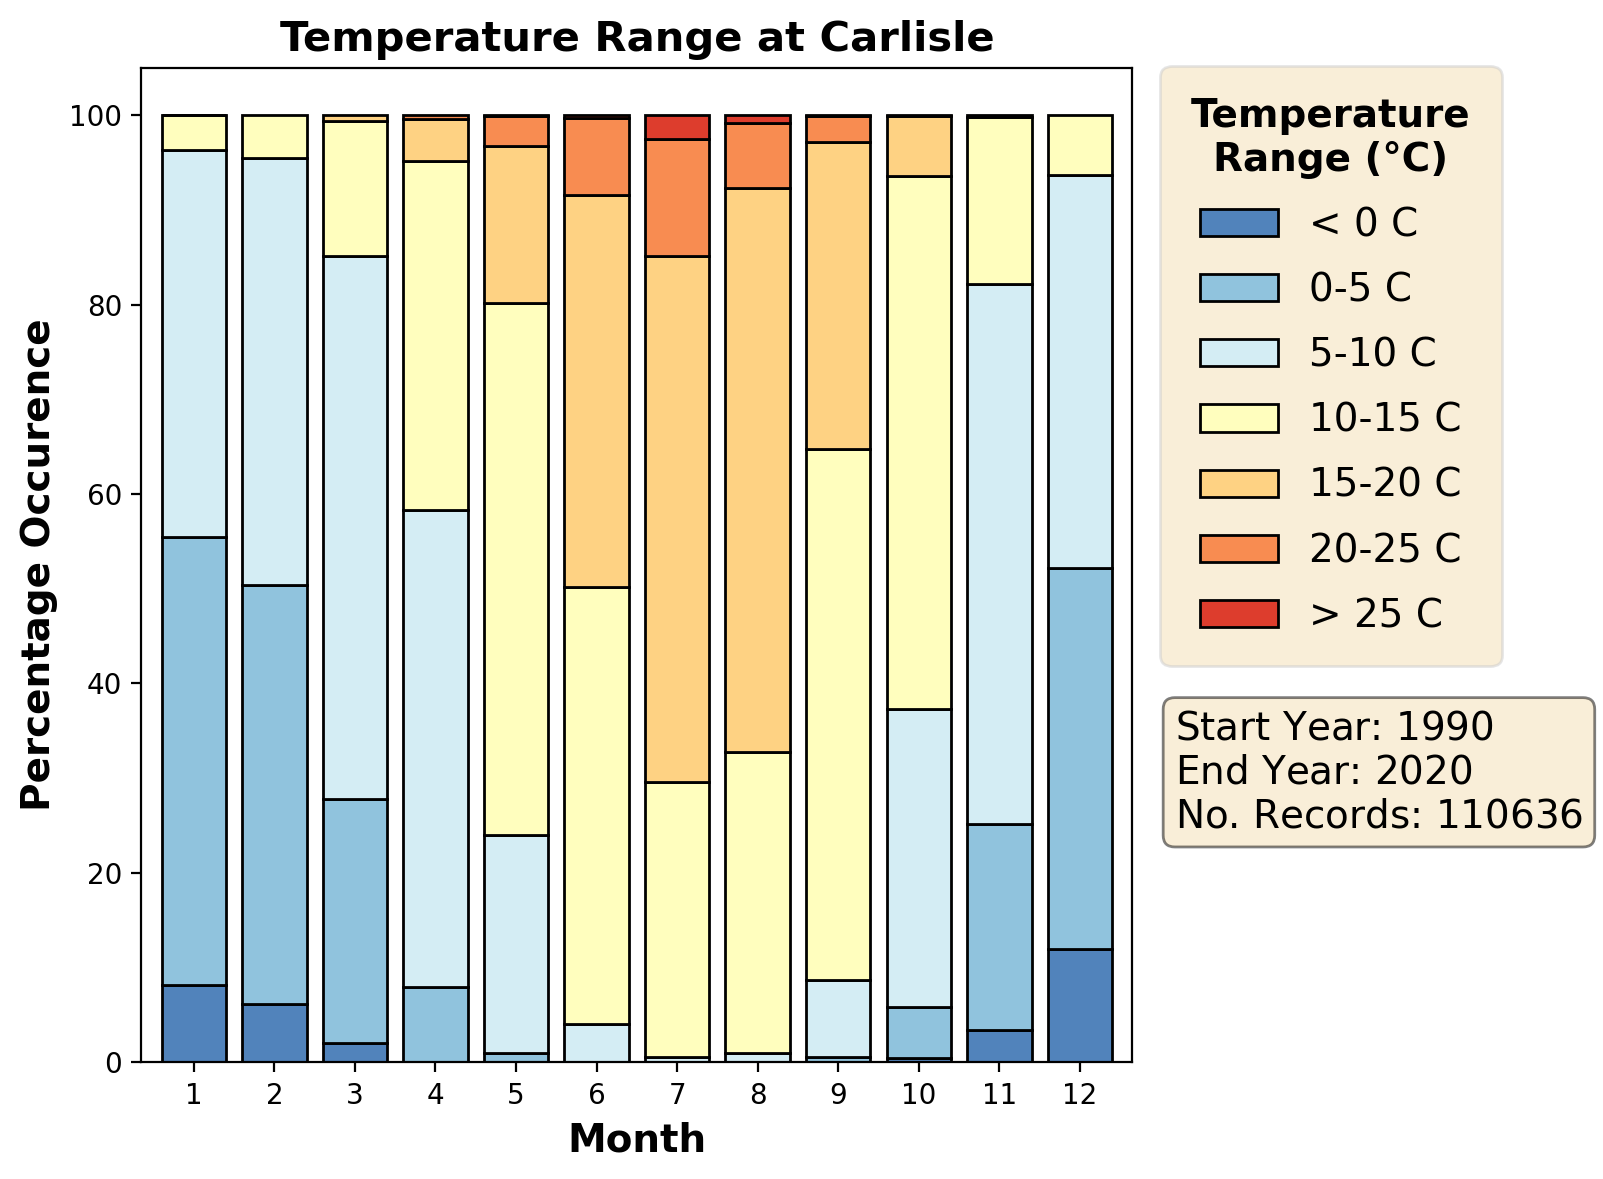
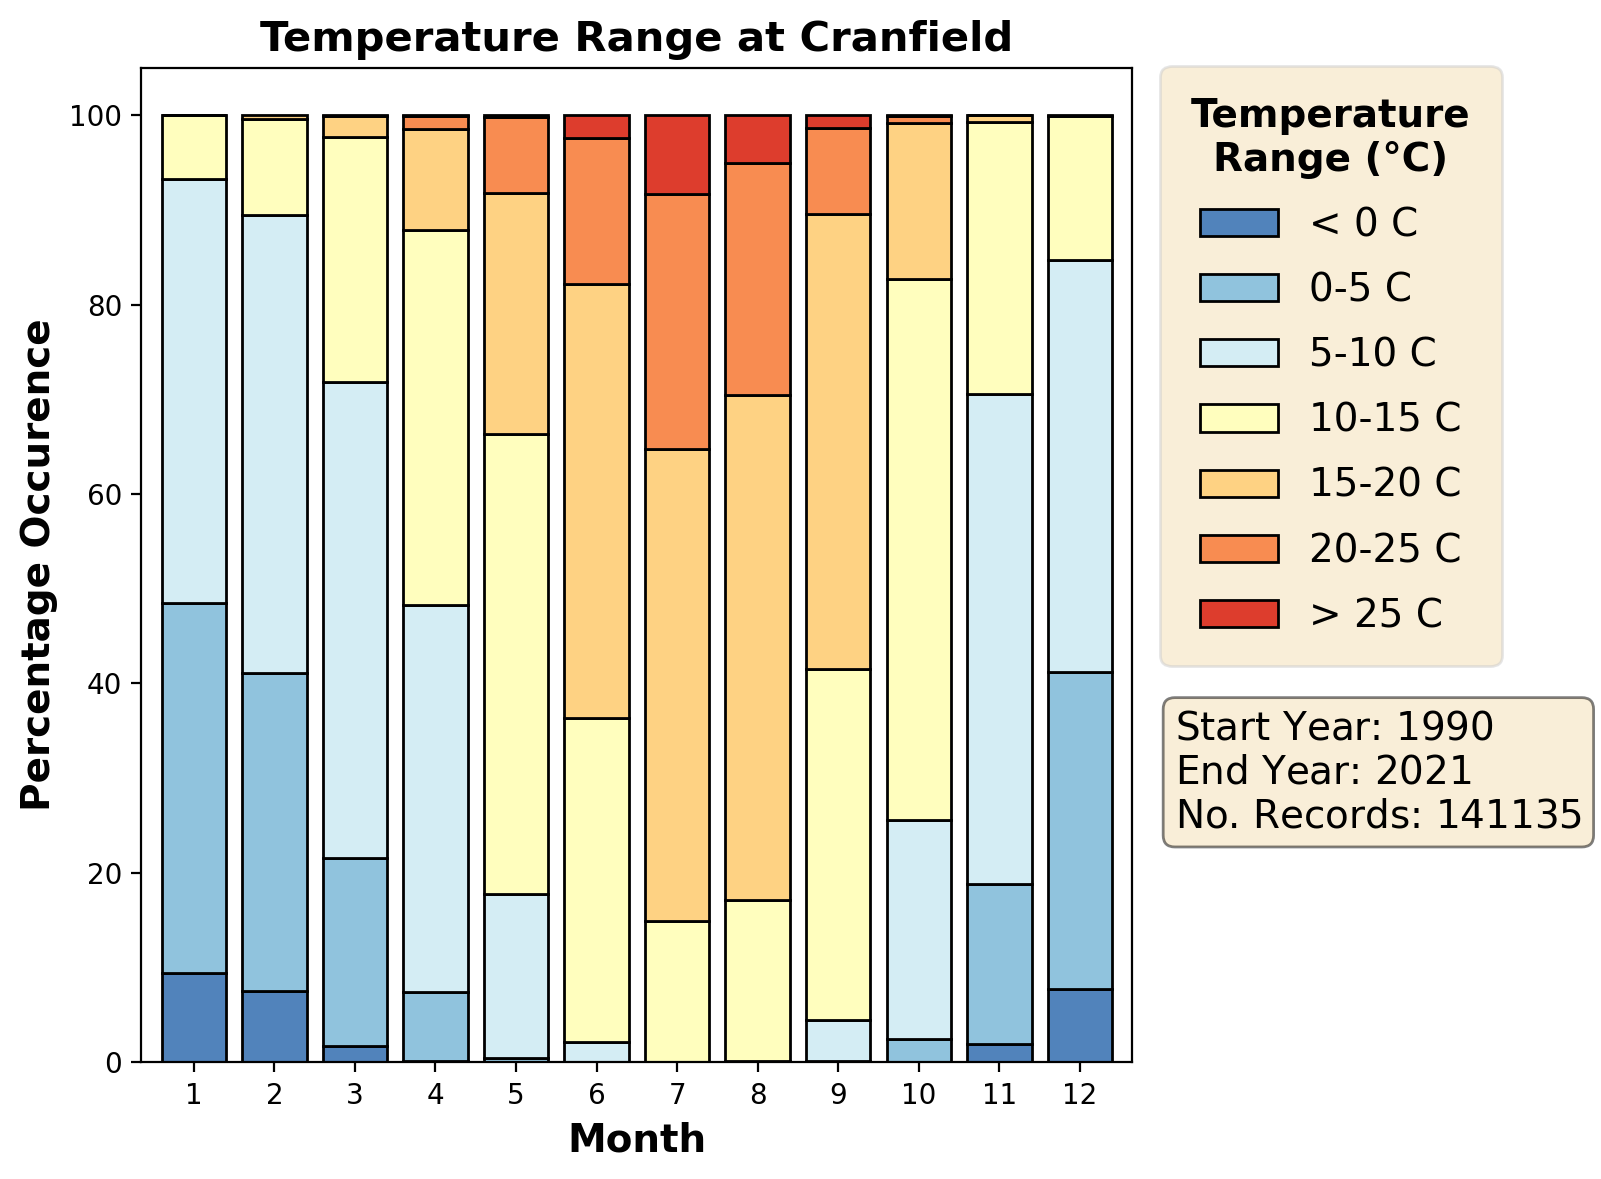
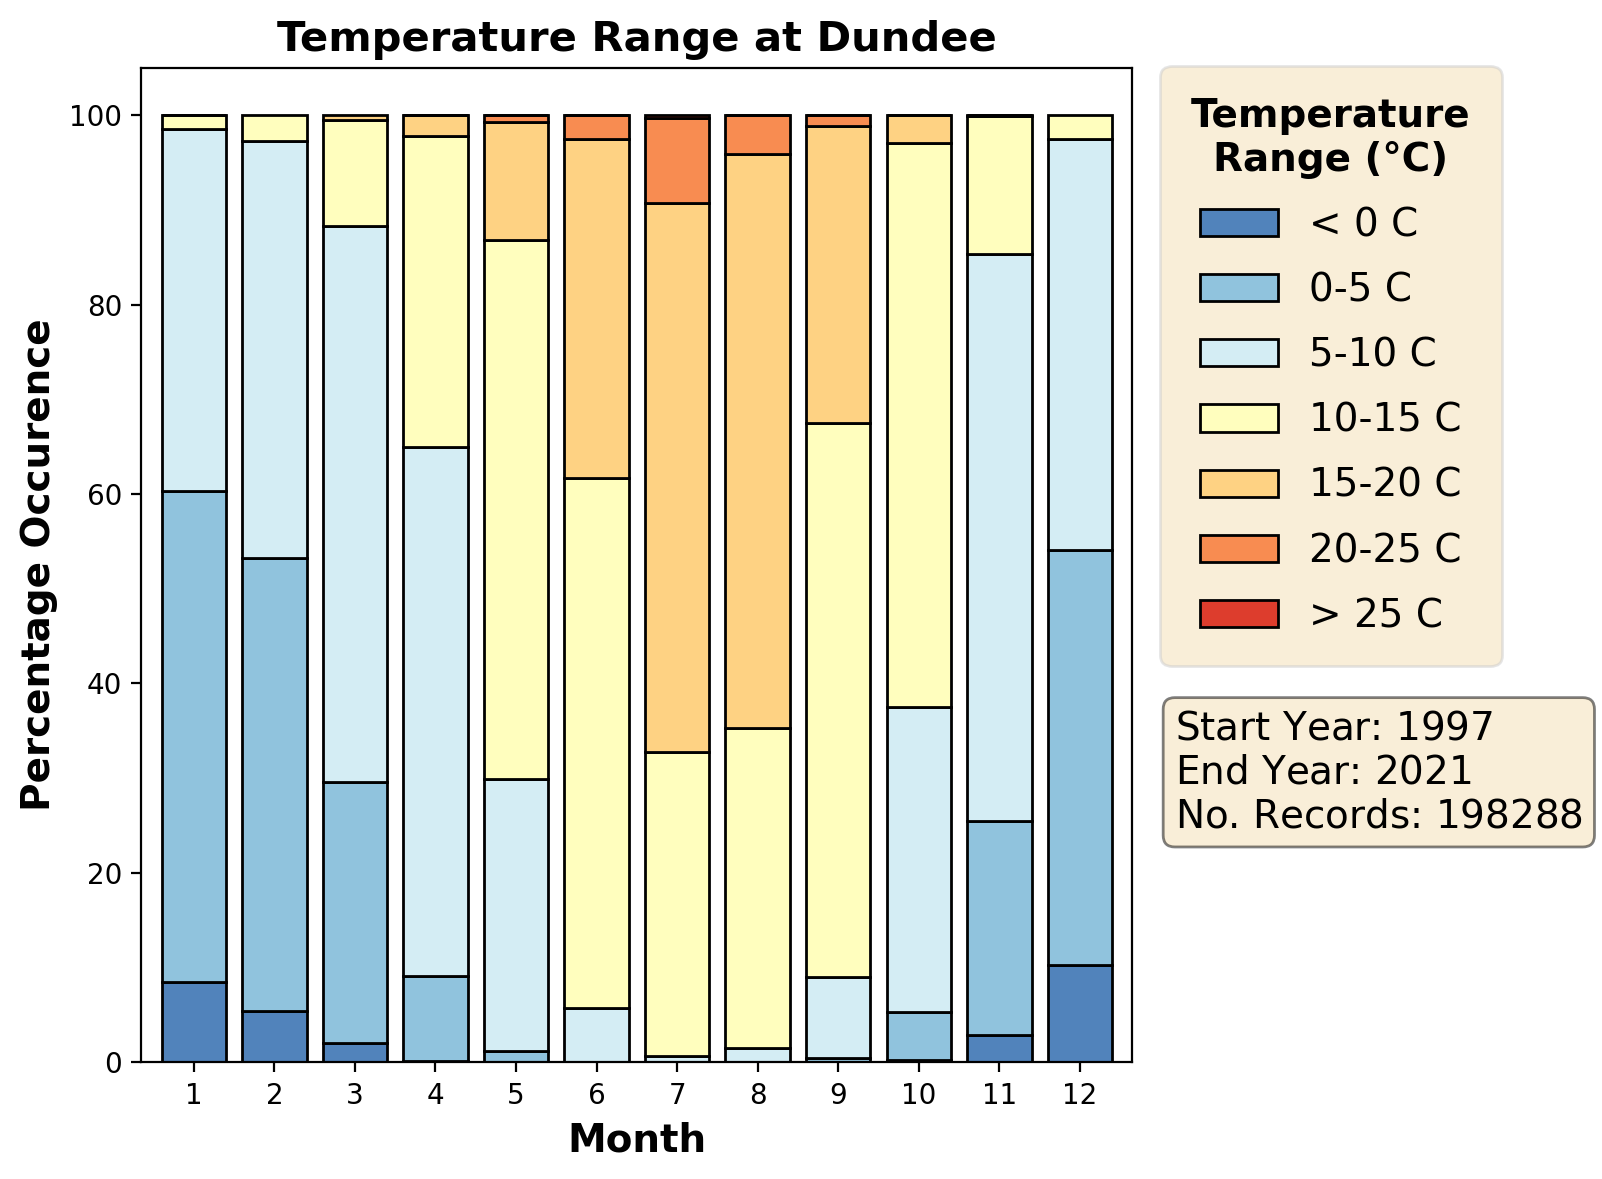
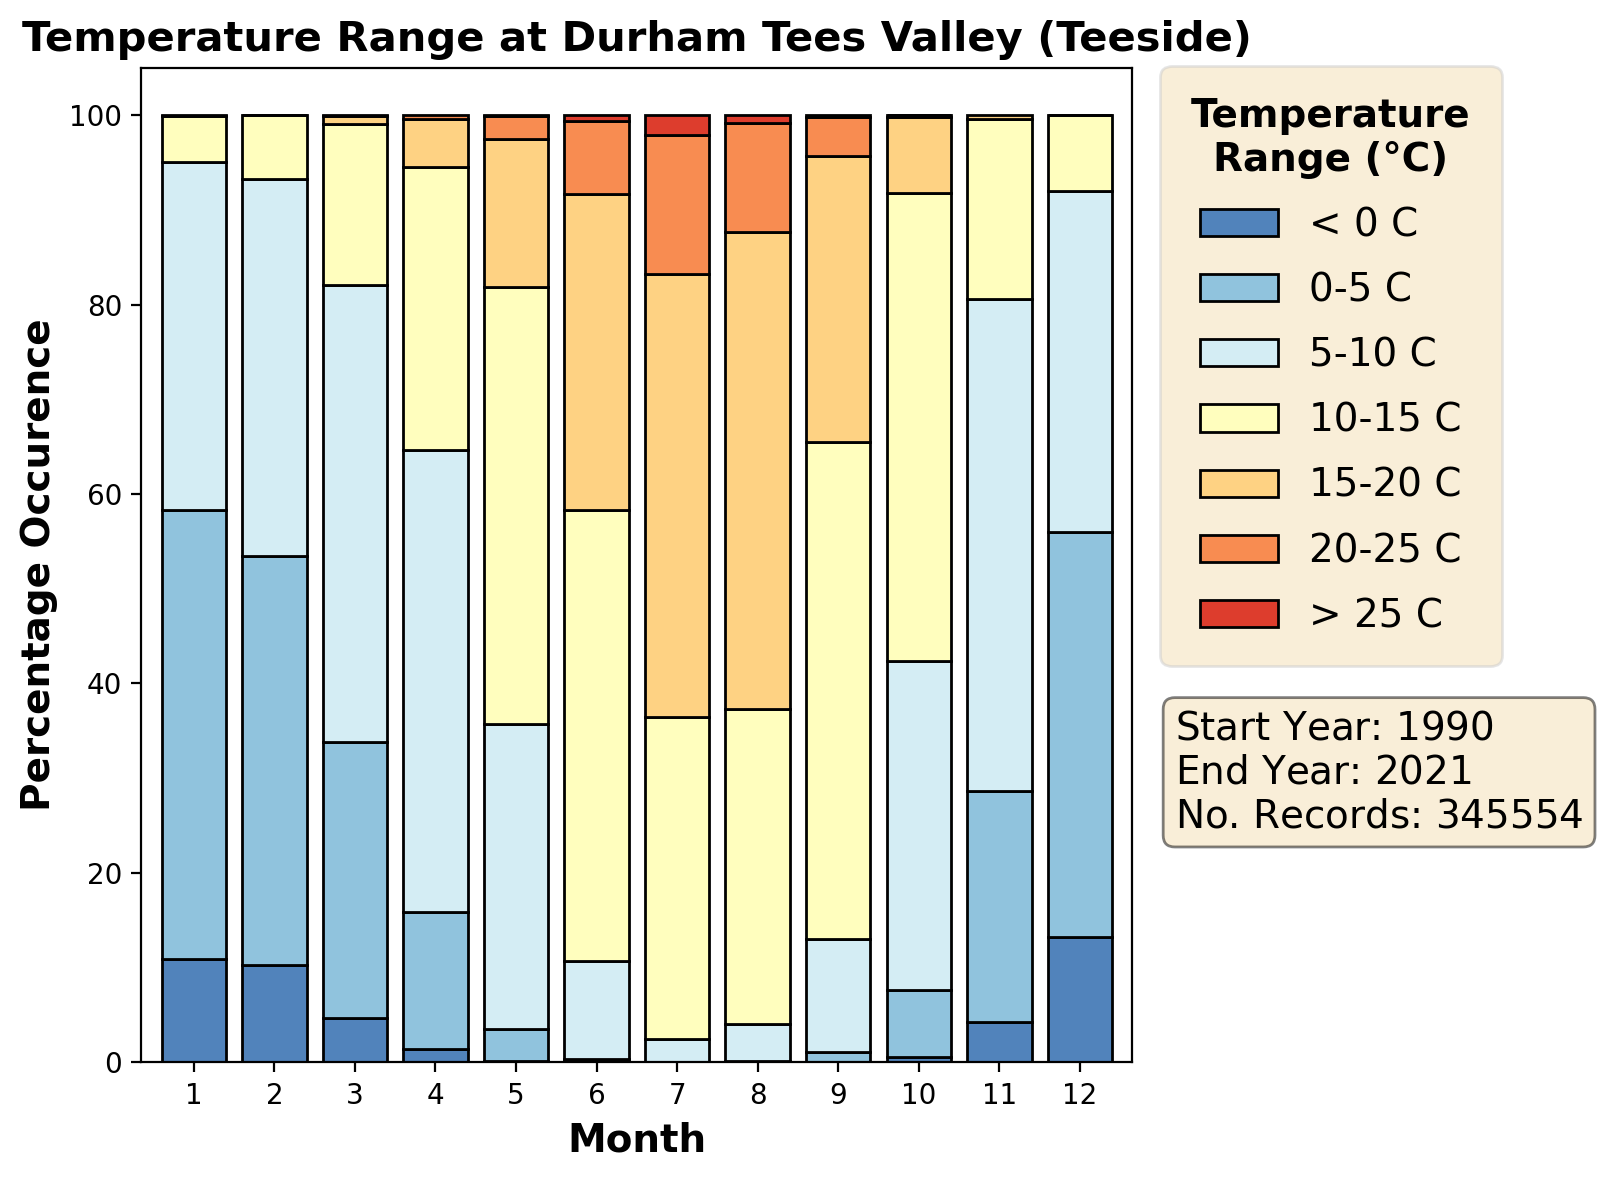
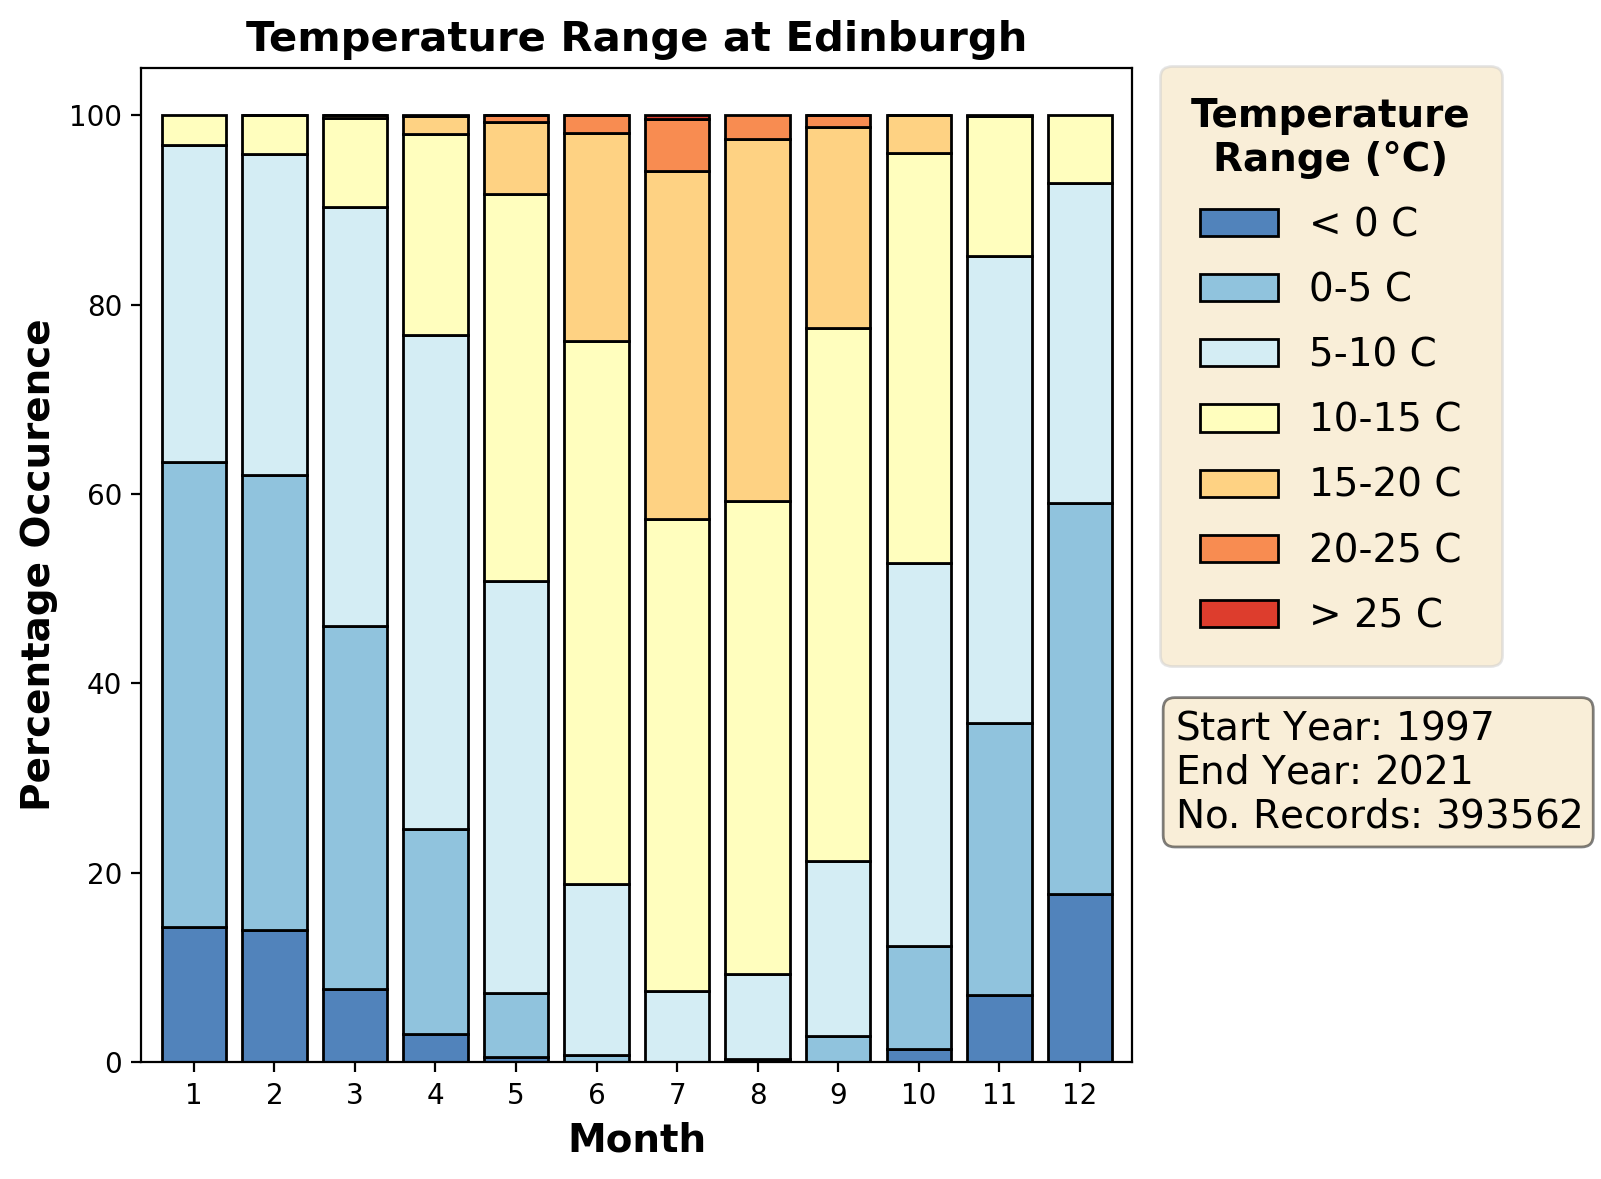
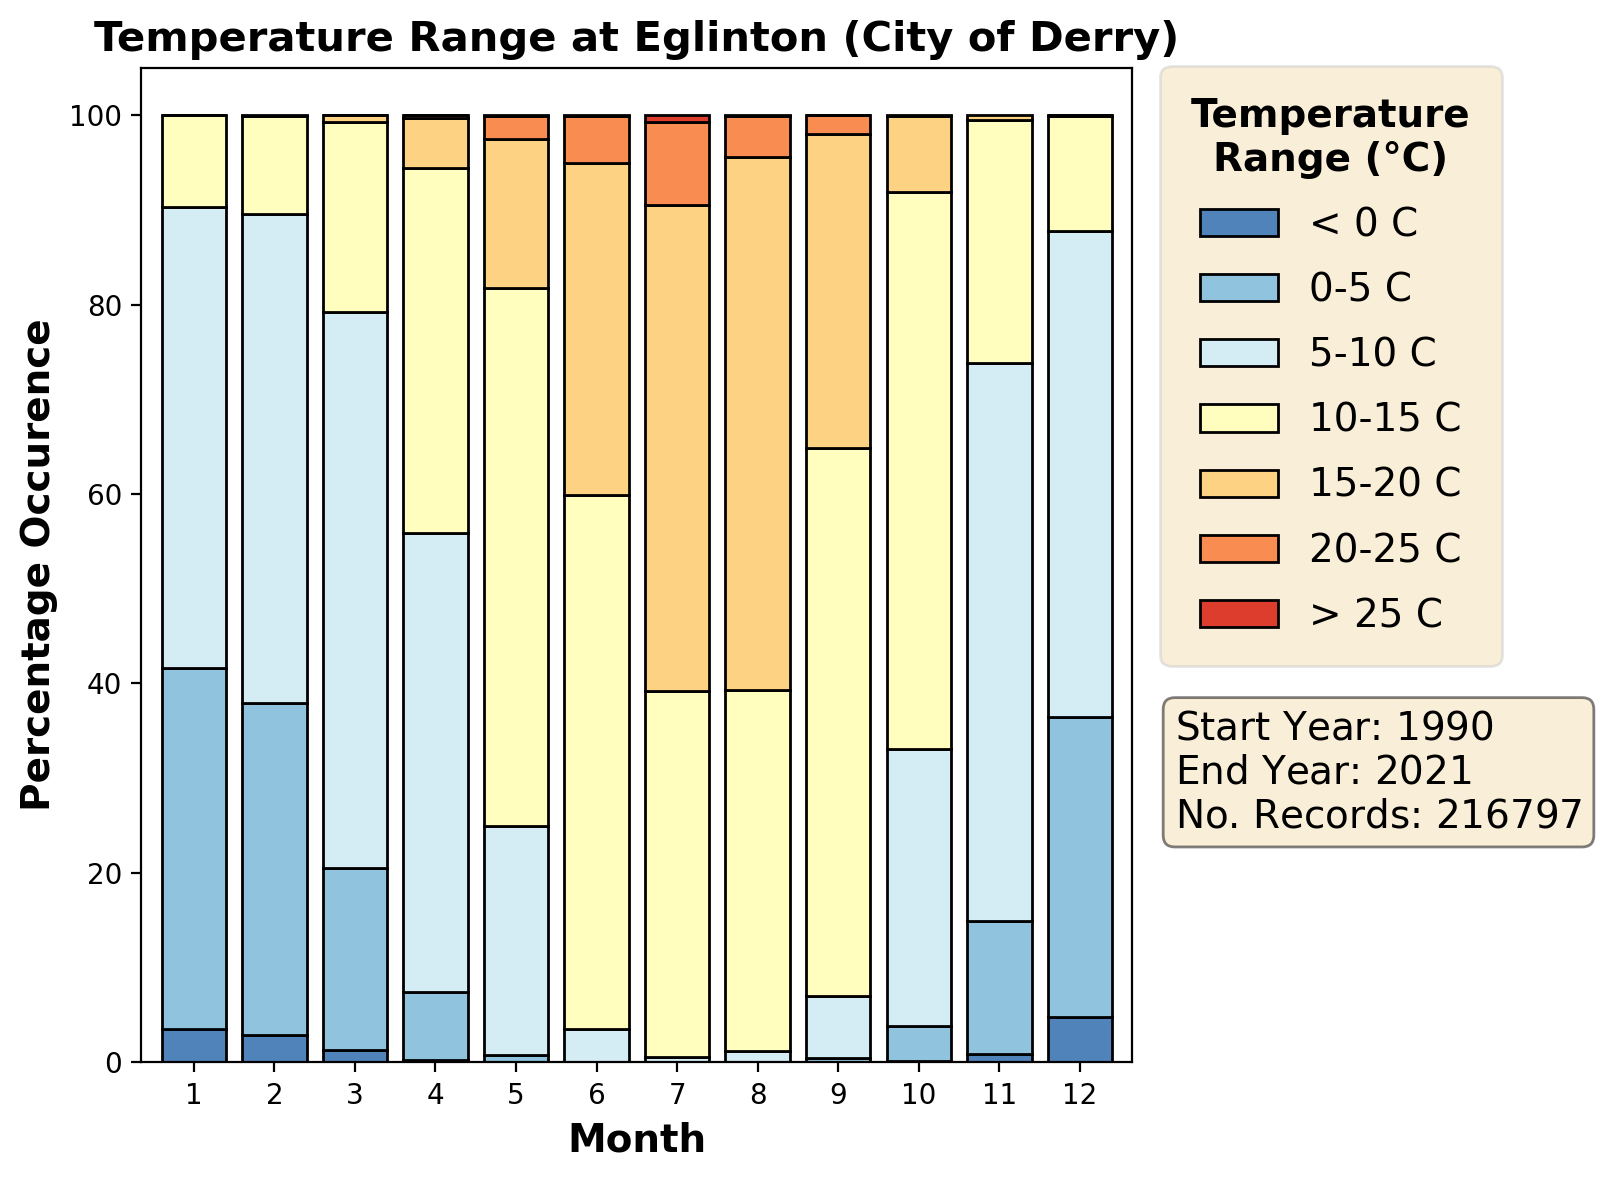
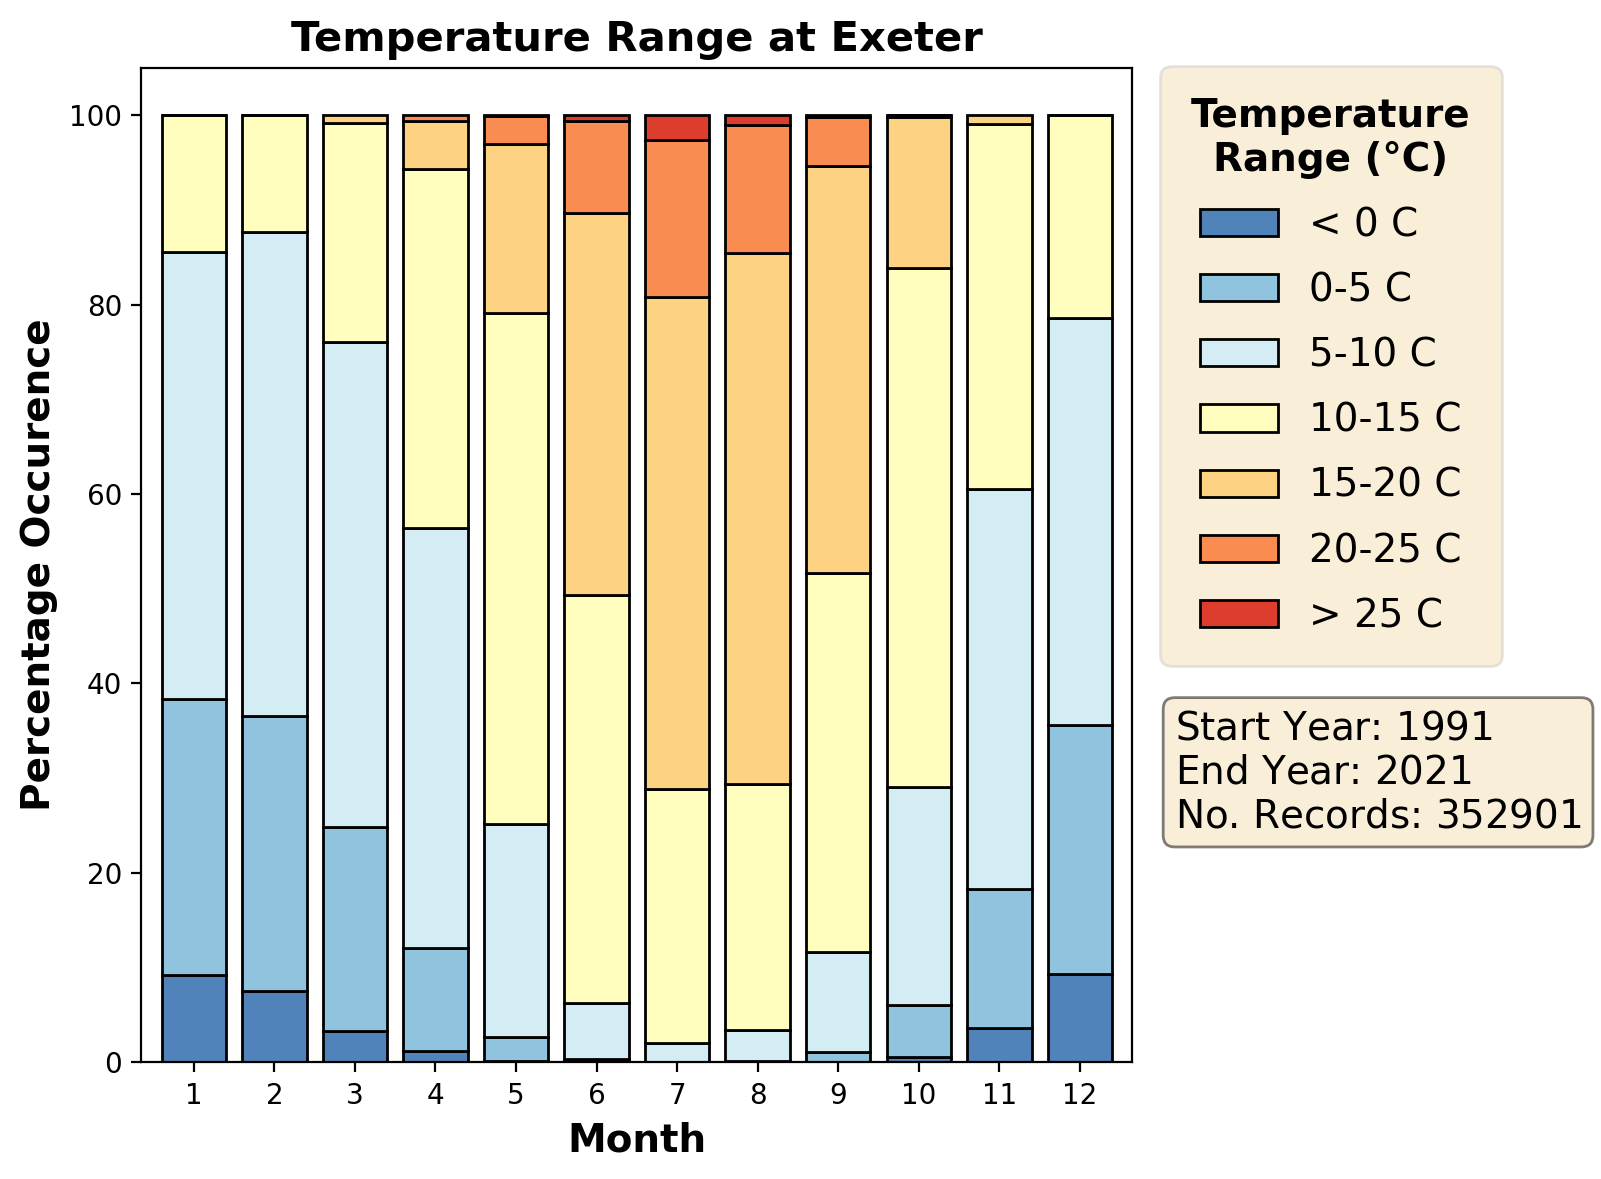
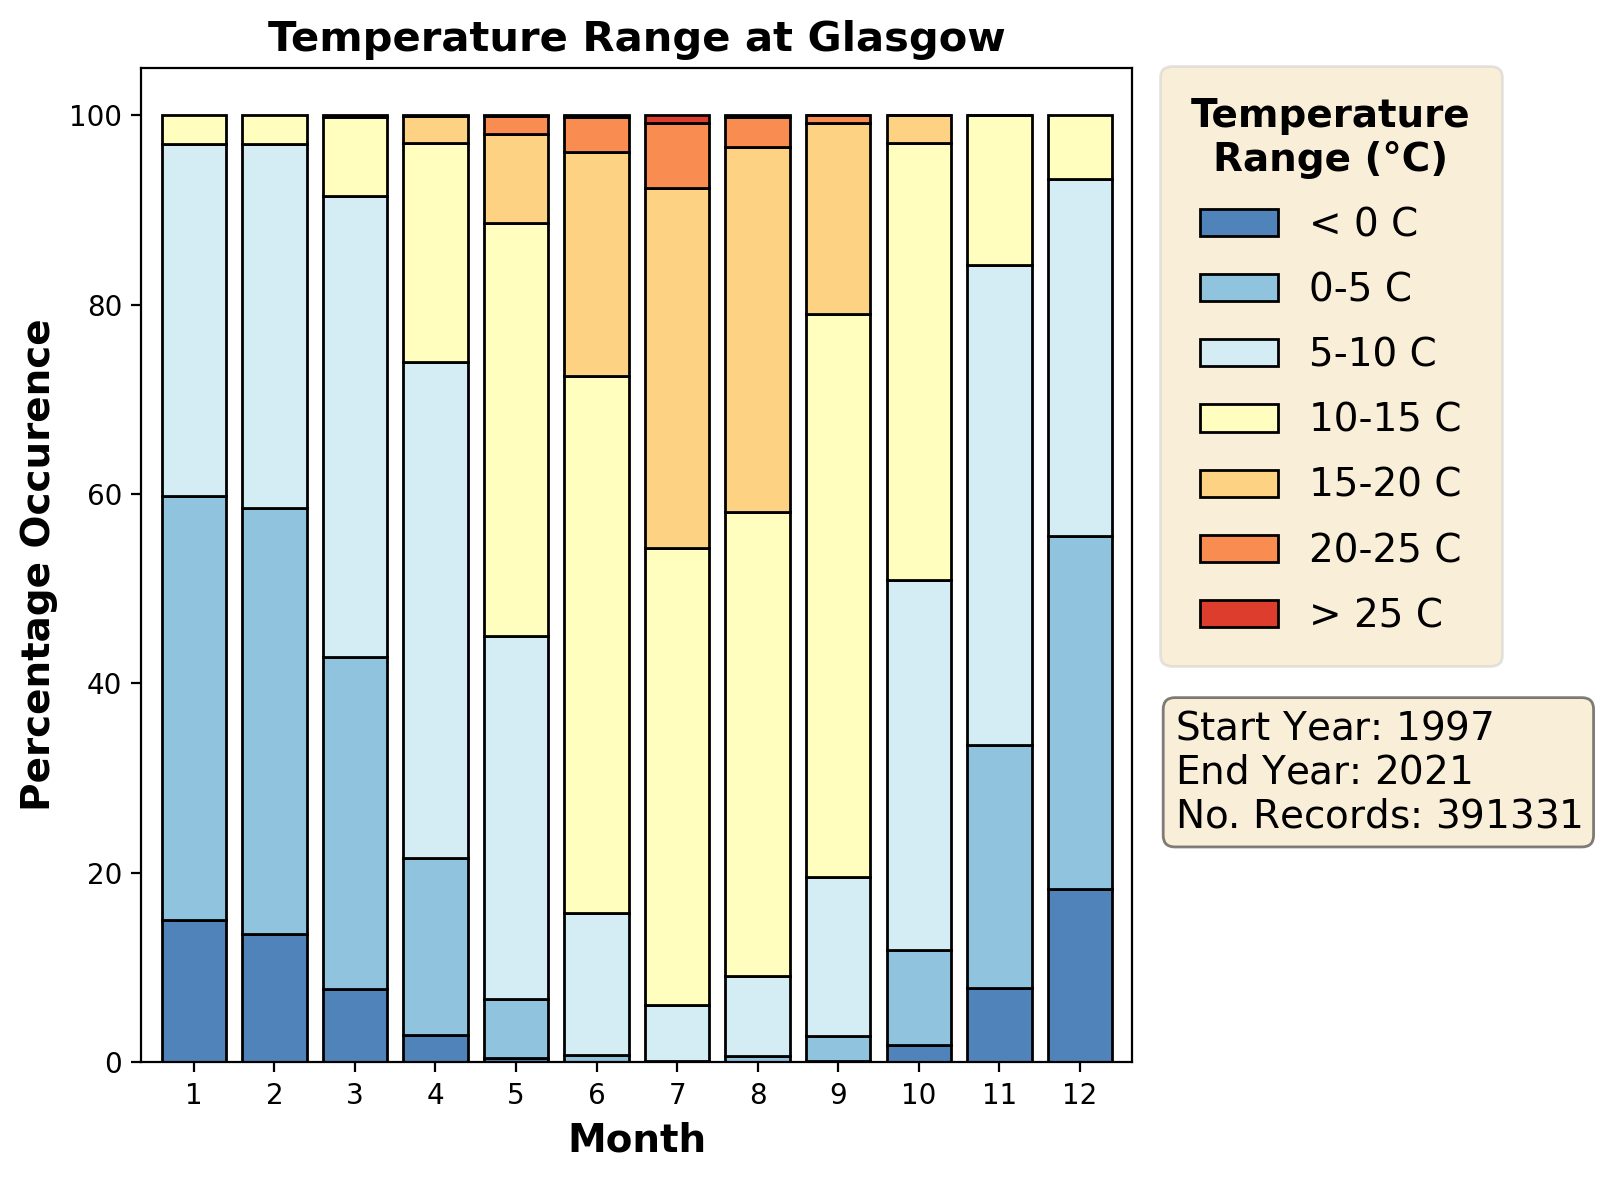
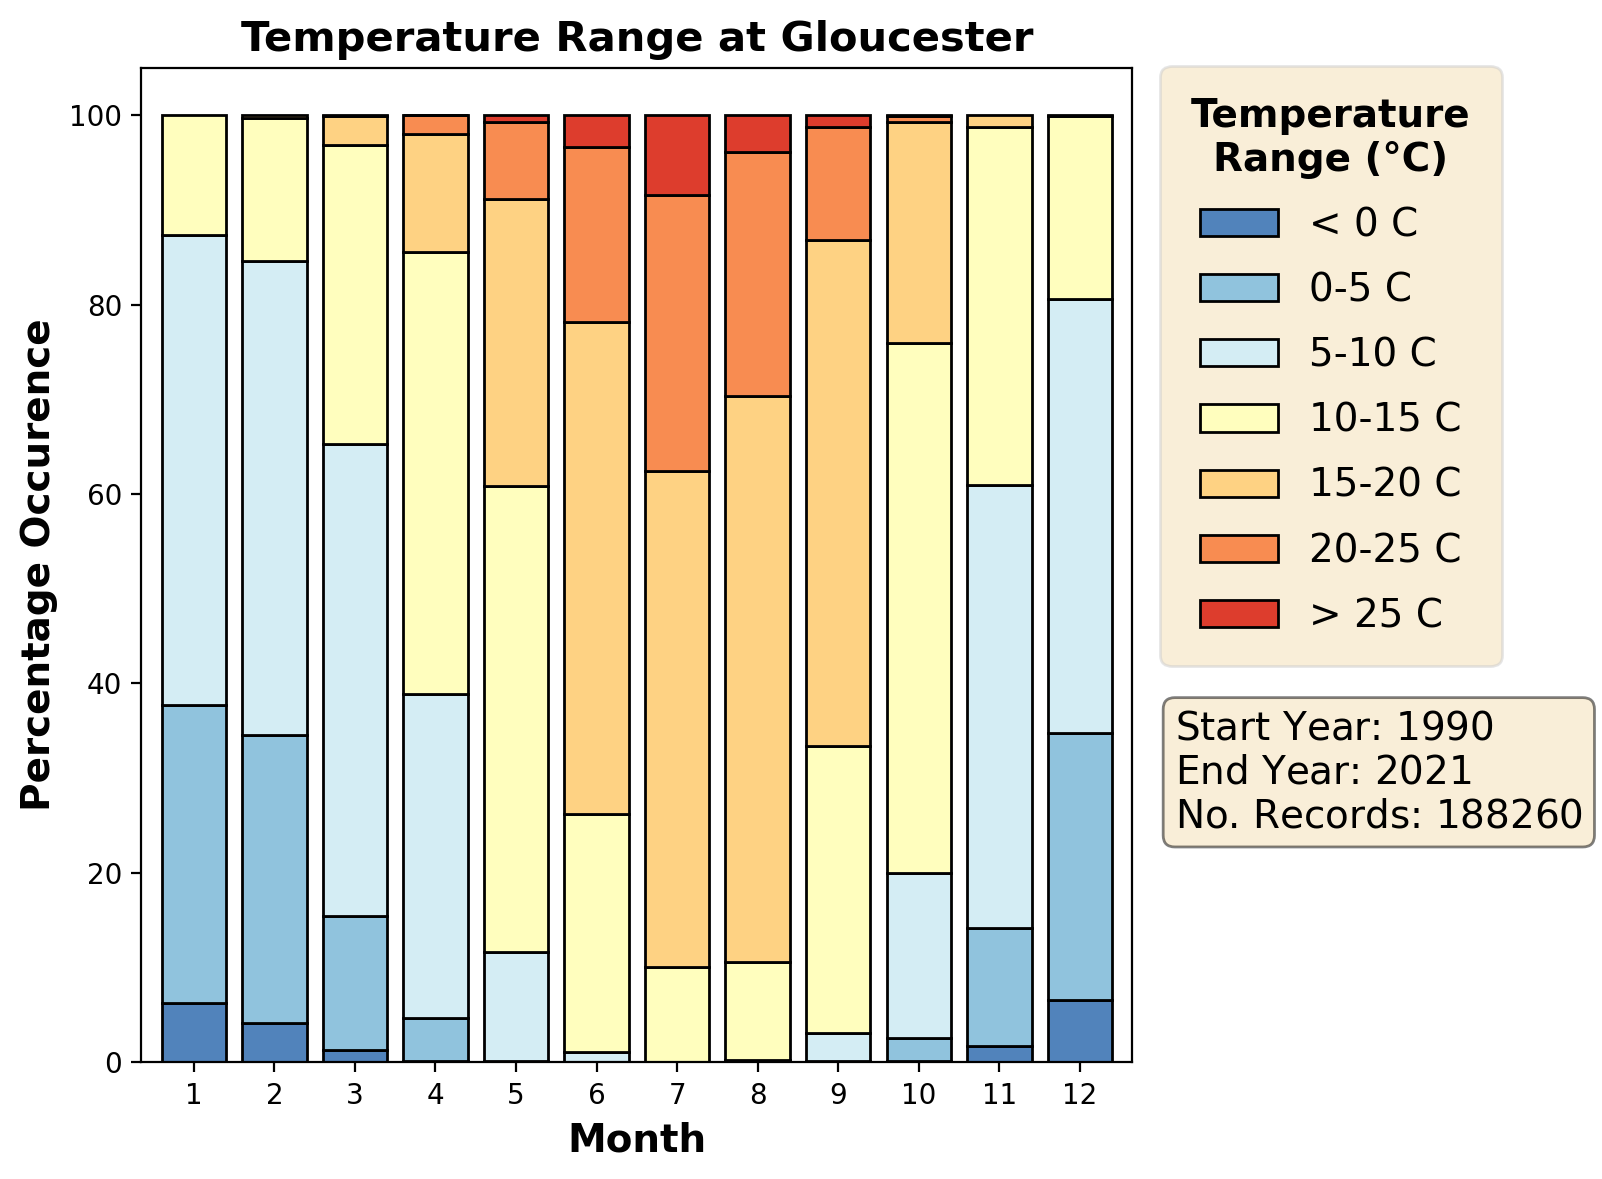
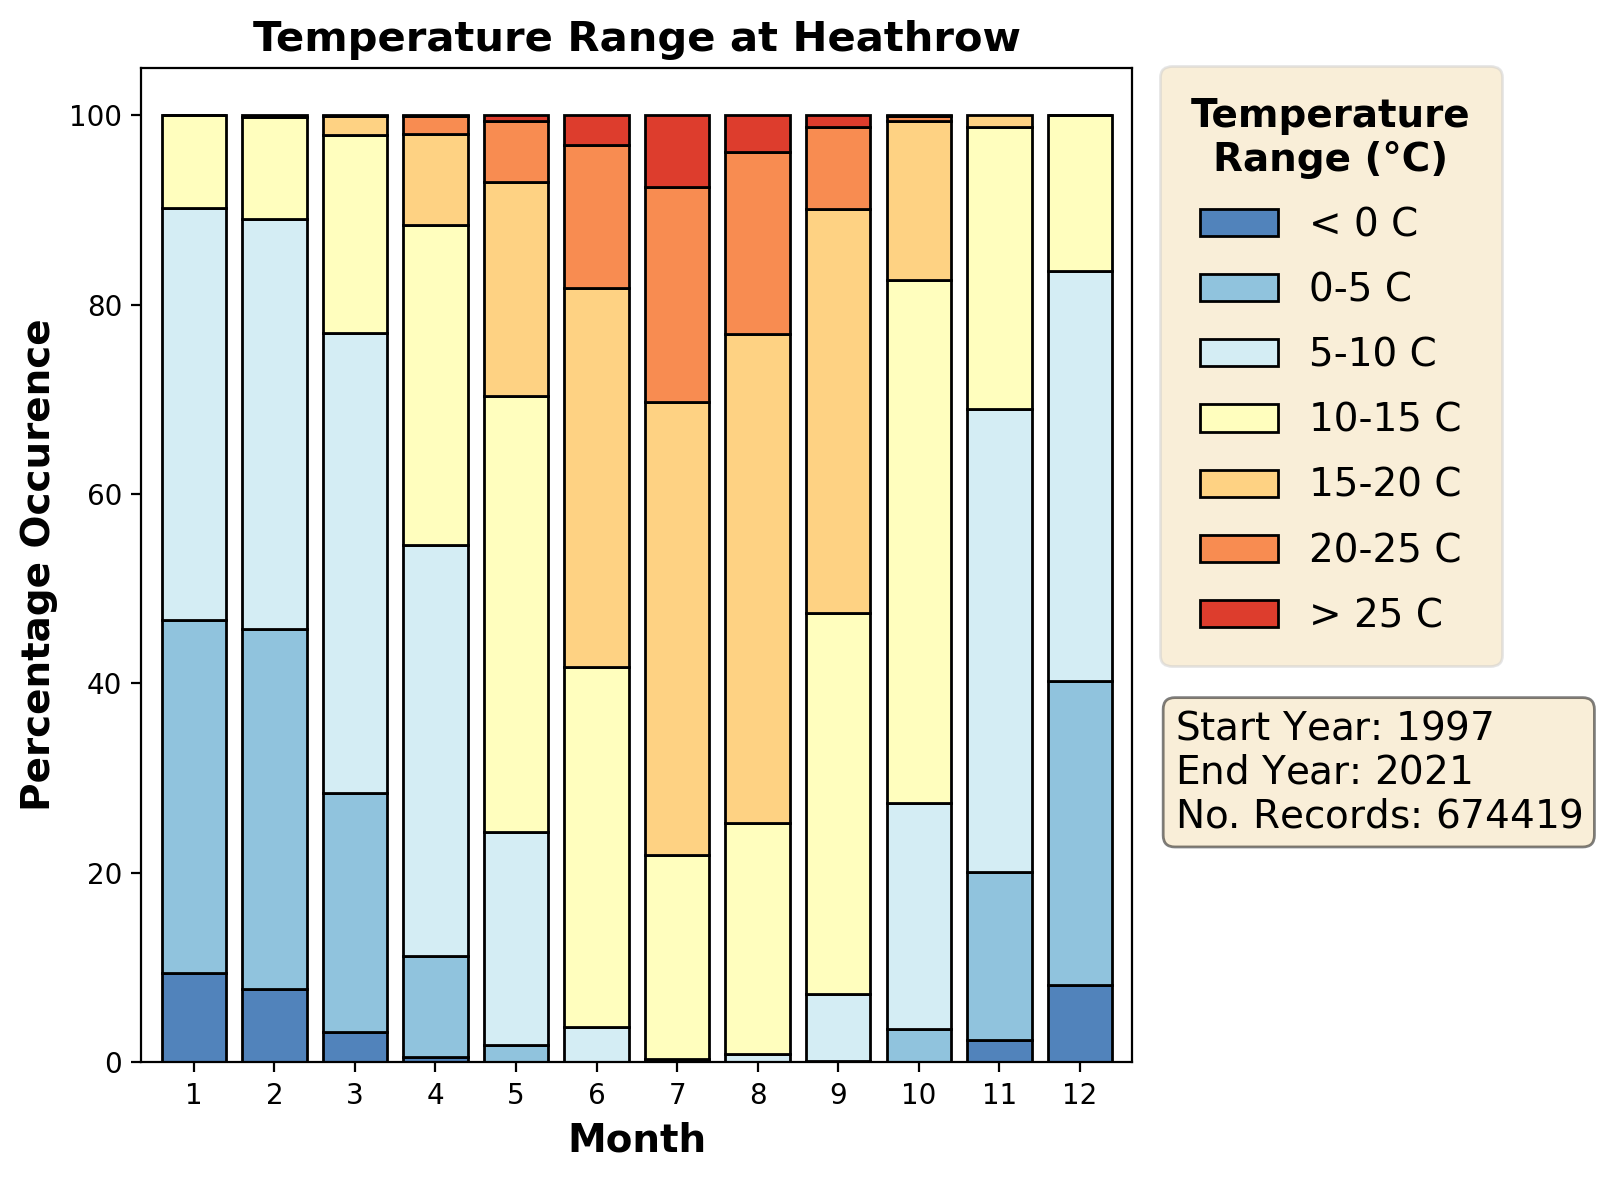
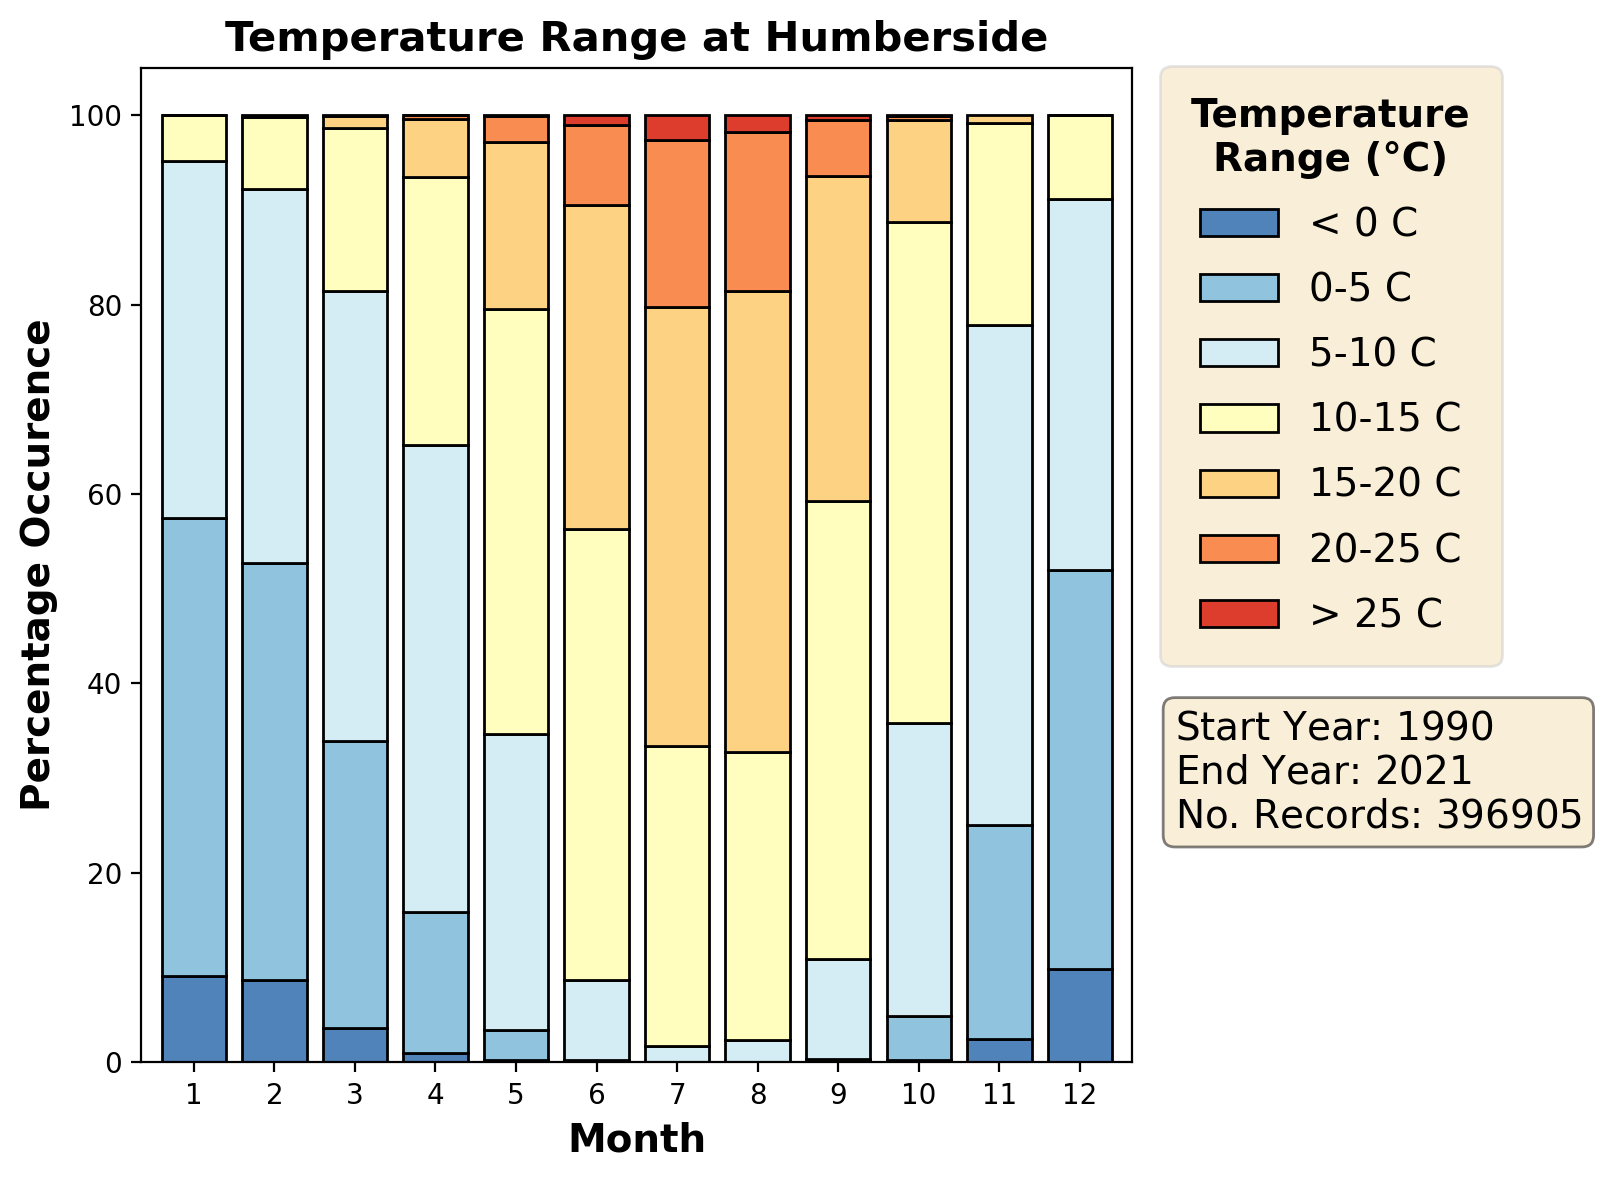
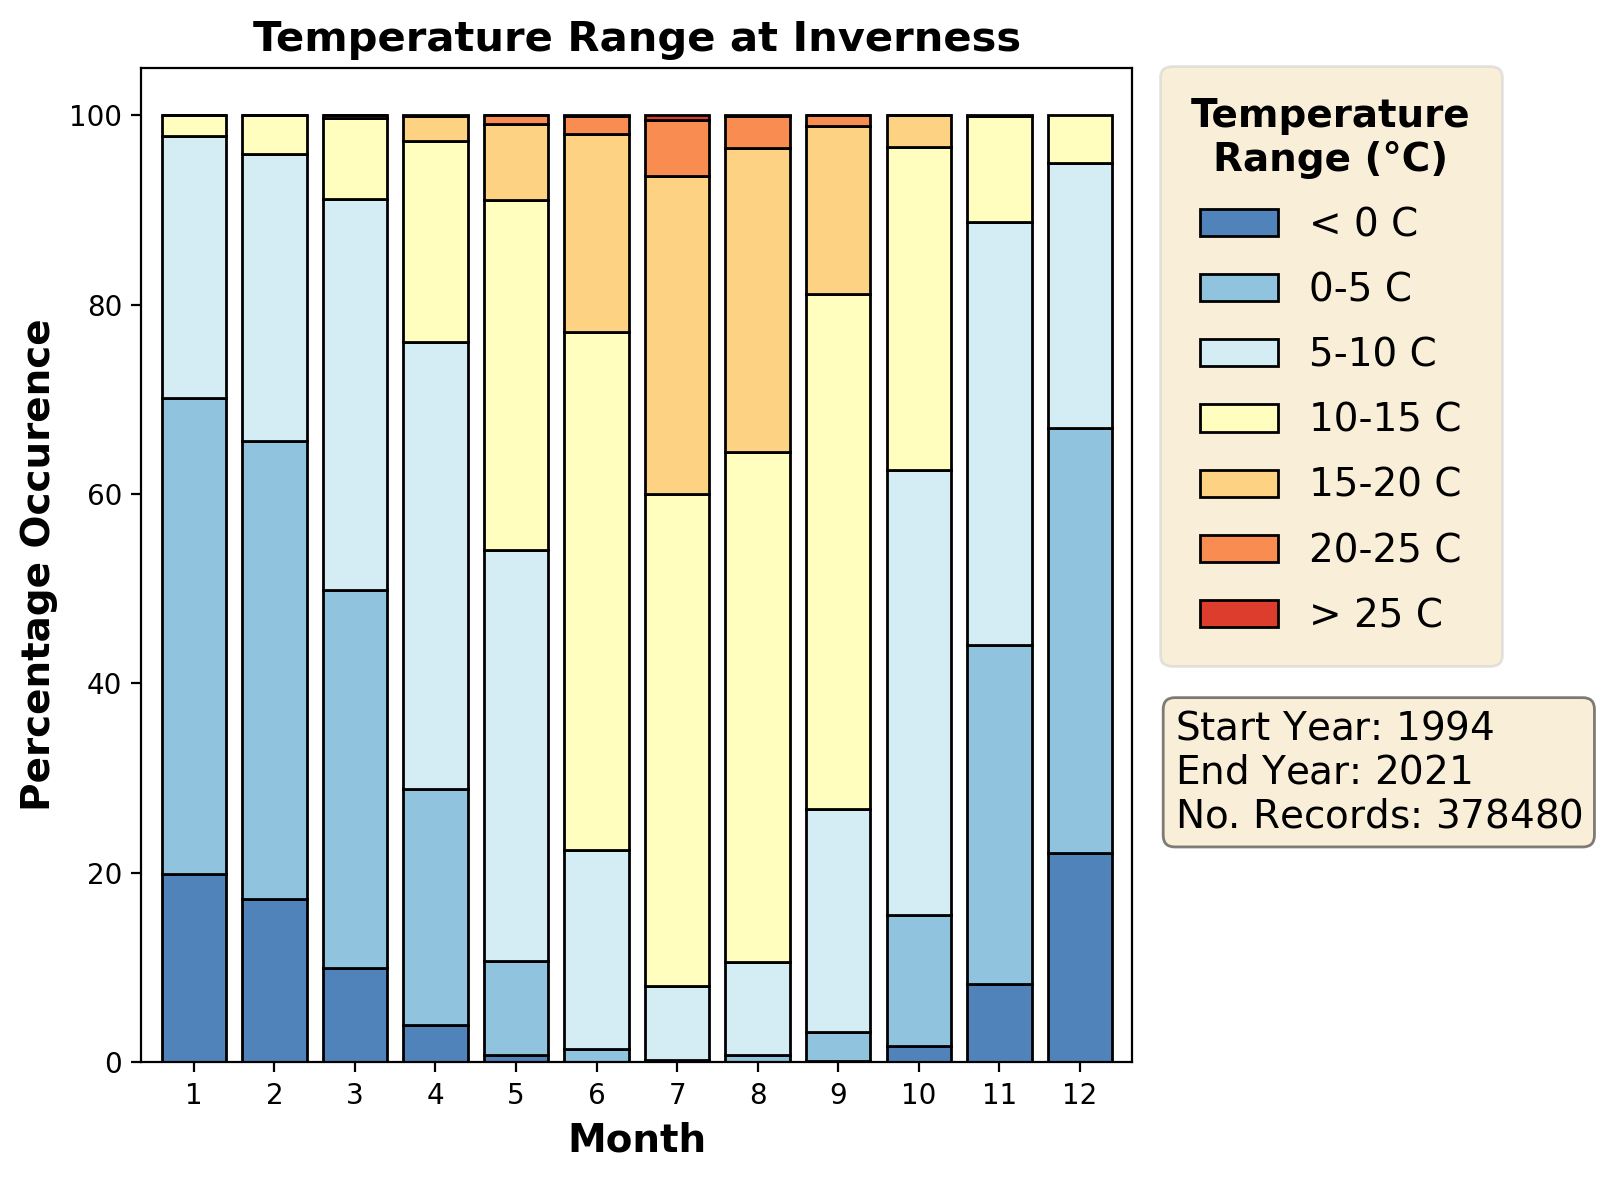
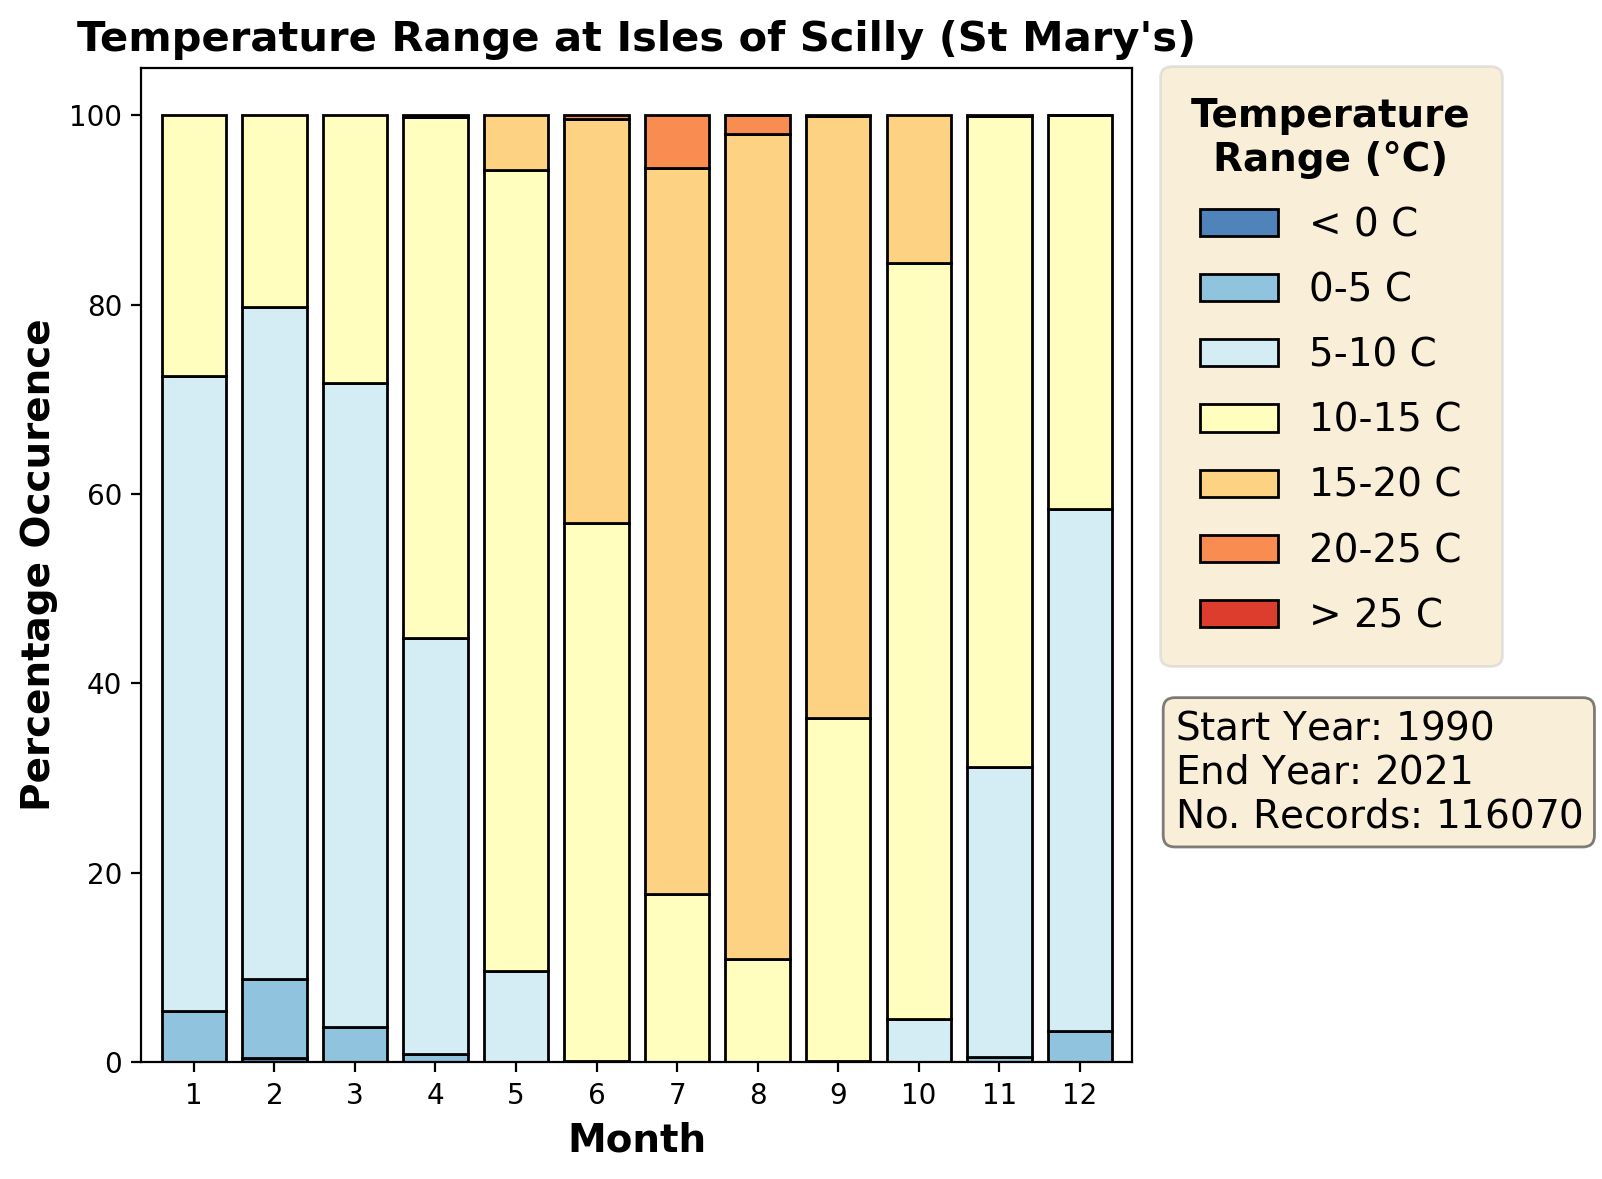
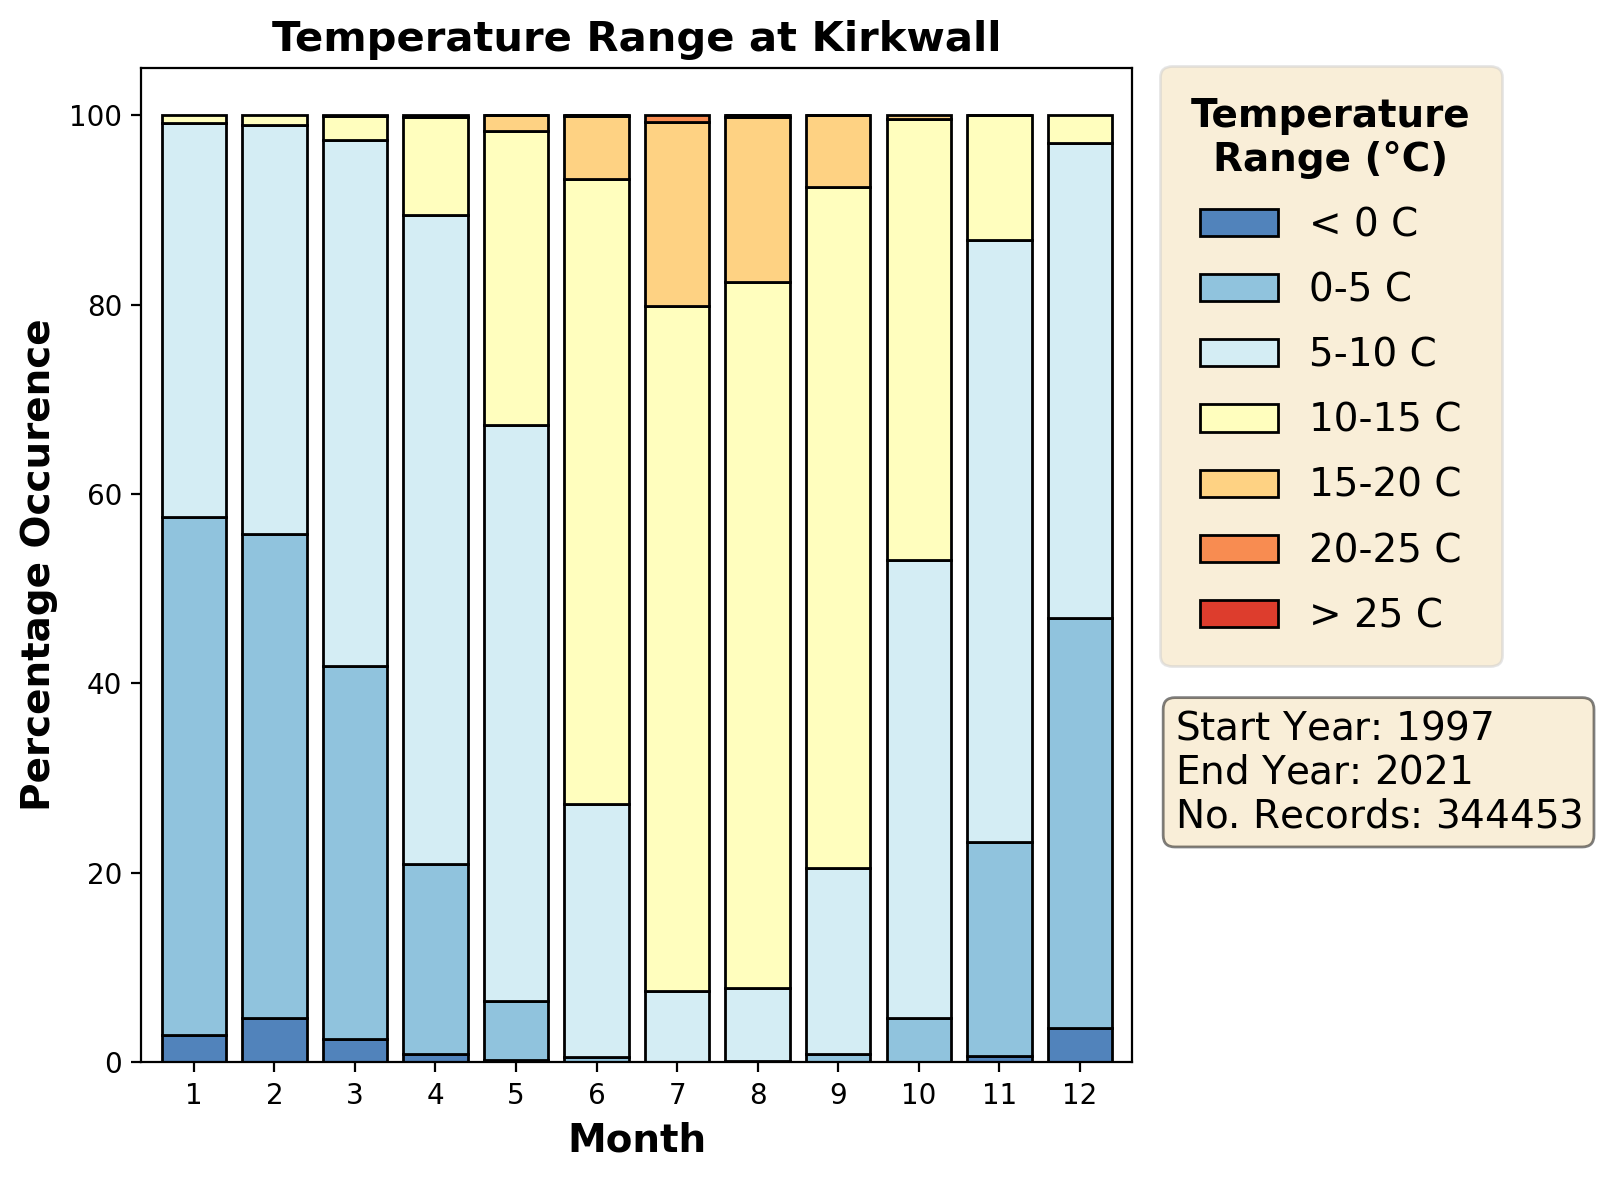
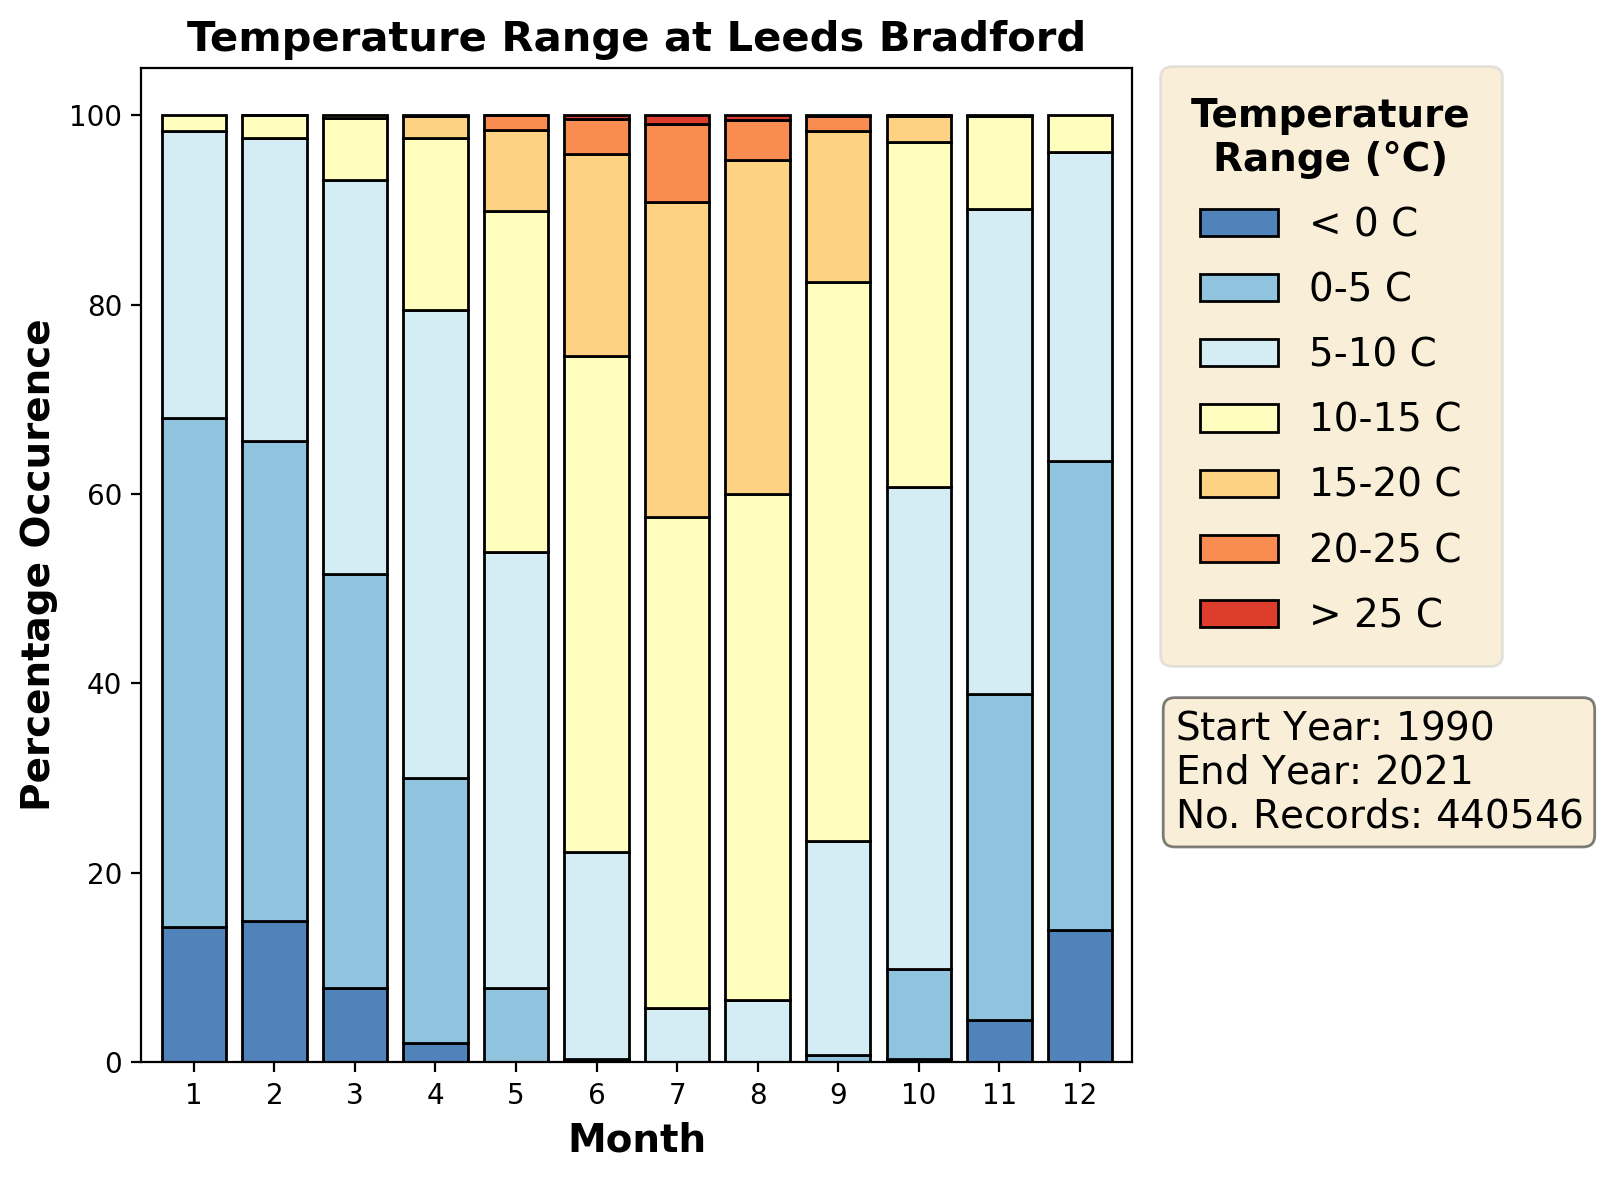
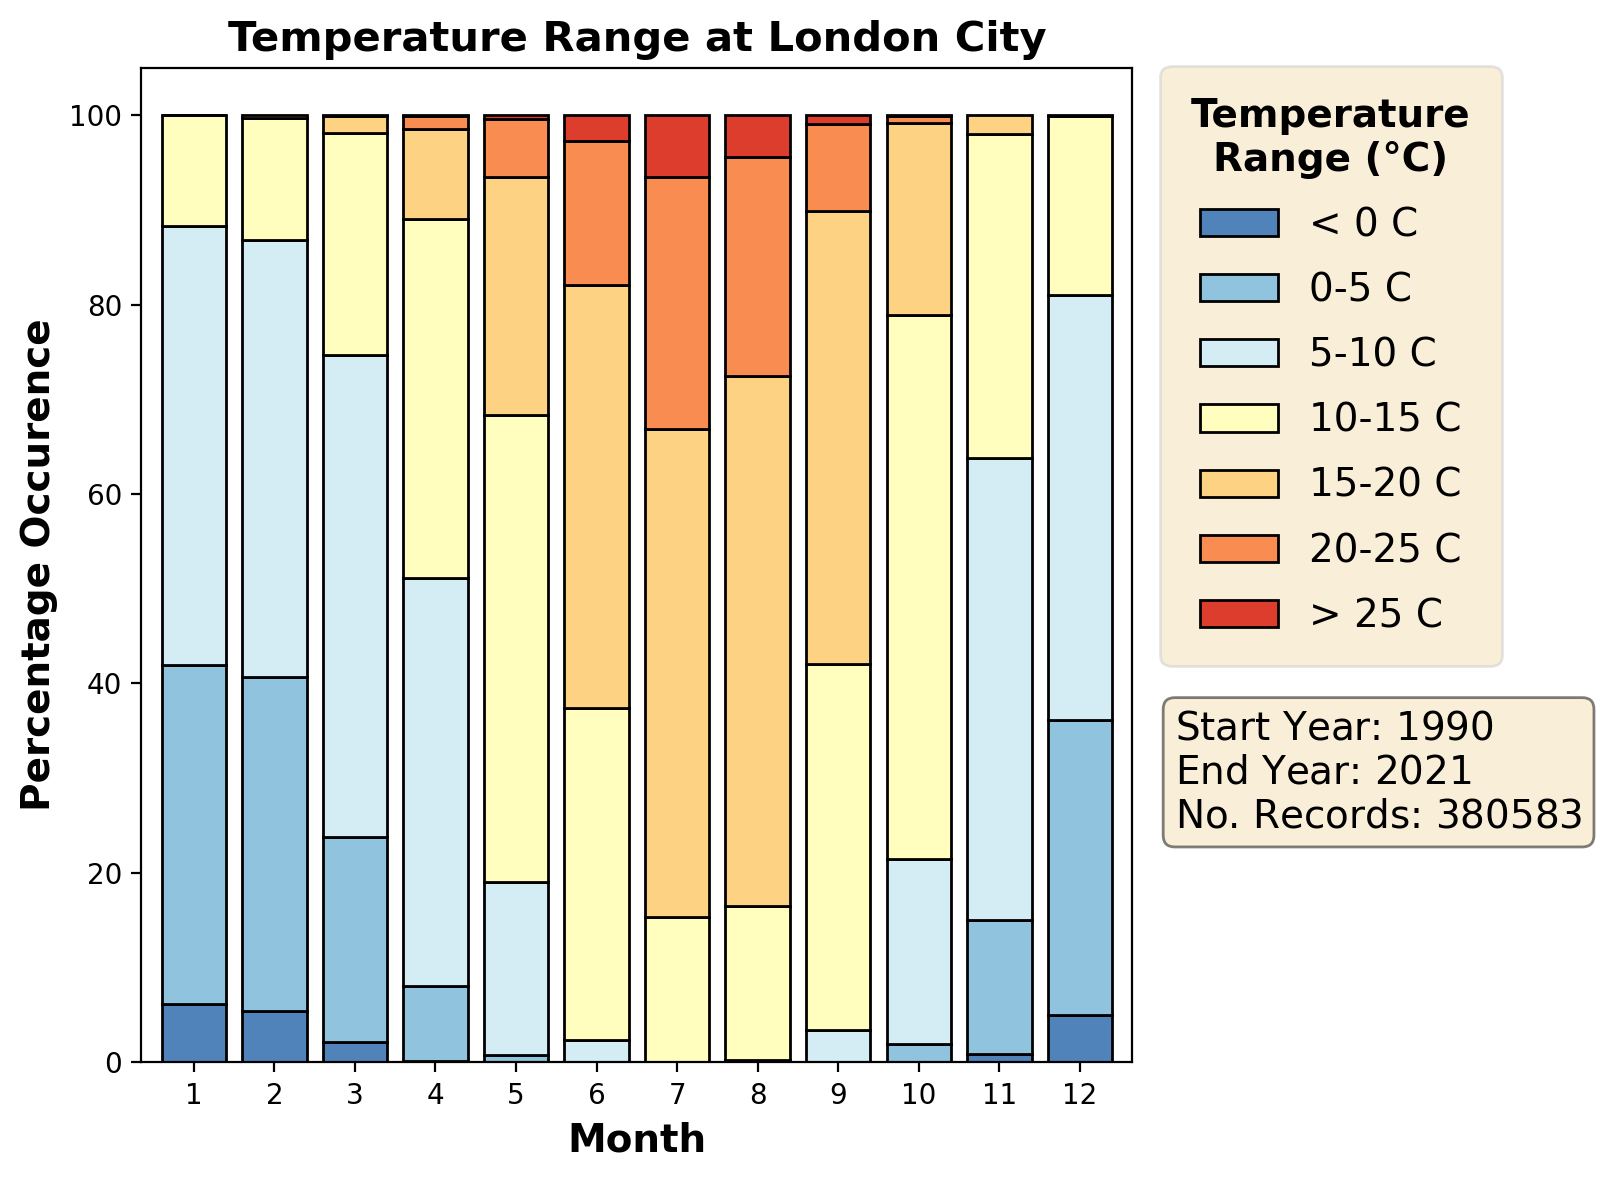
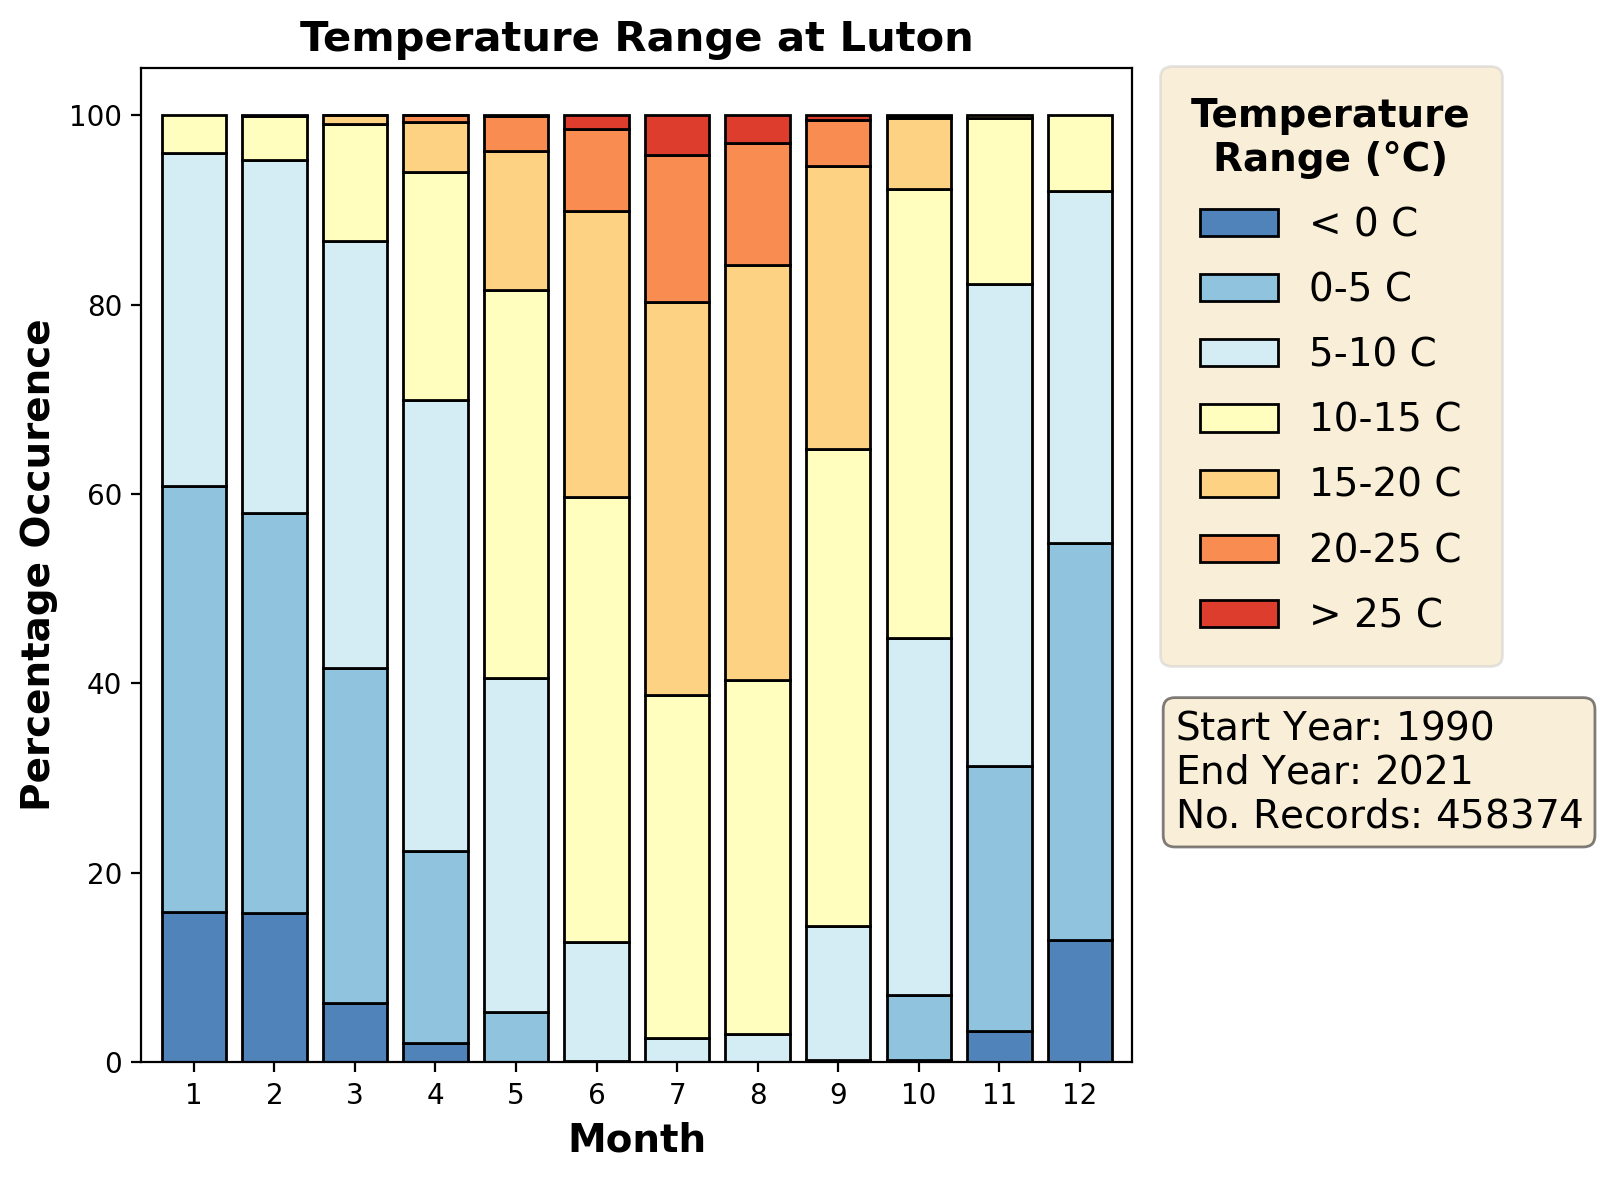
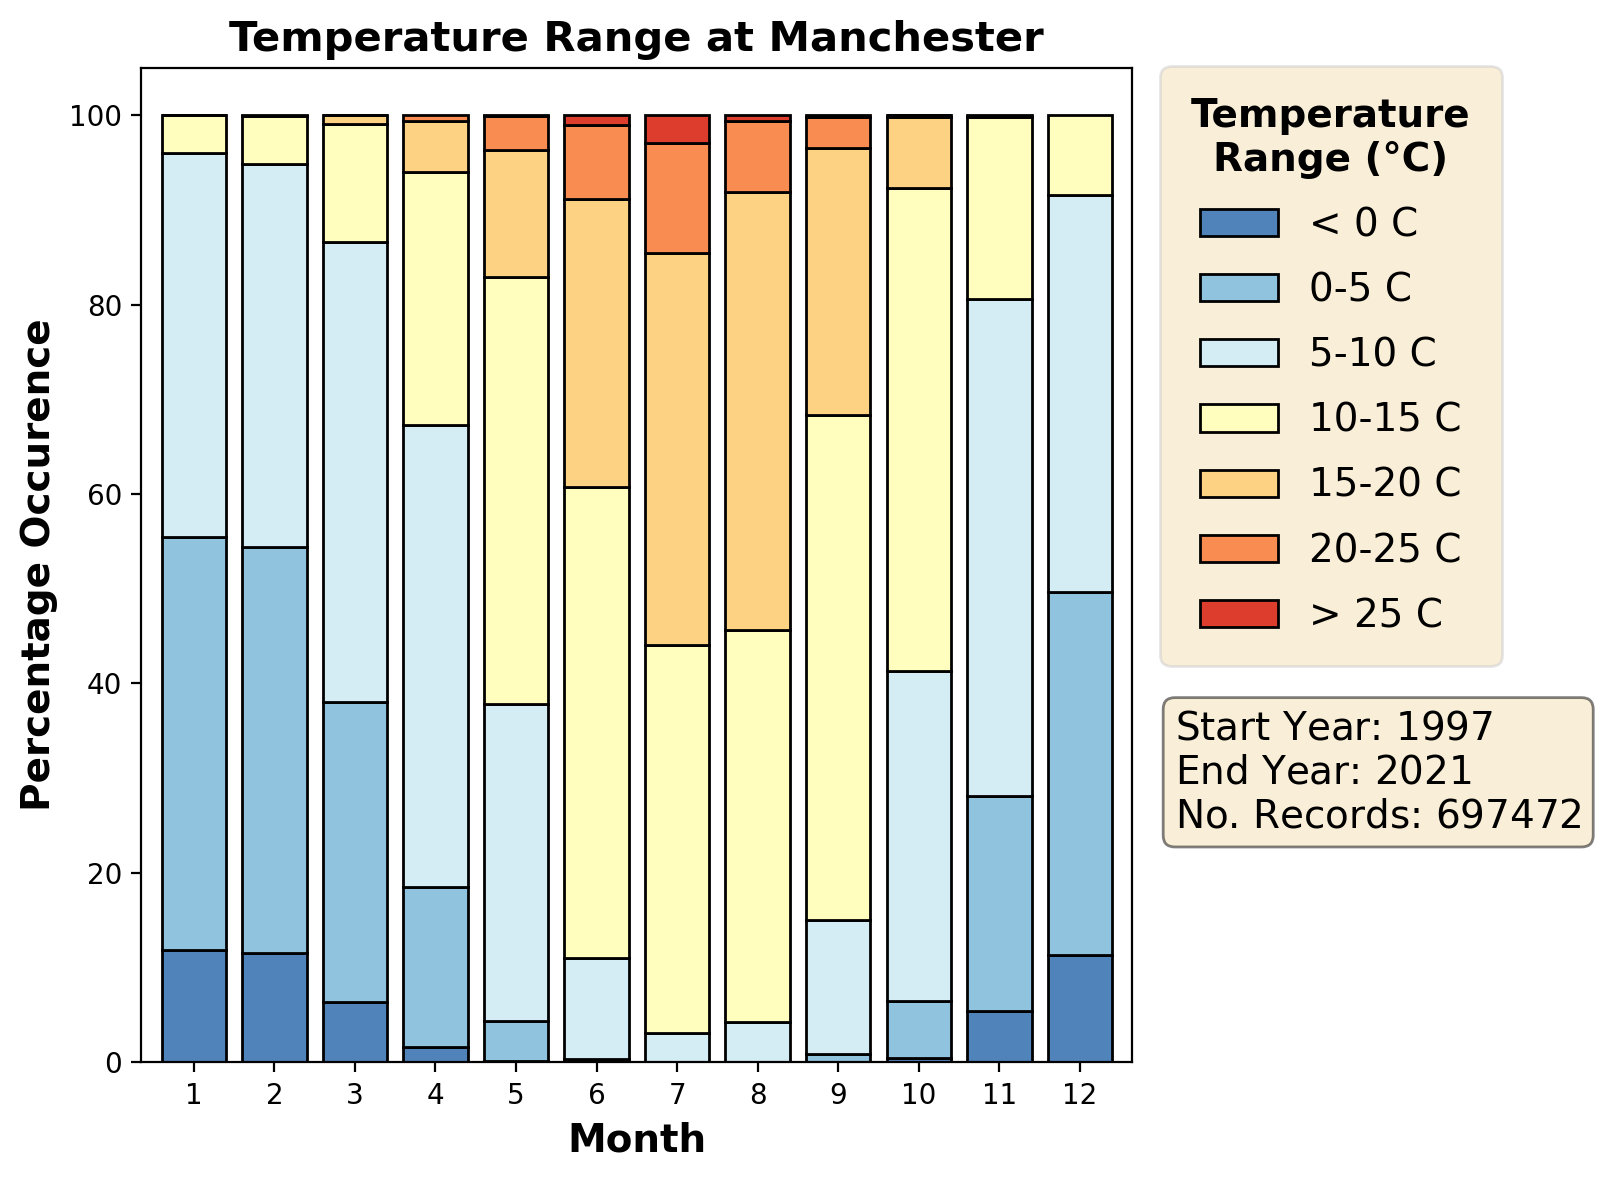
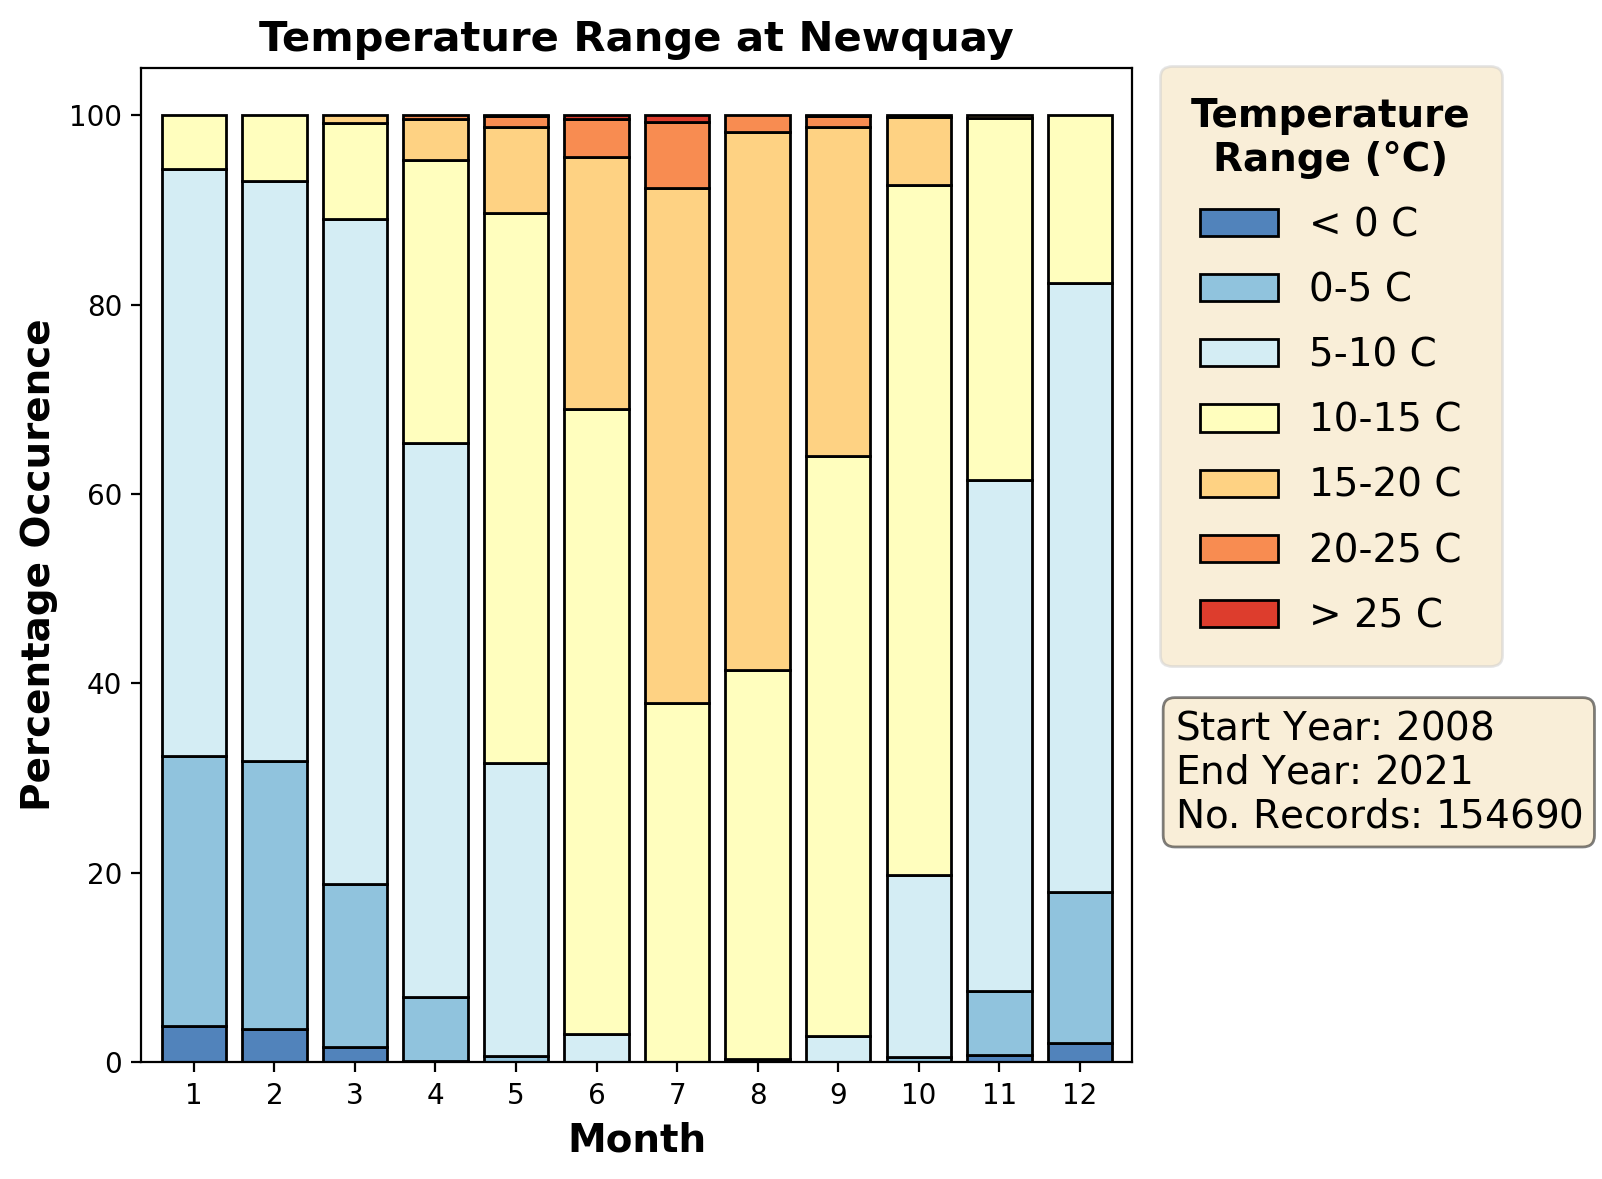
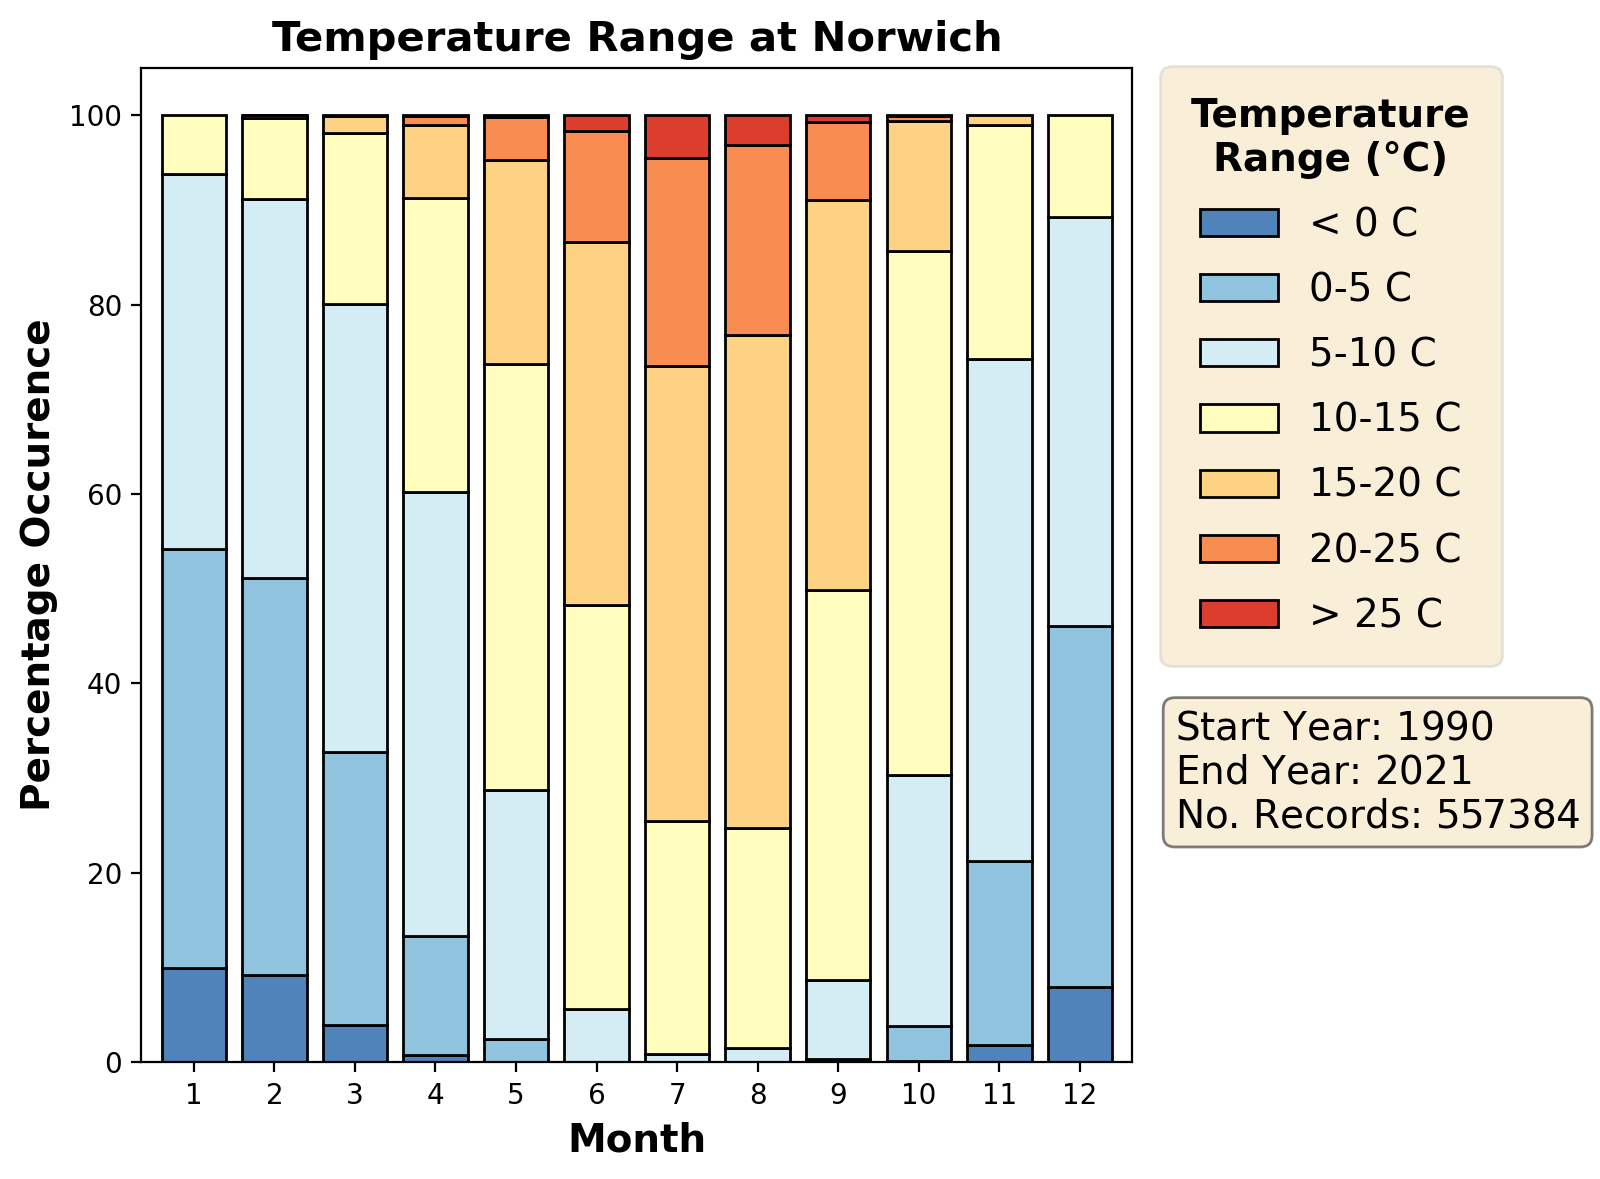
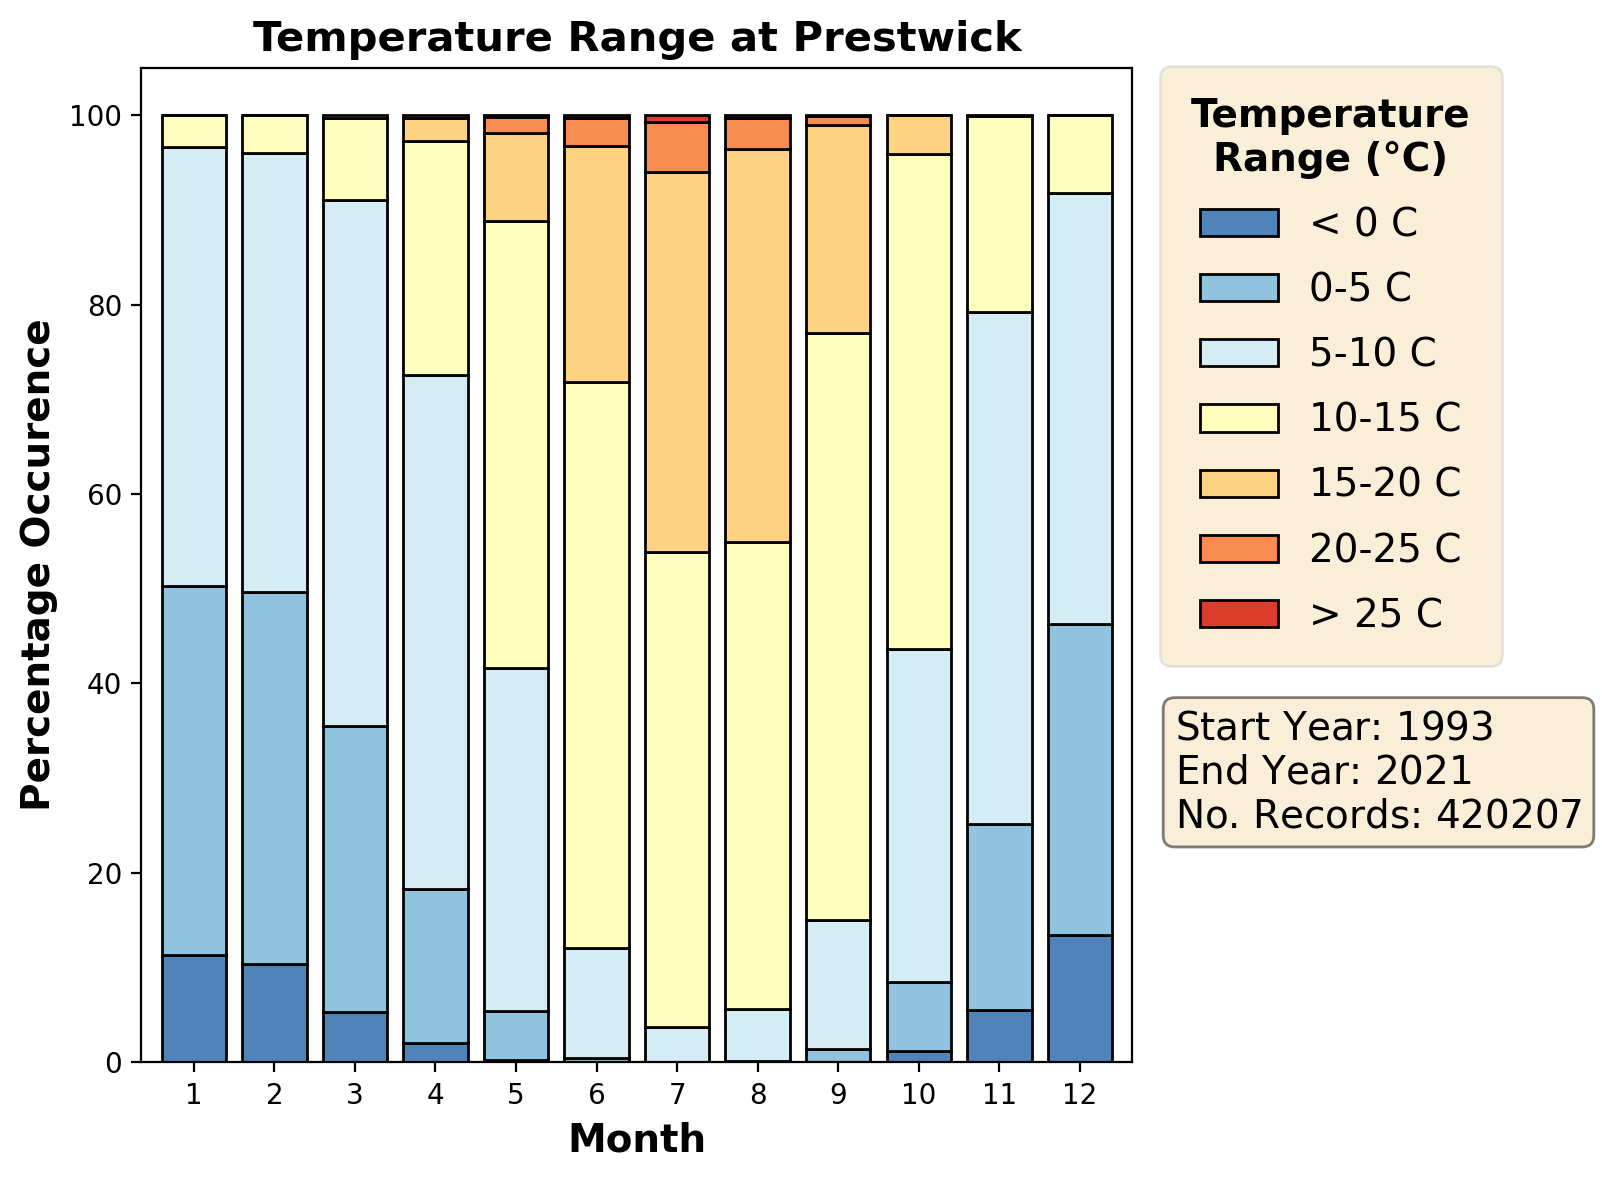
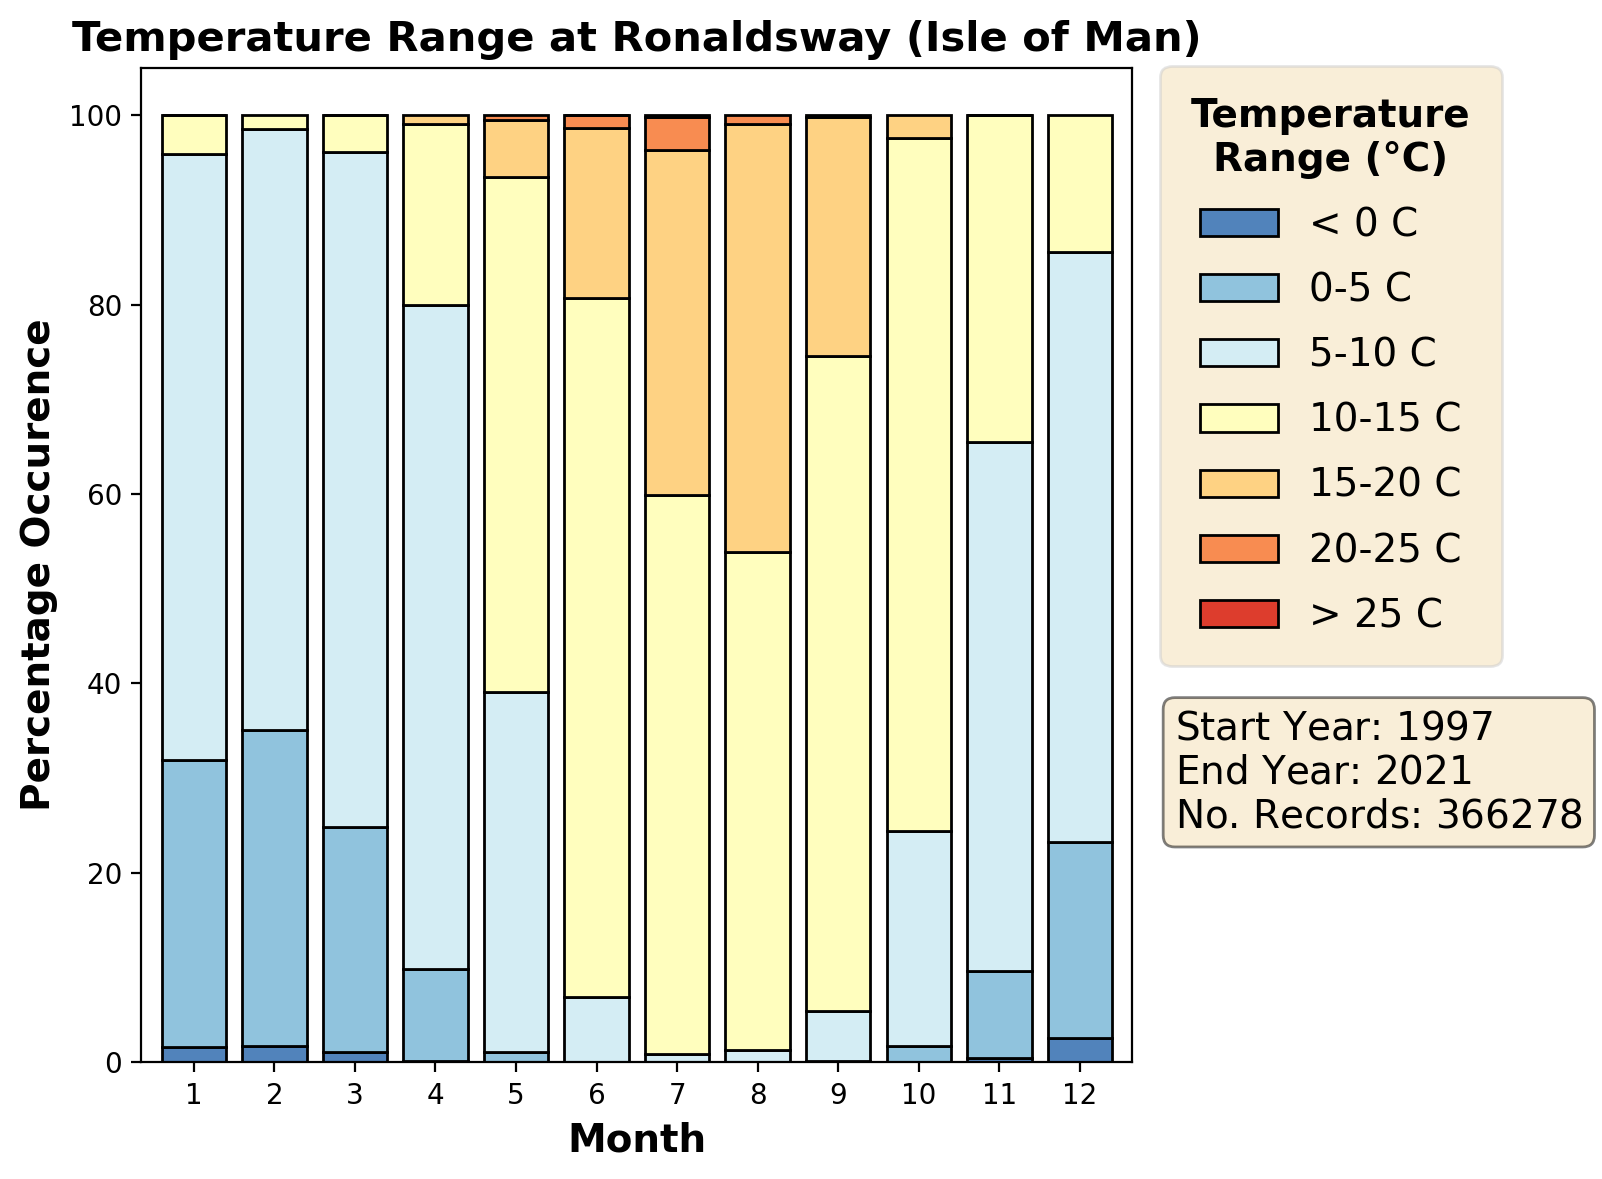
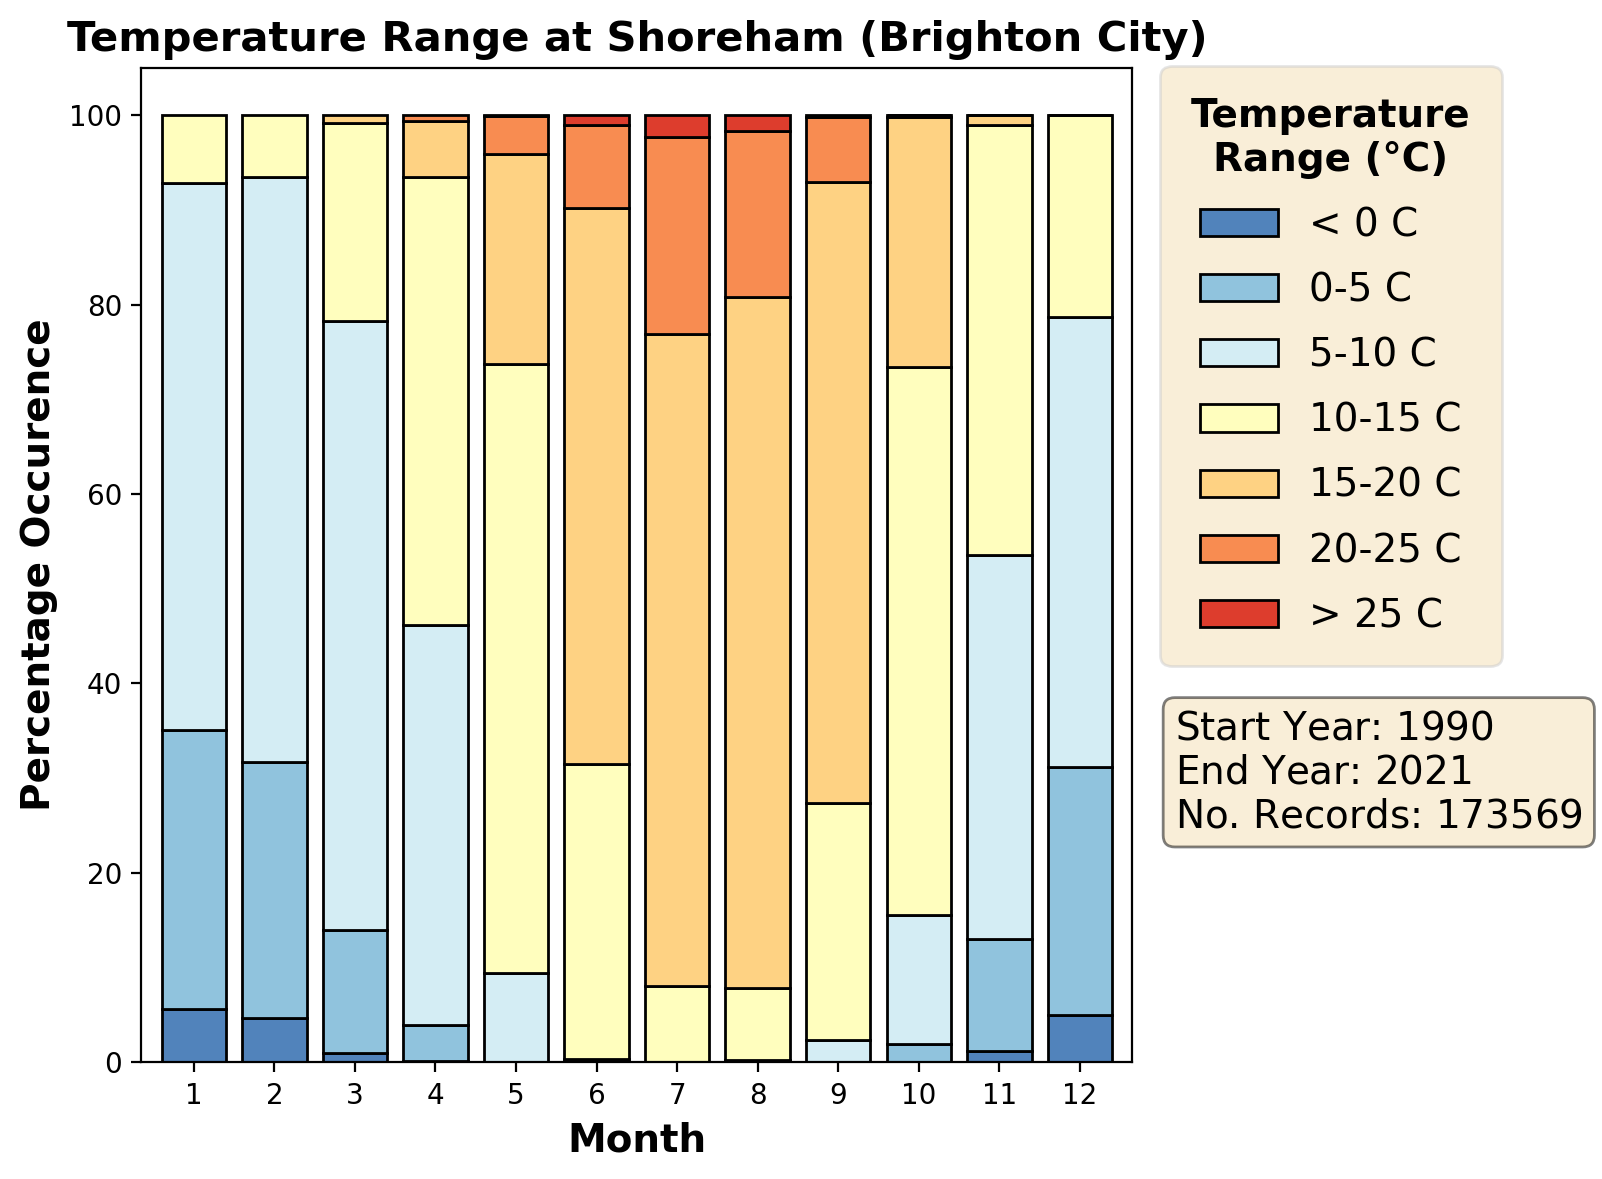
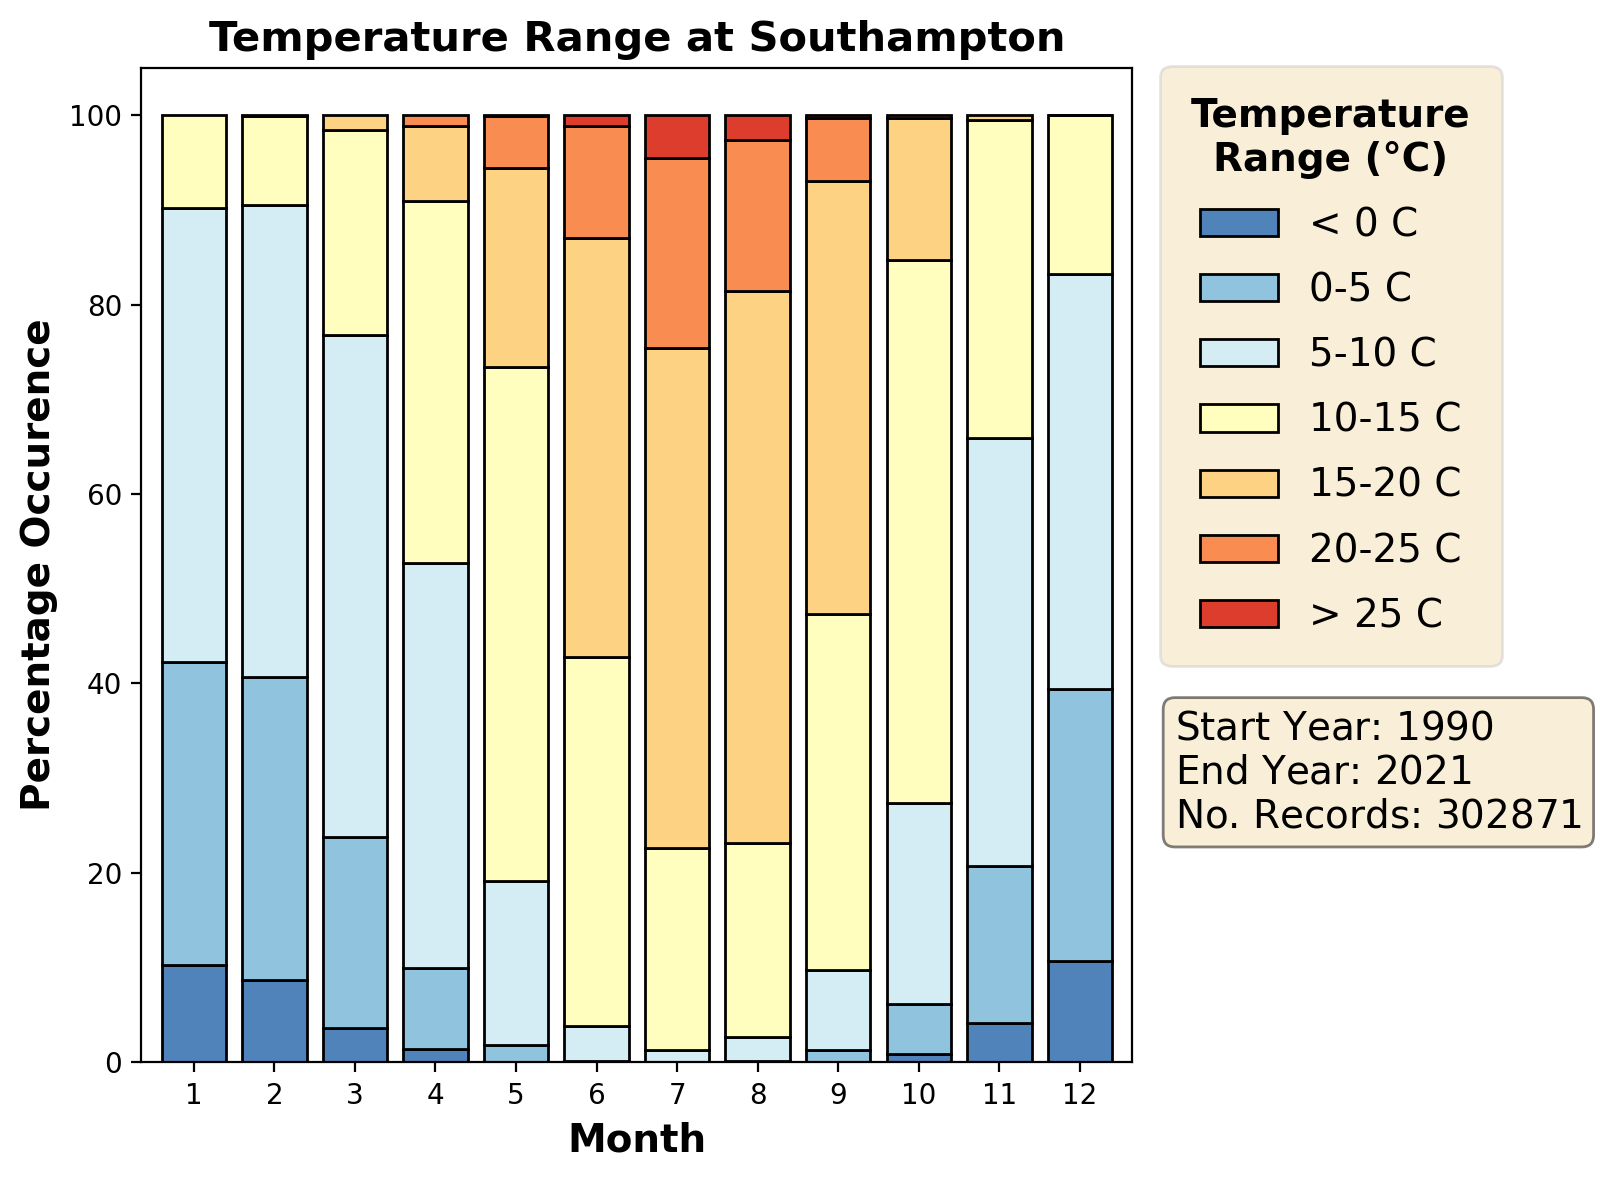
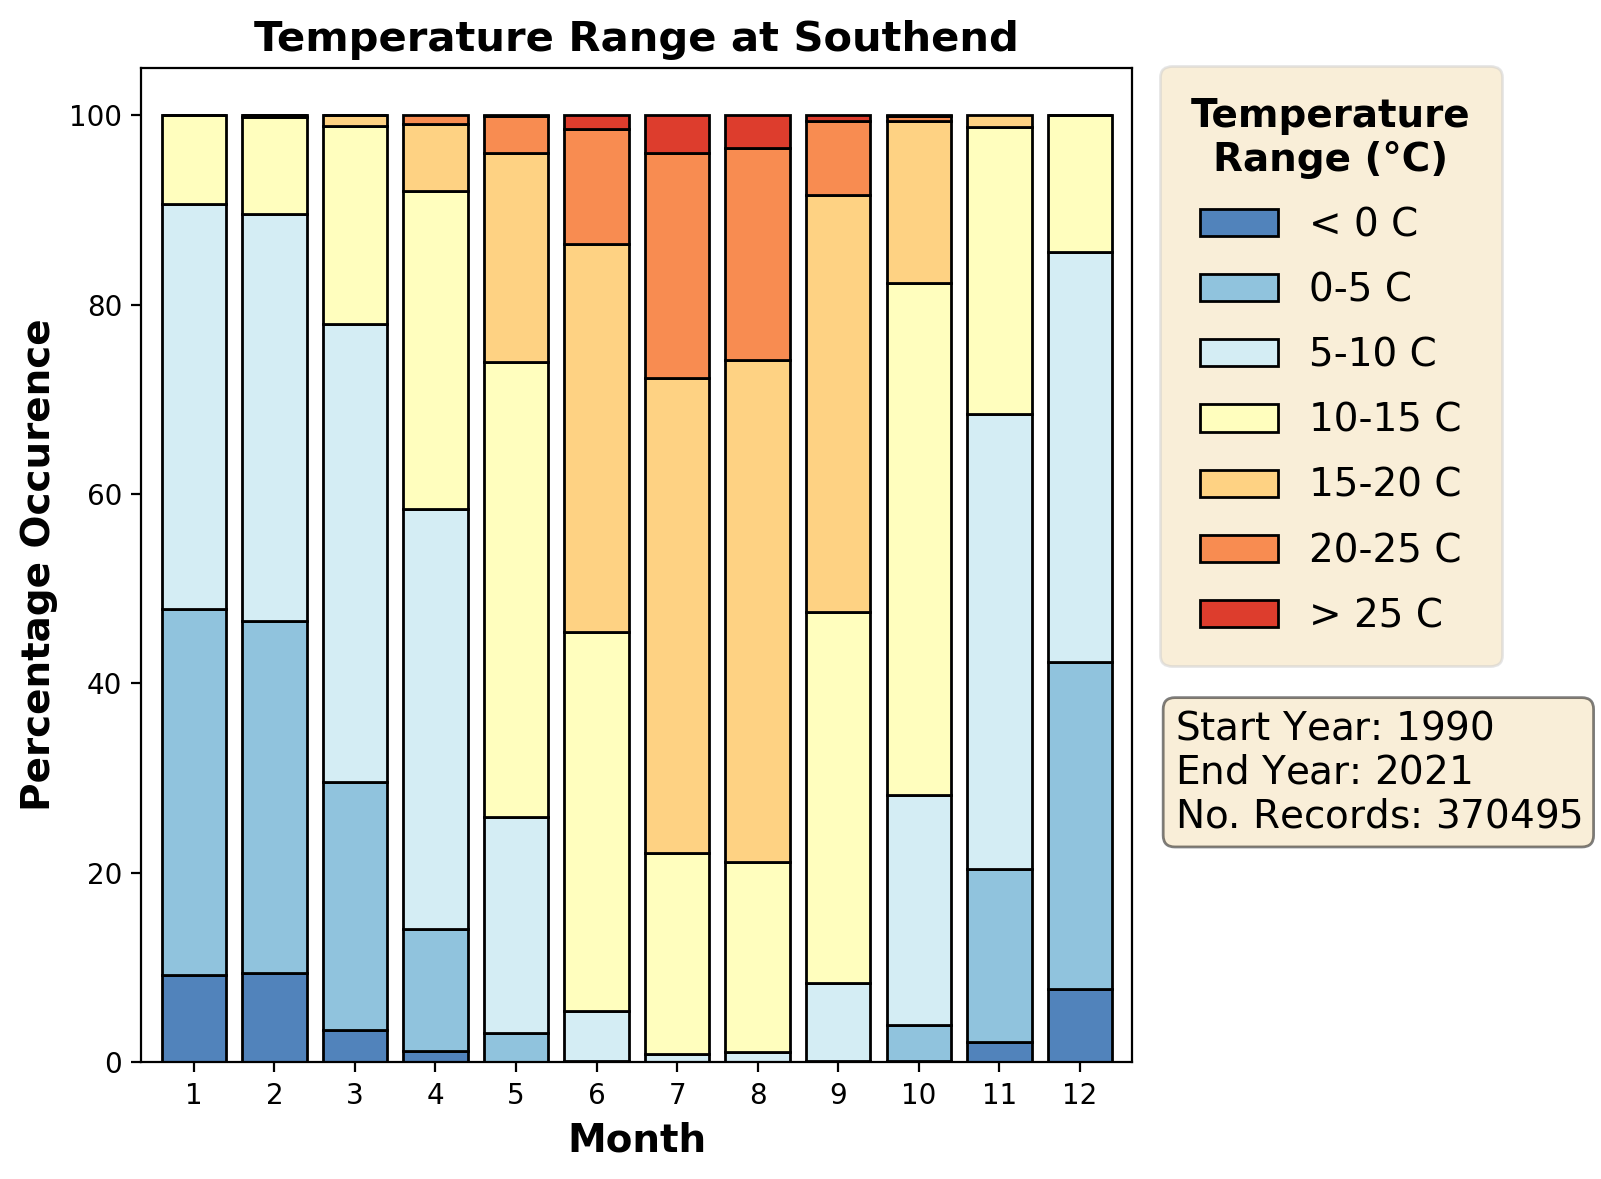
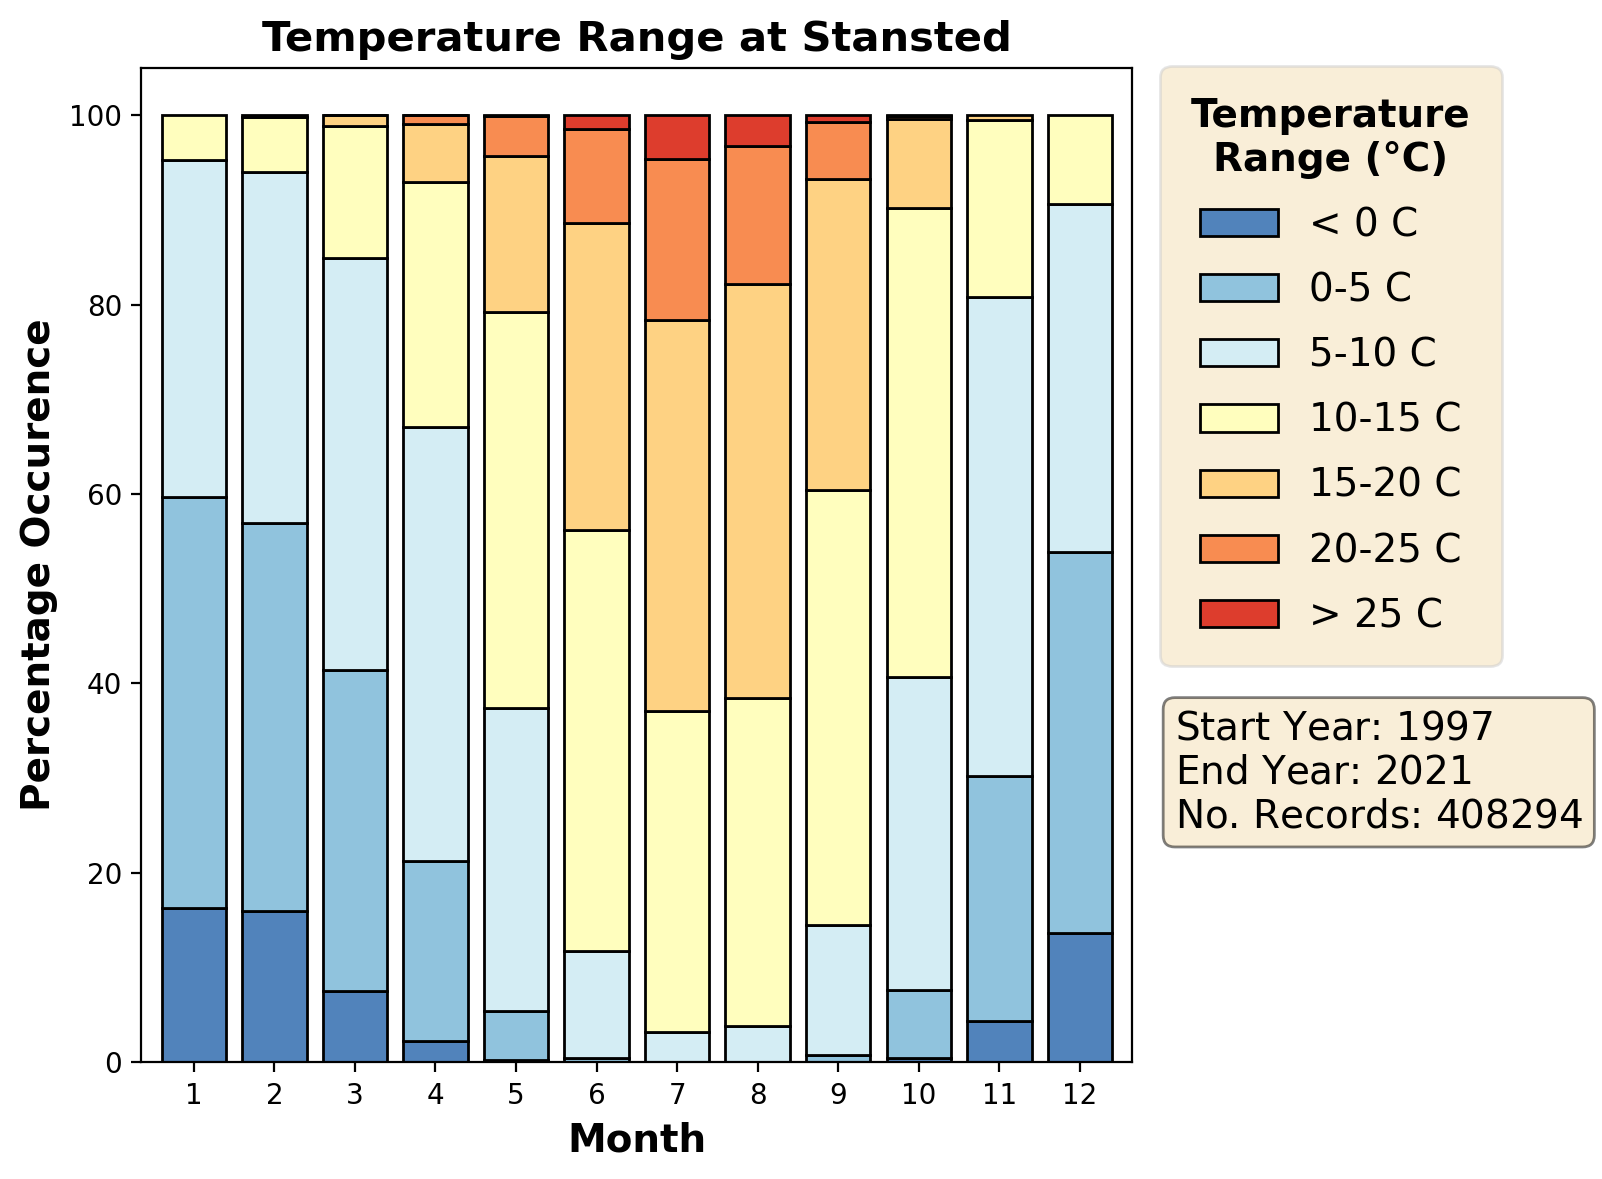
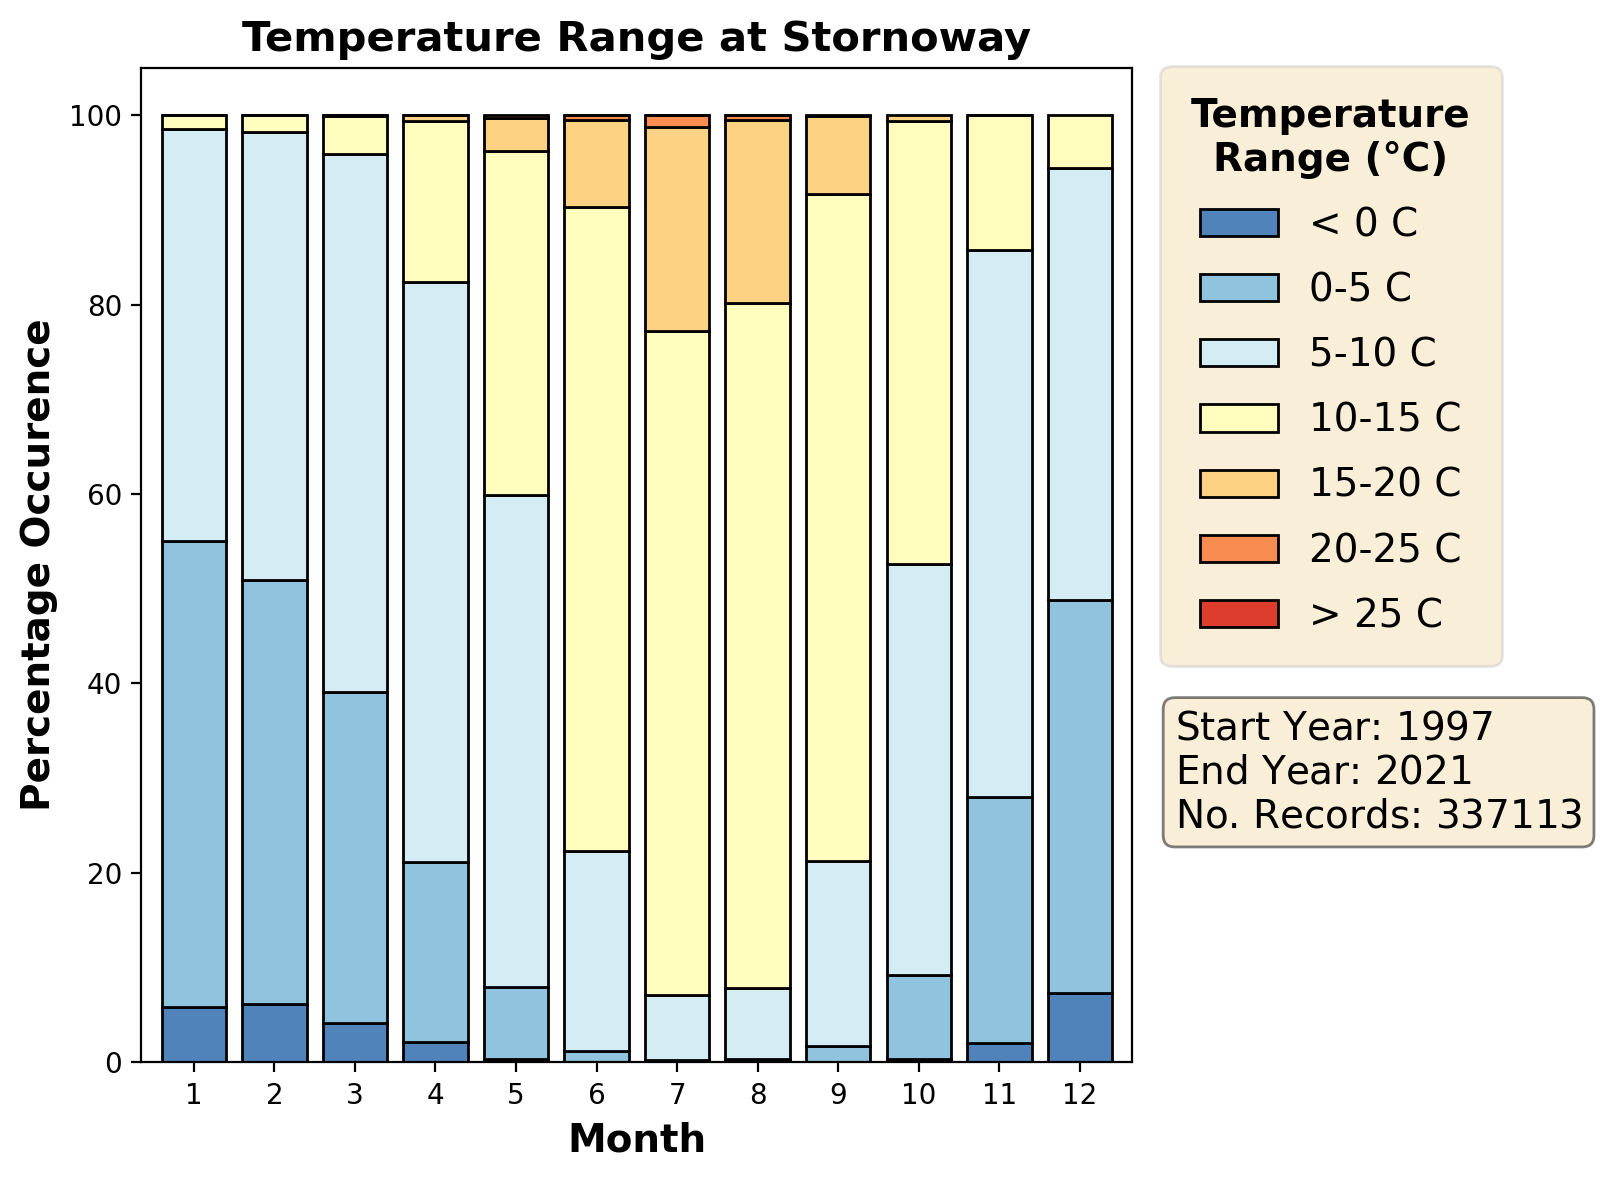
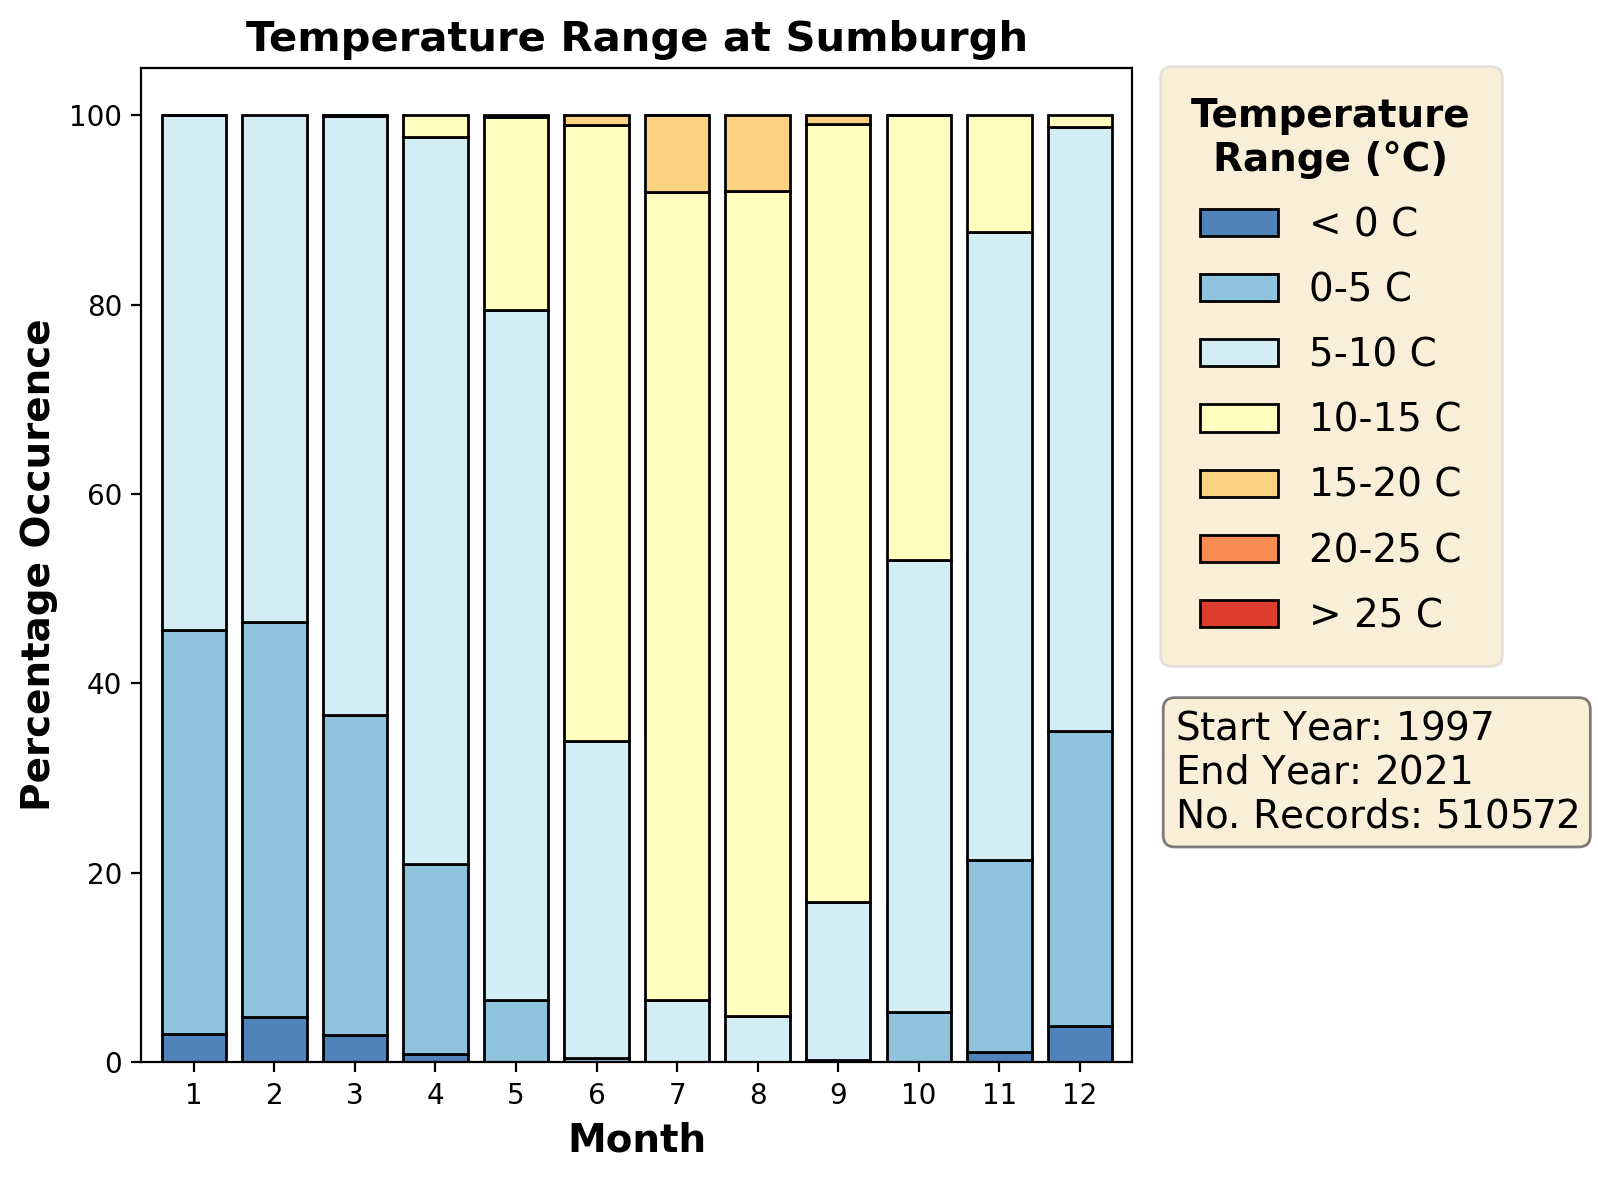
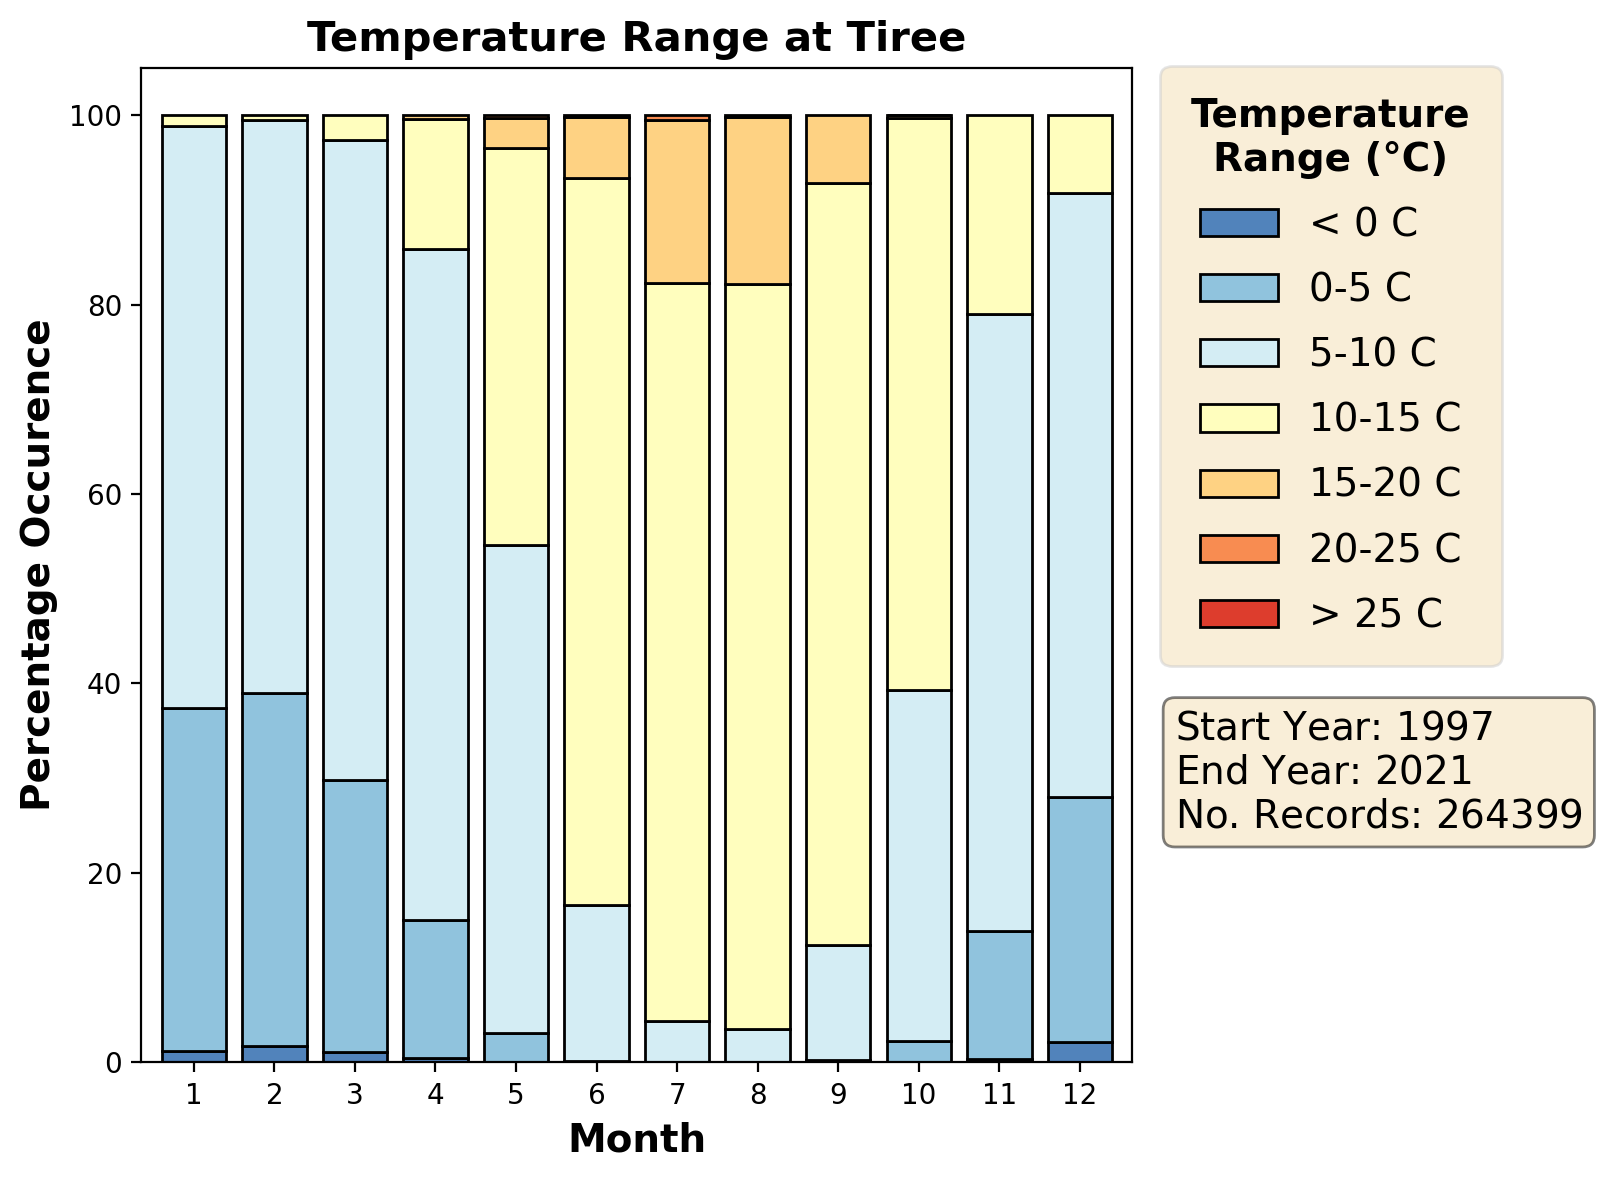
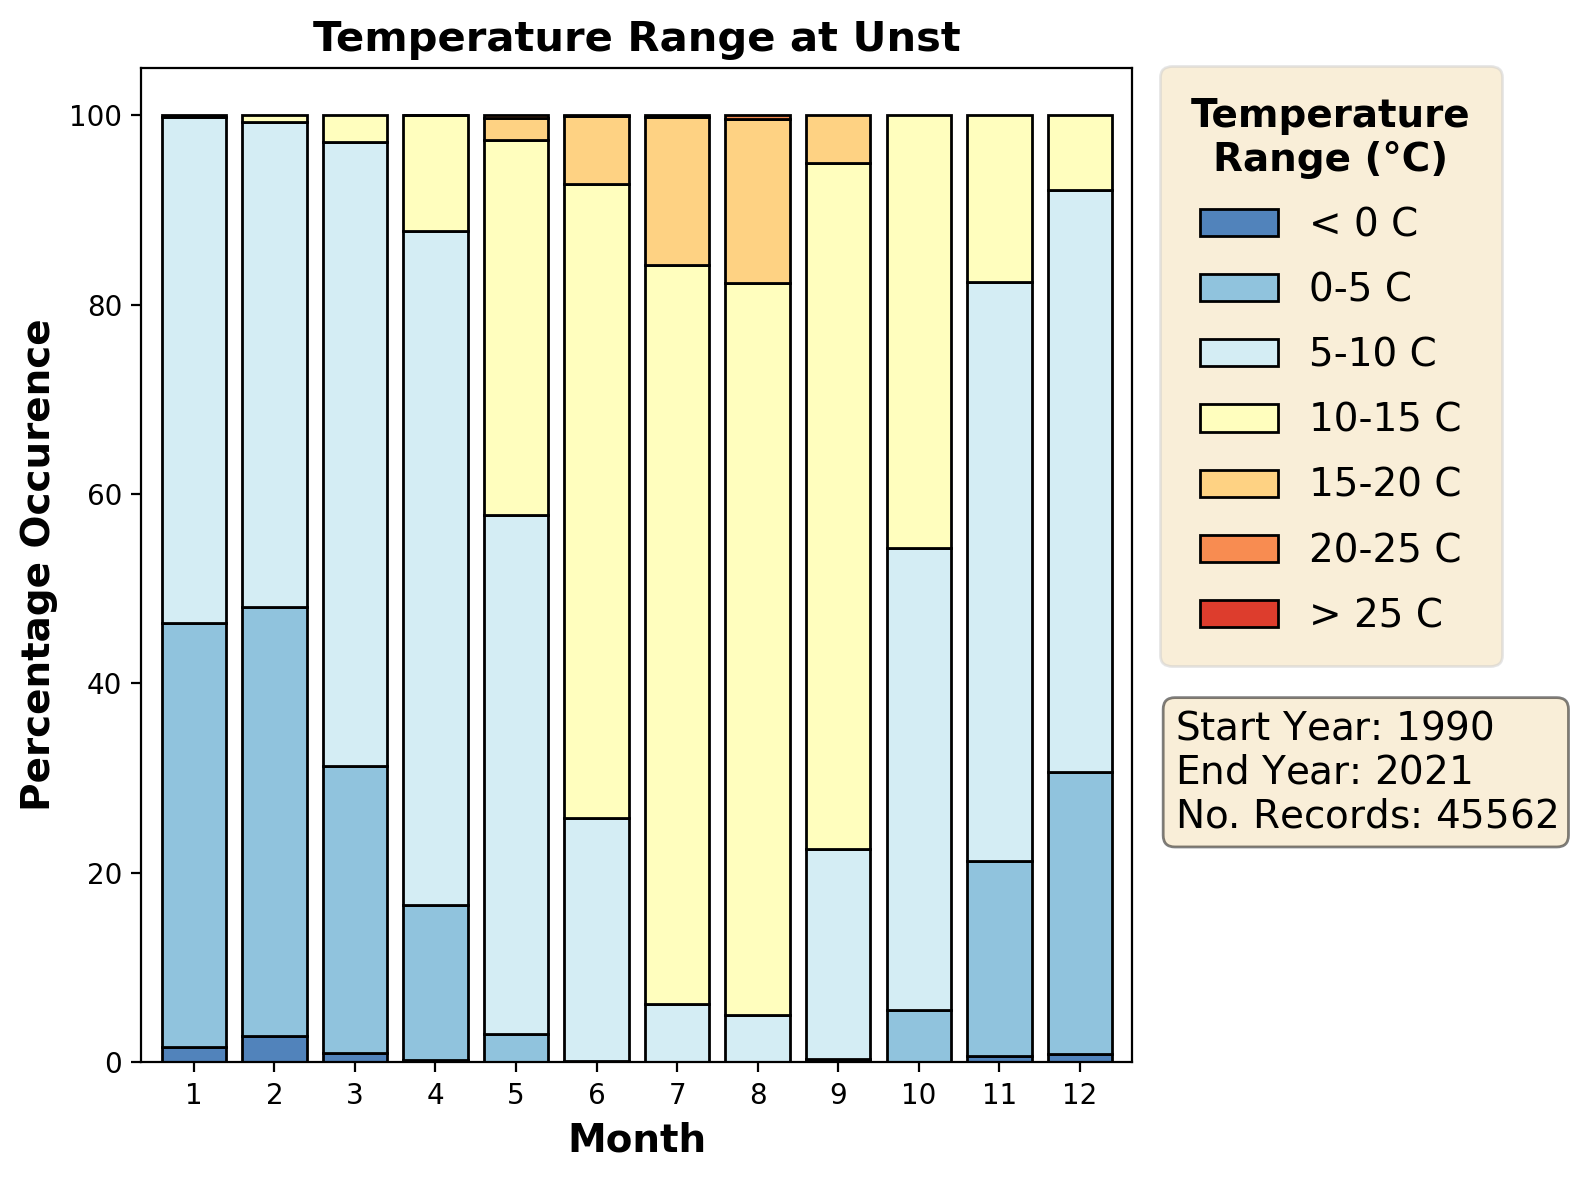
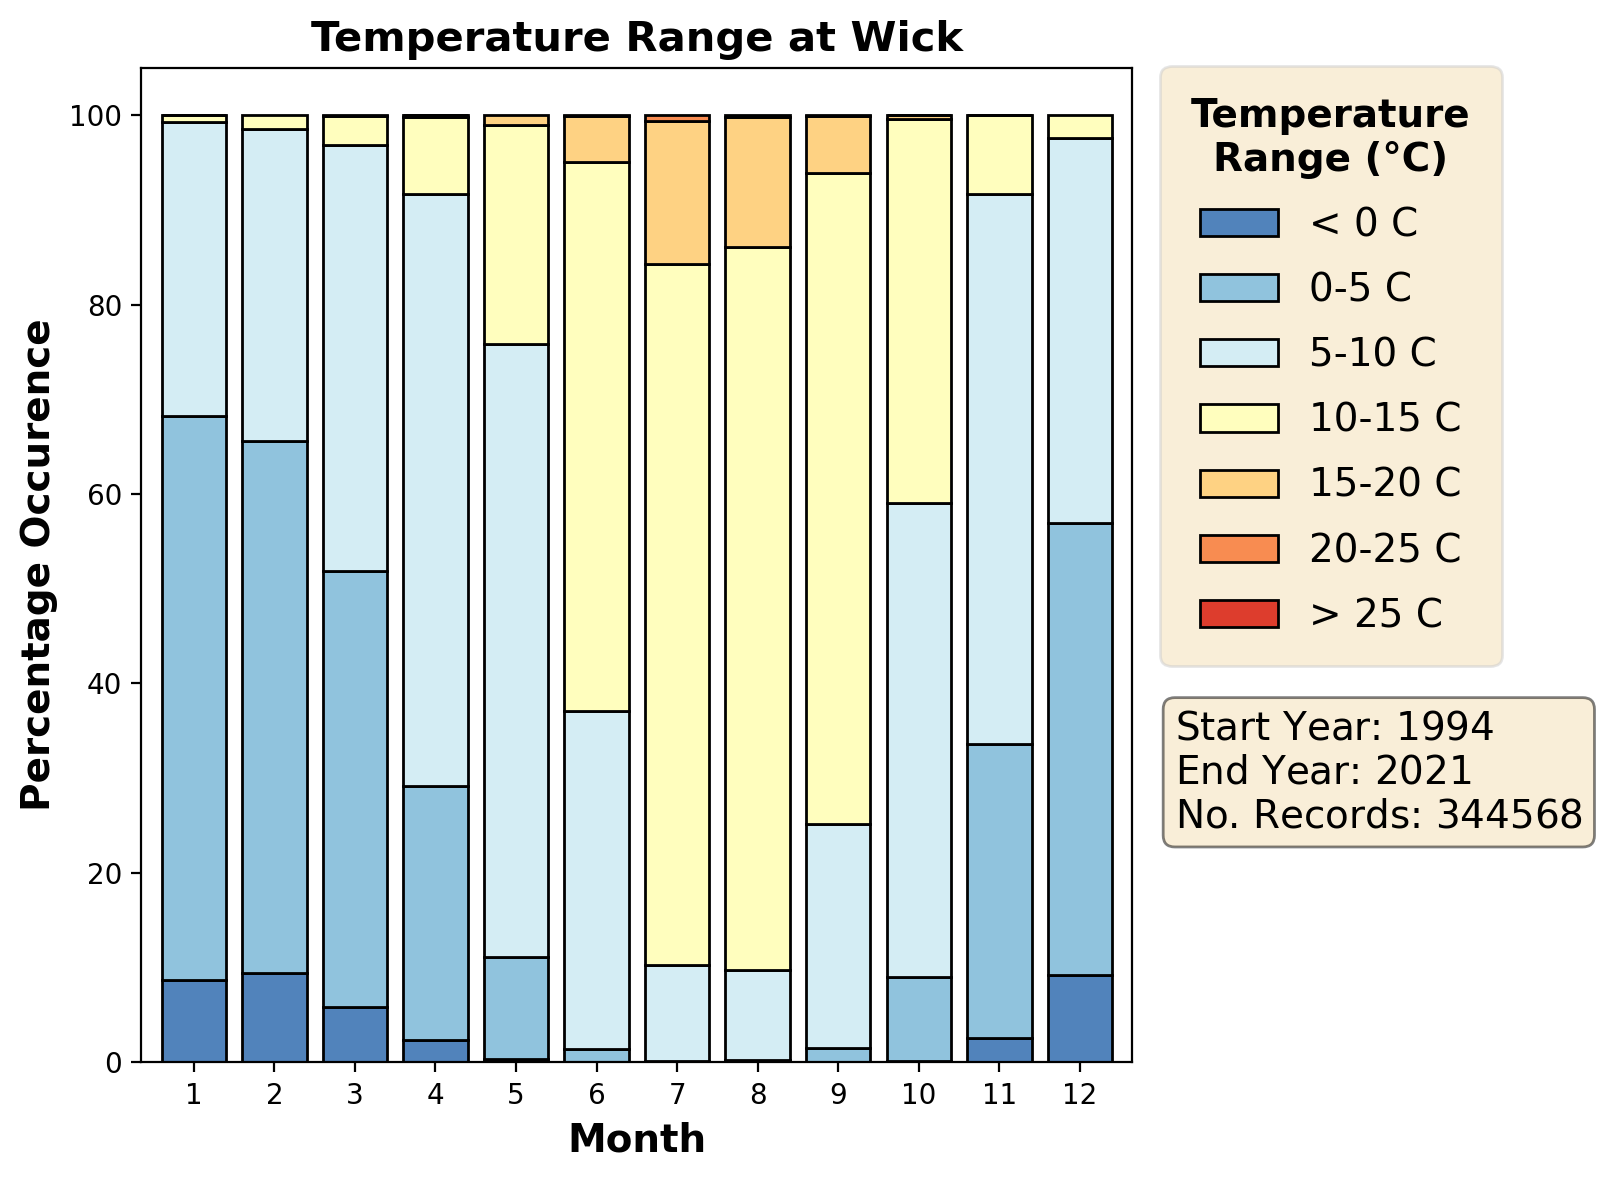
Temperature
This shows the percentage of occasions that the daily maximum temperature fell within certain ranges, by month. The sum total of these ranges always equals 100%. Temperatures are useful to pilots when considering fuel loads and icing.
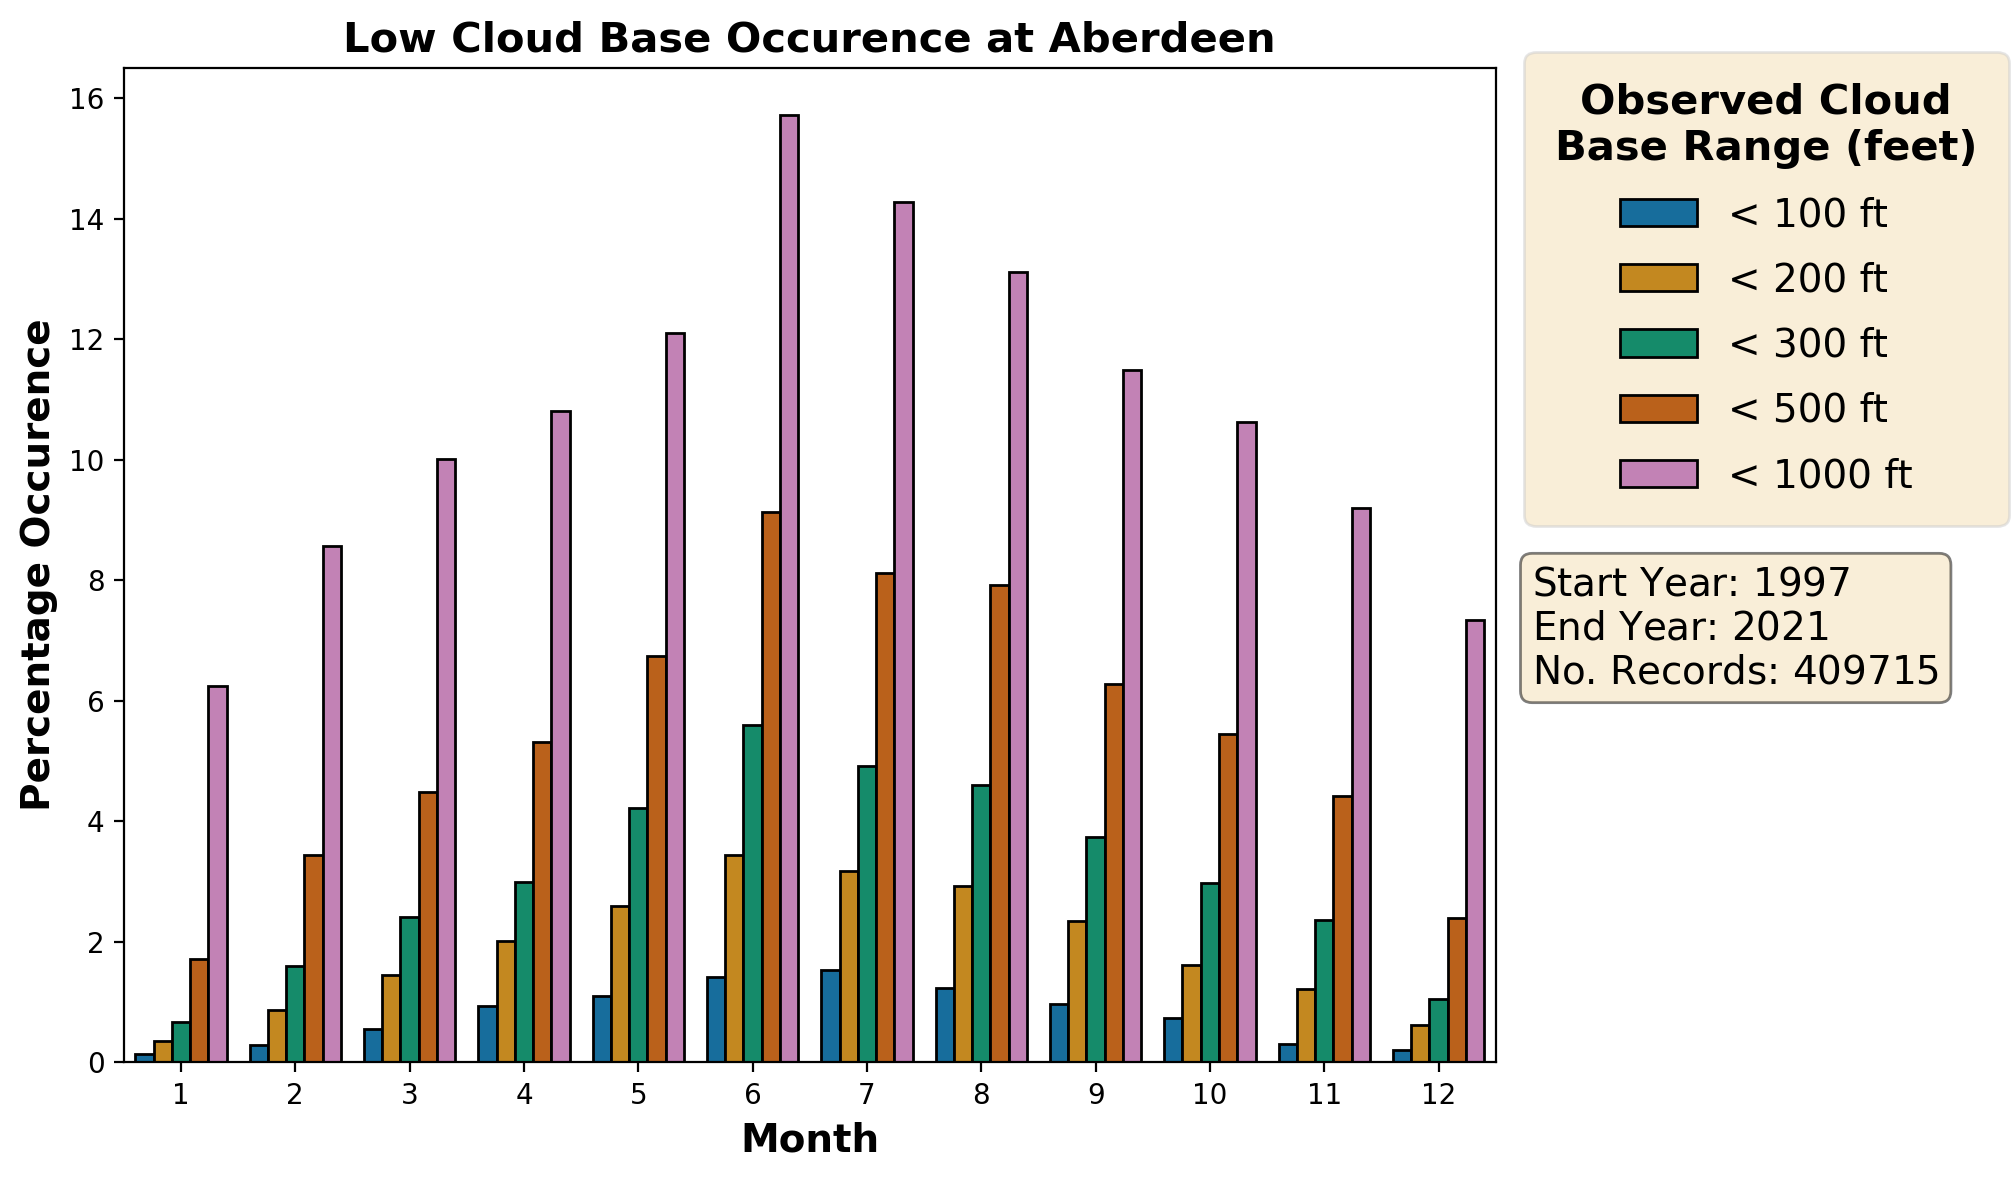
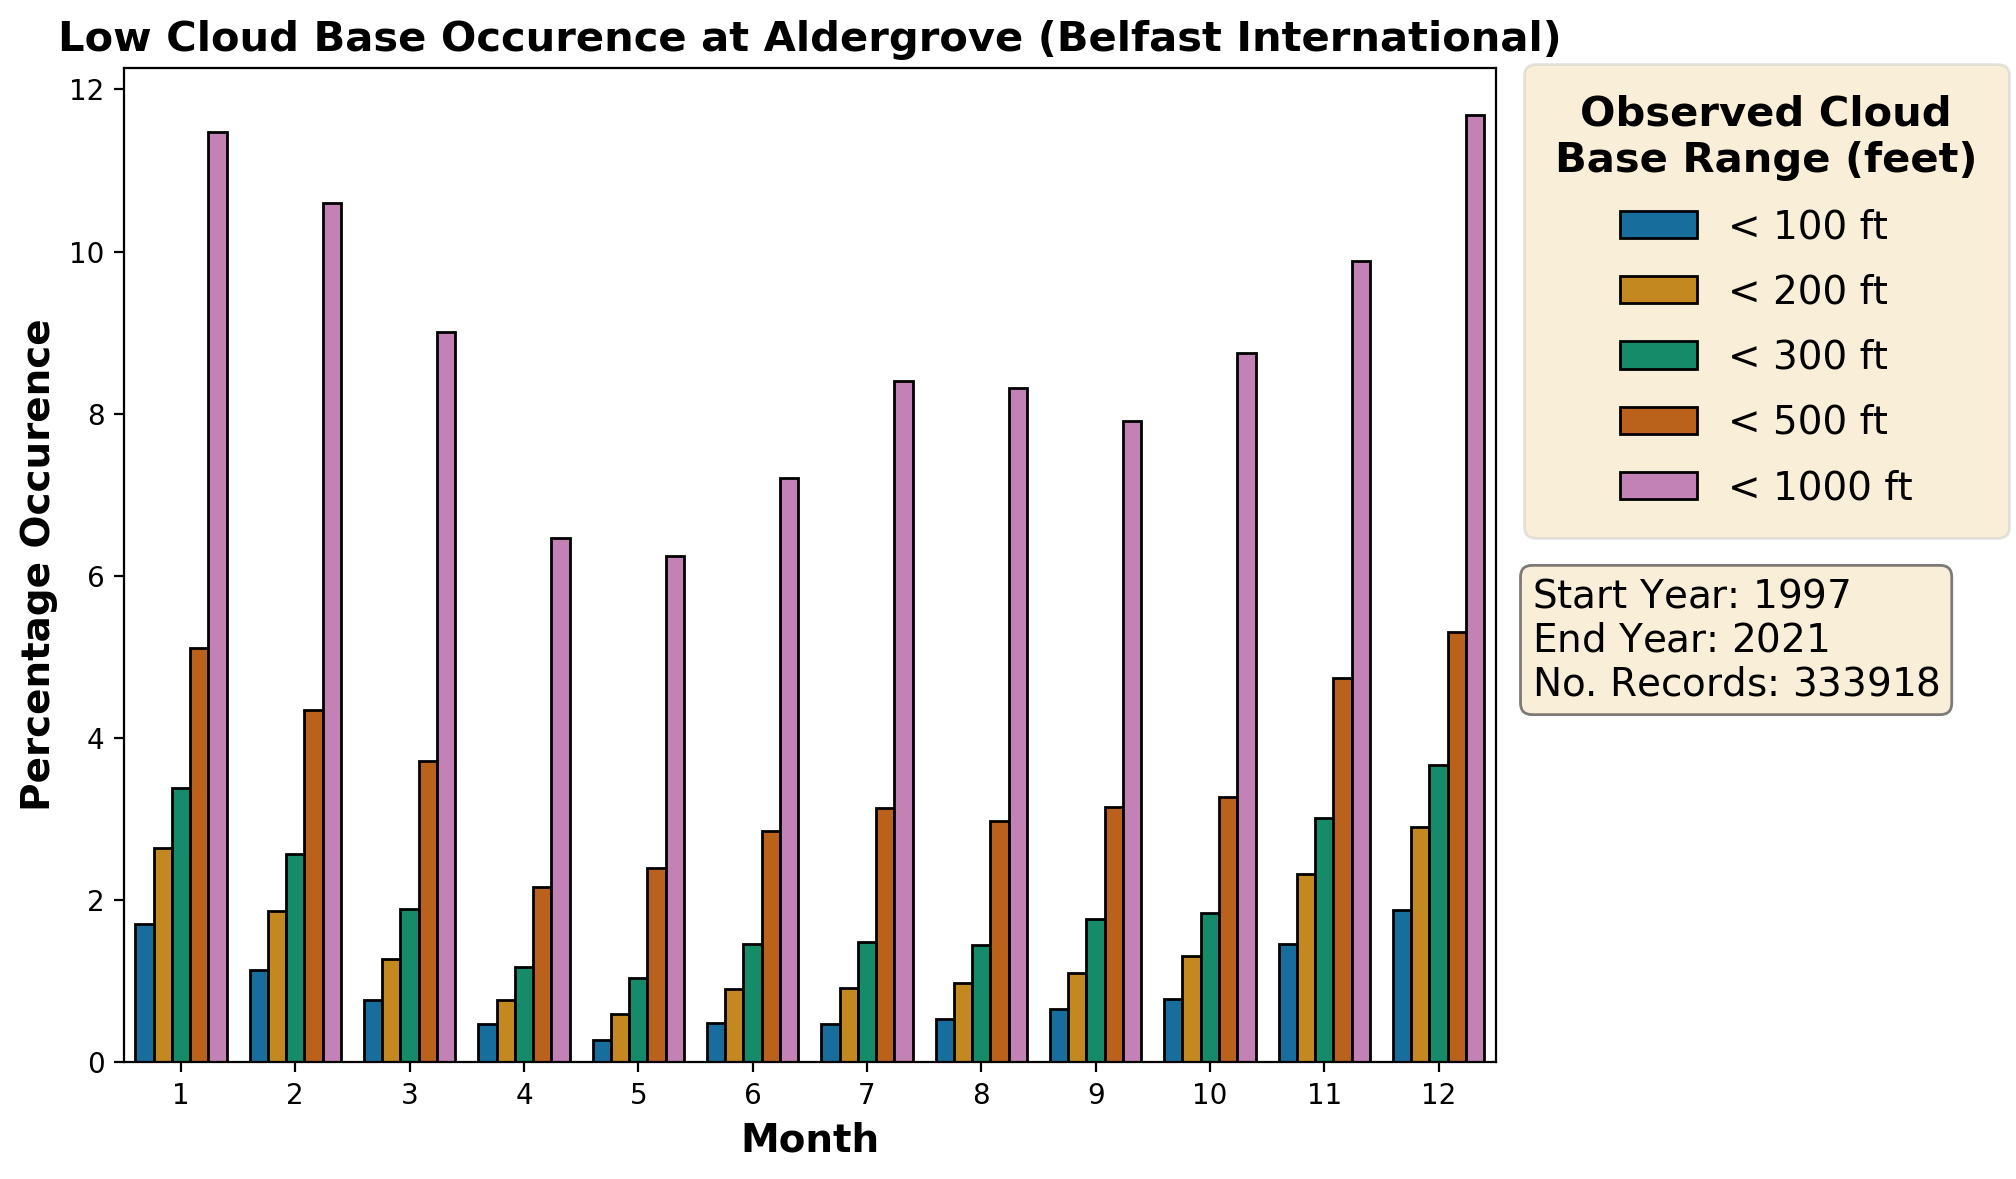
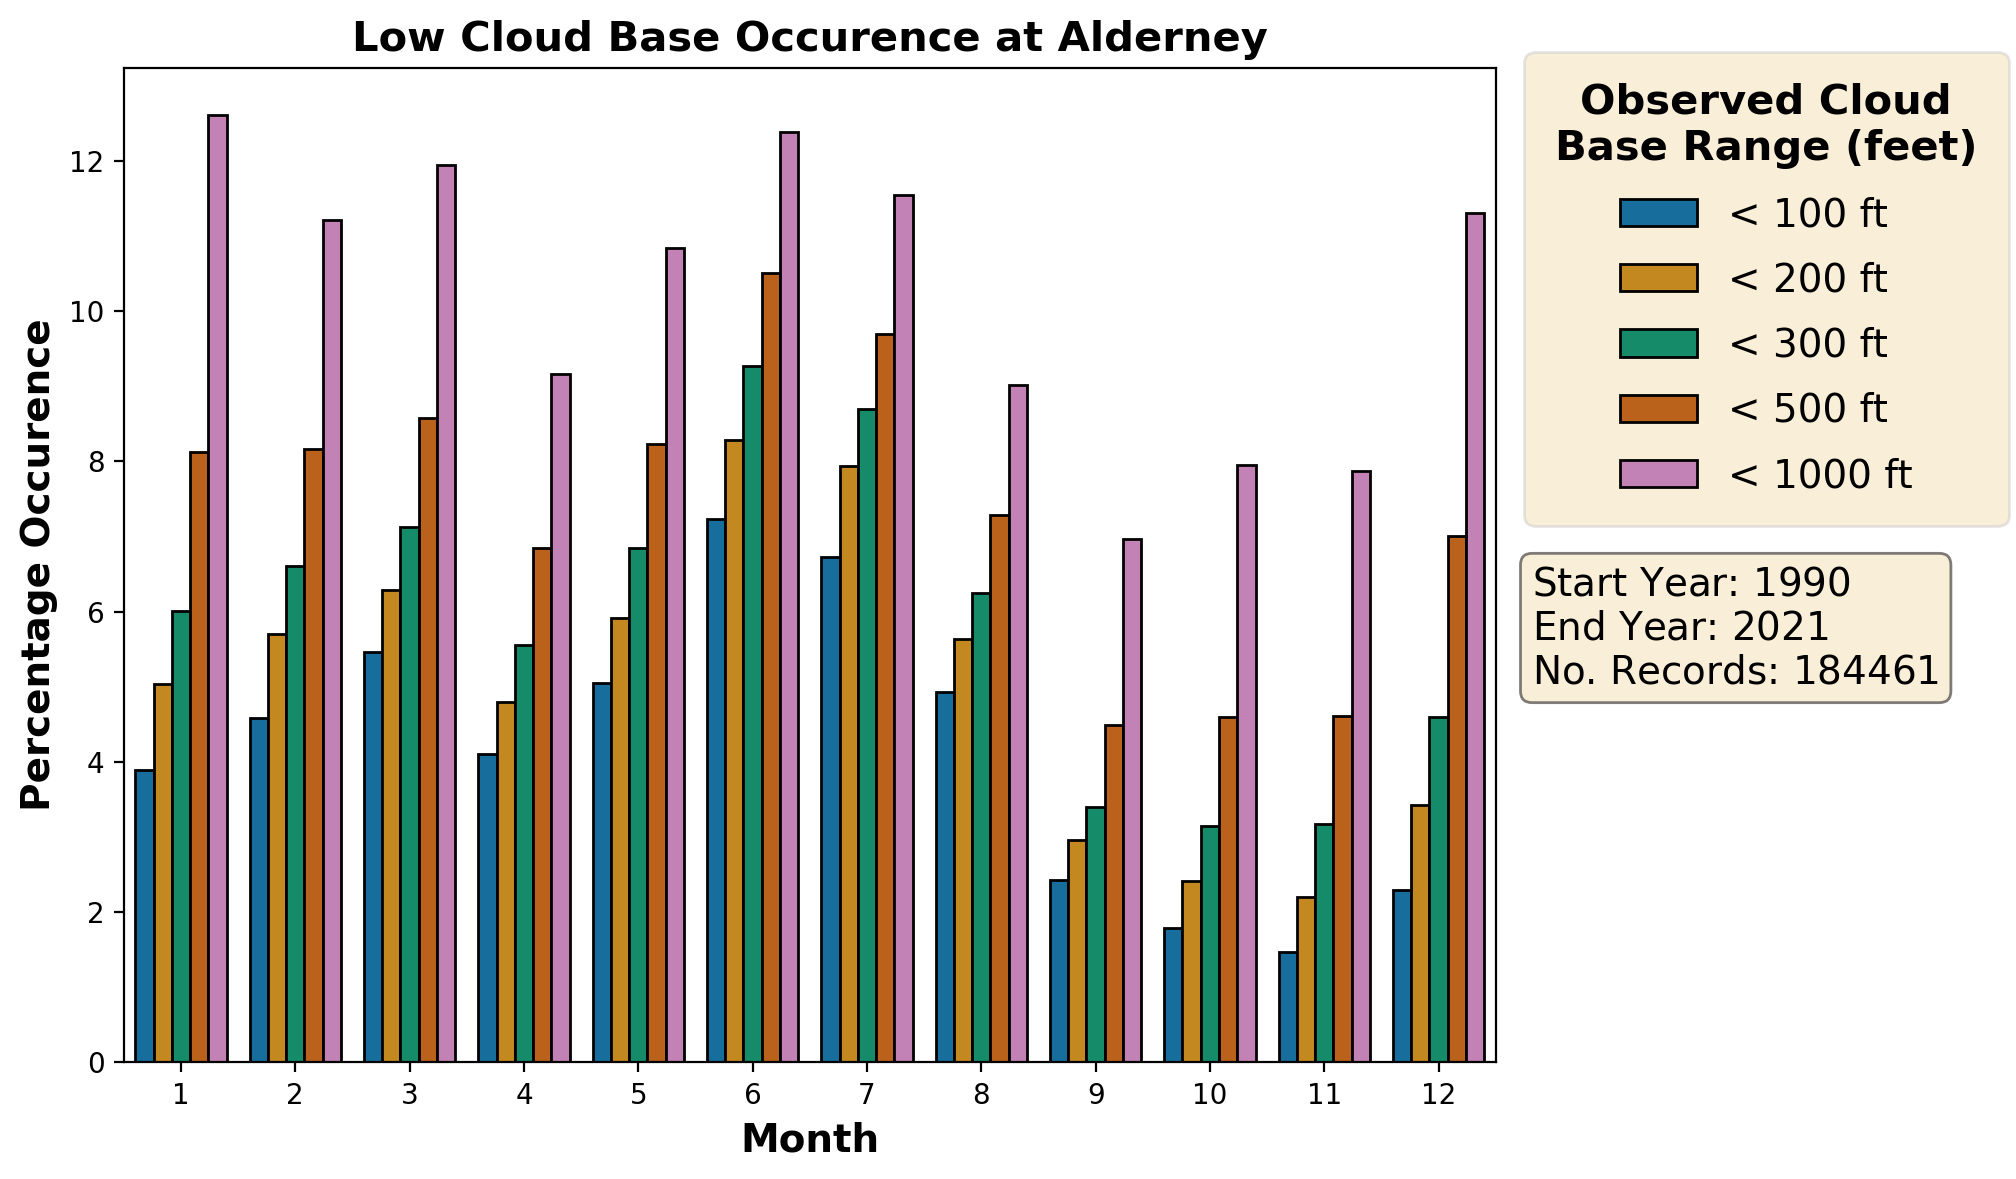
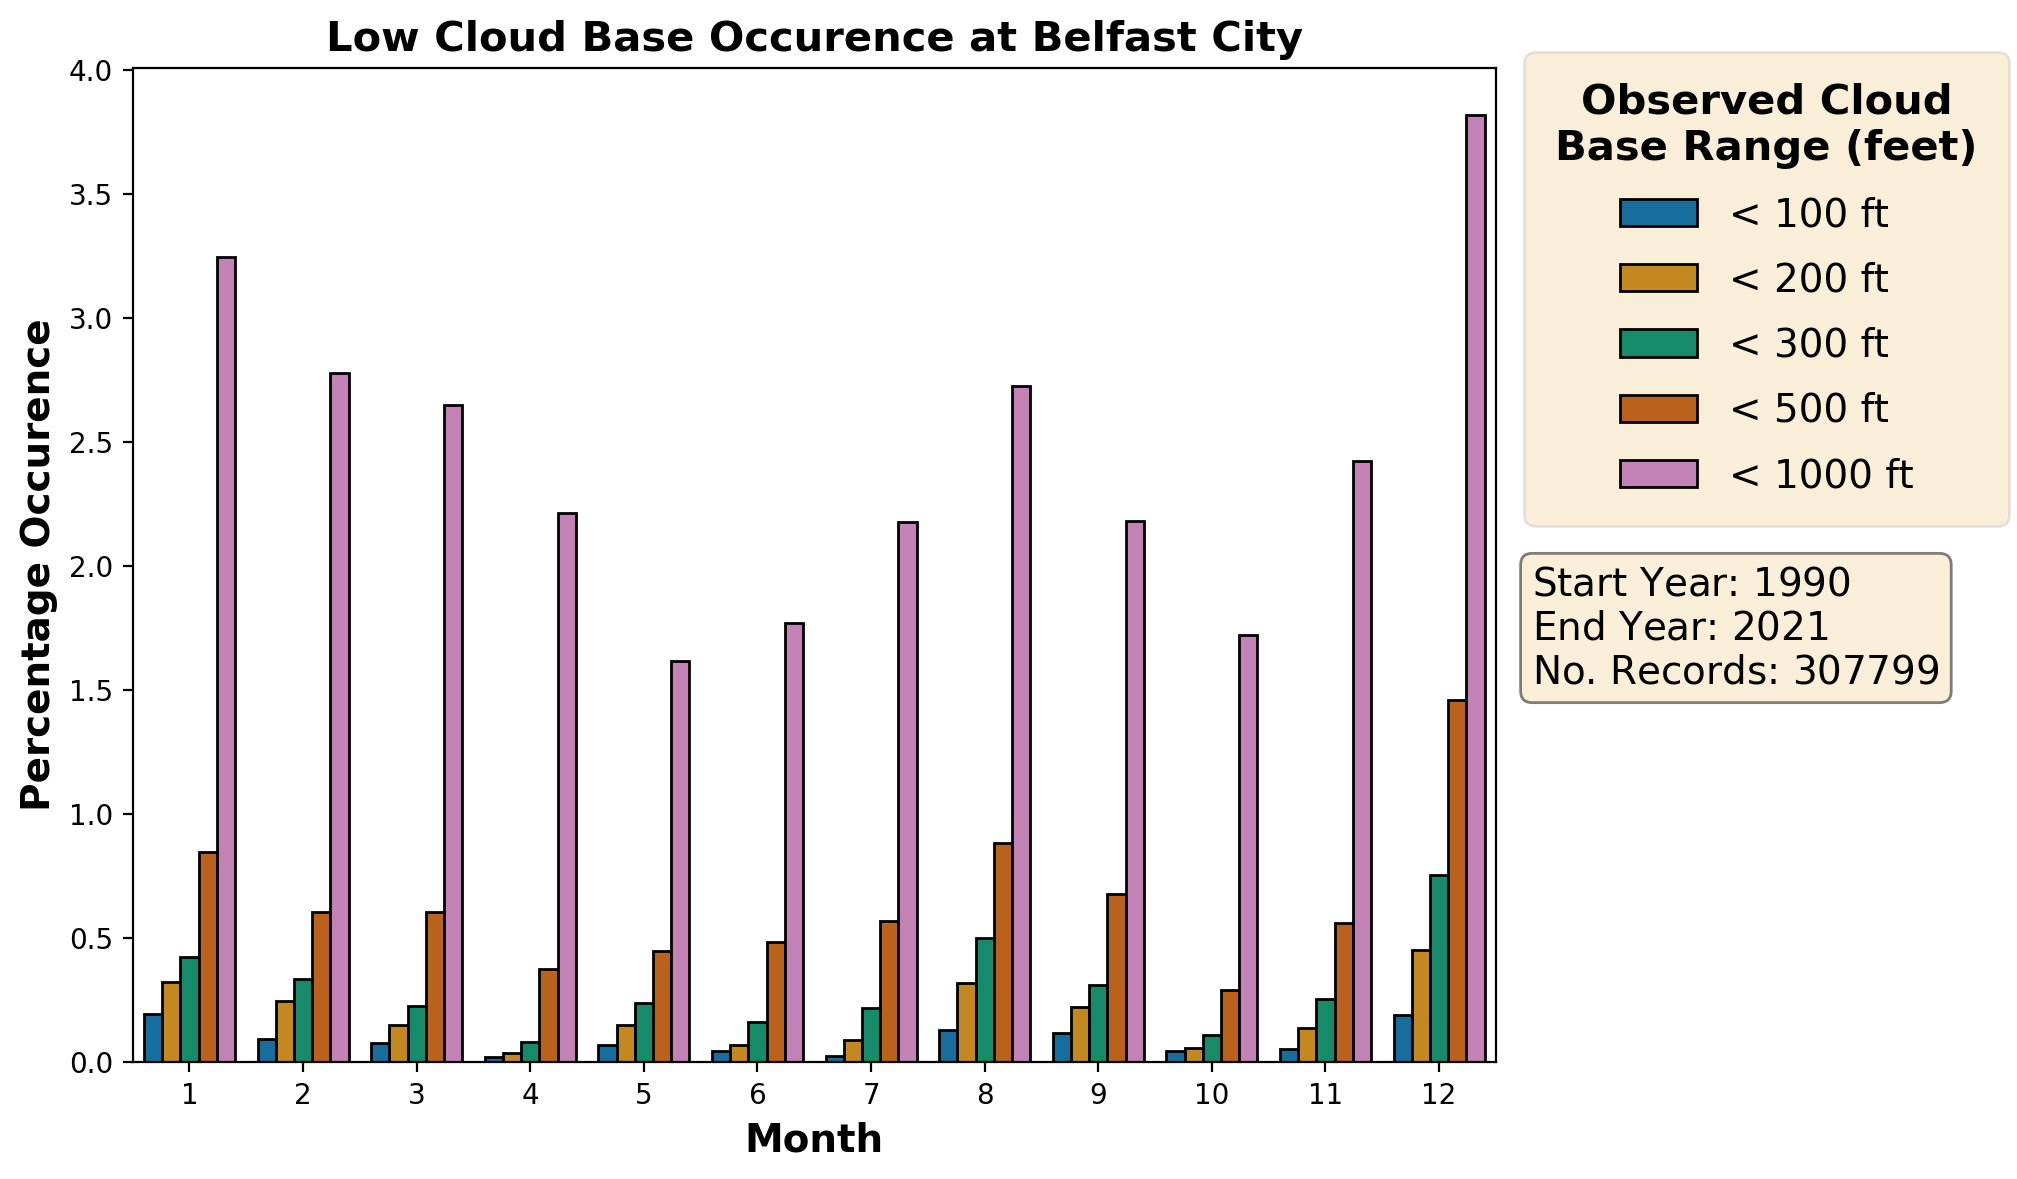
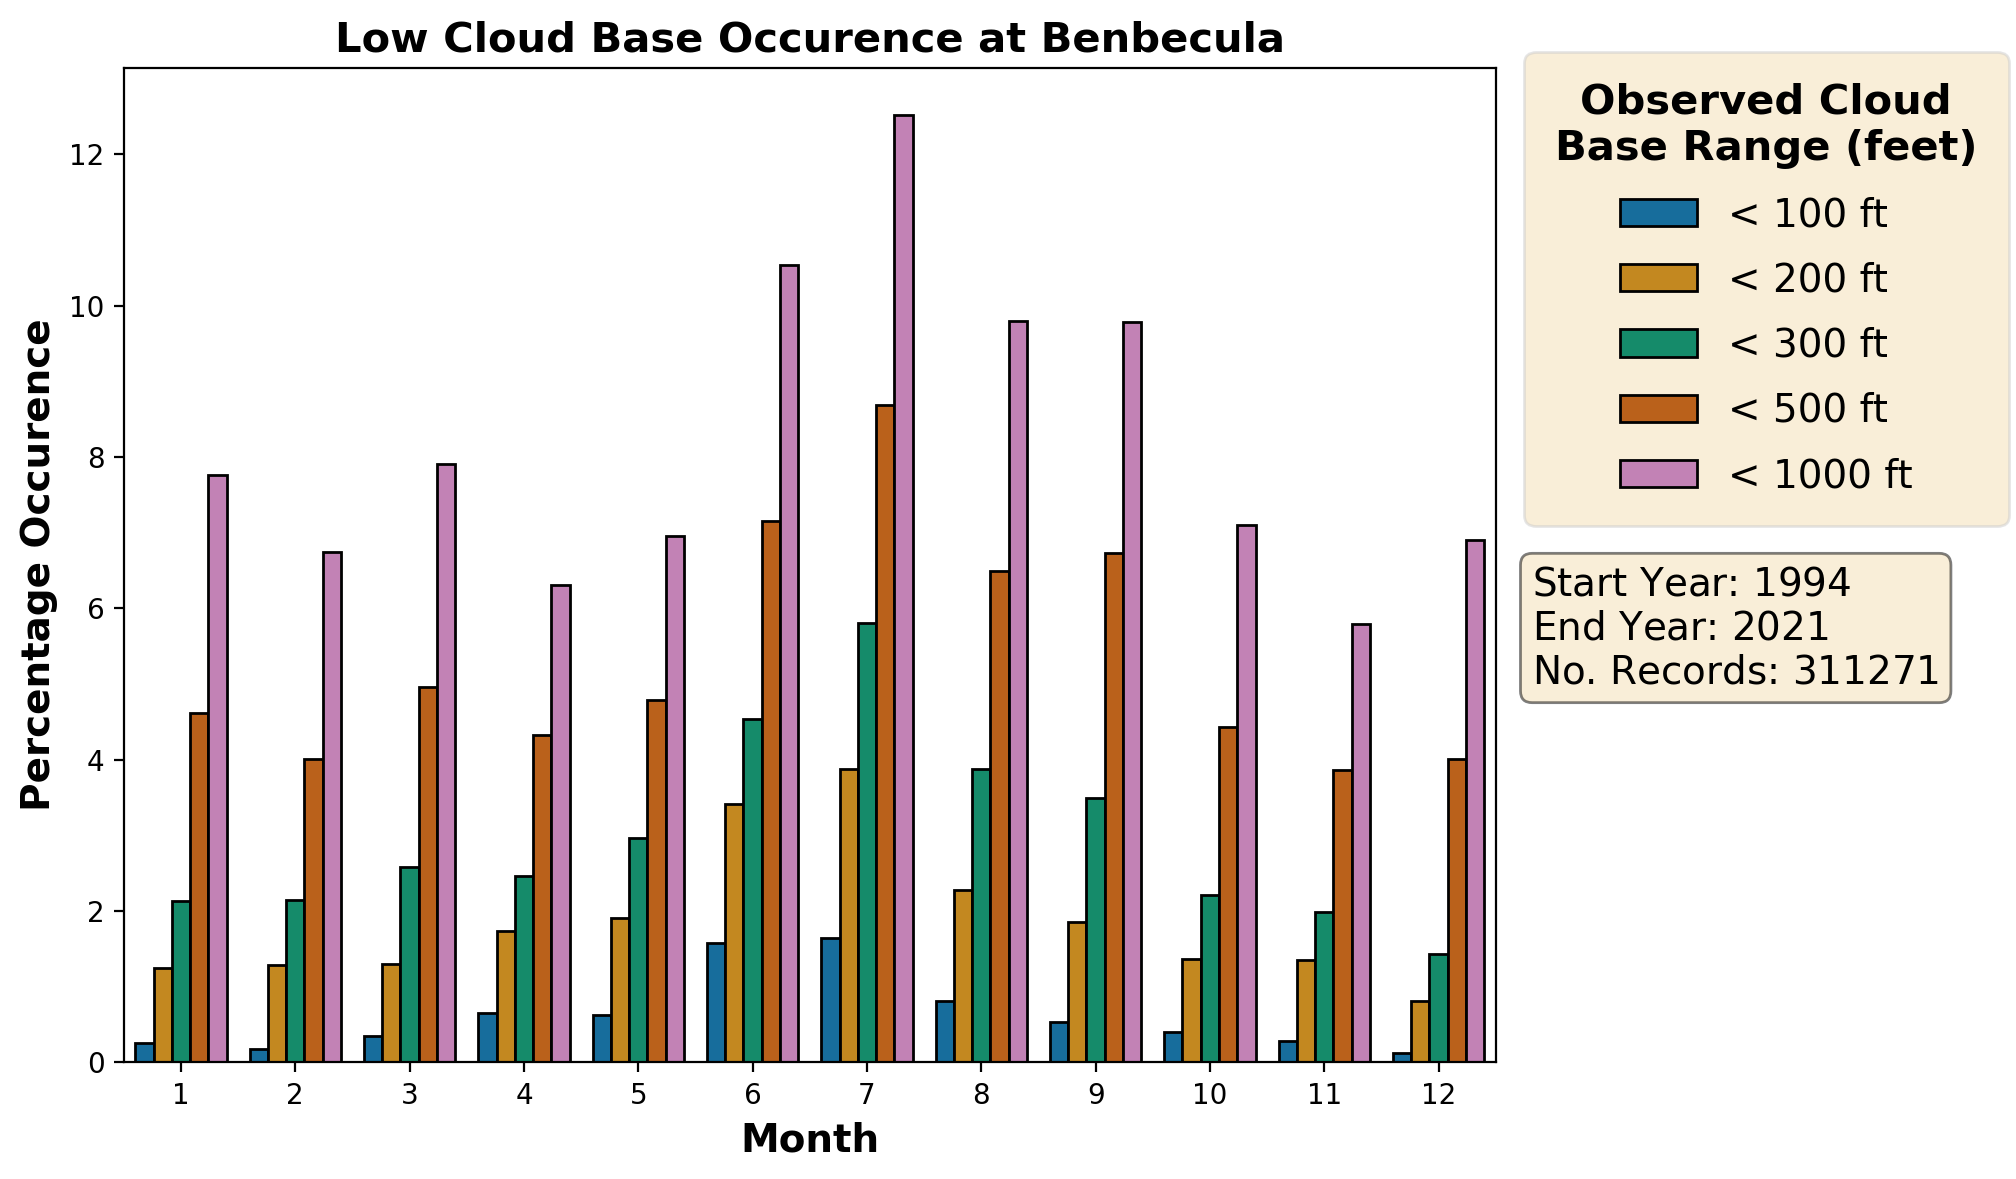
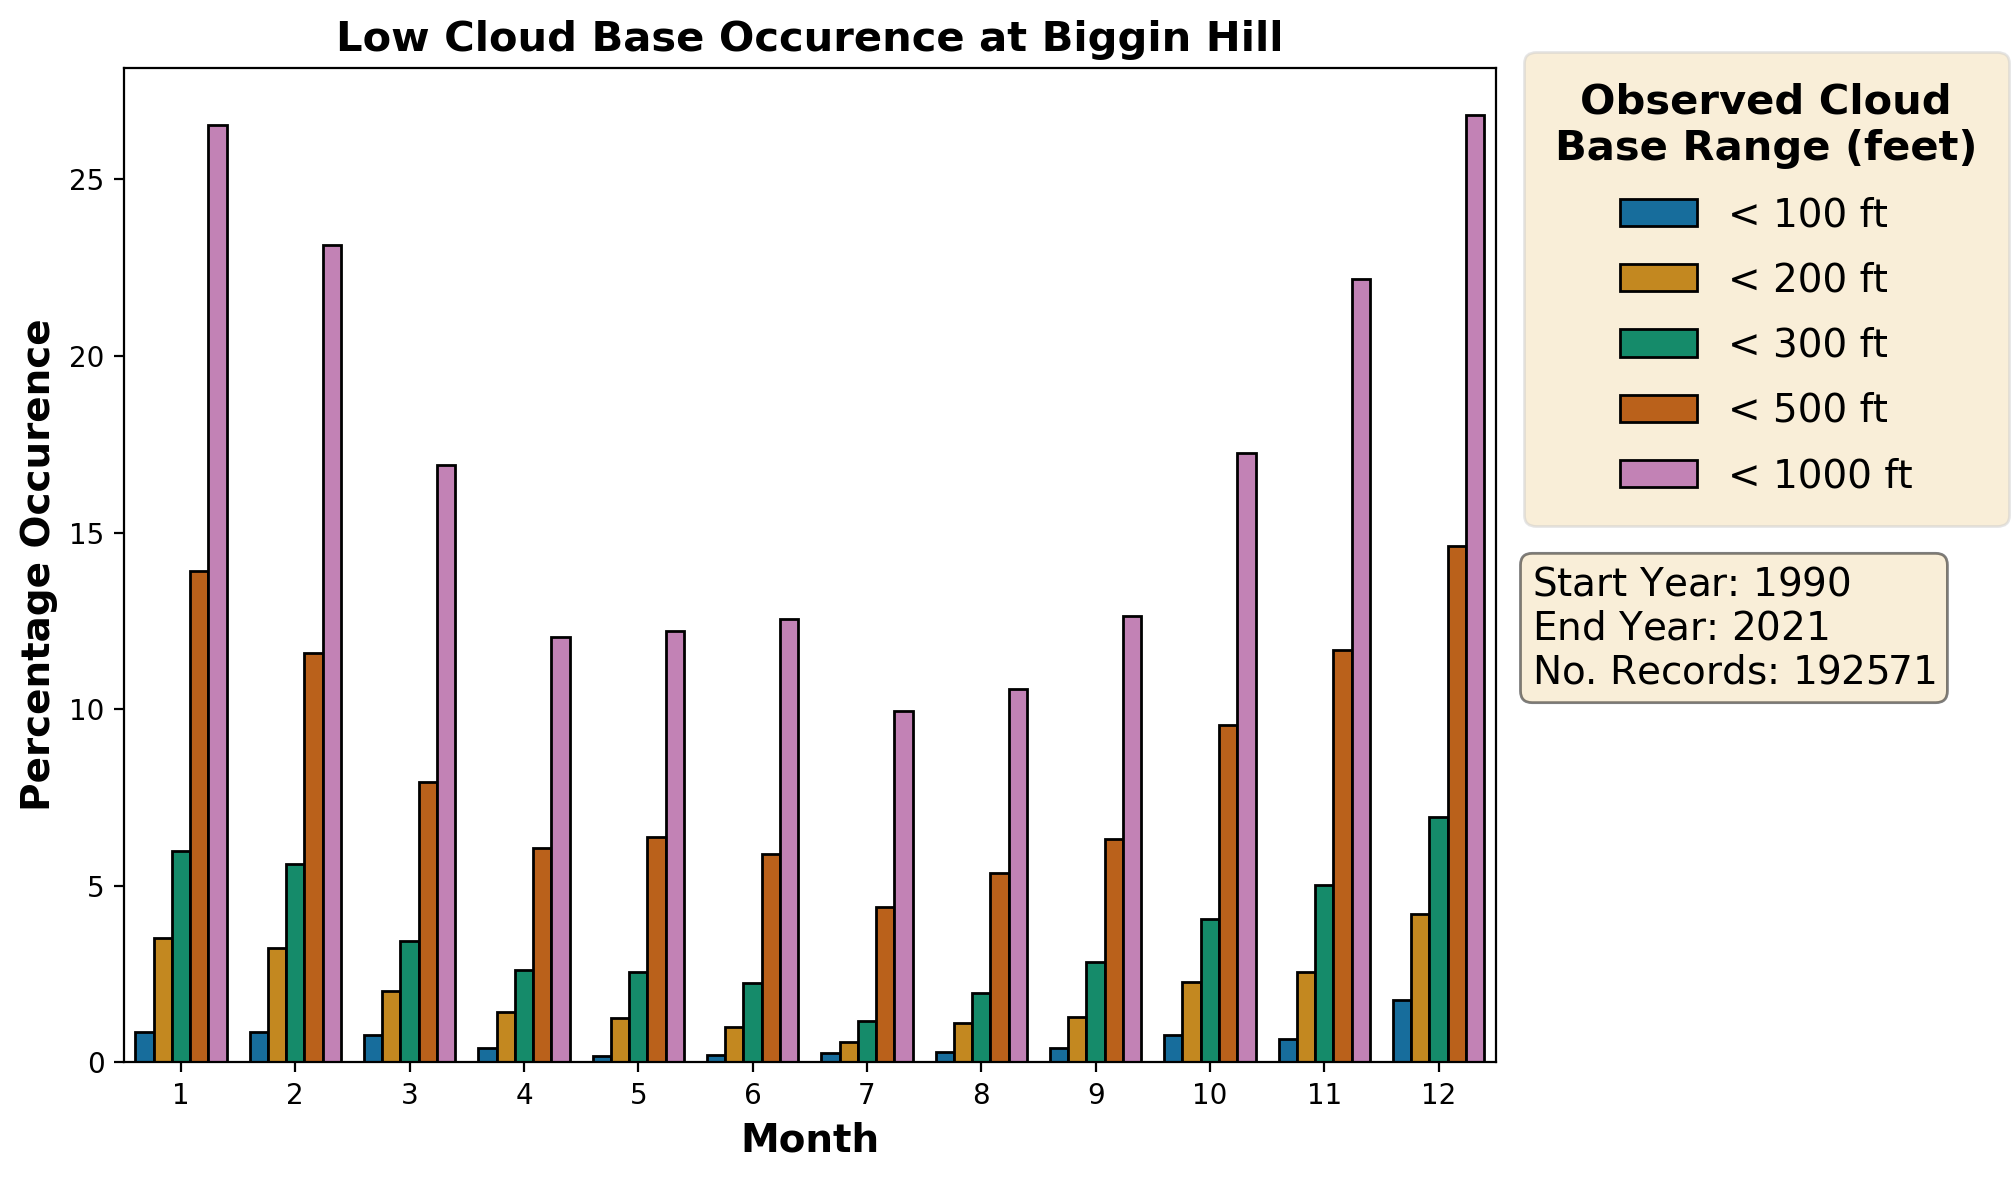
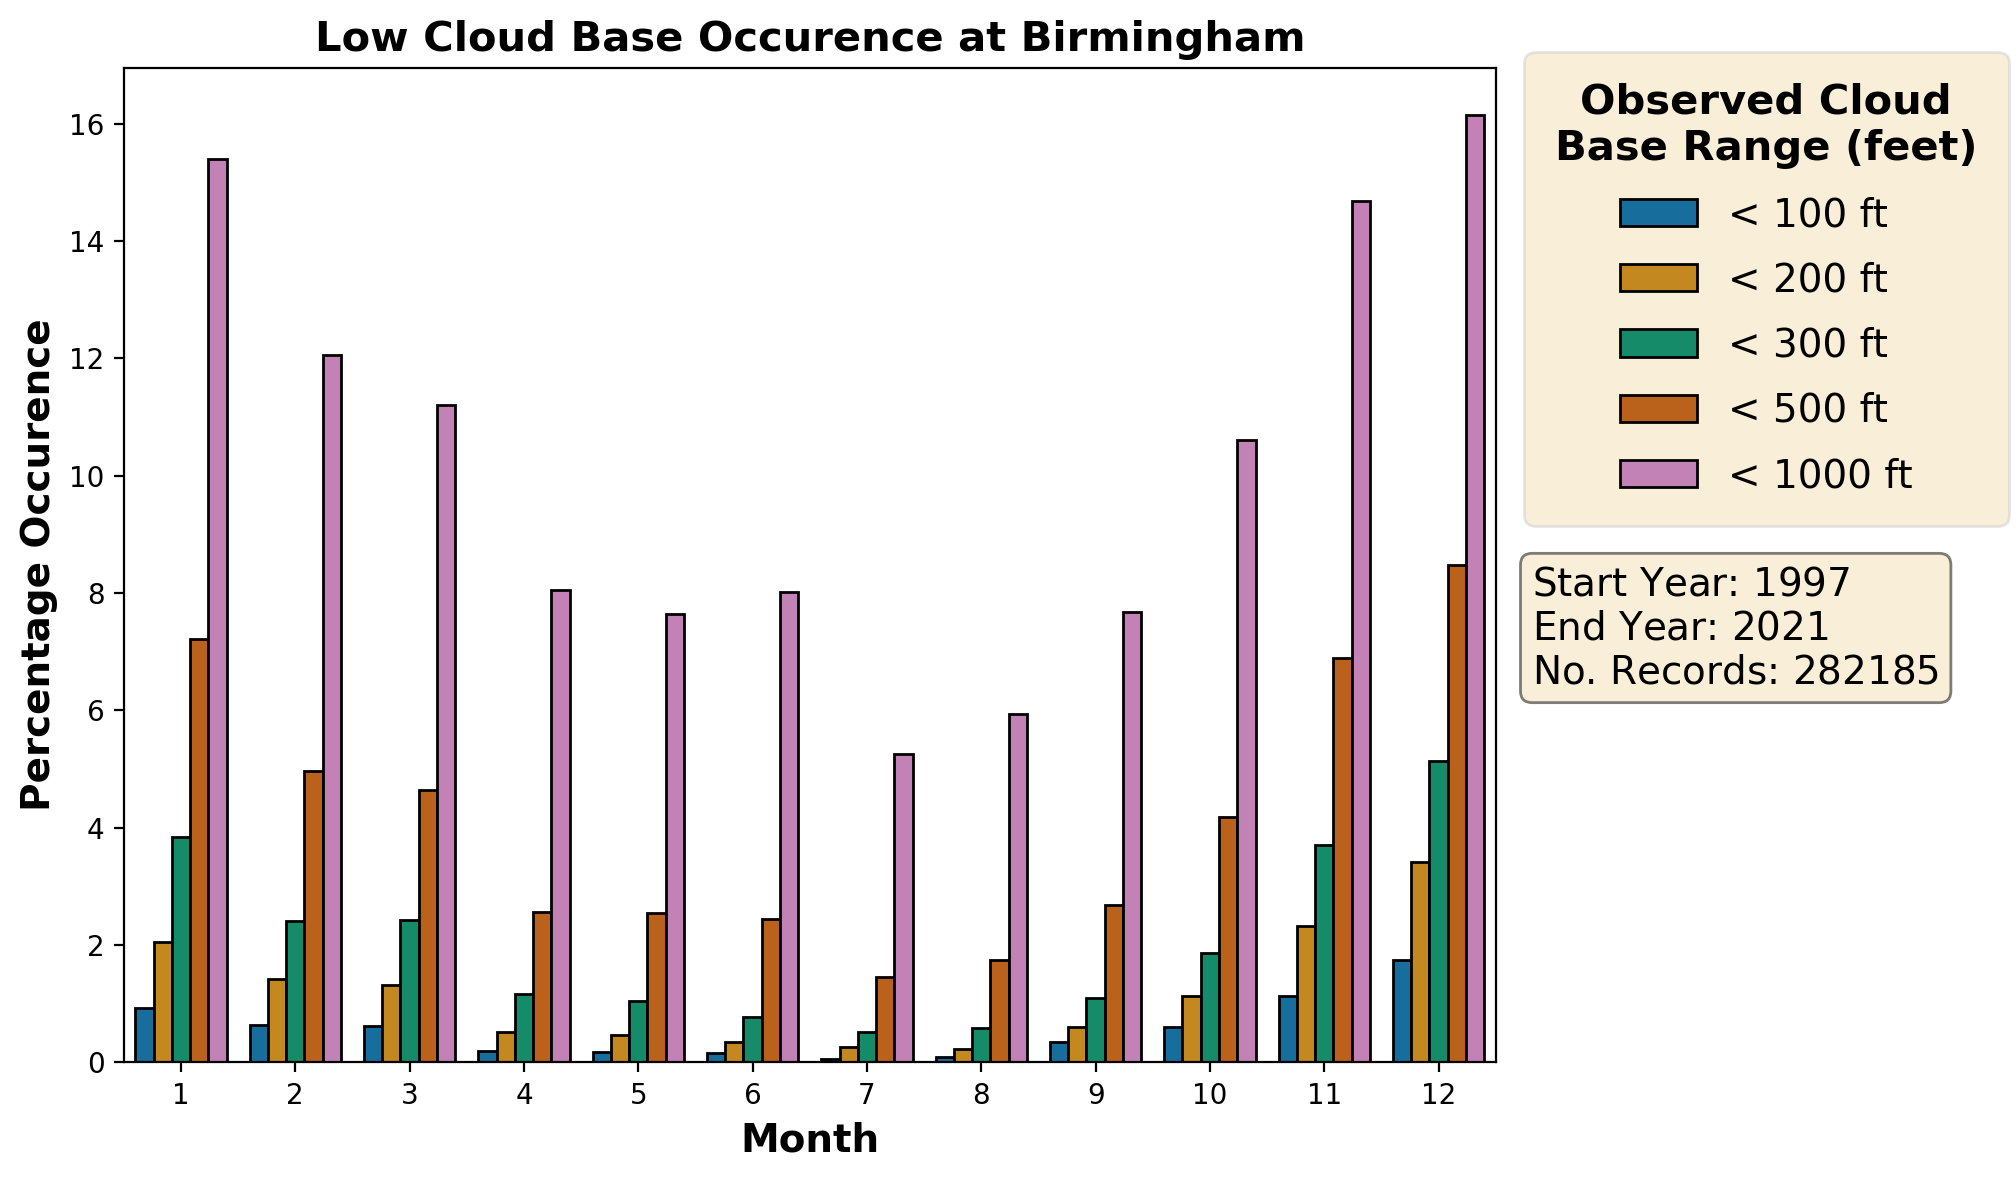
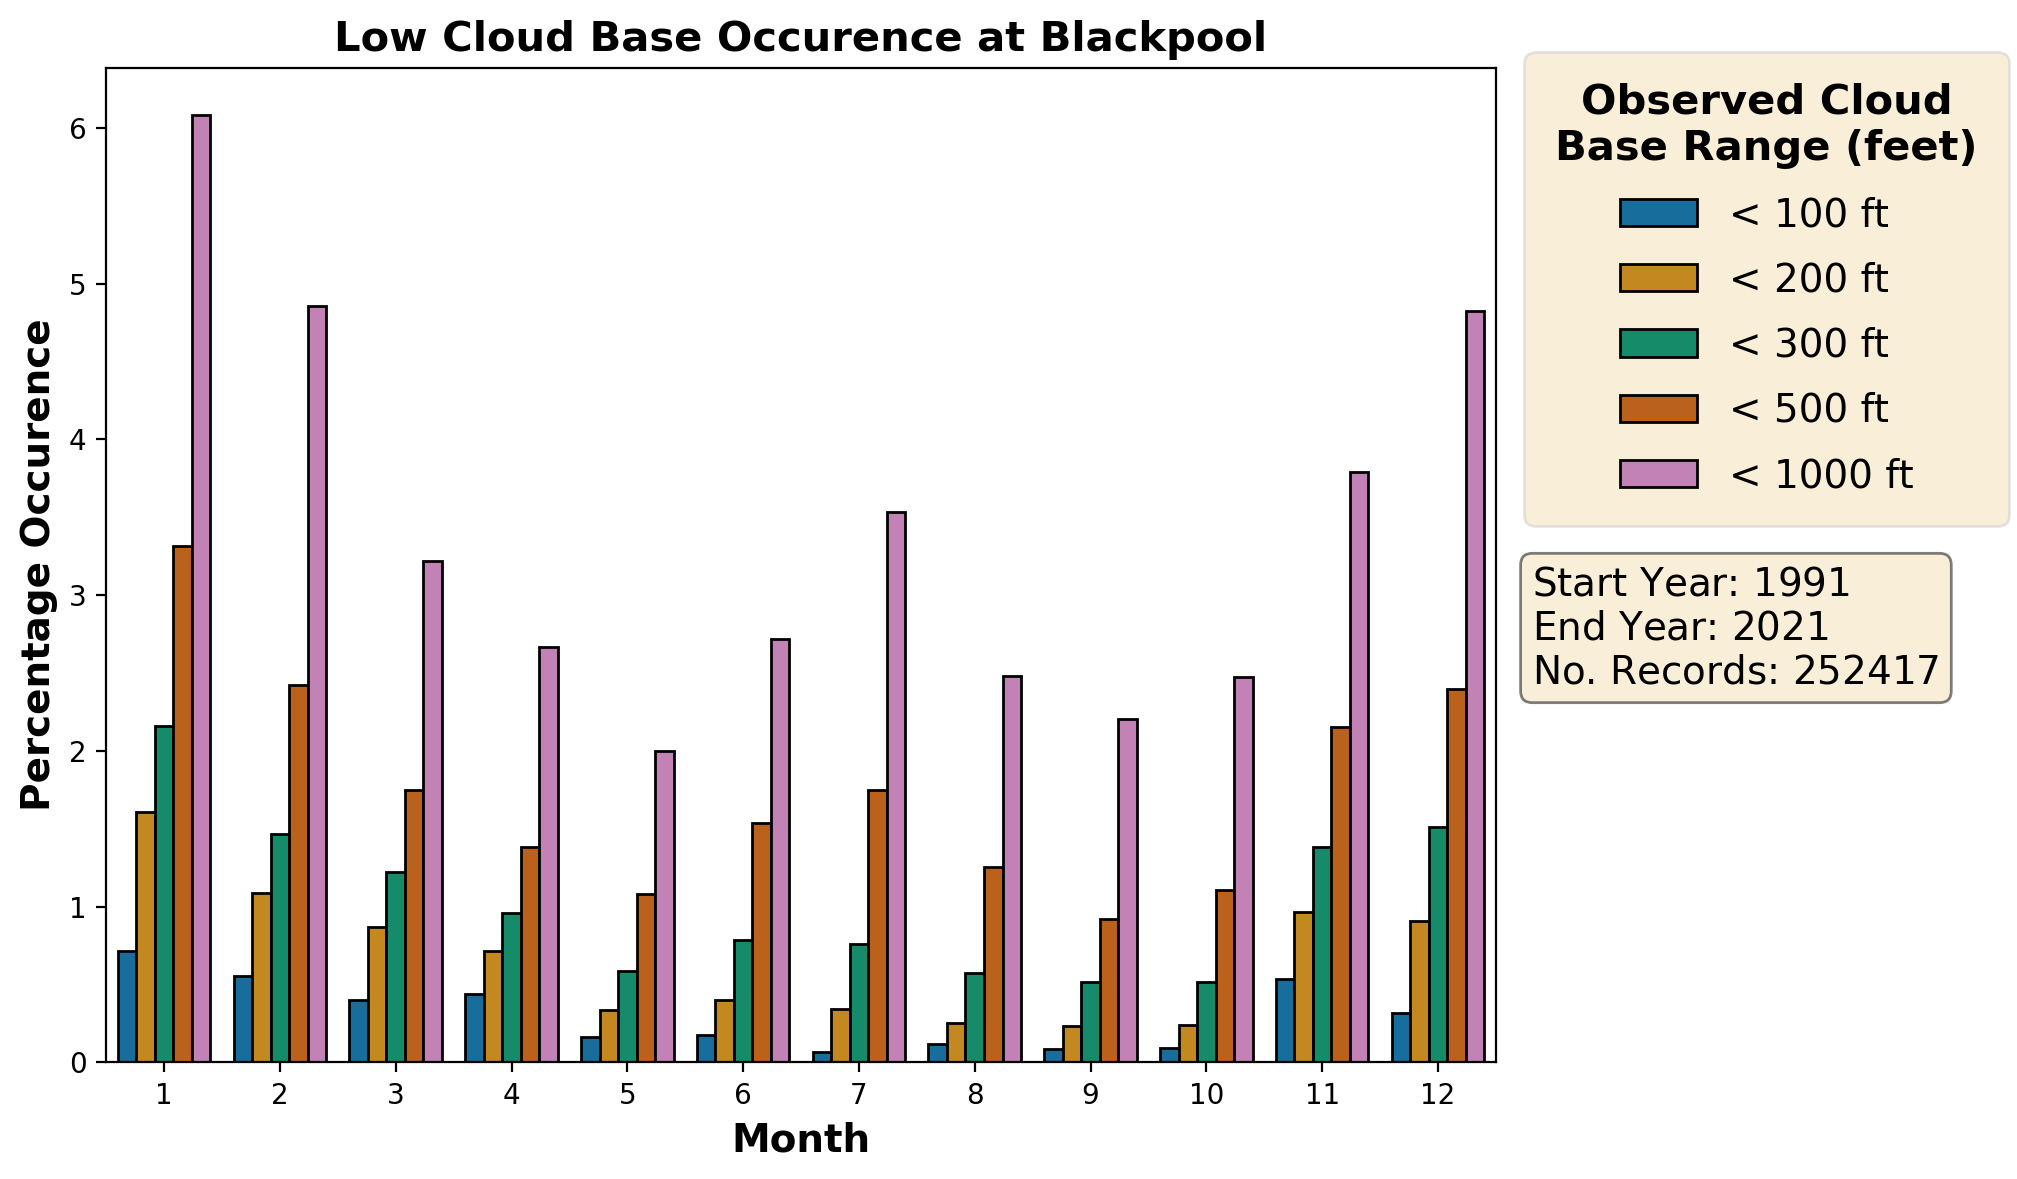
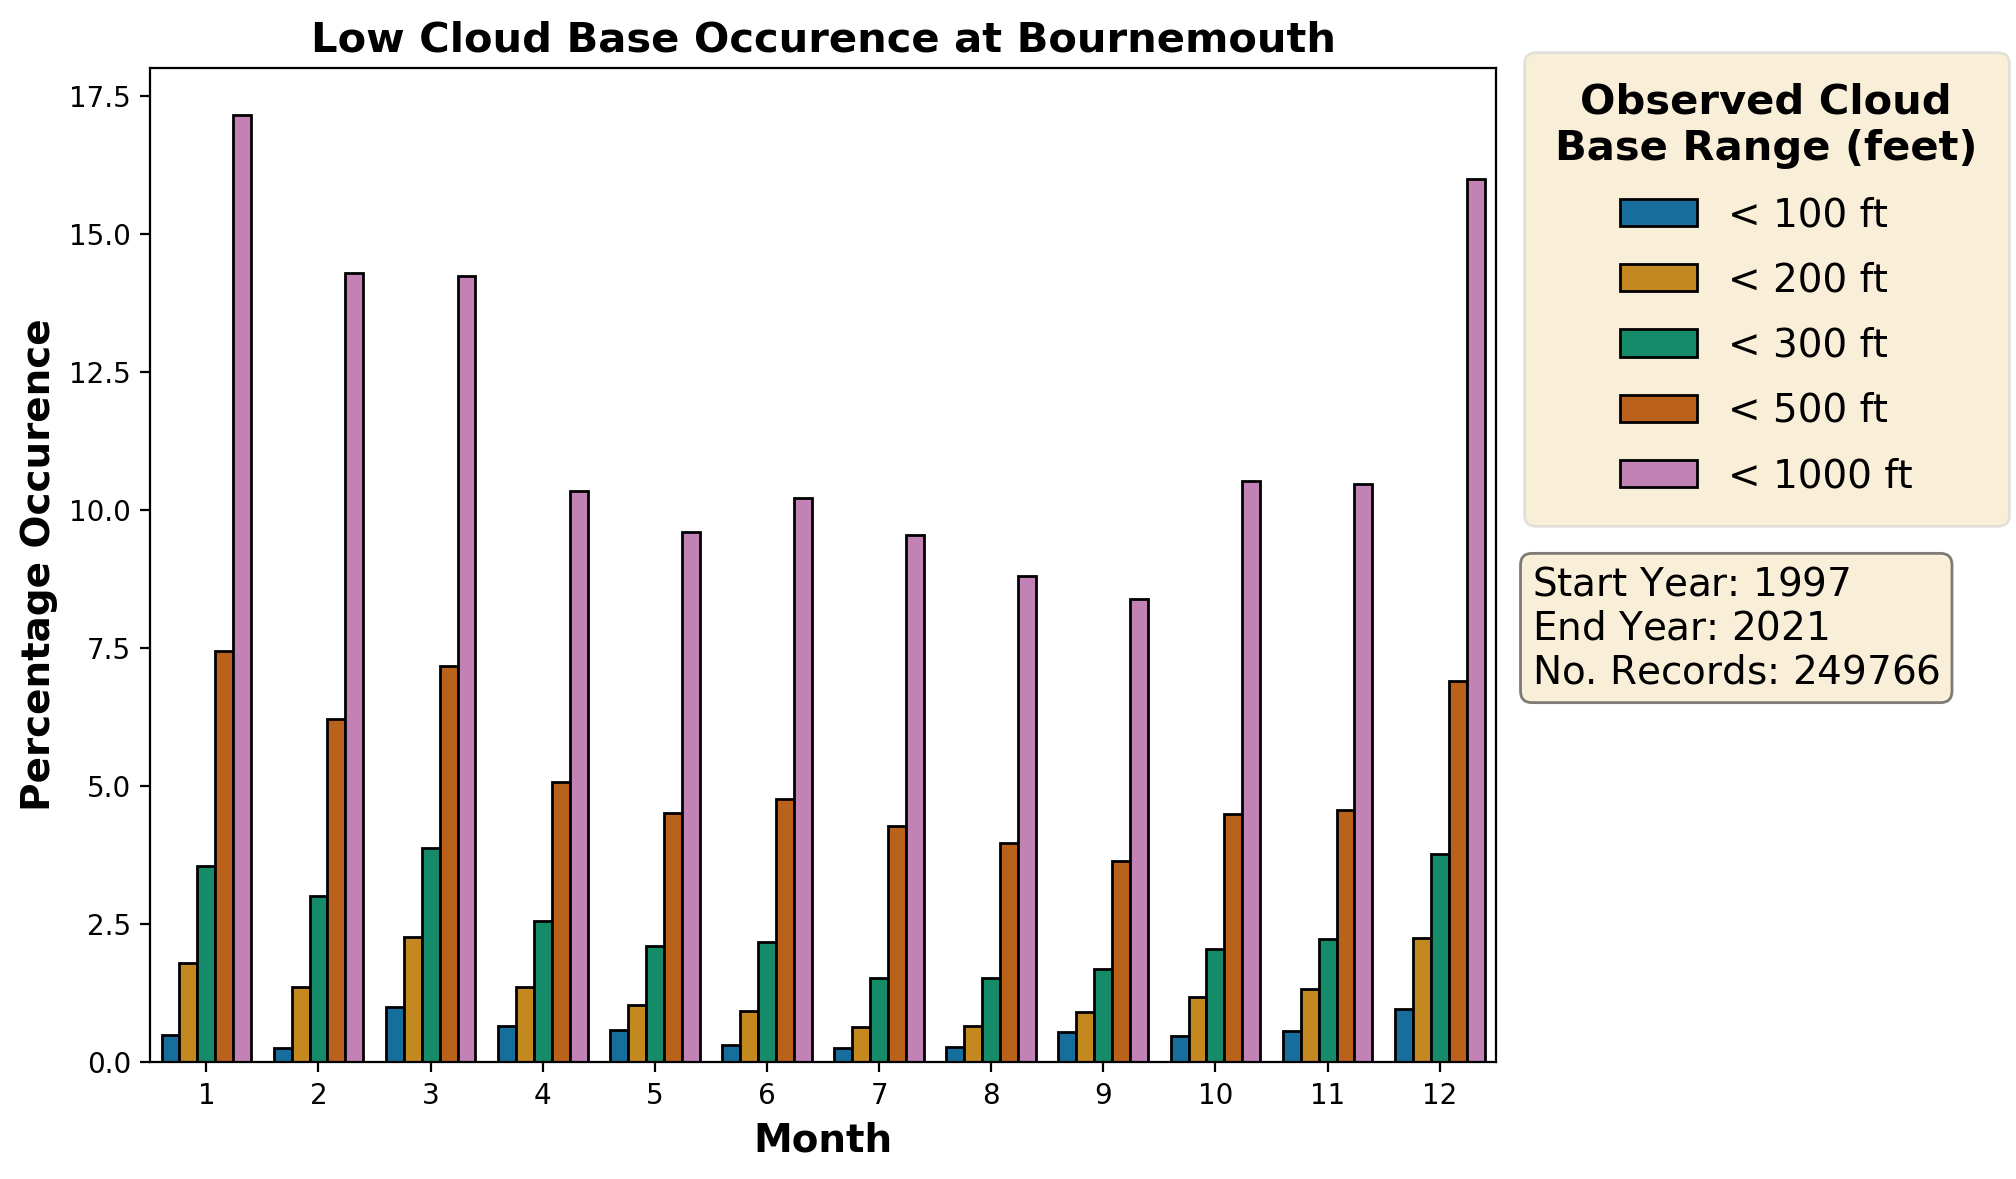
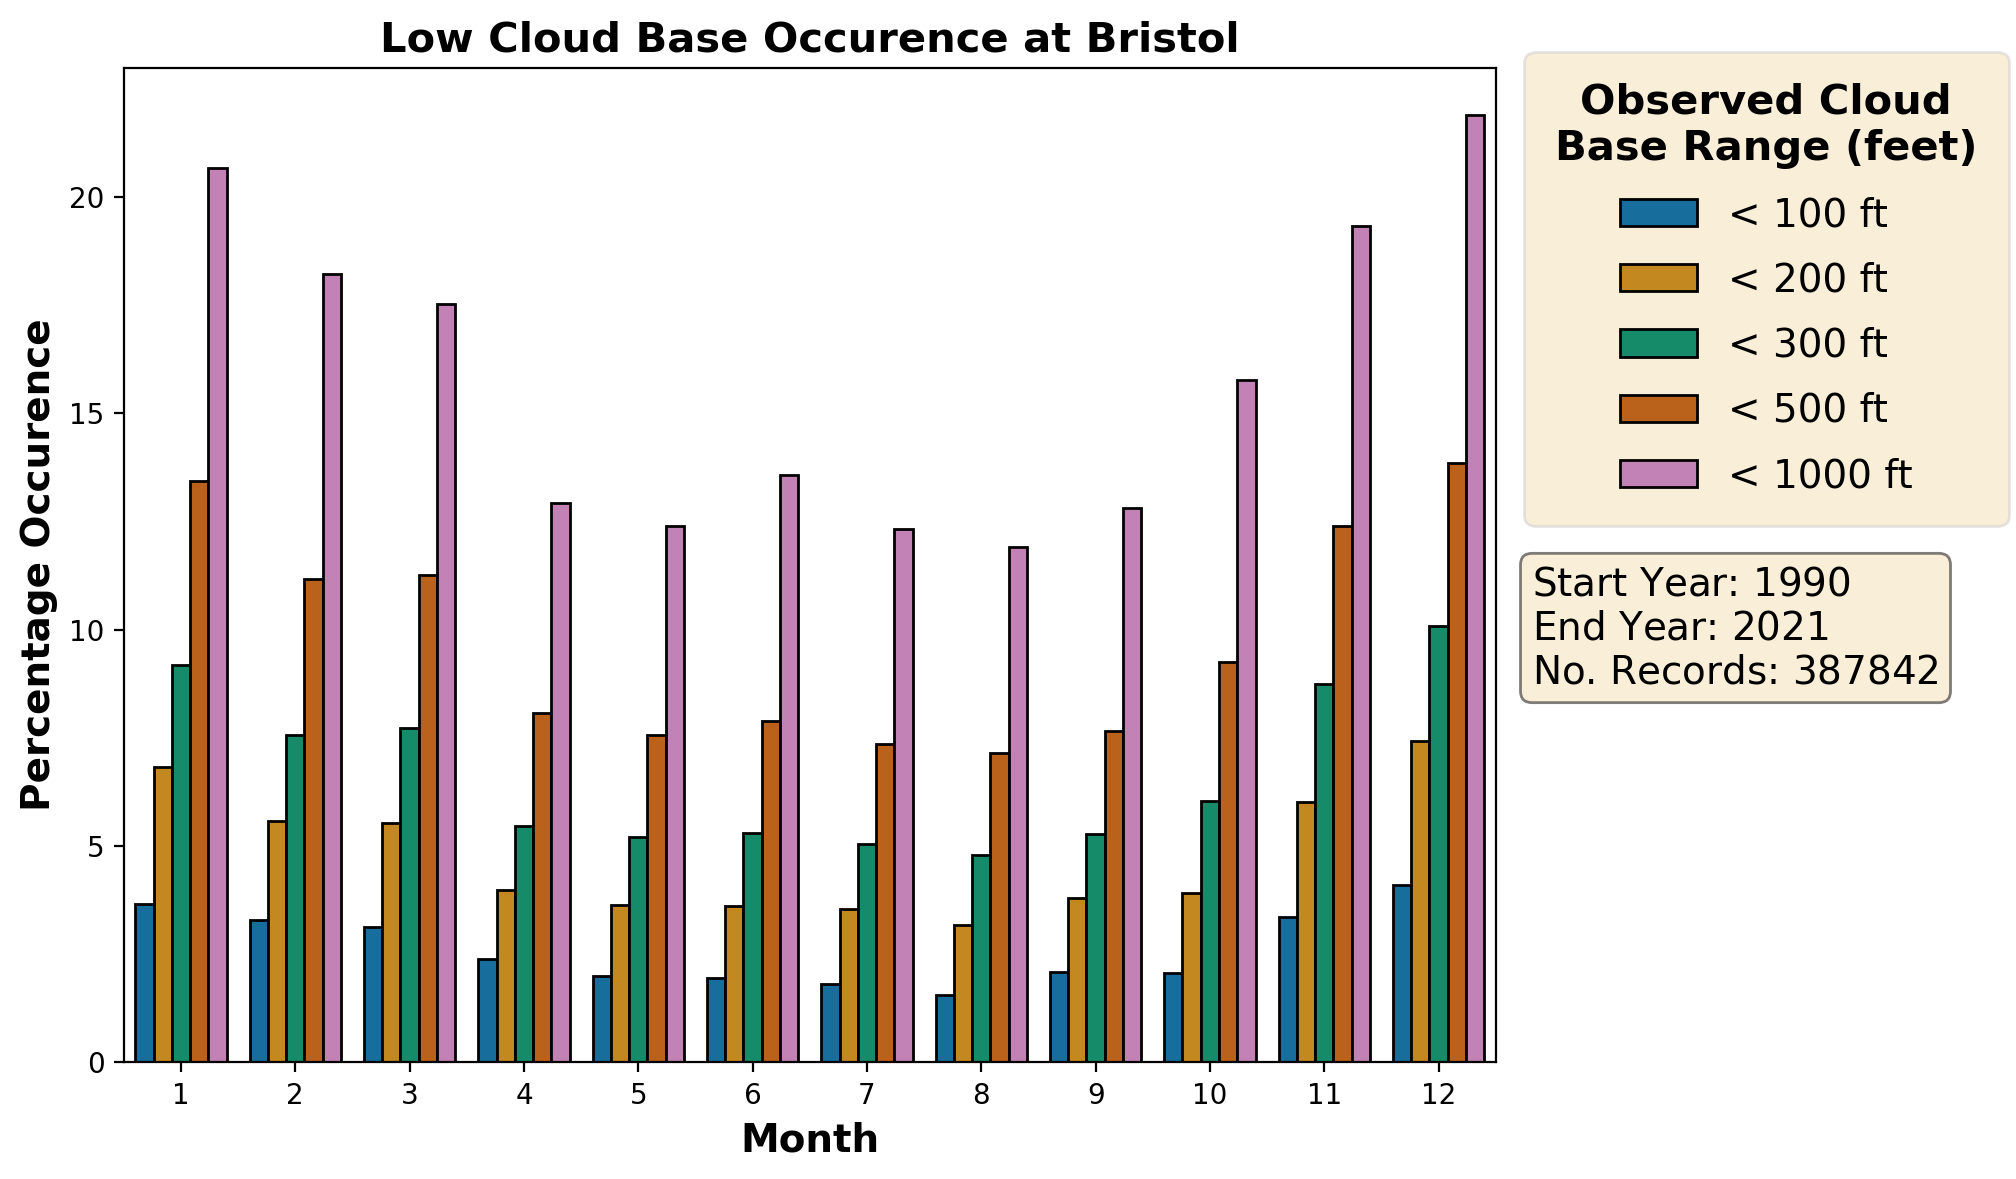
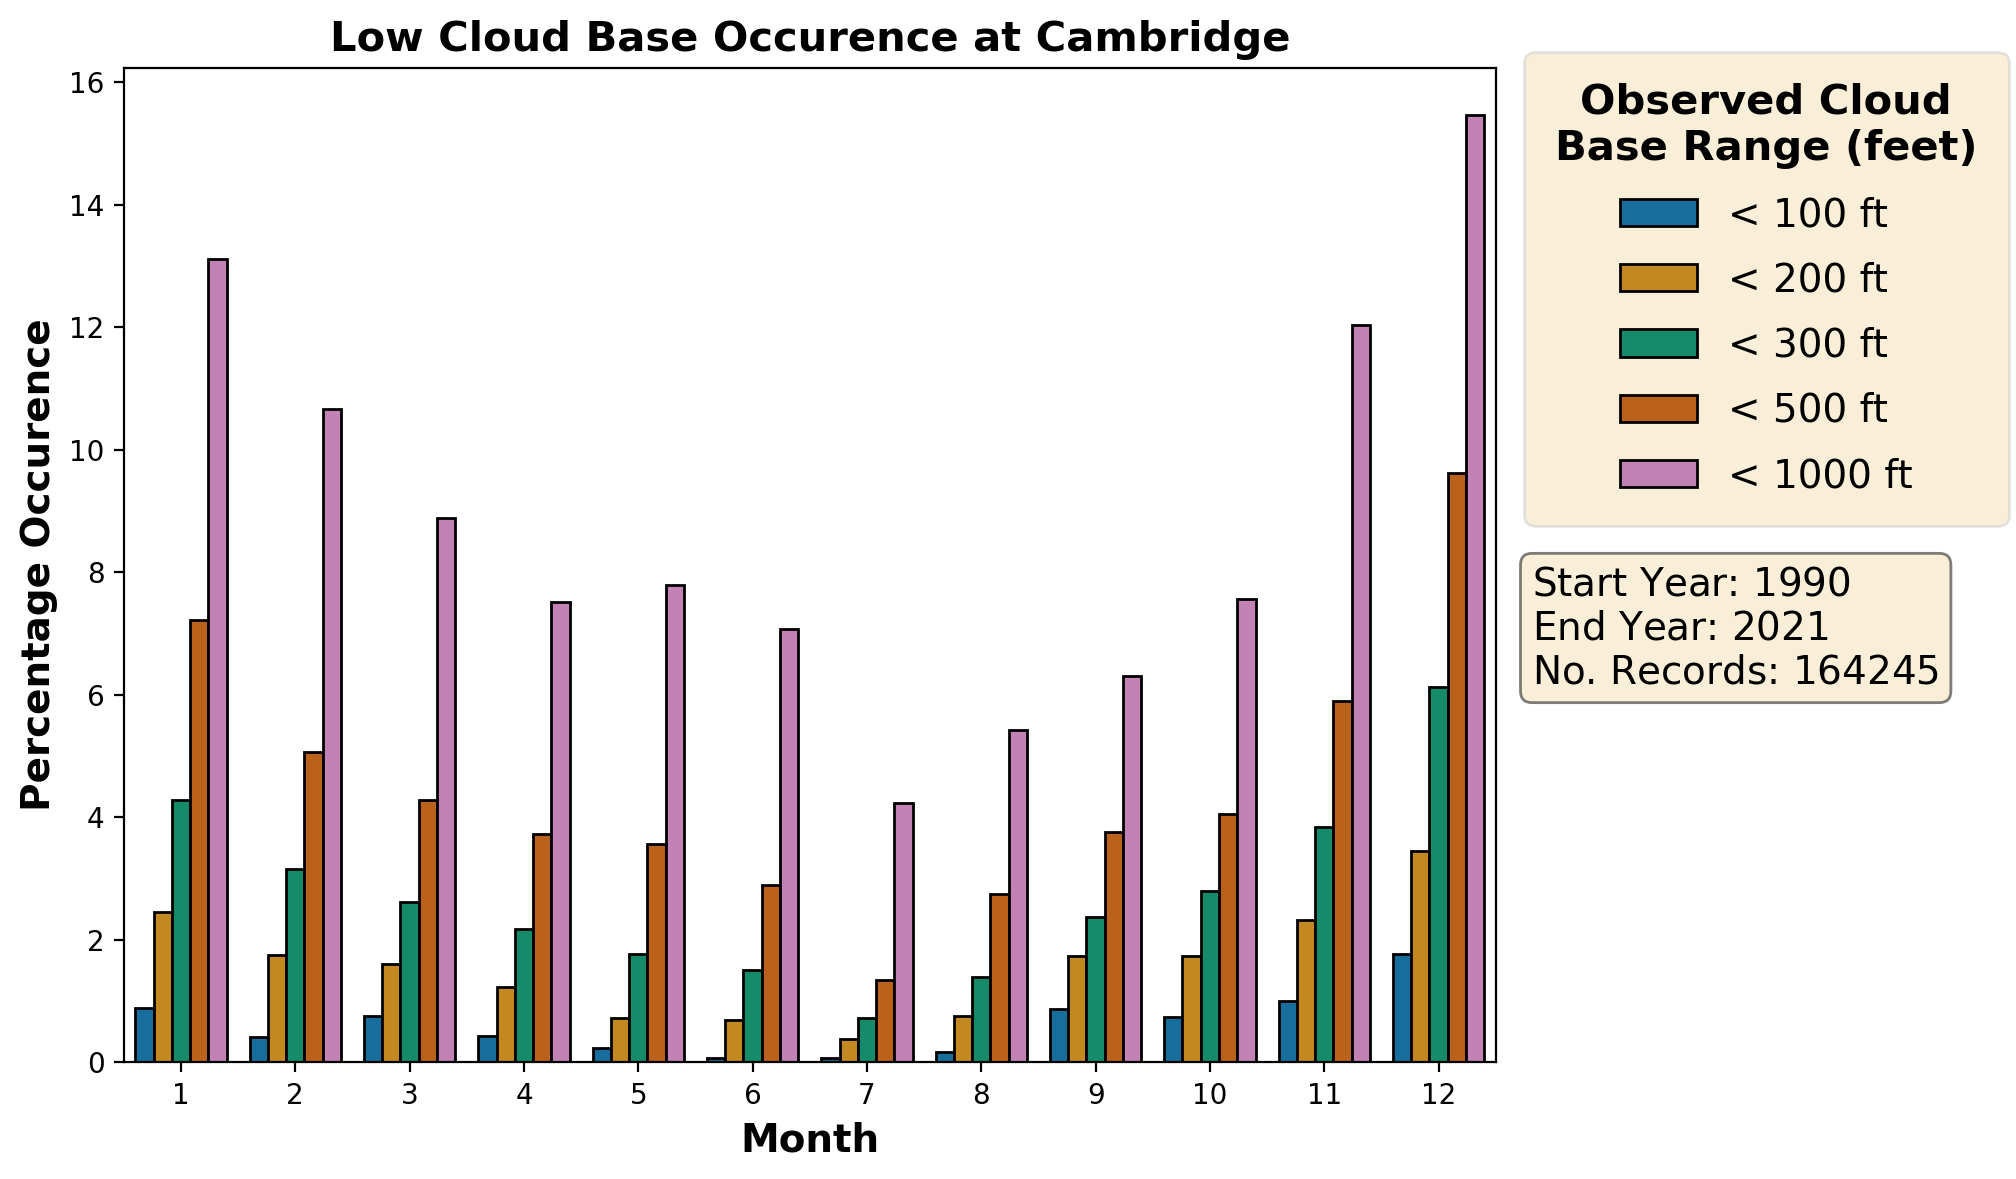
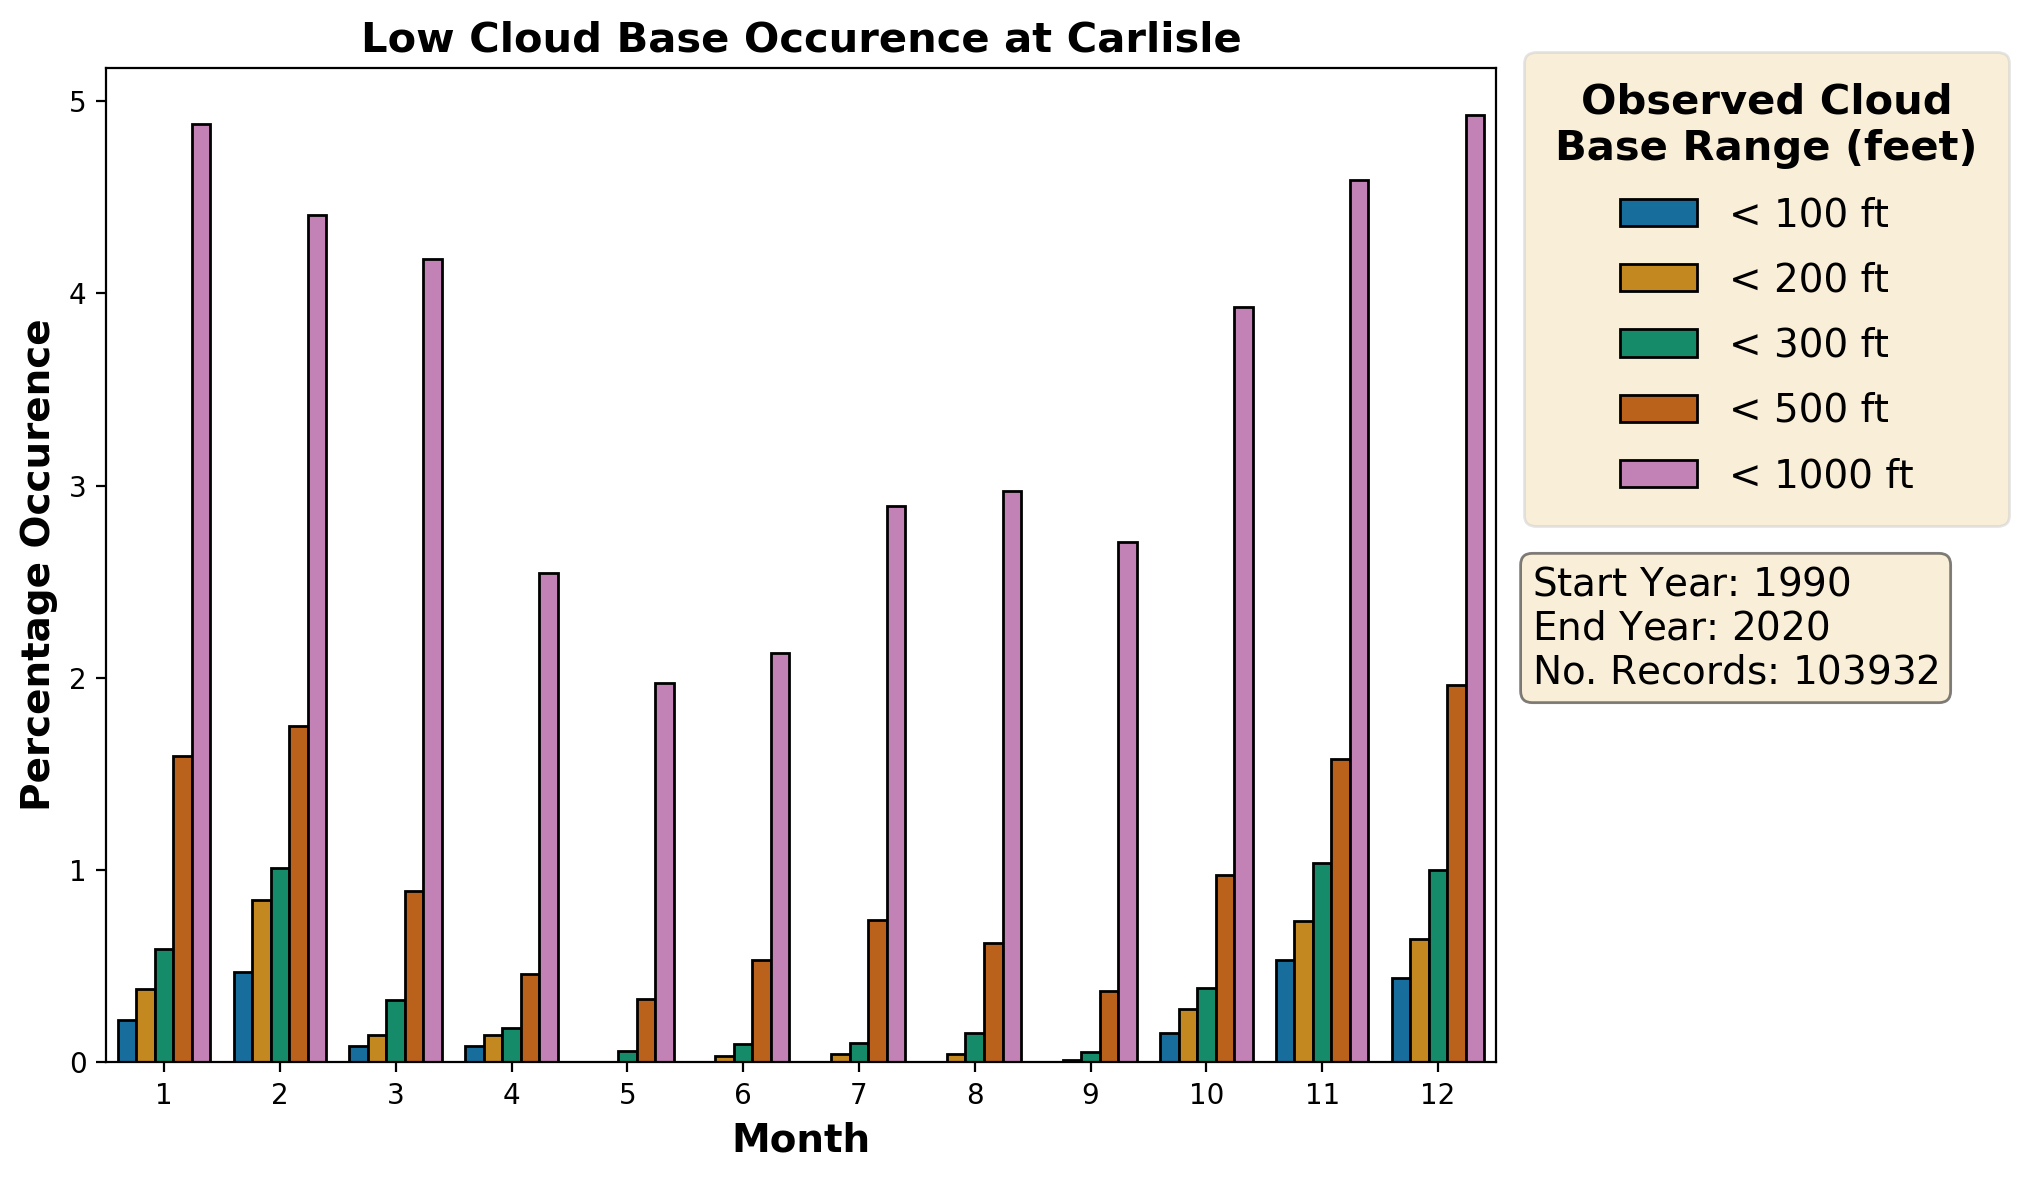
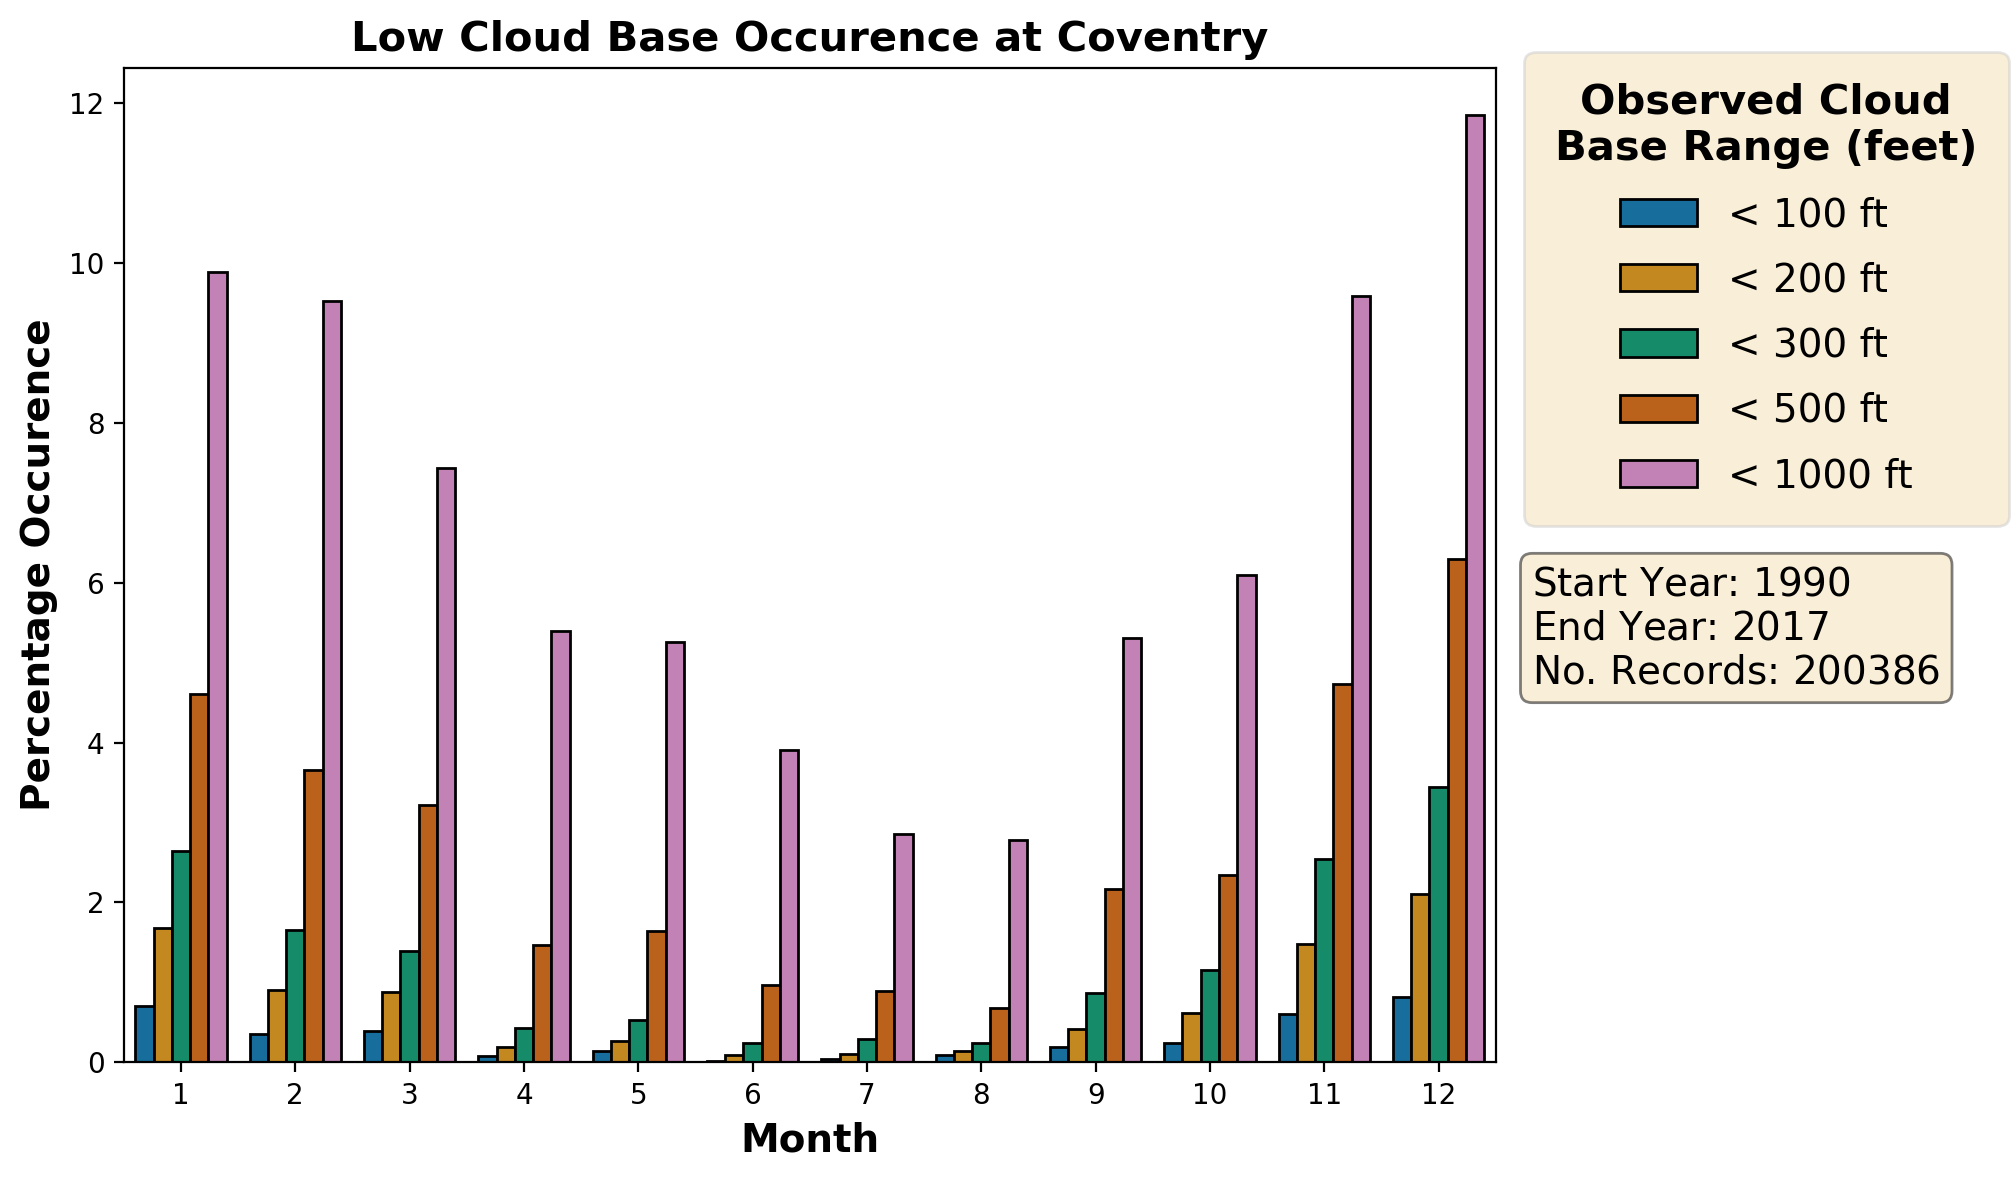
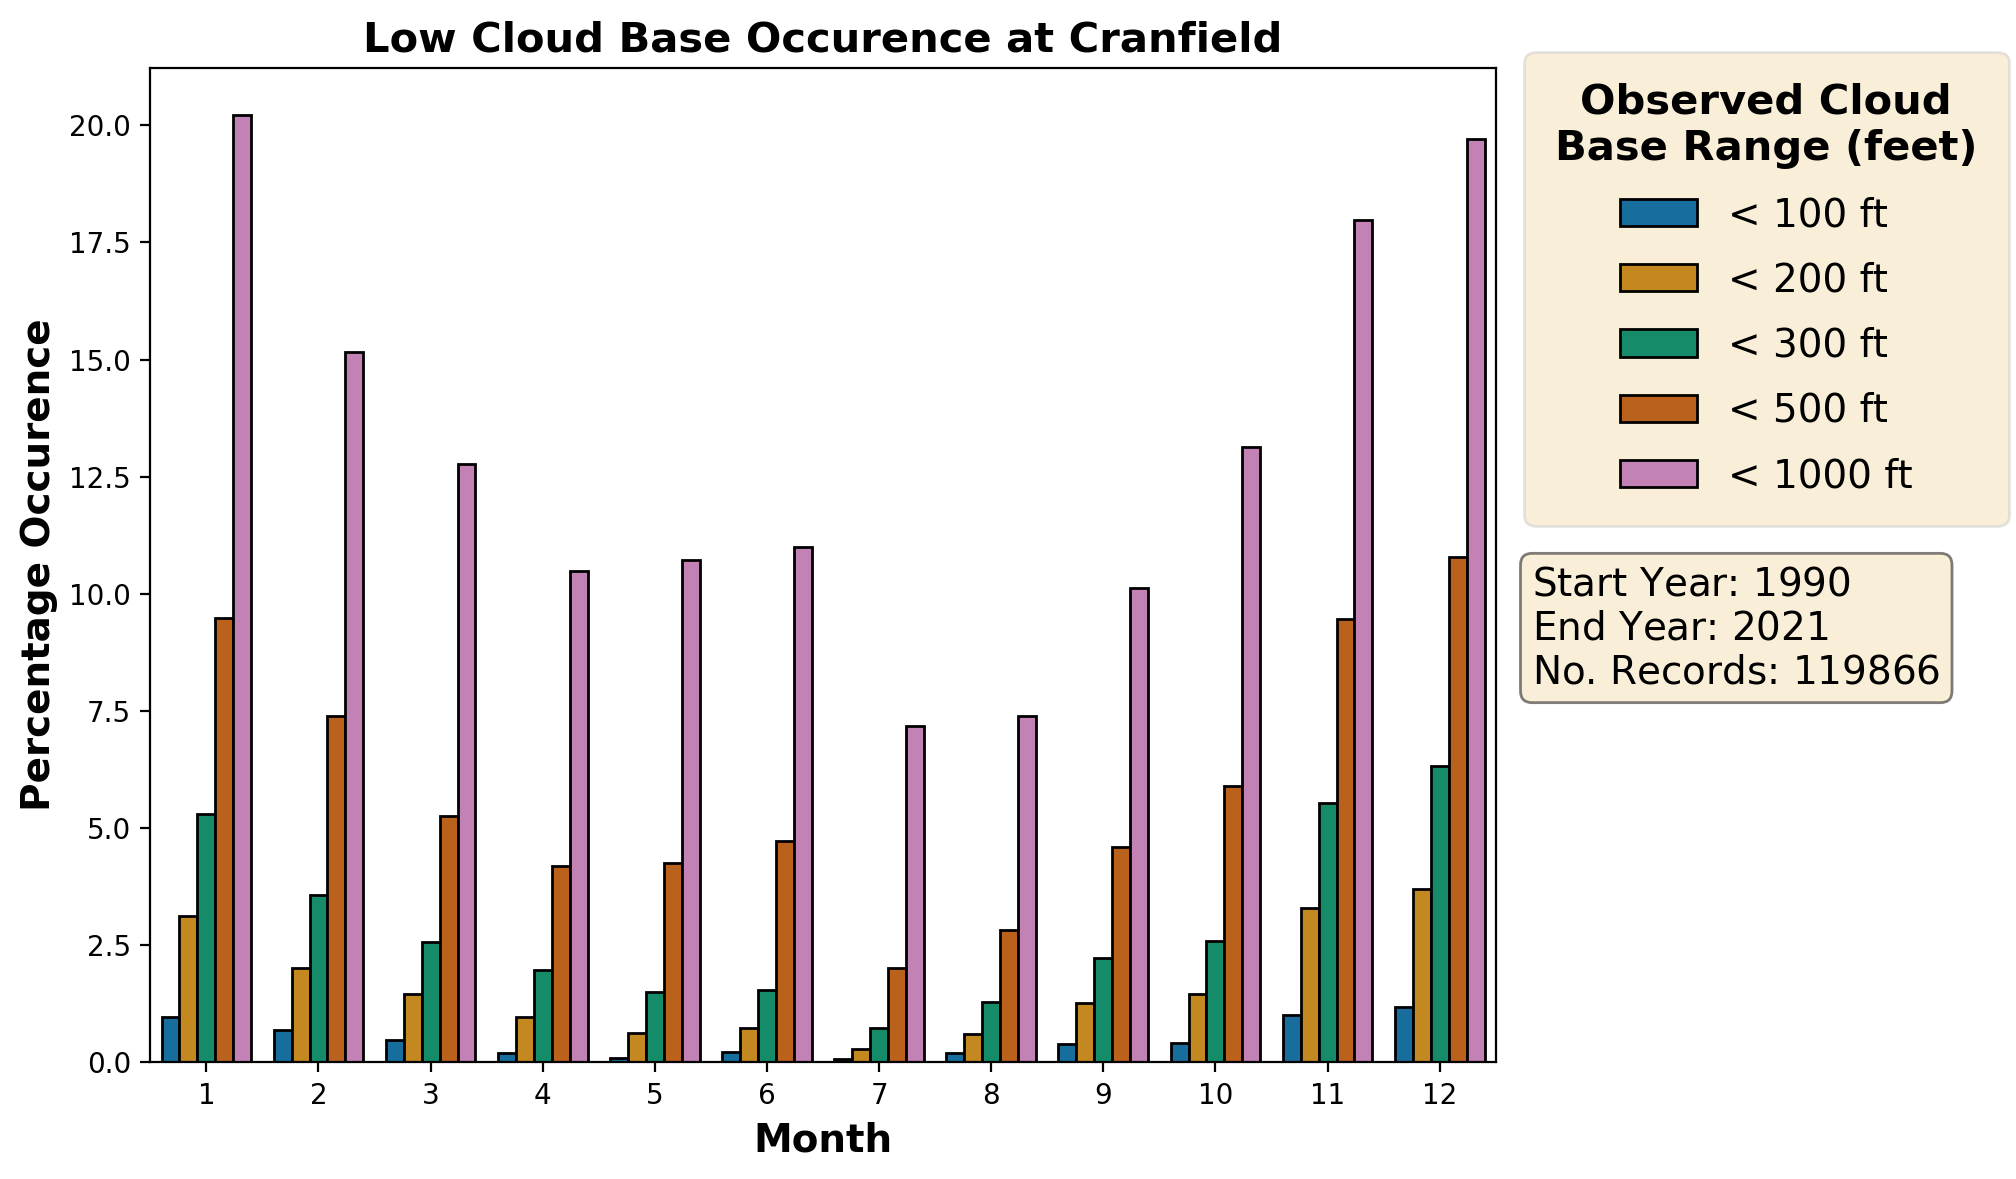
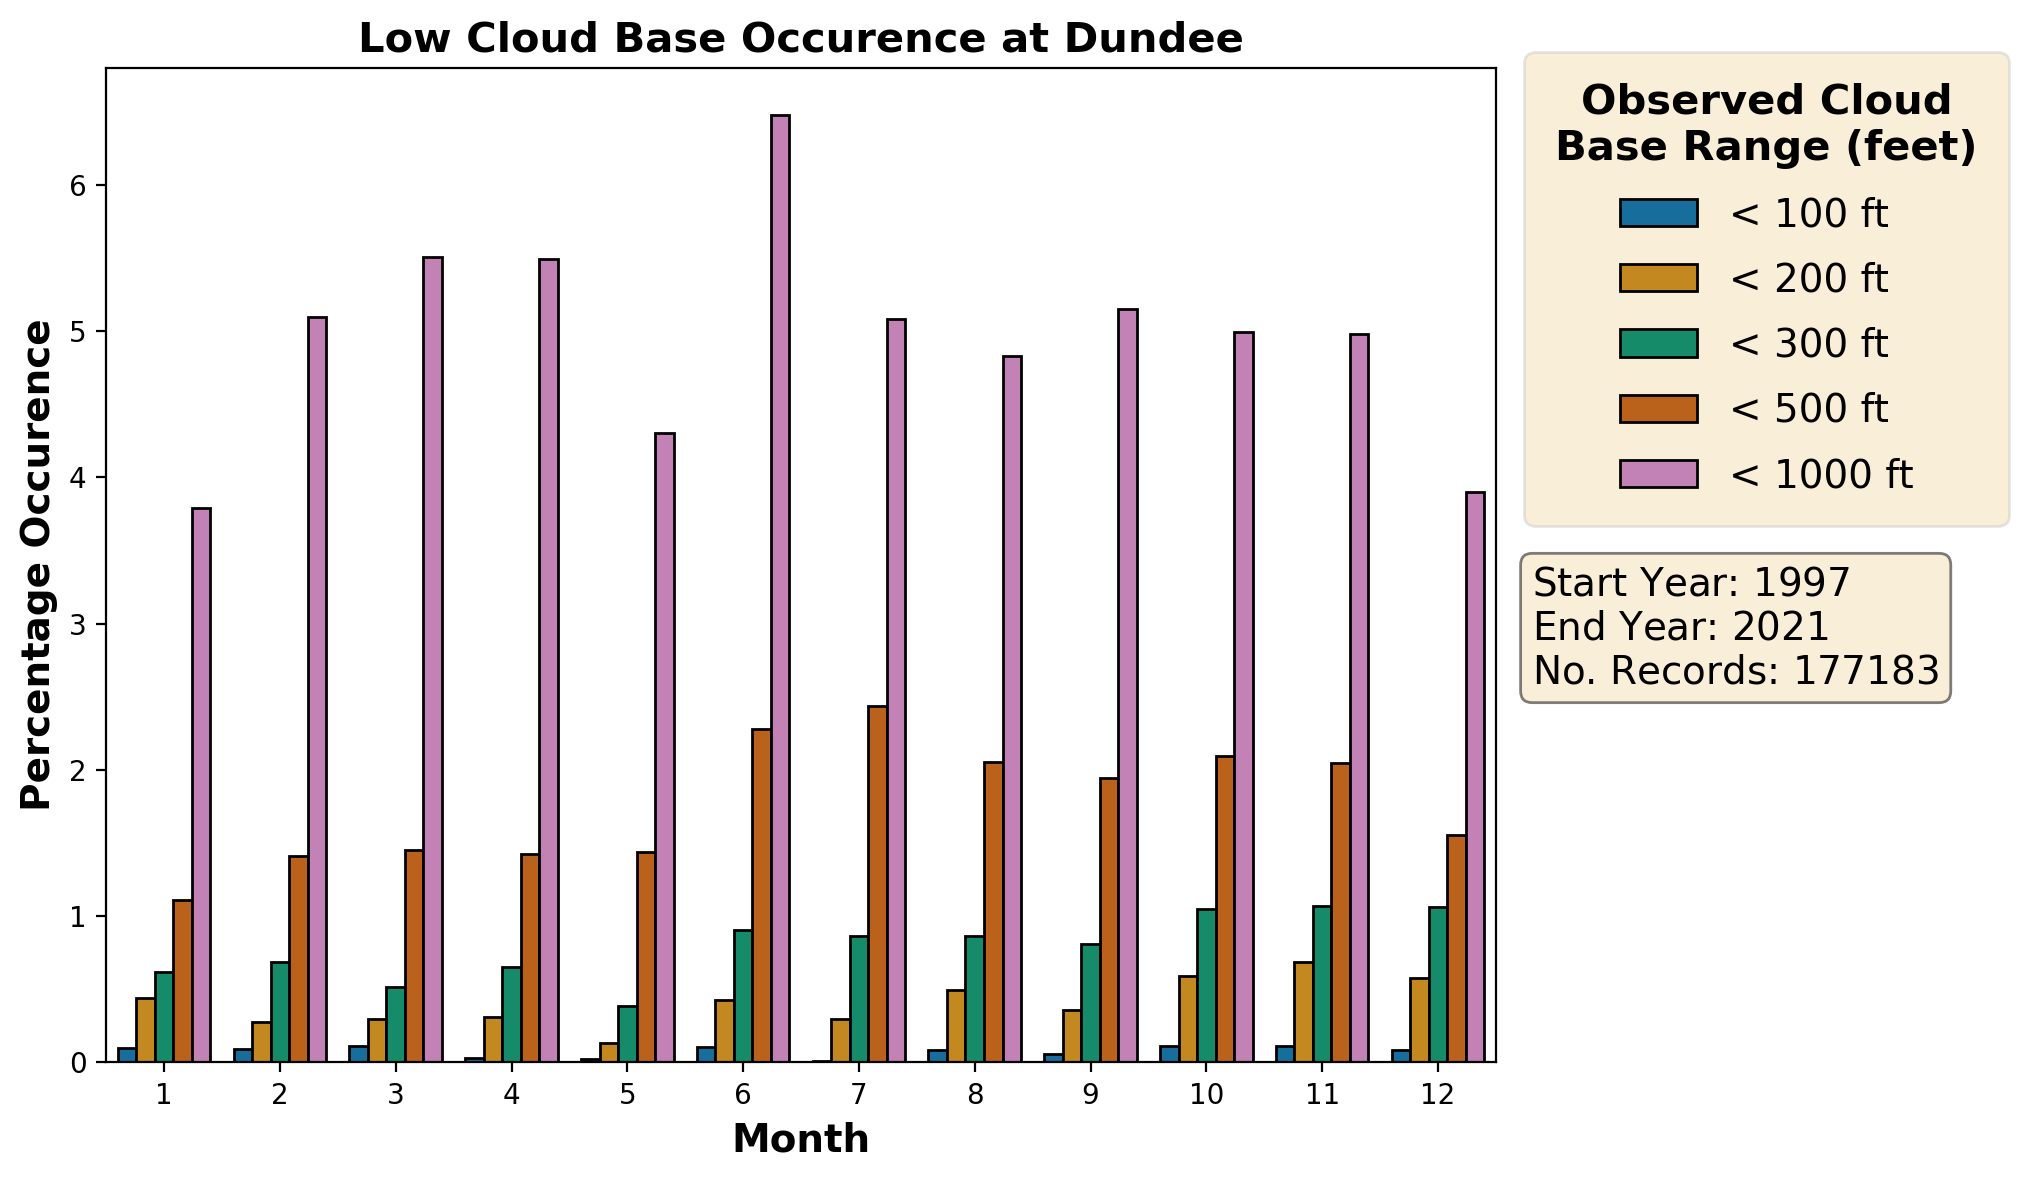
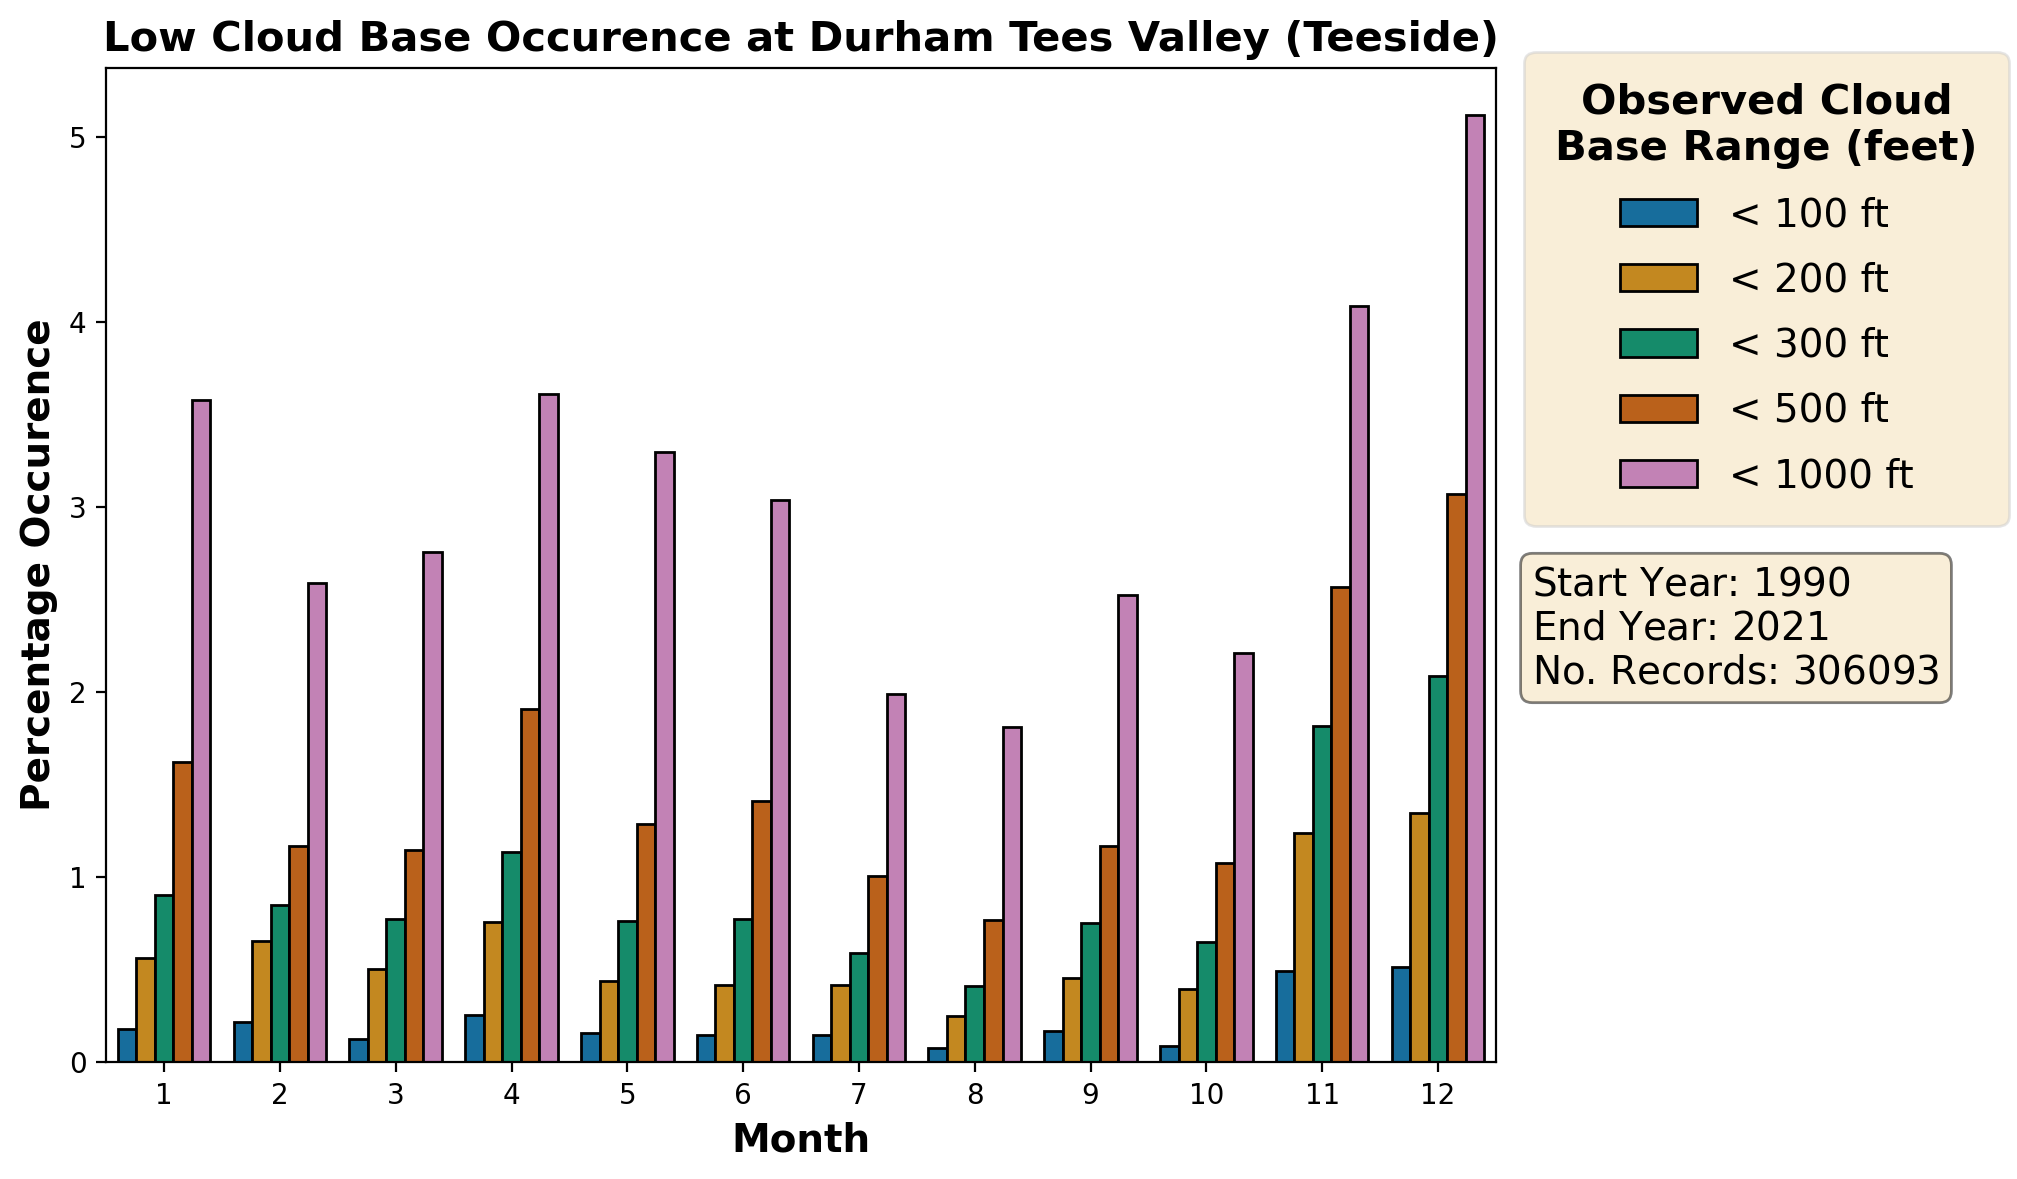
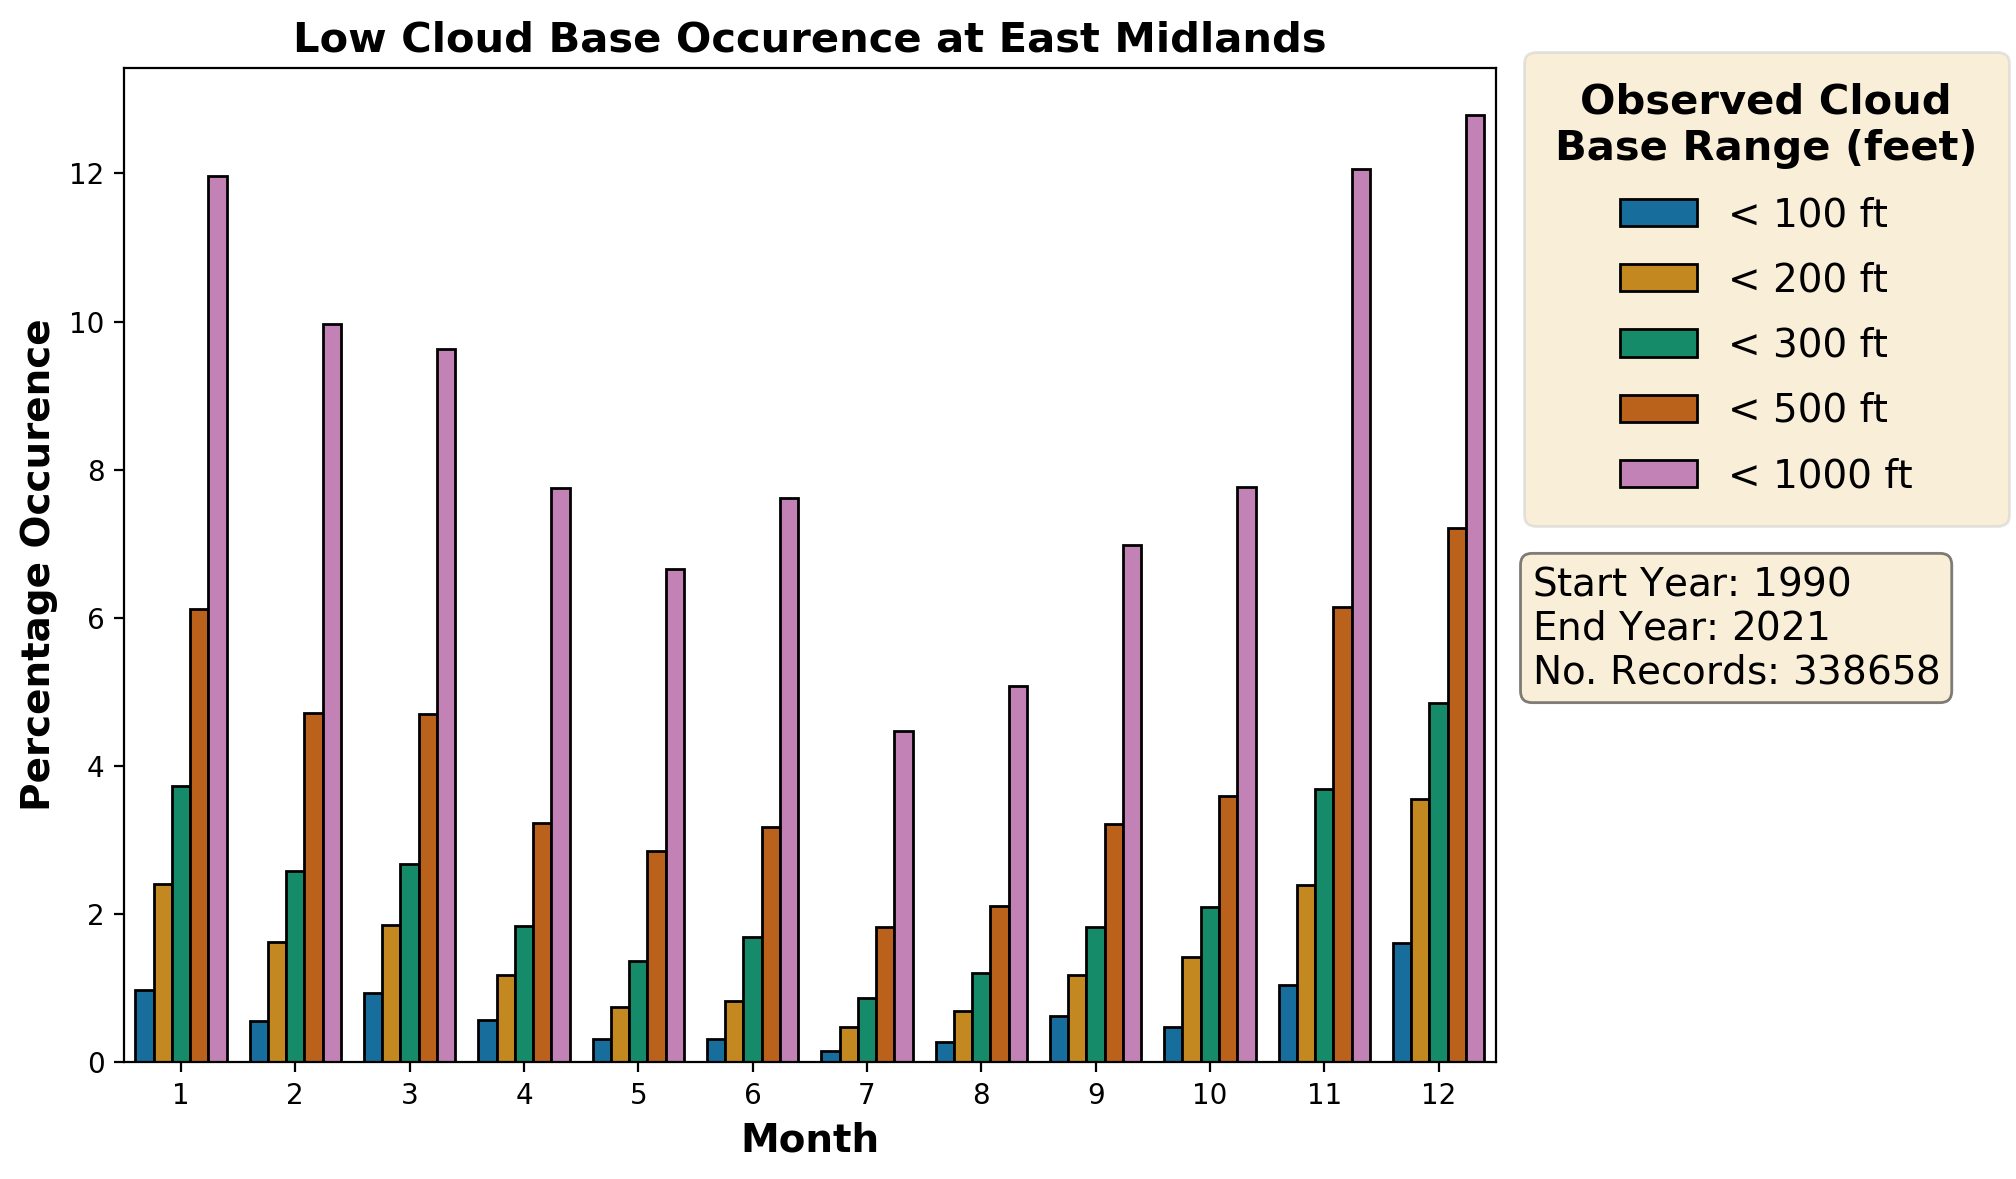
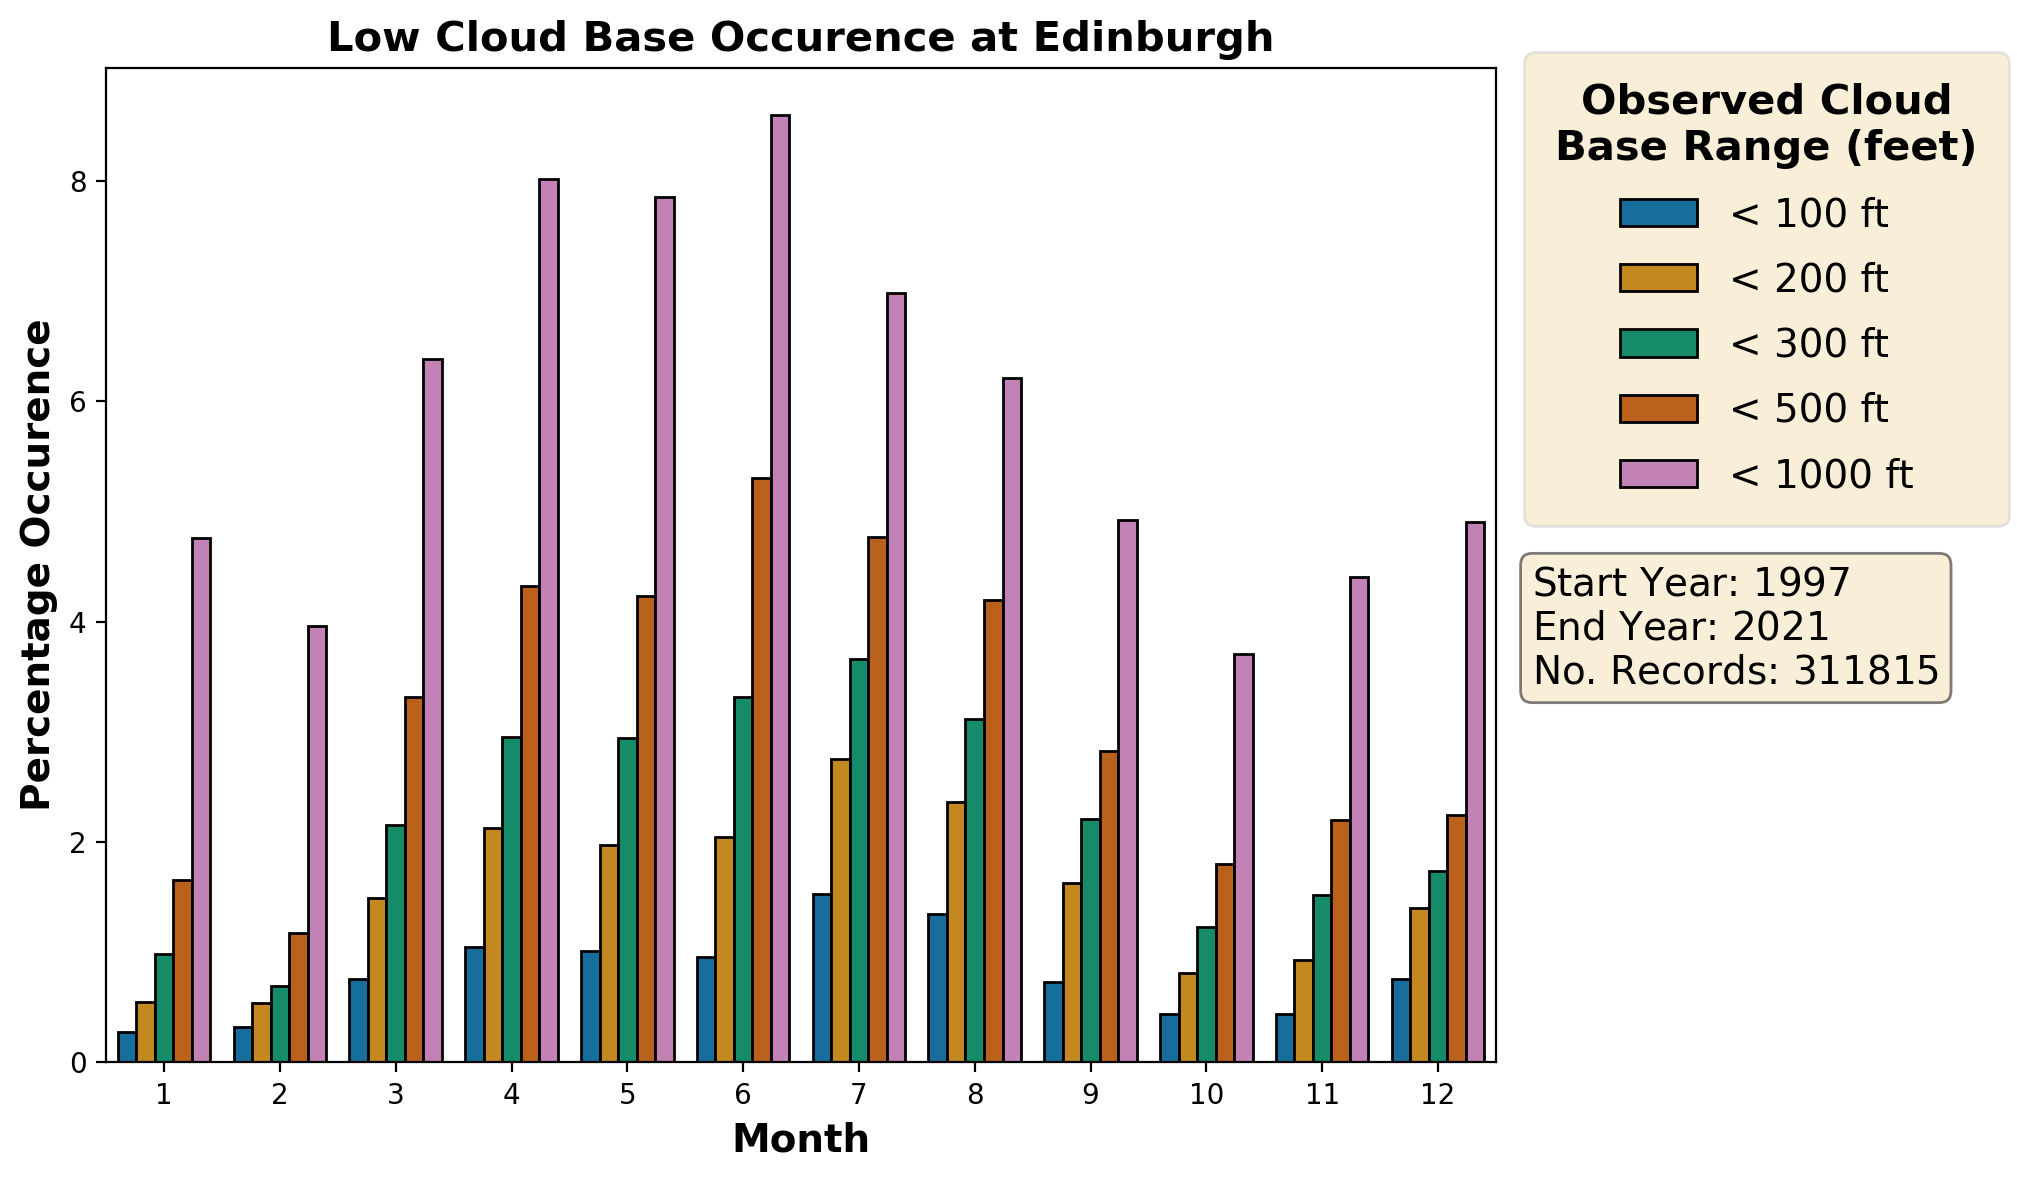
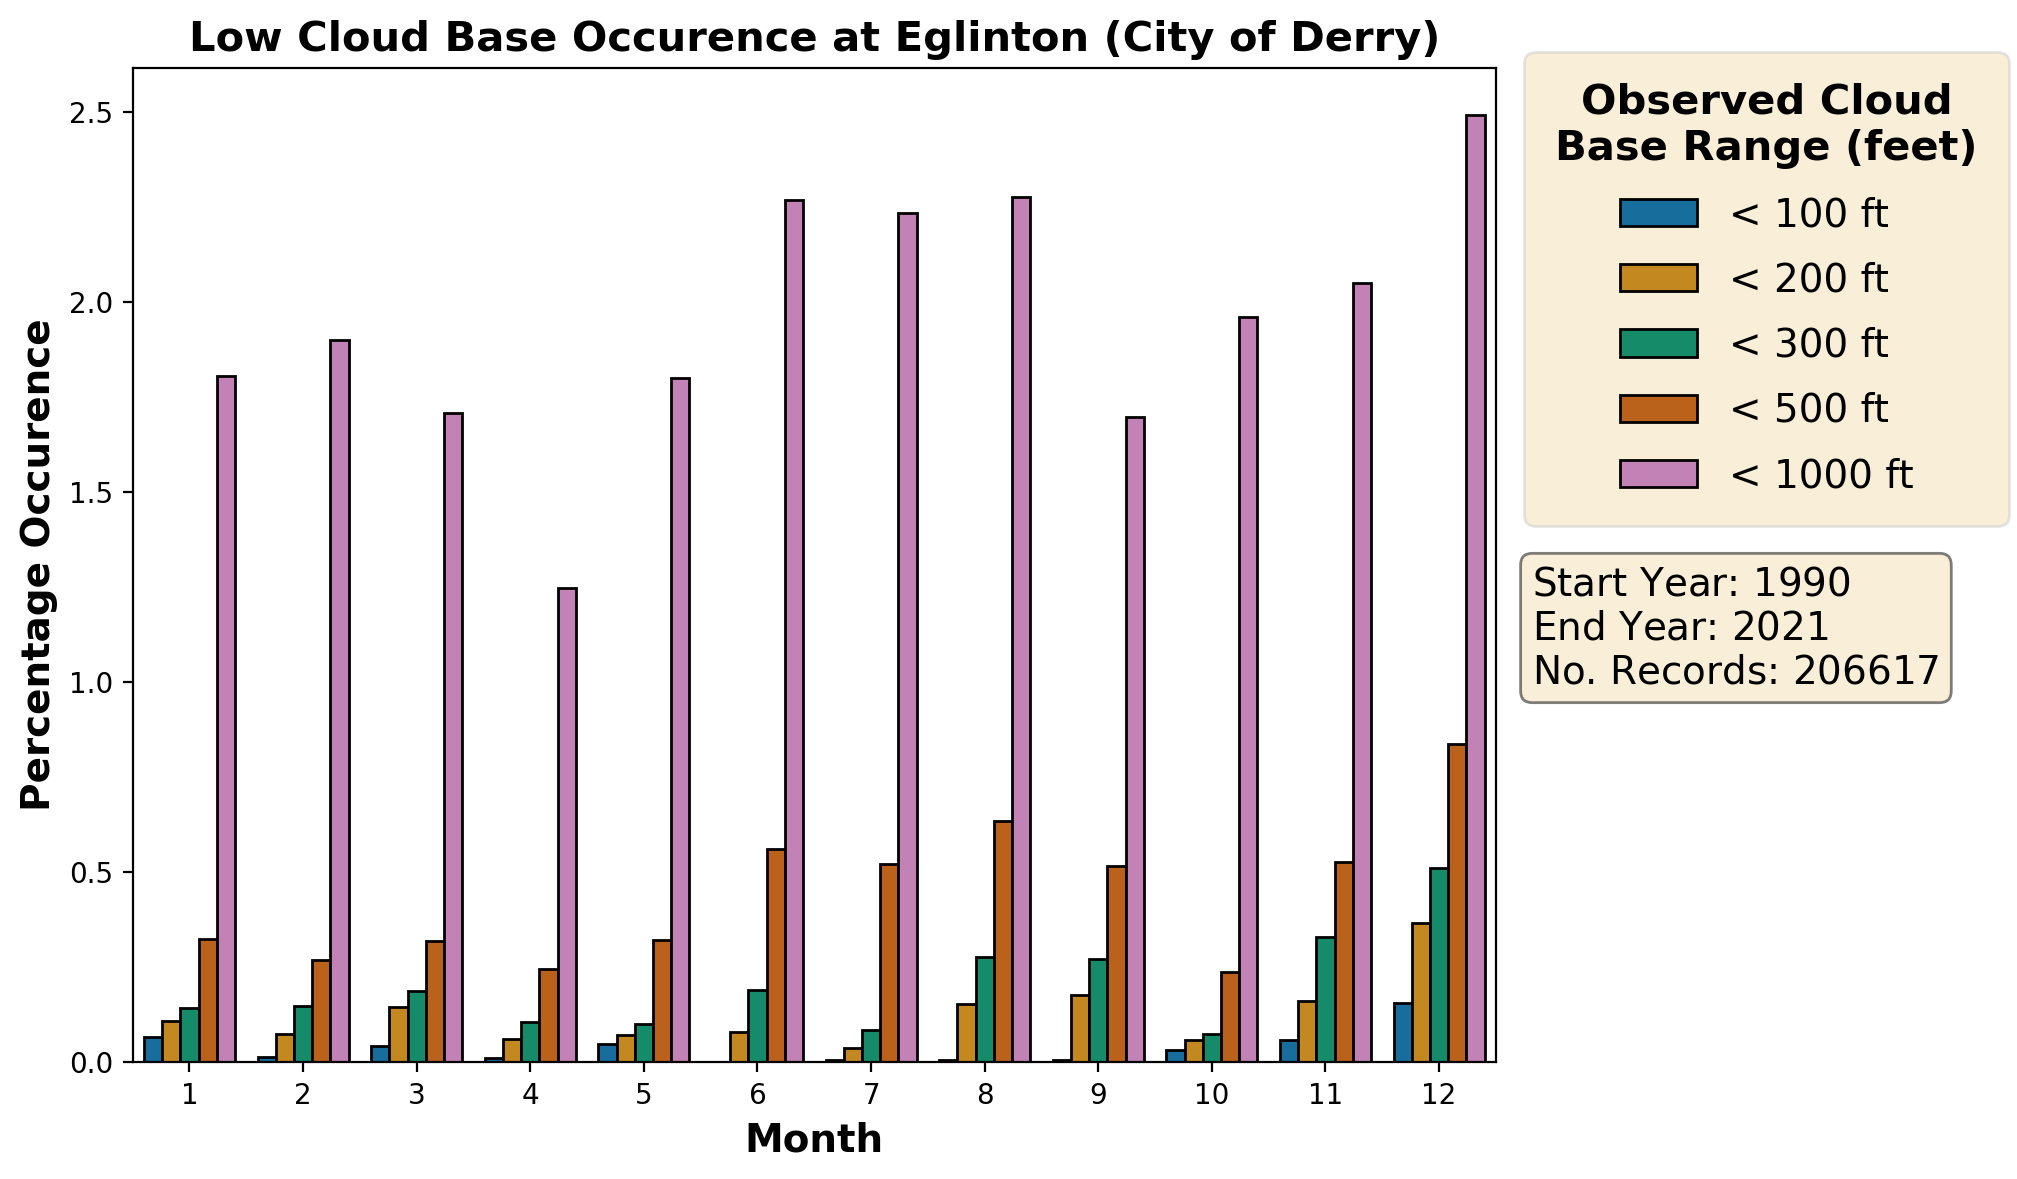
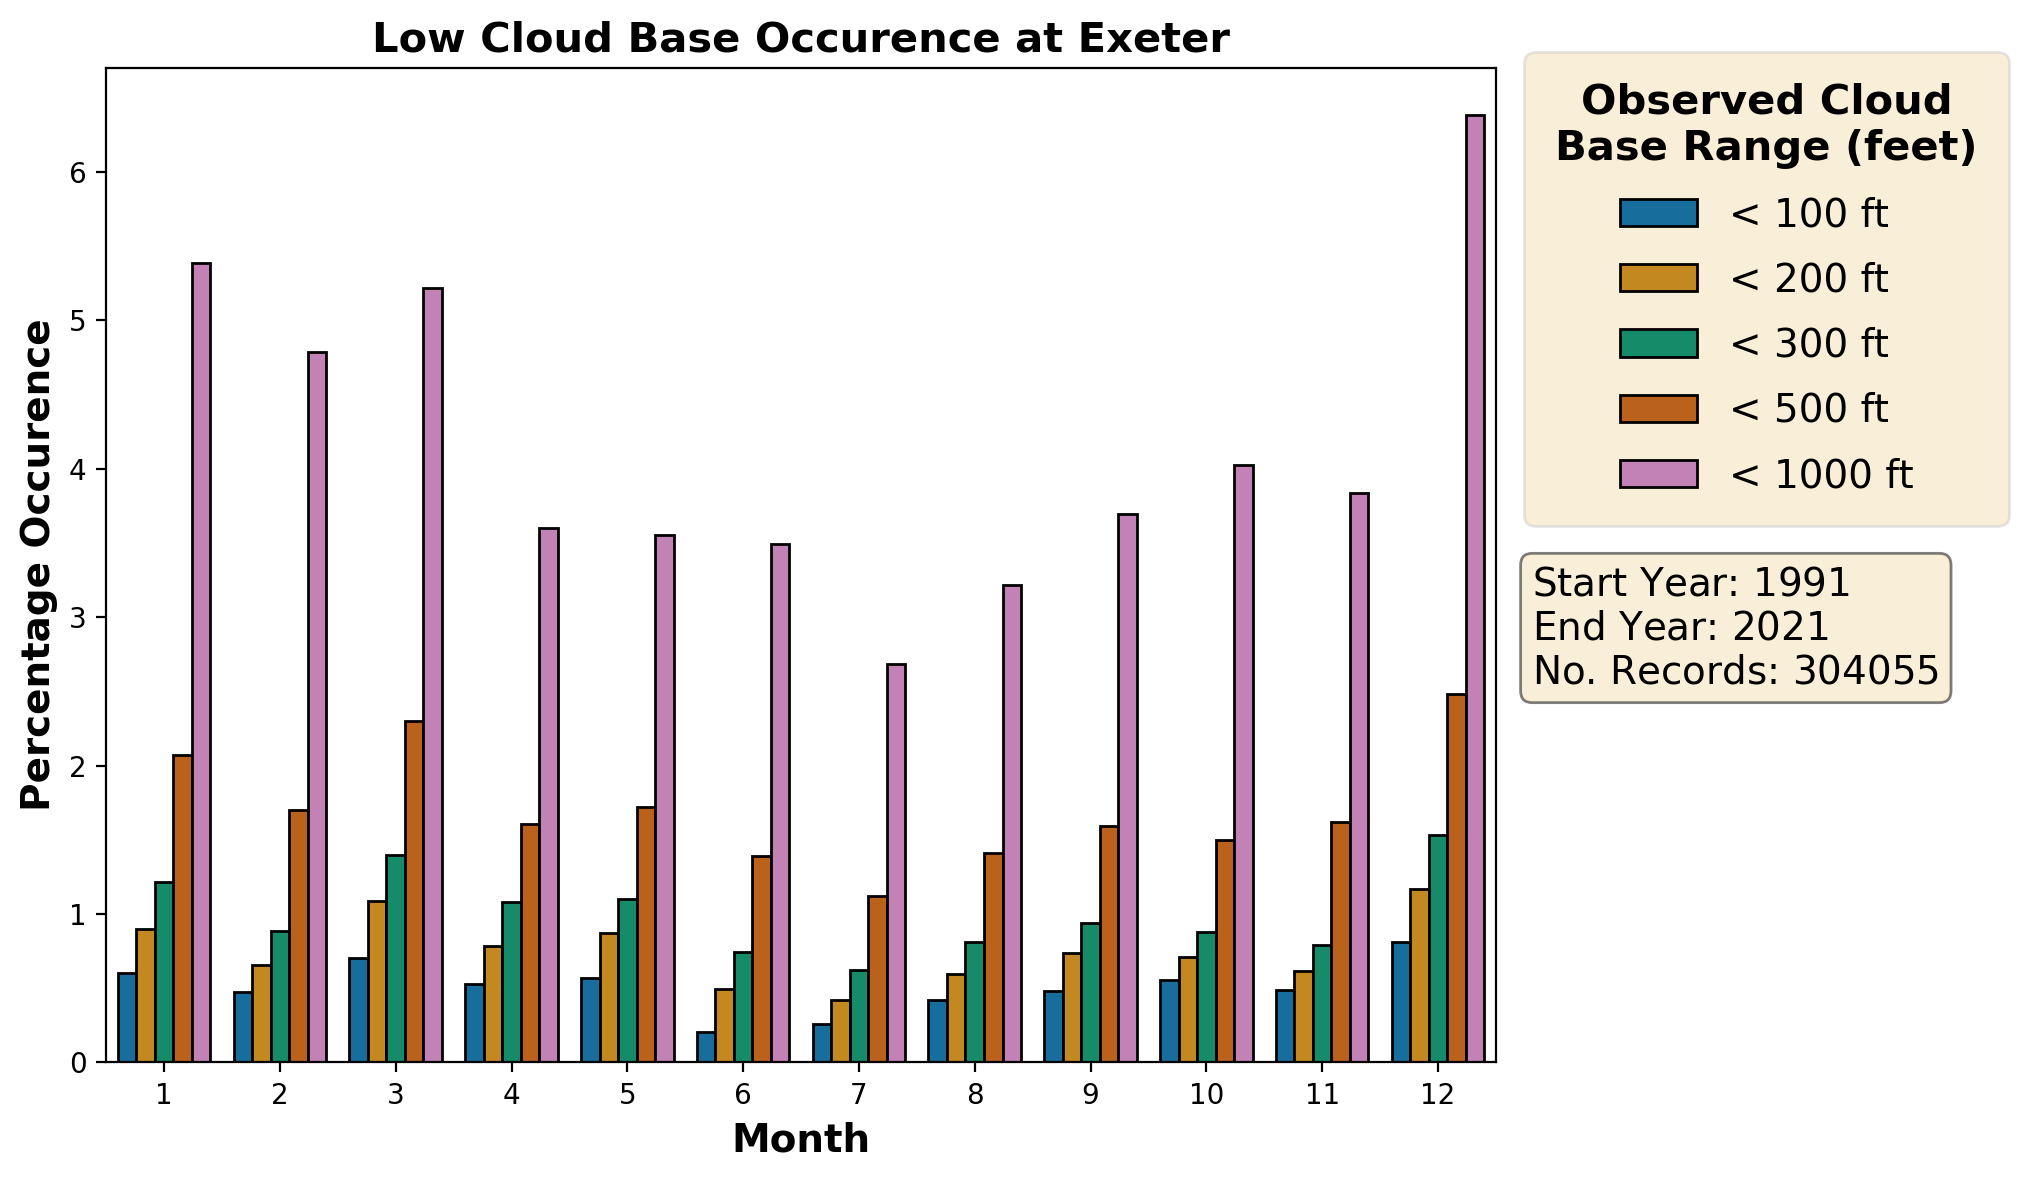
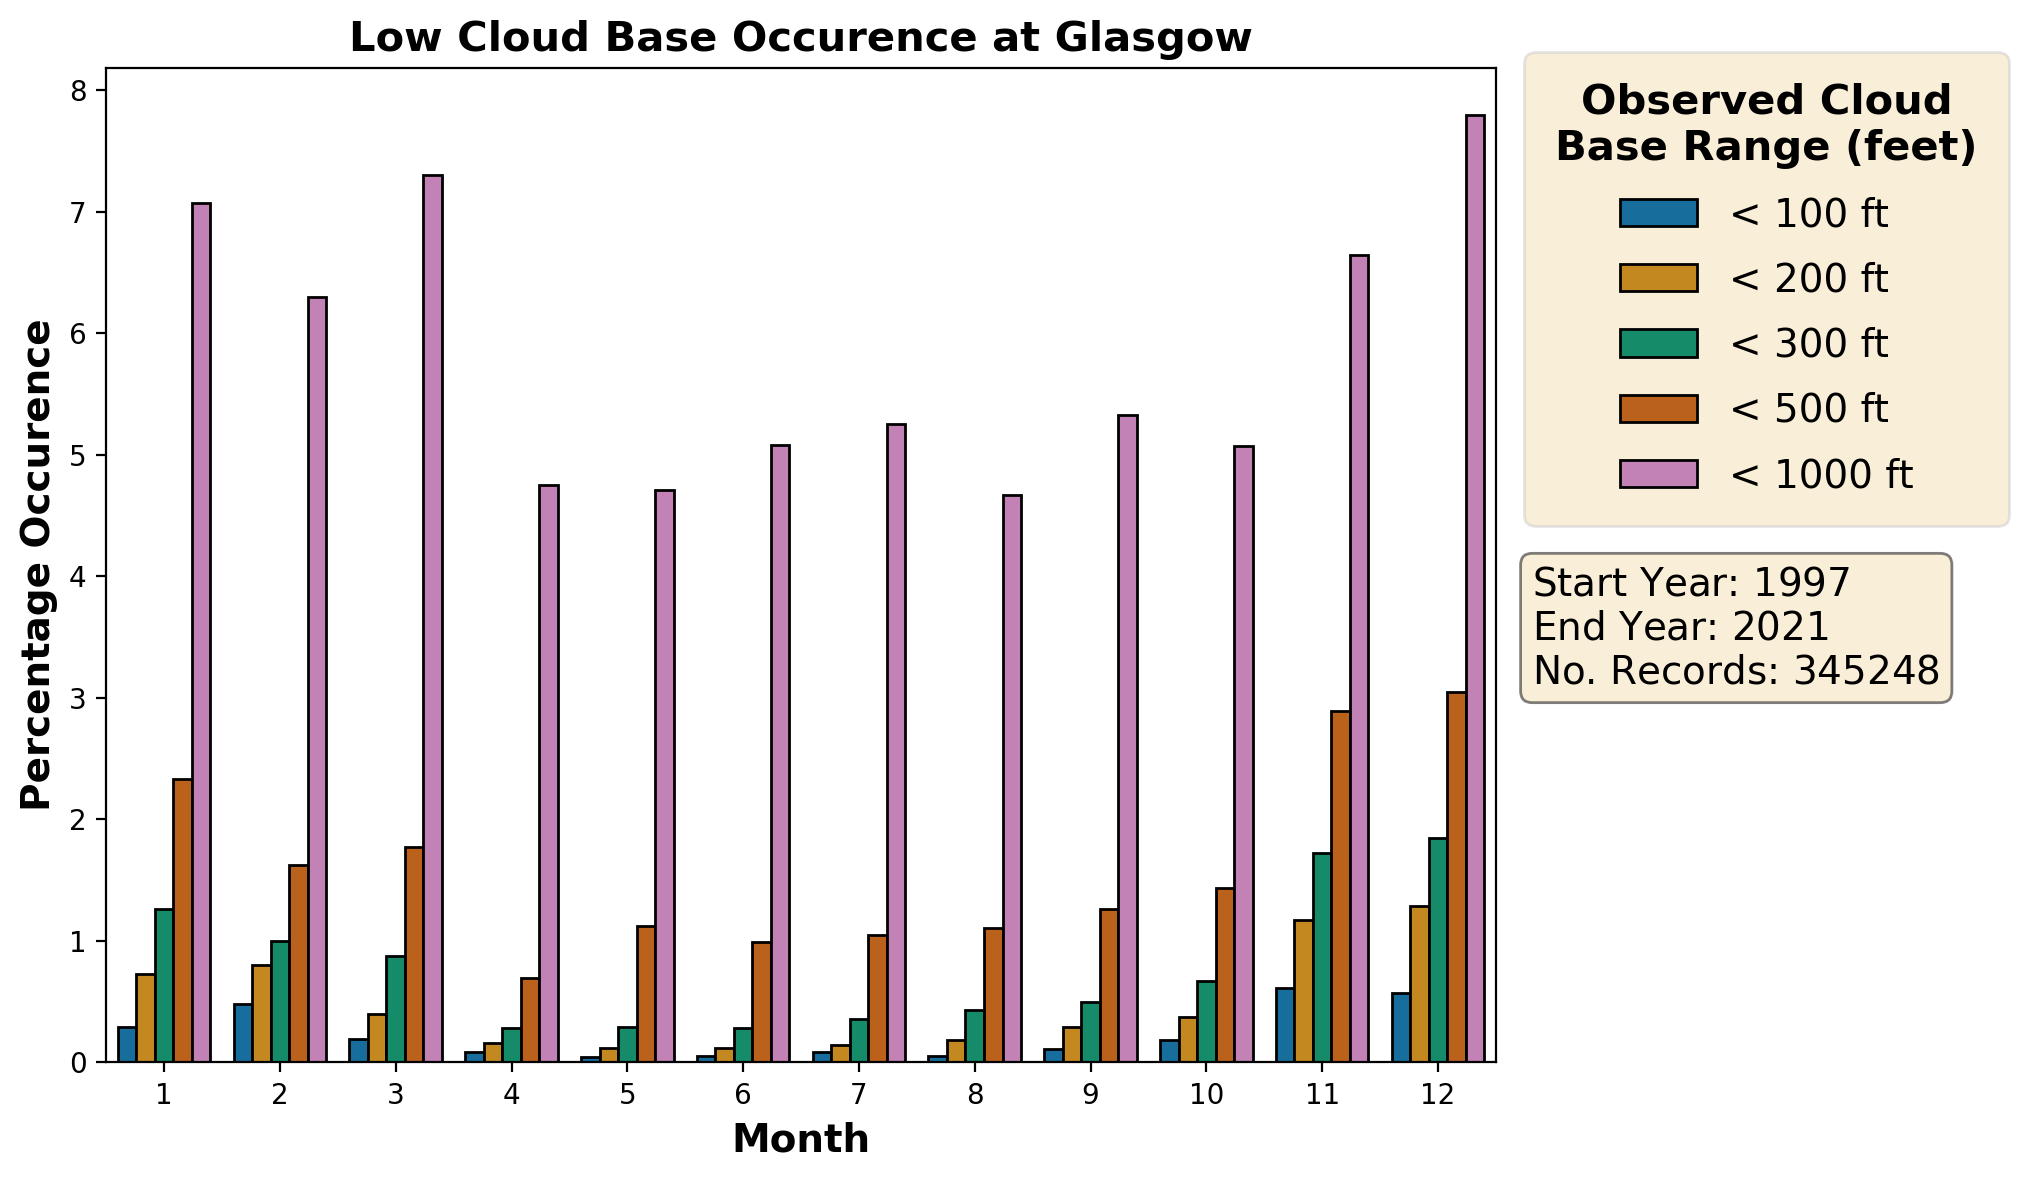
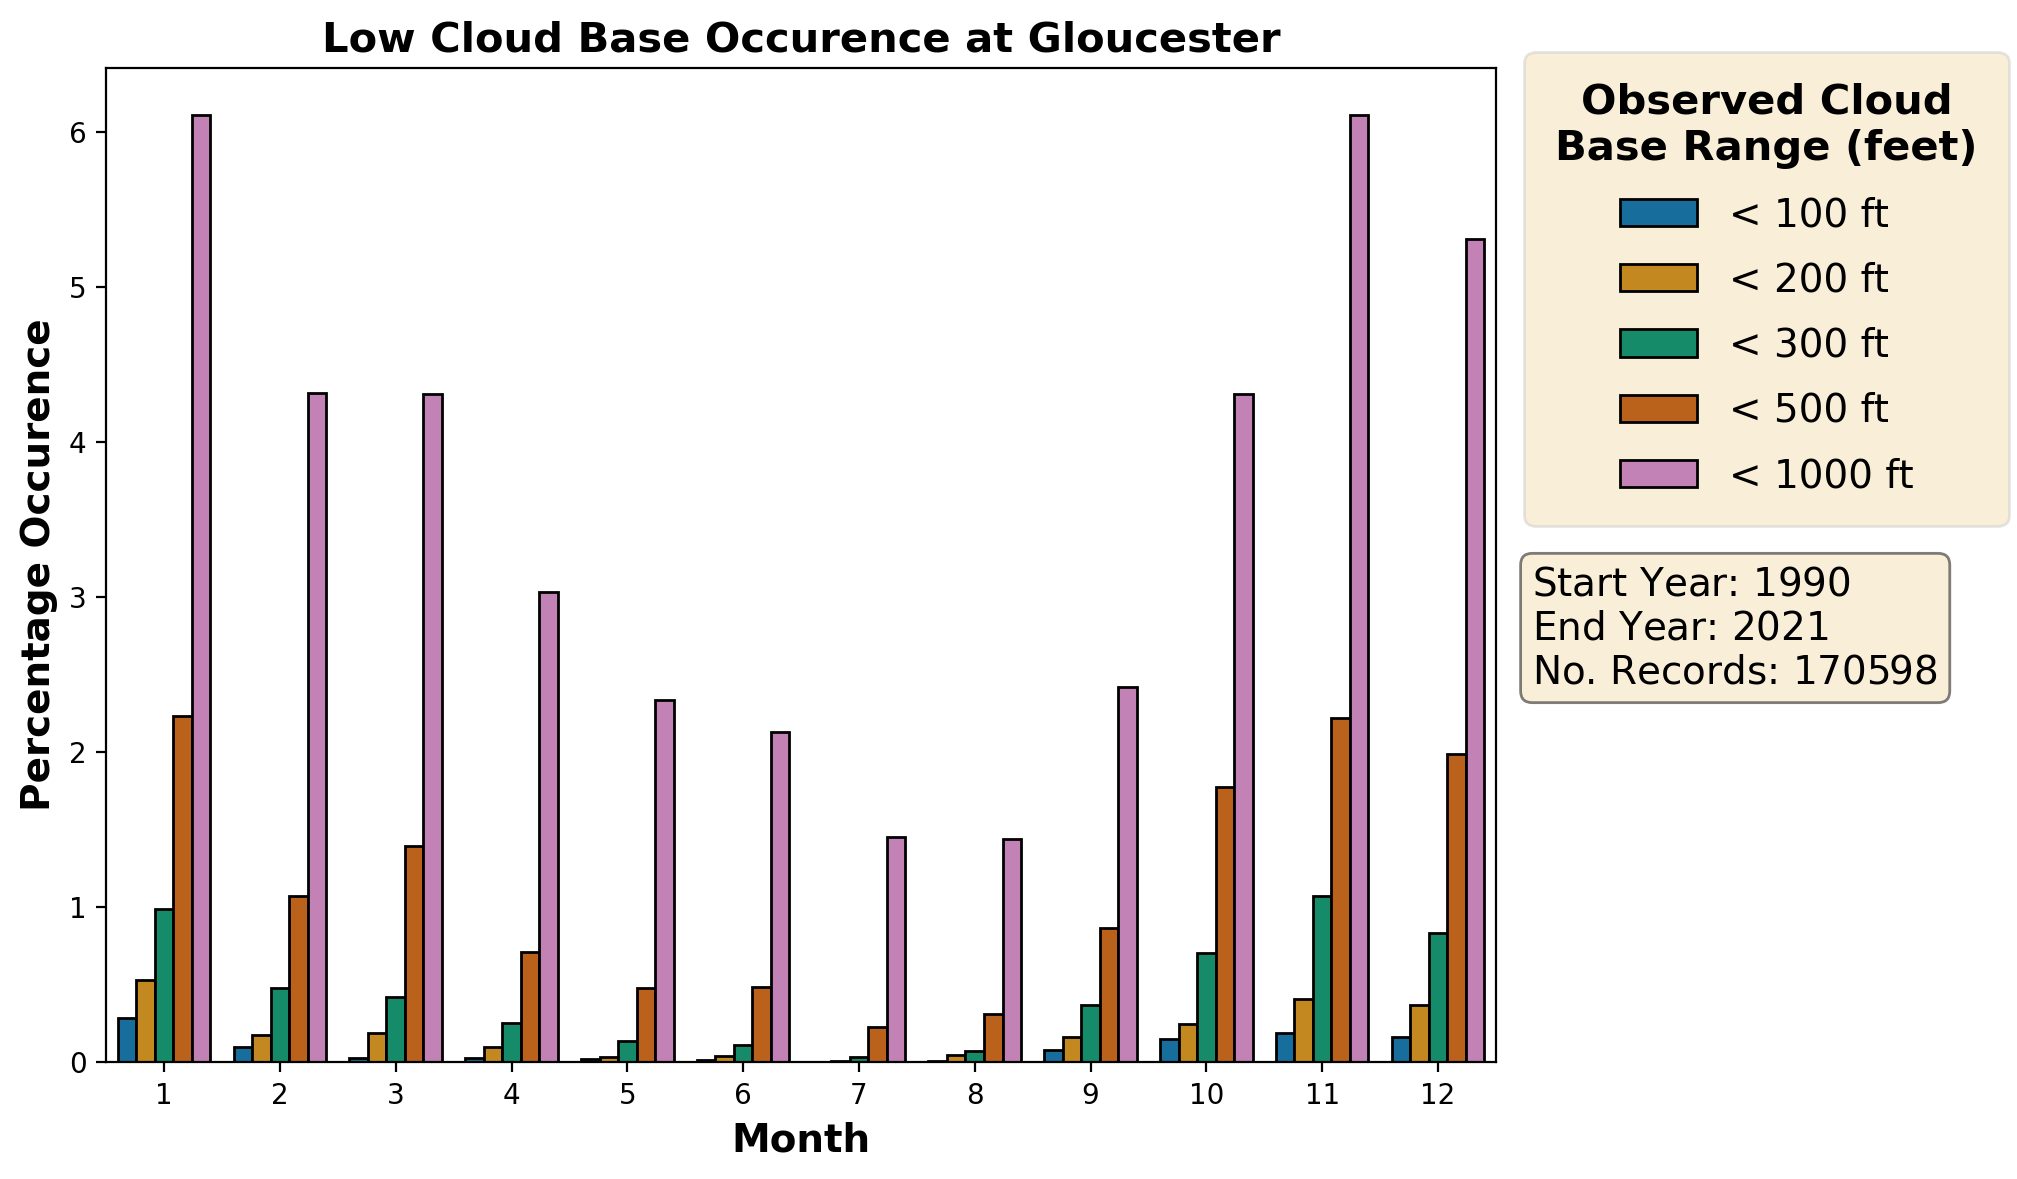
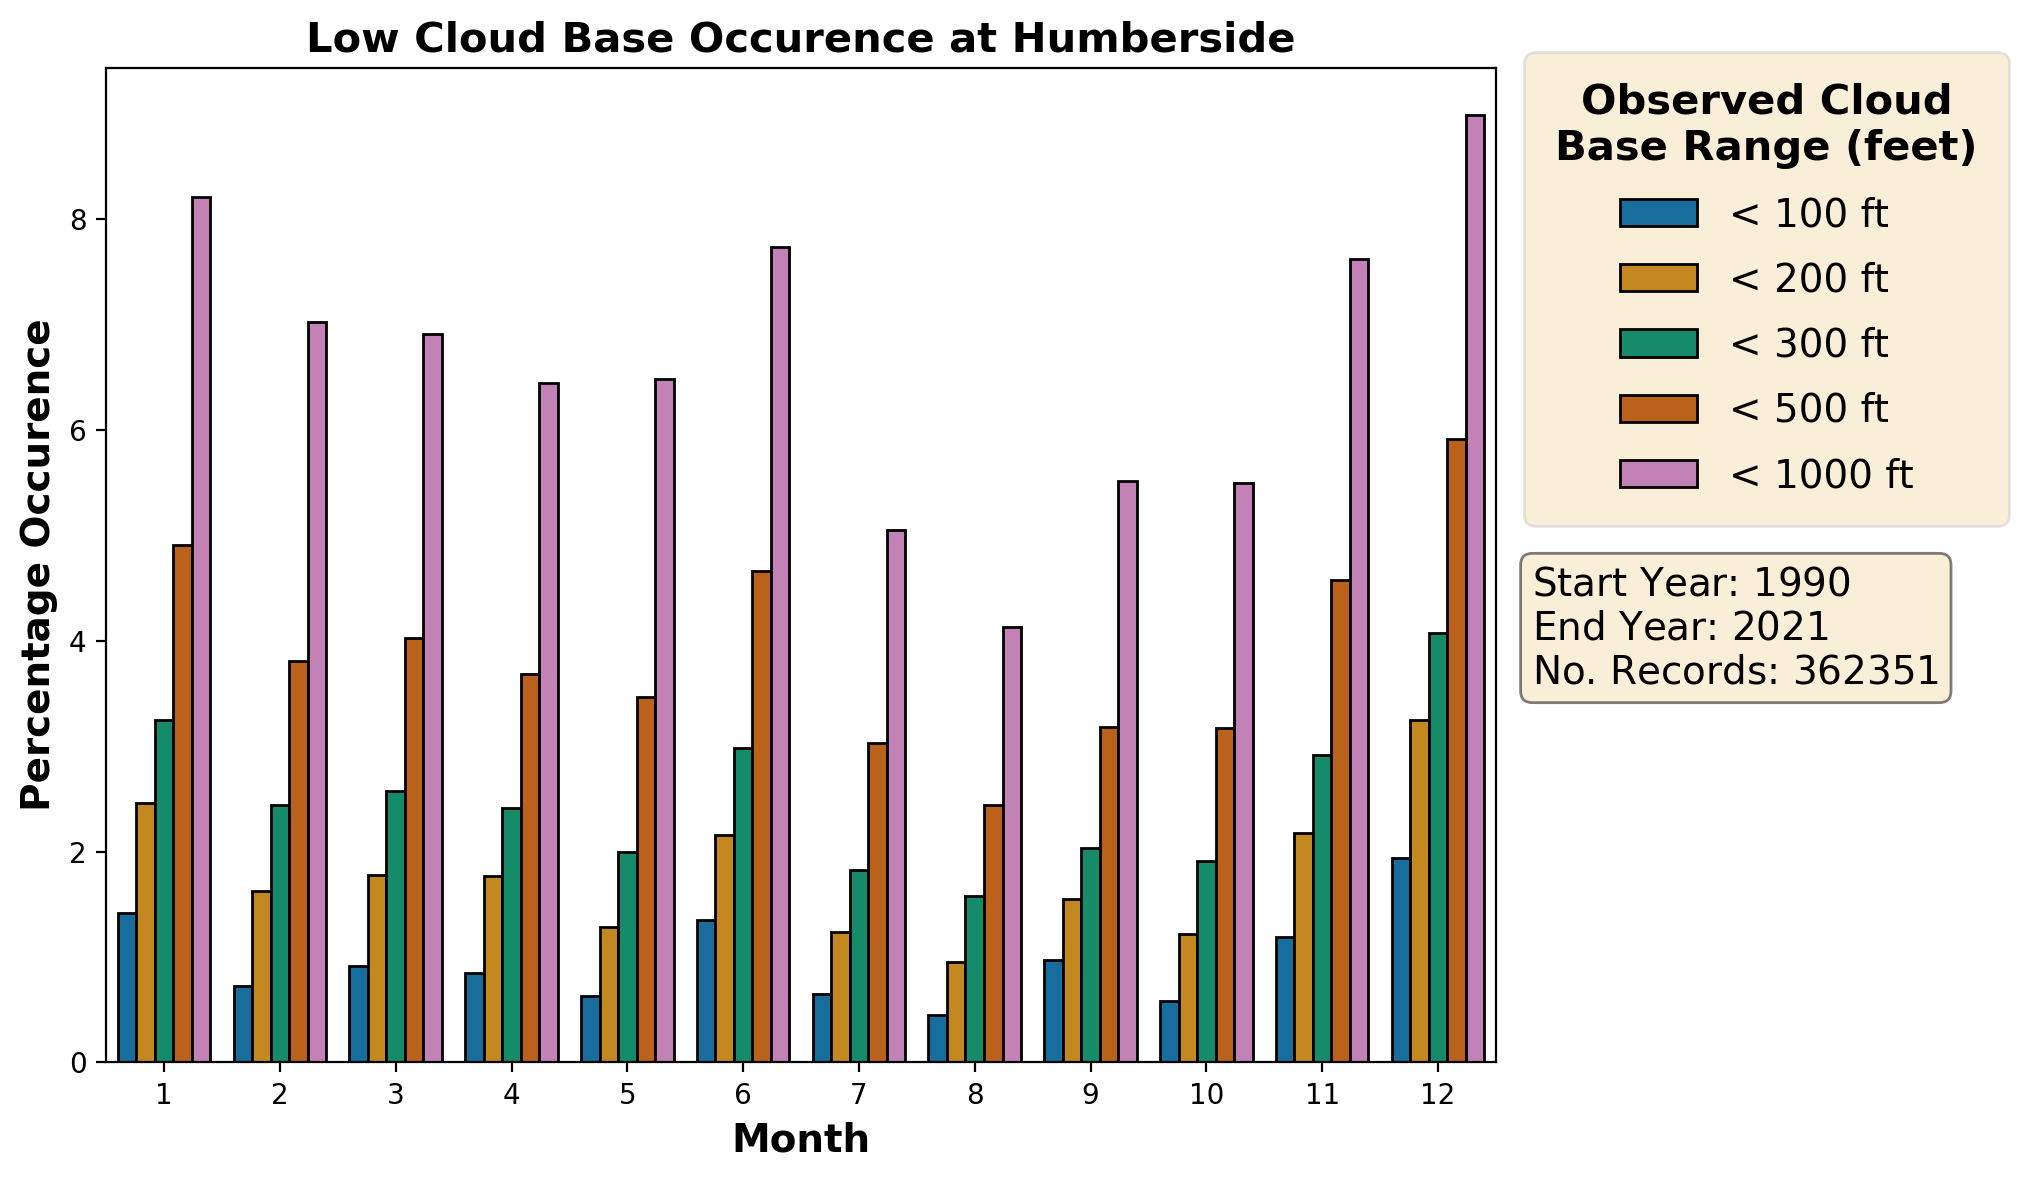
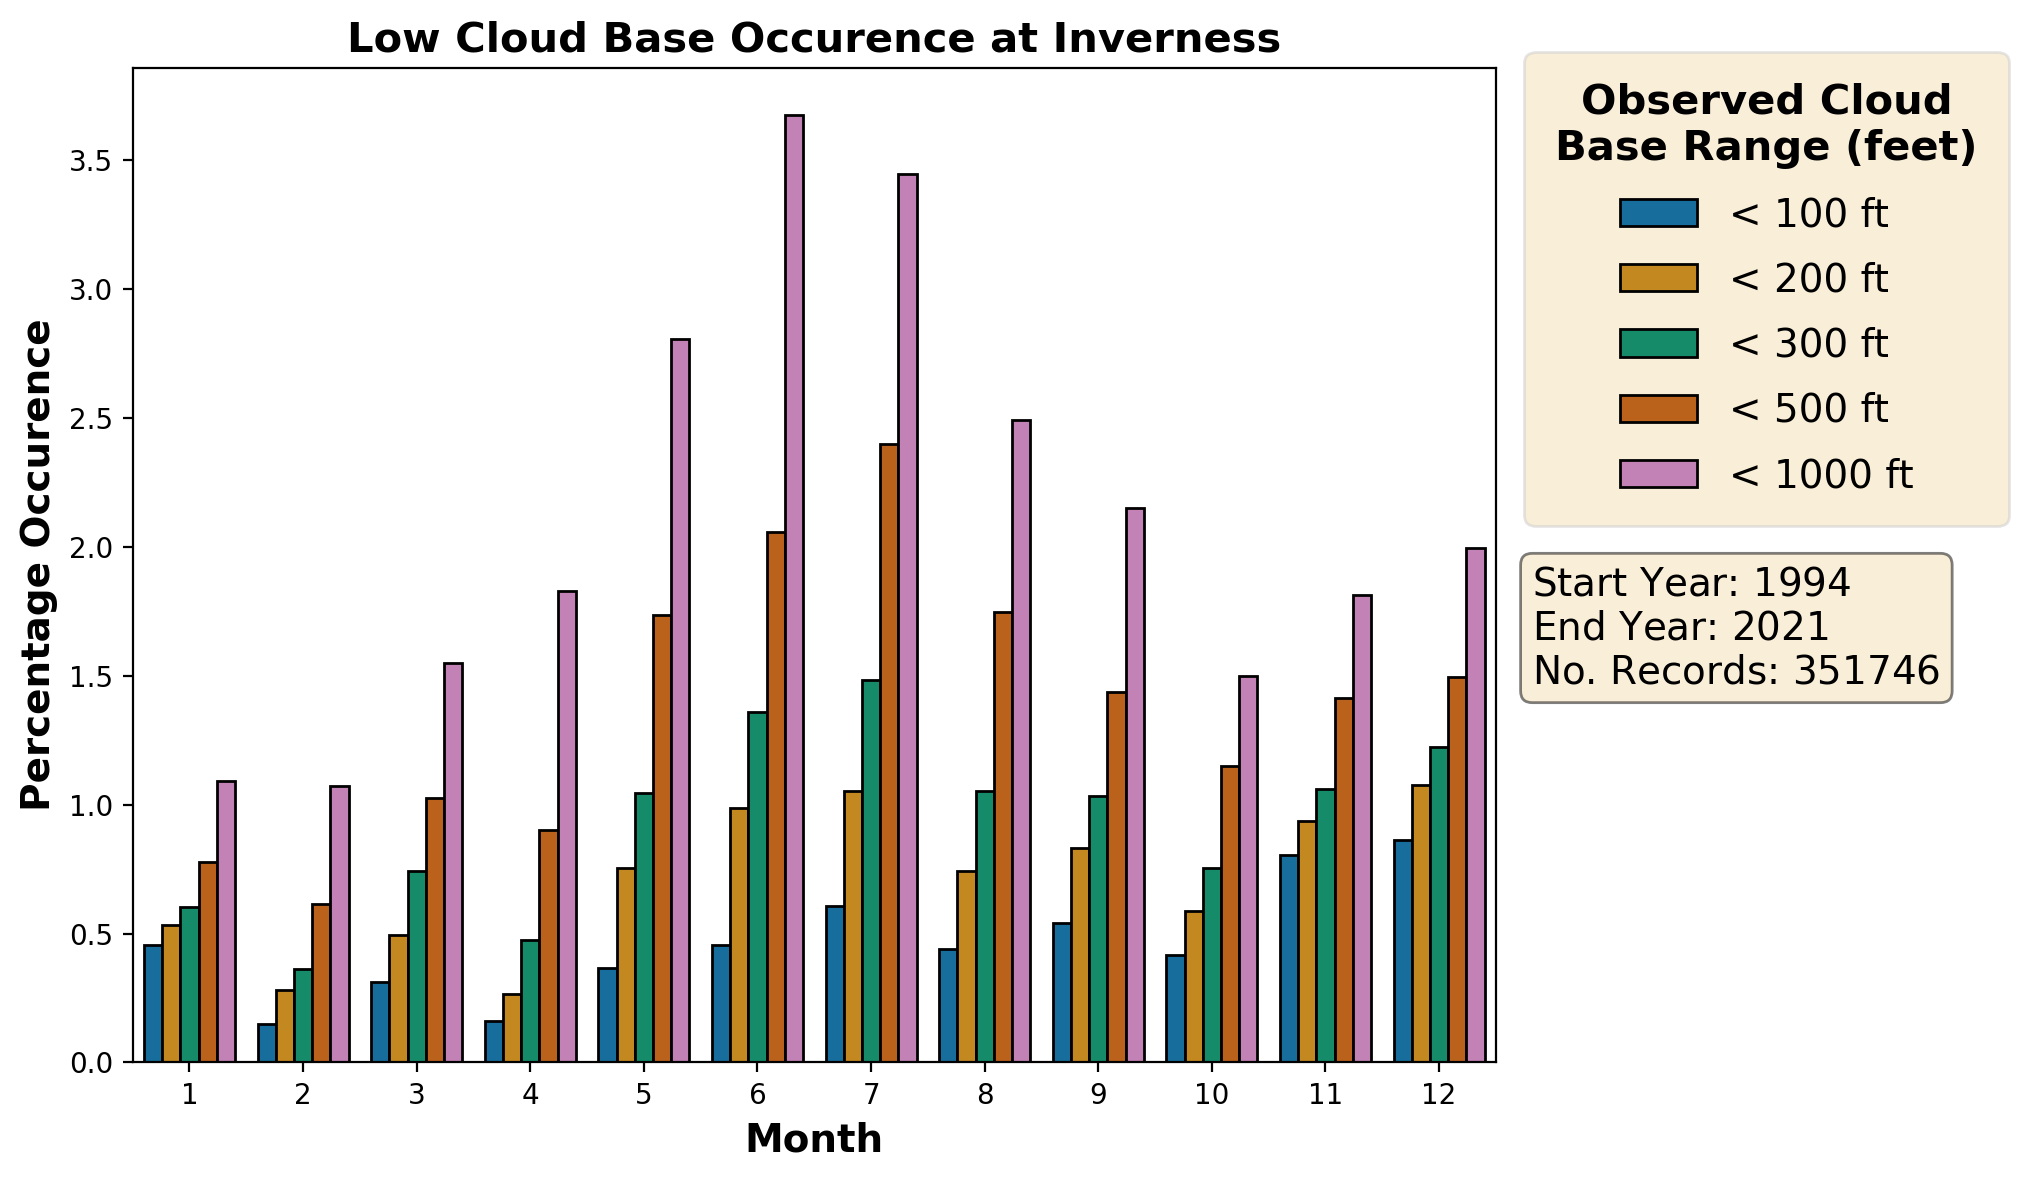
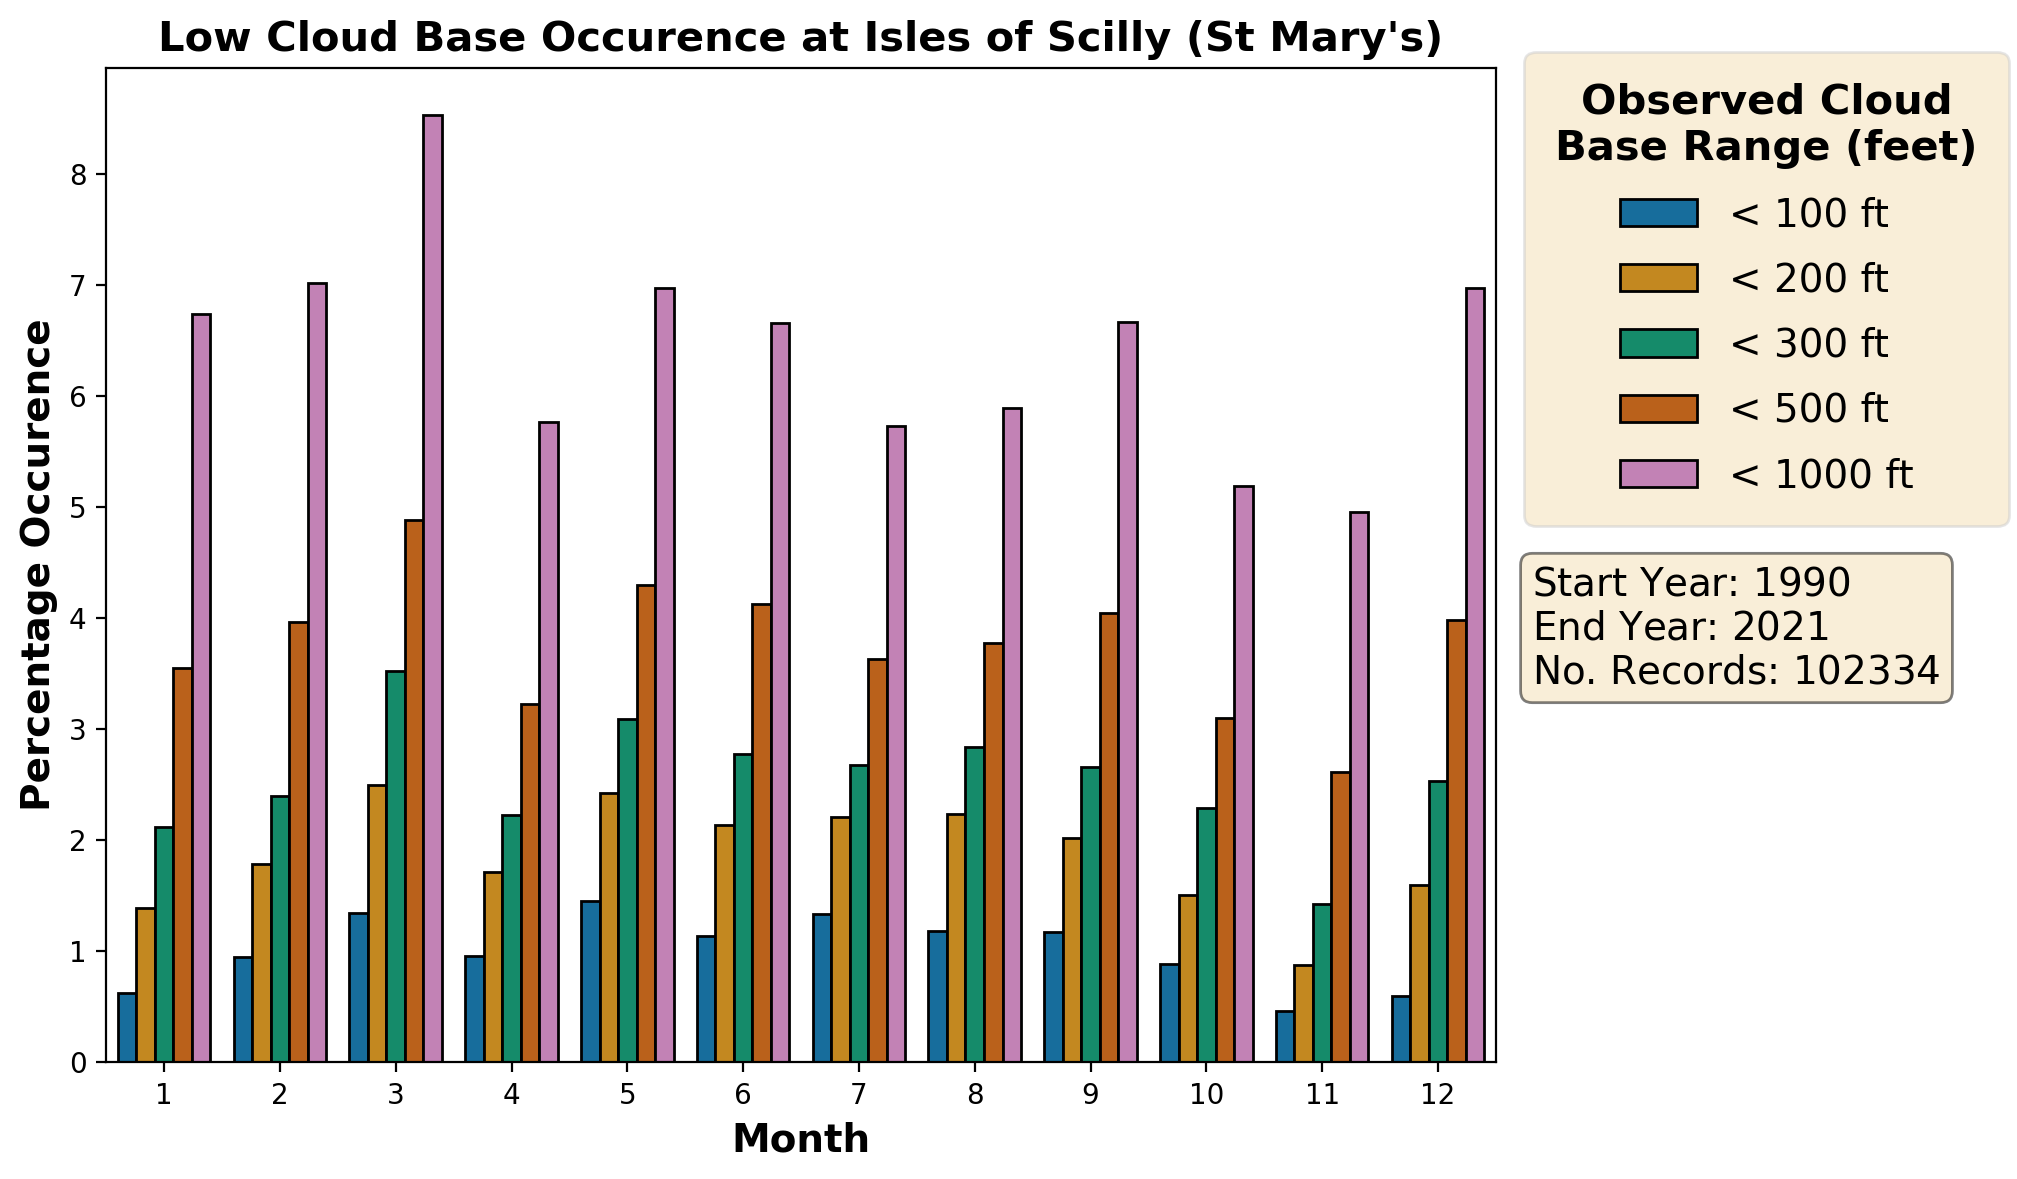
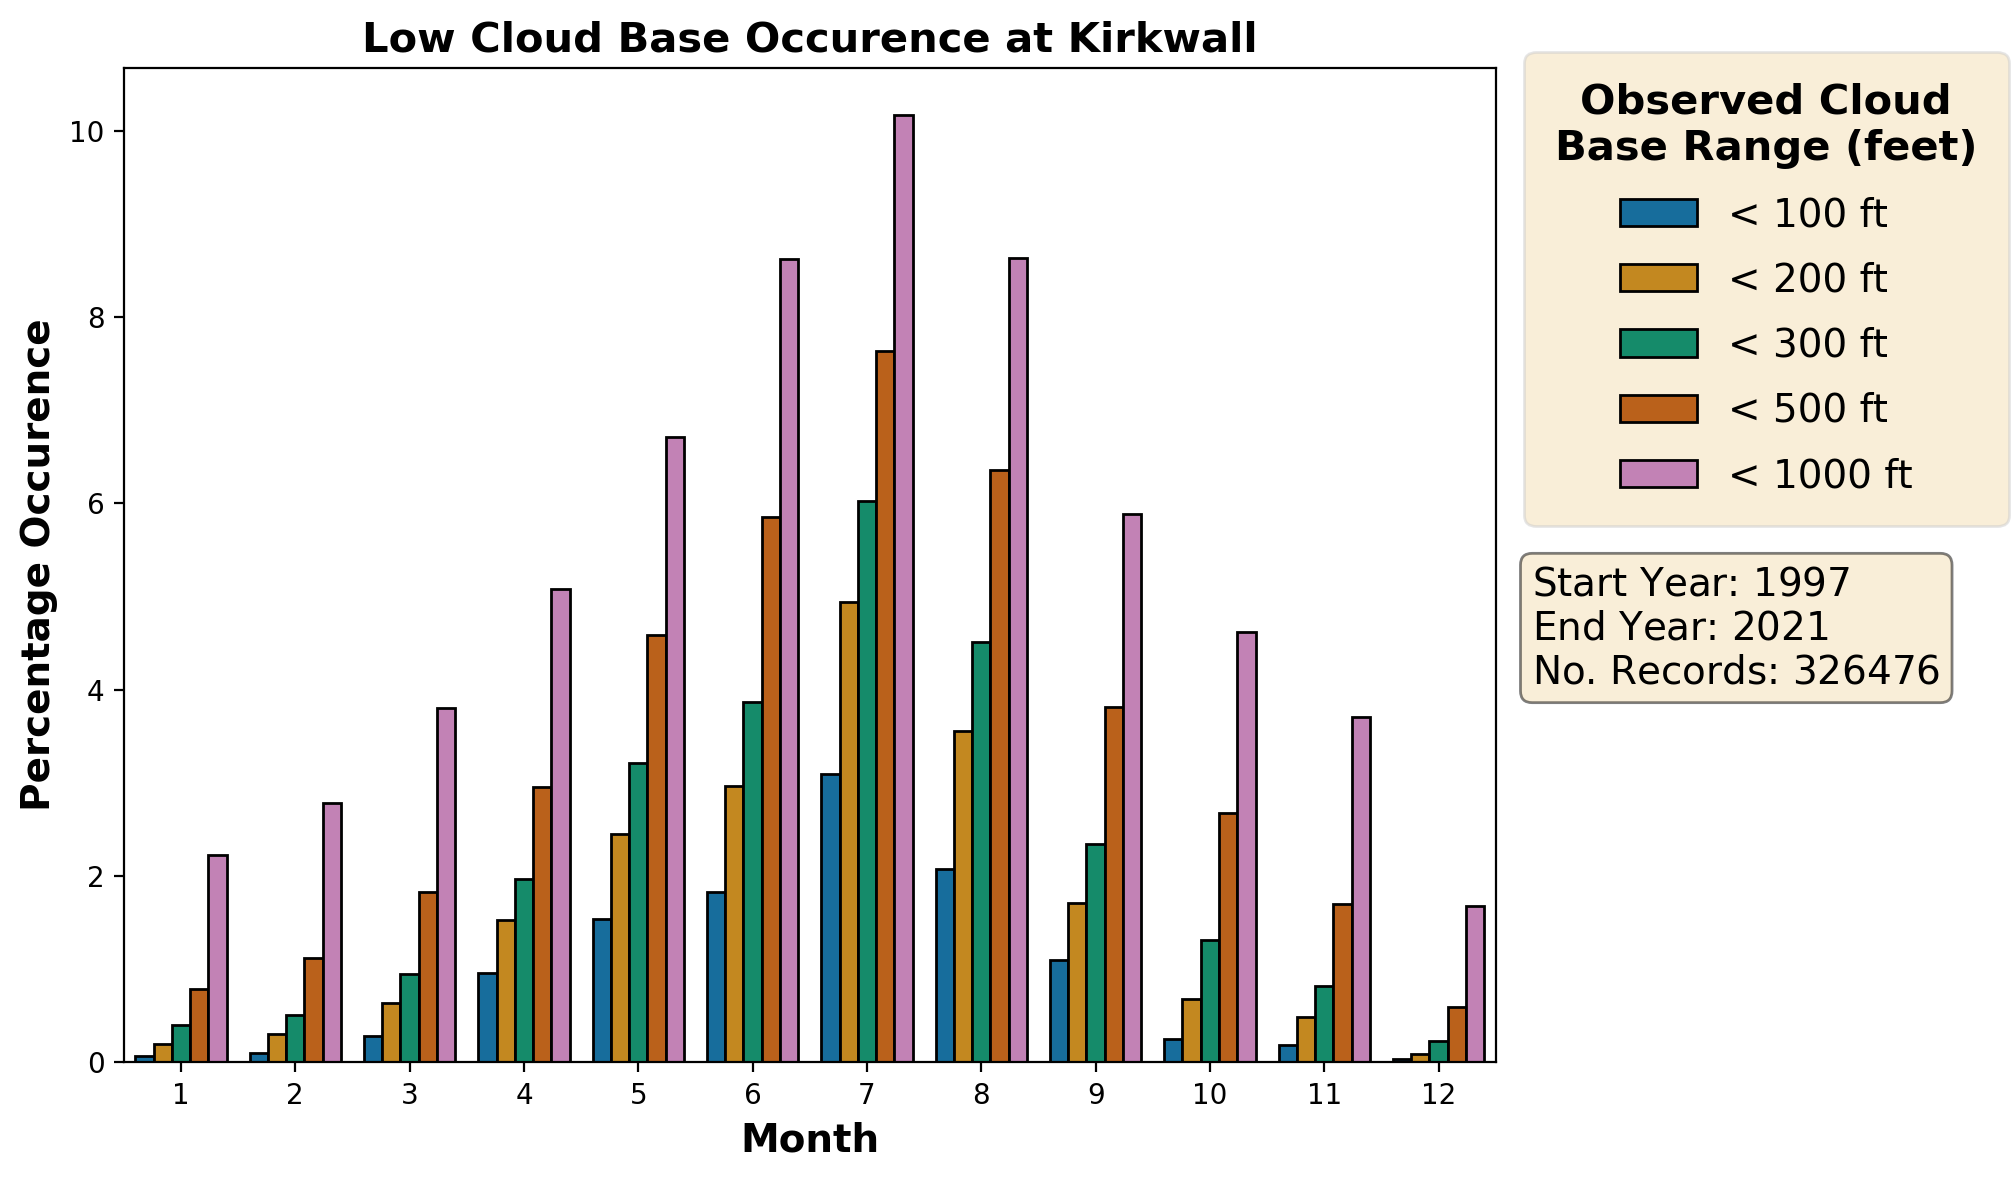
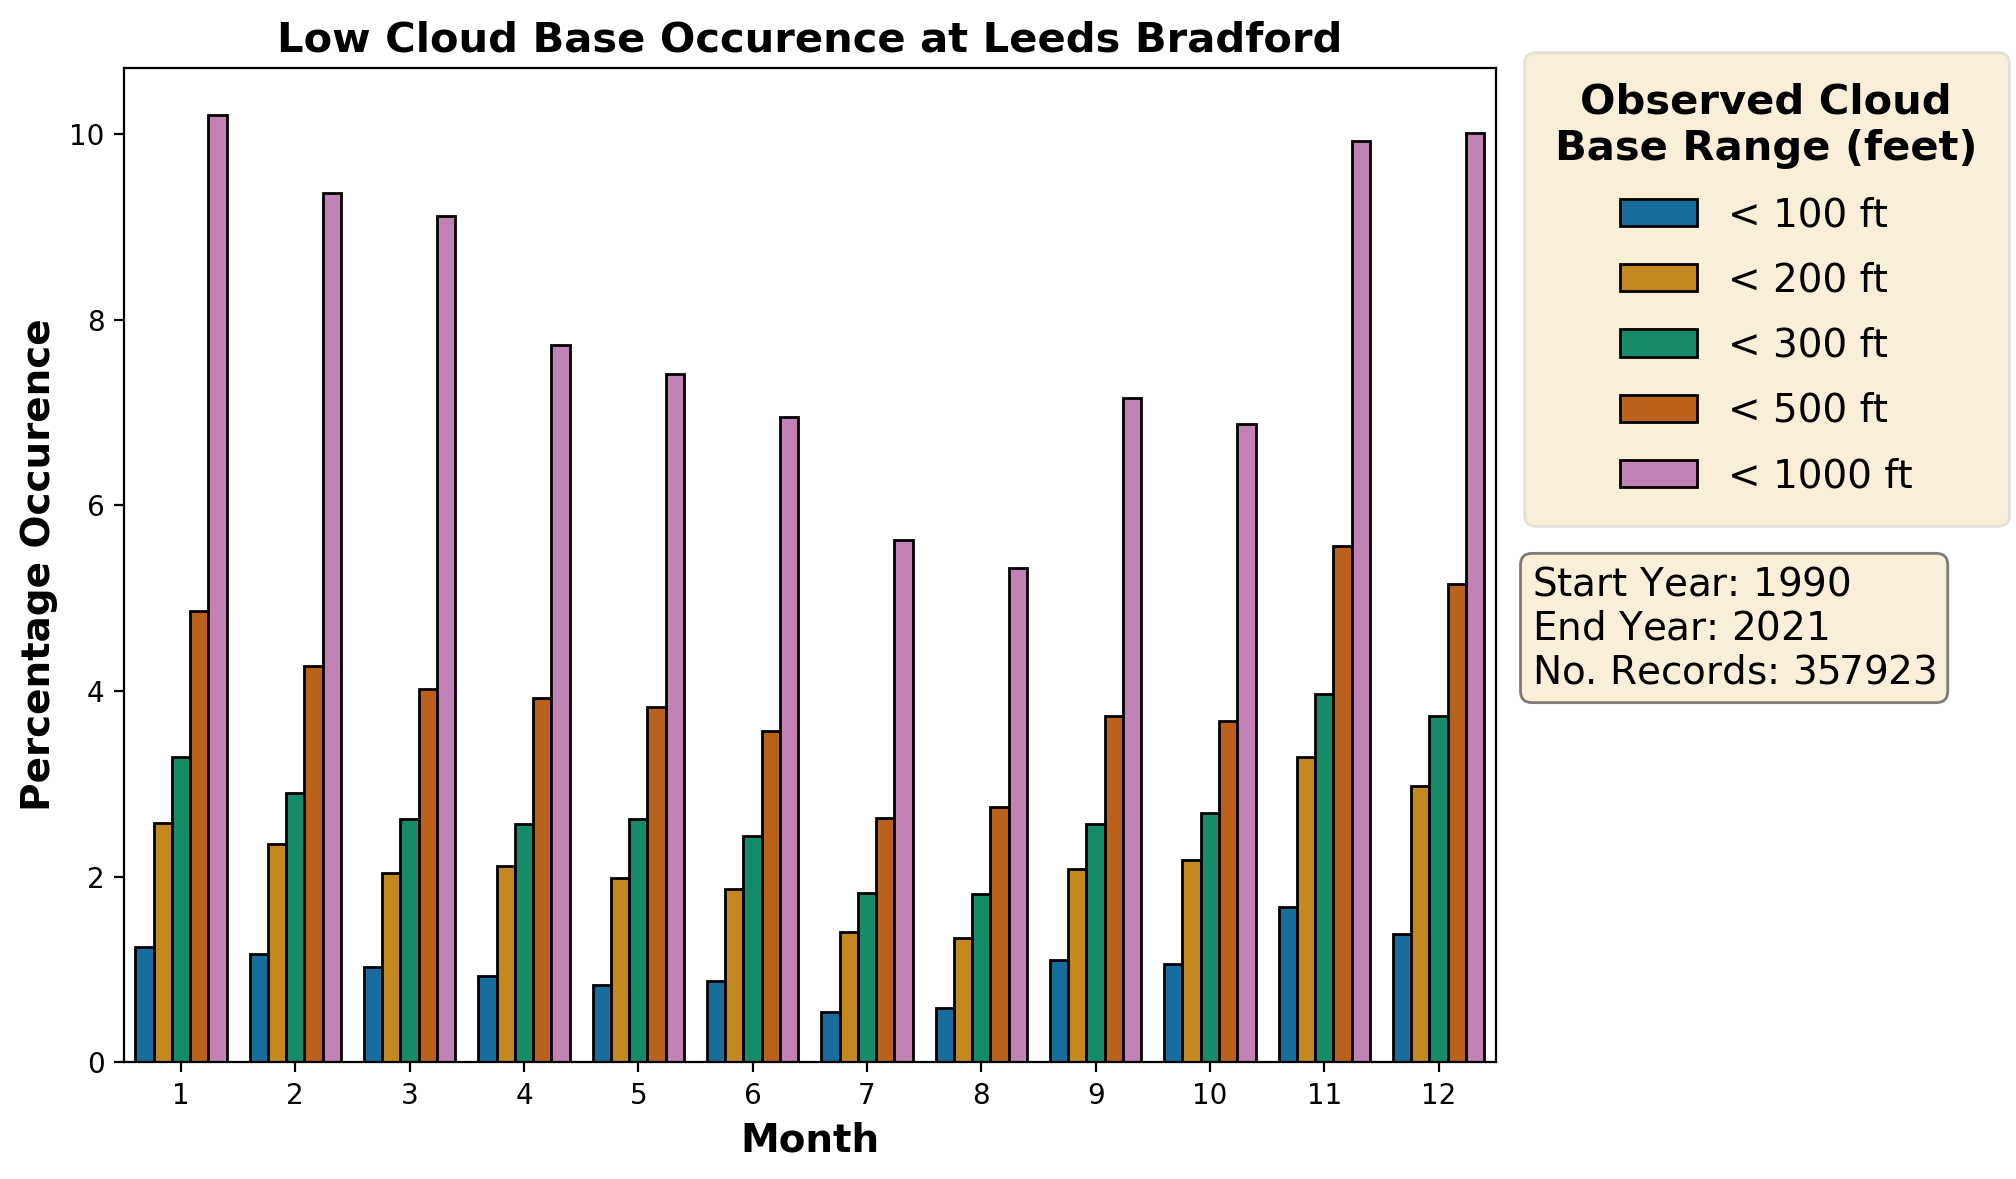
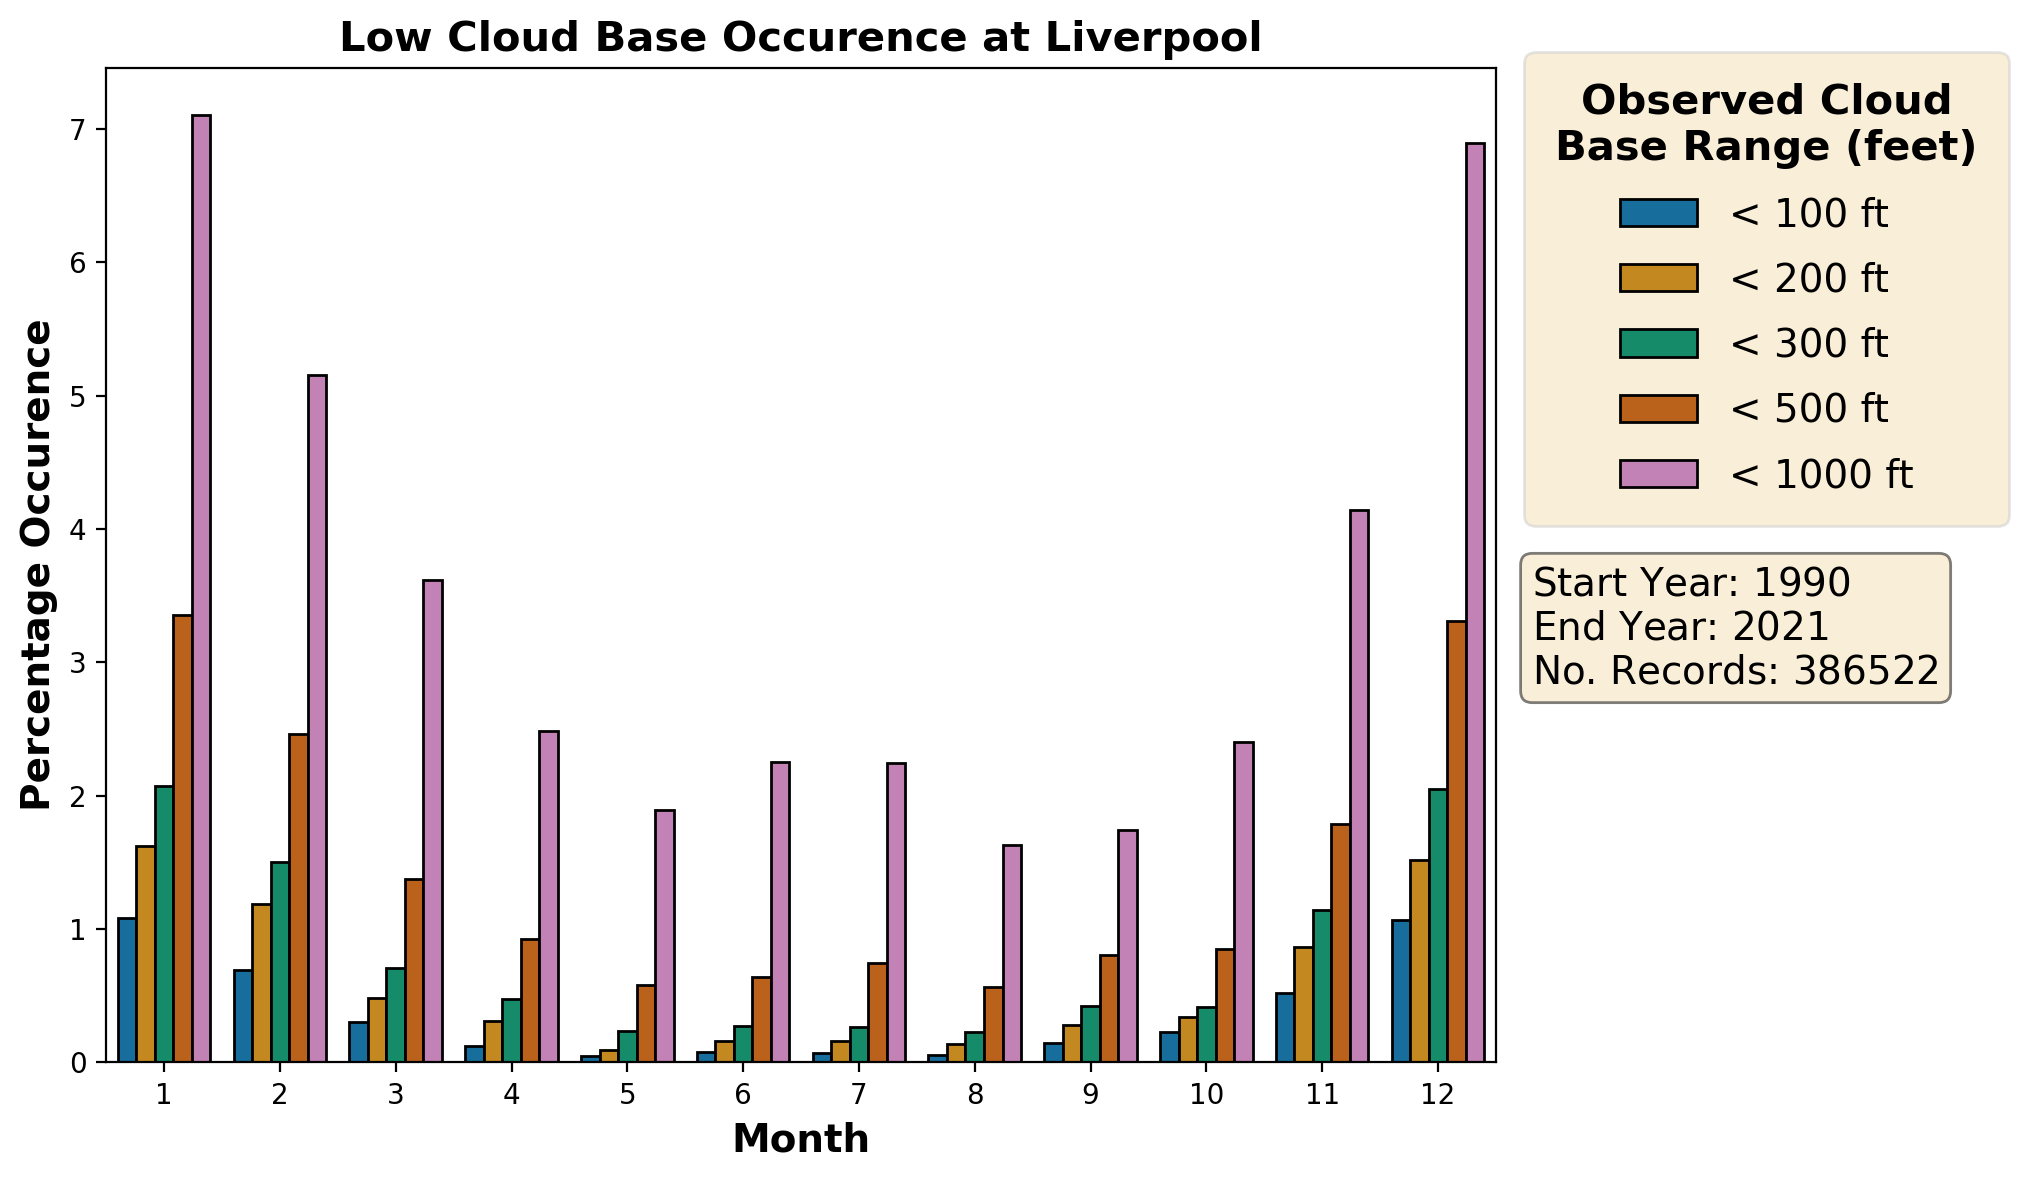
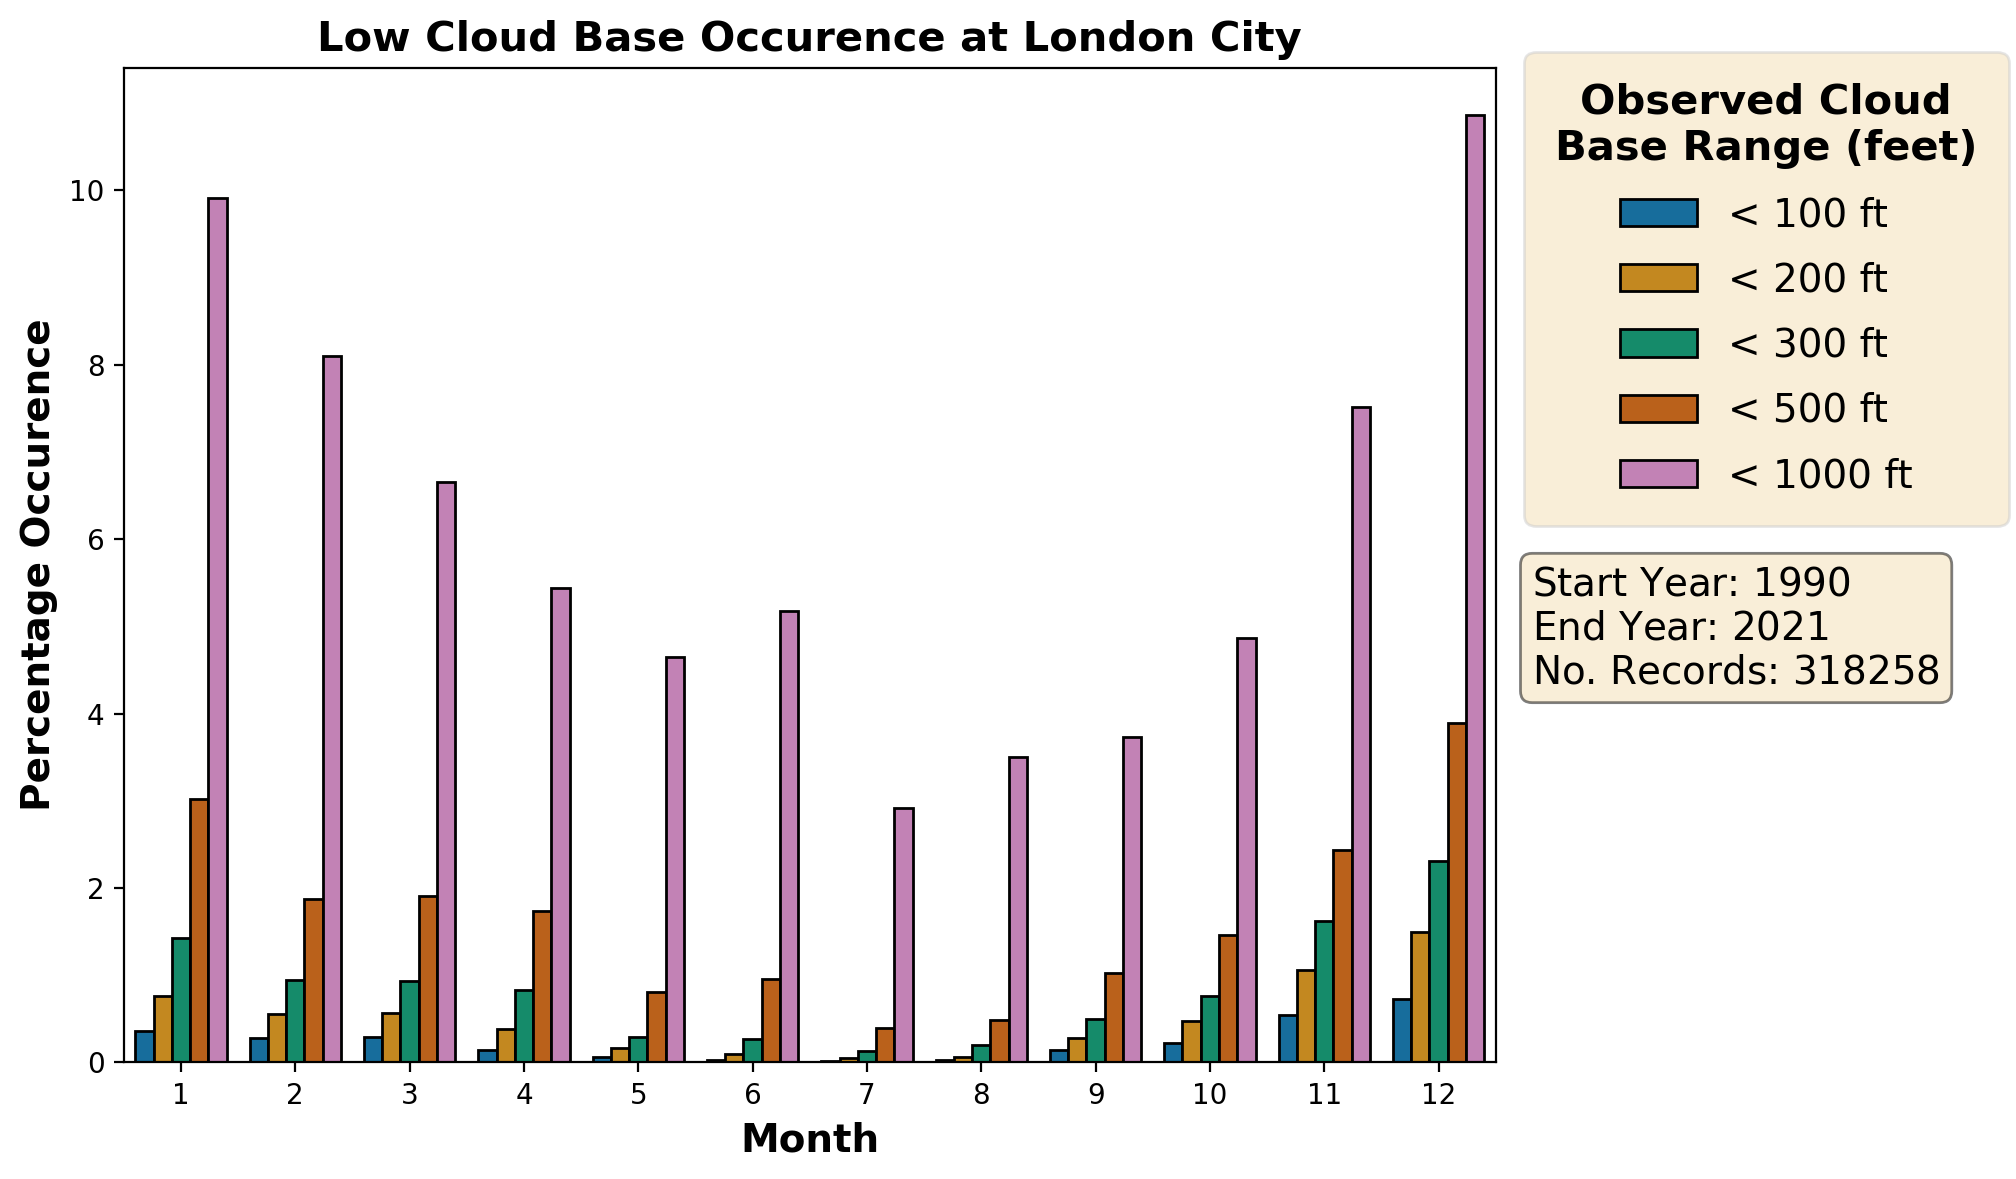
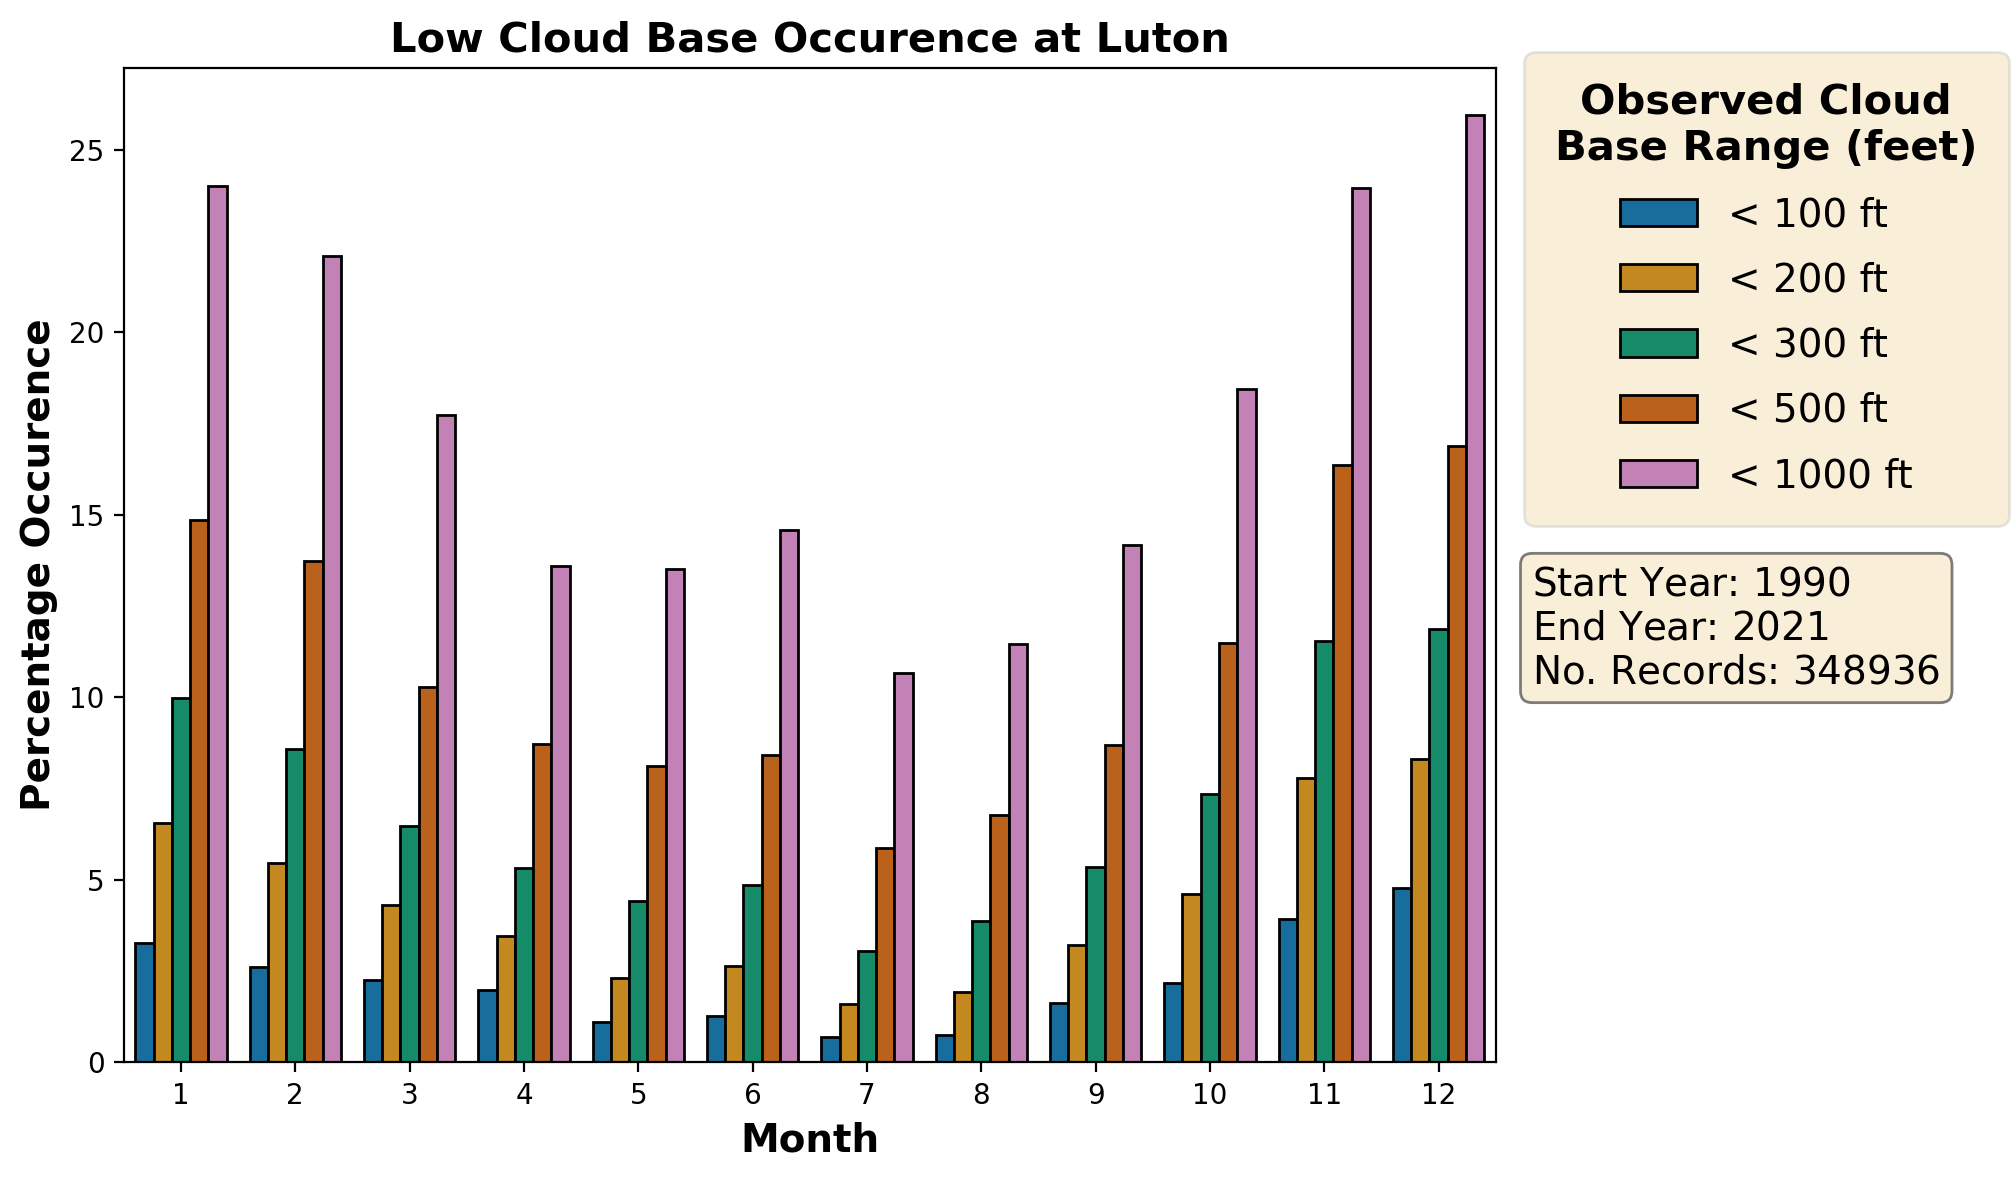
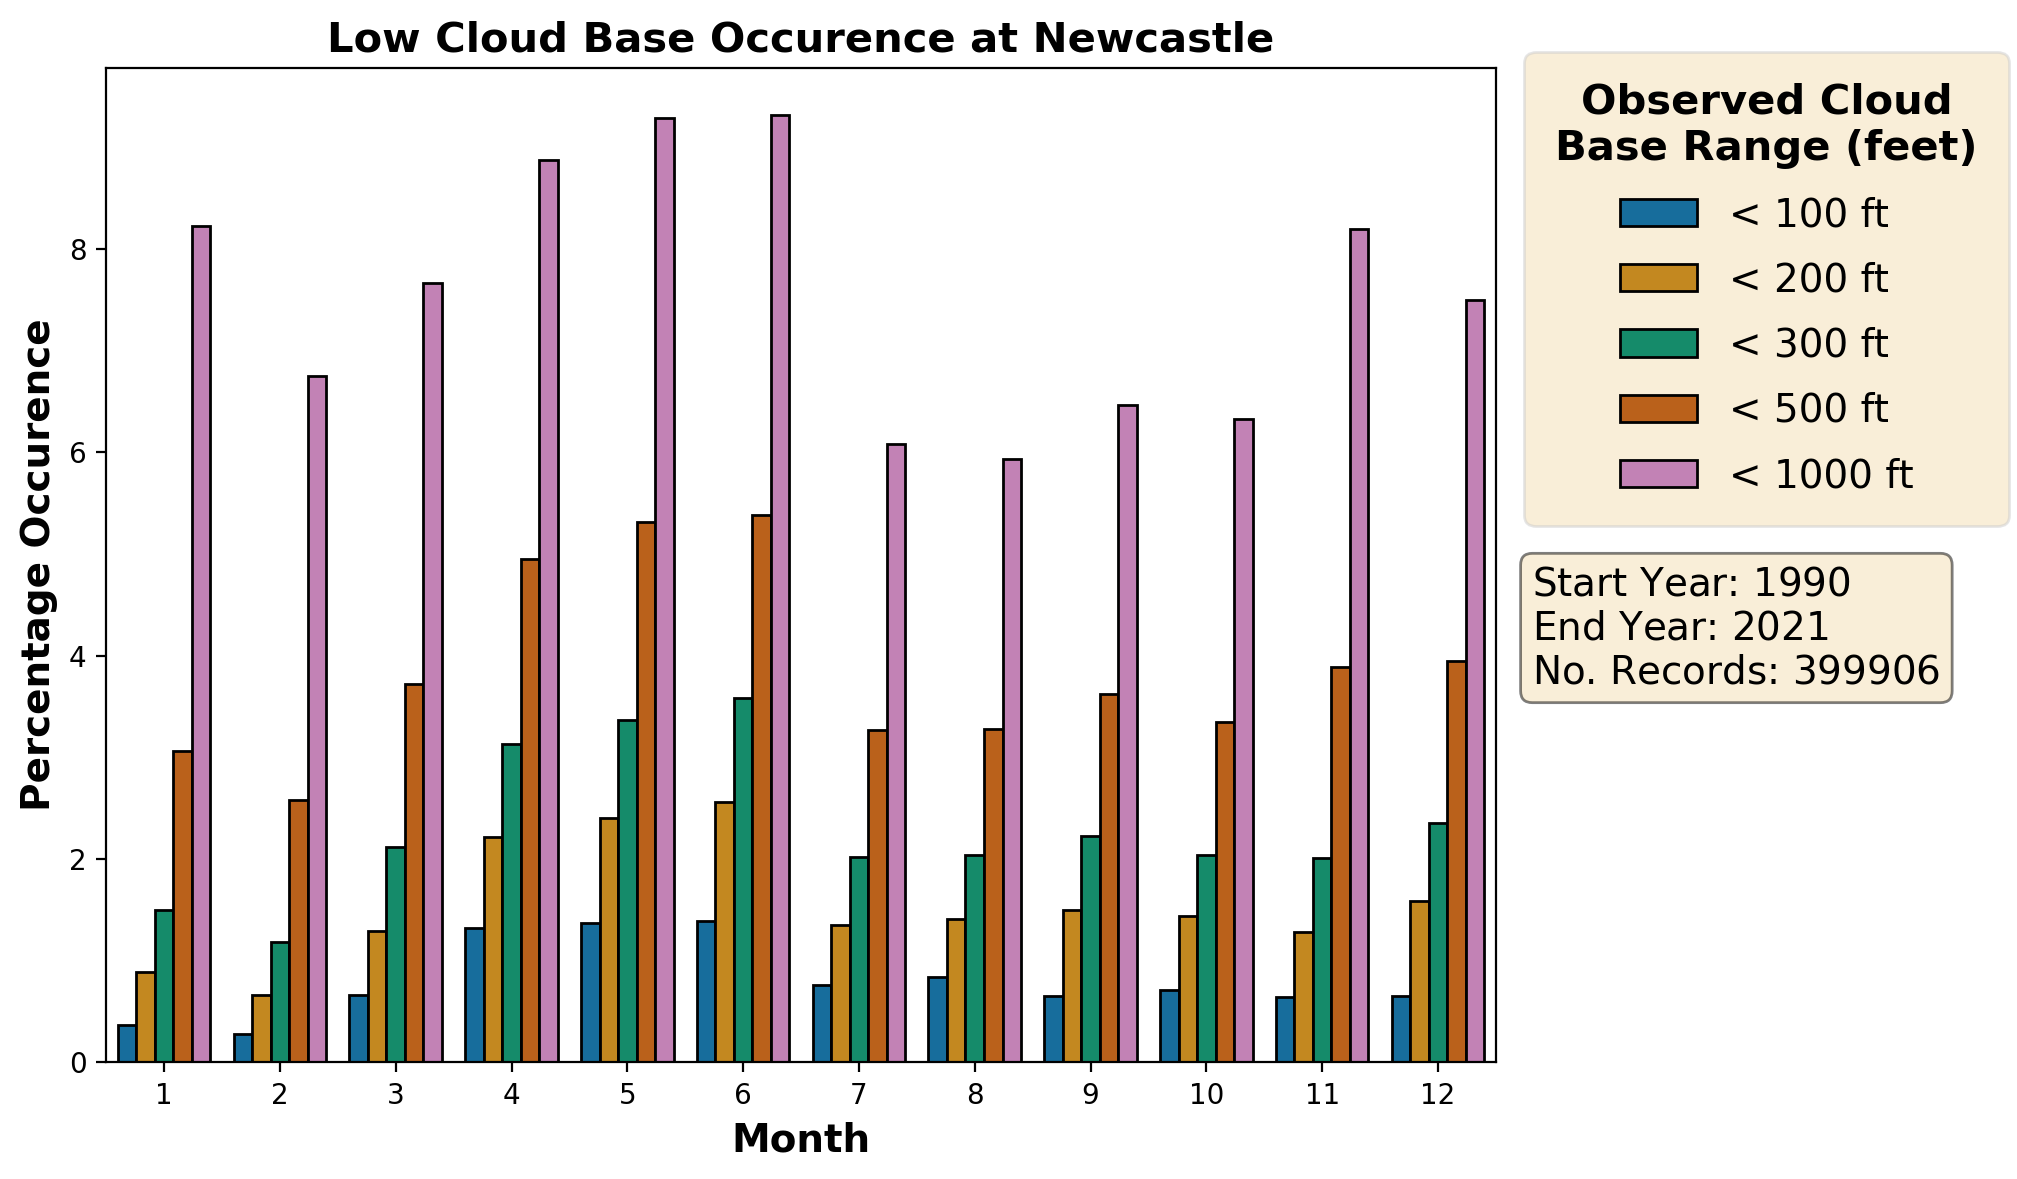
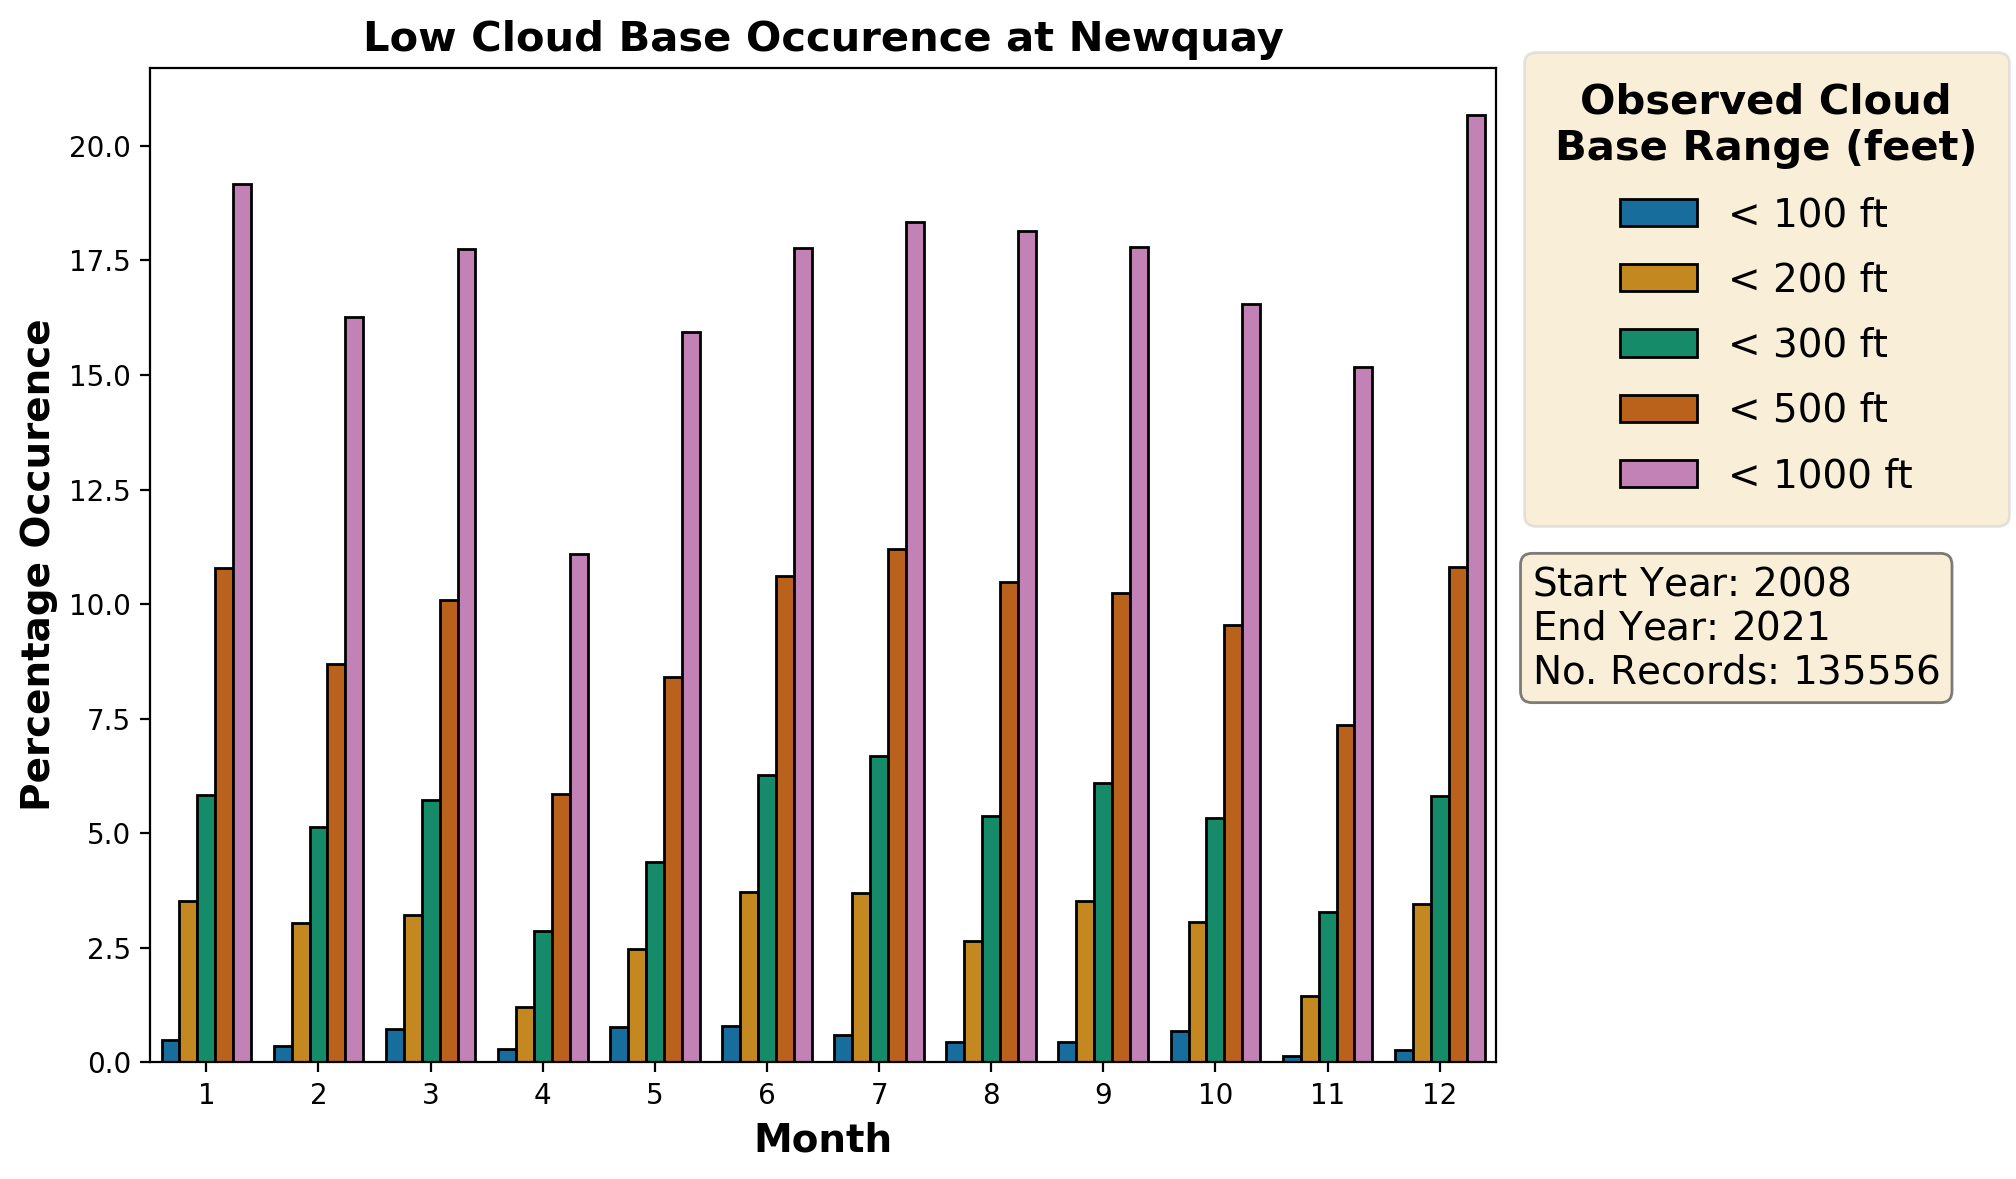
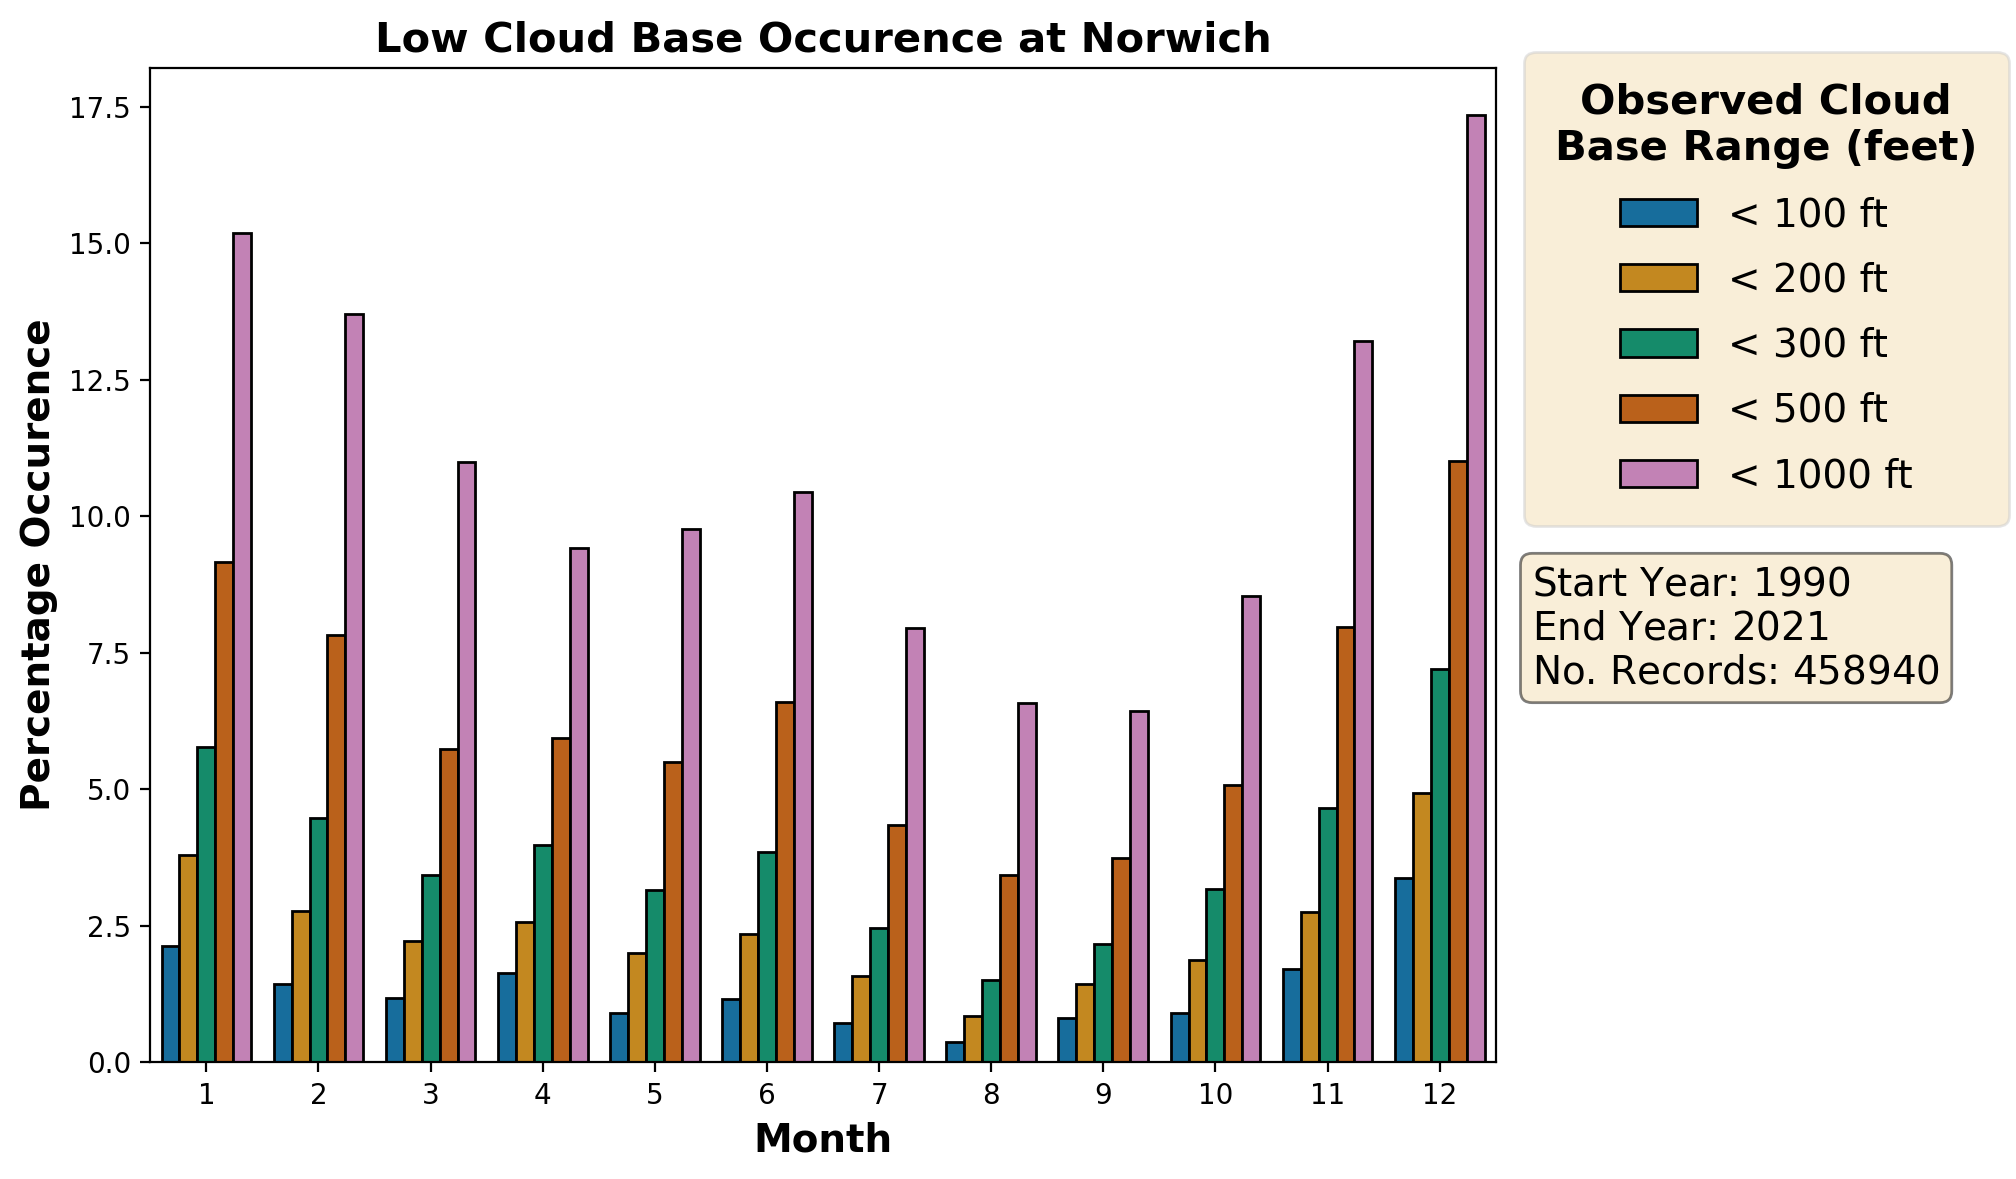
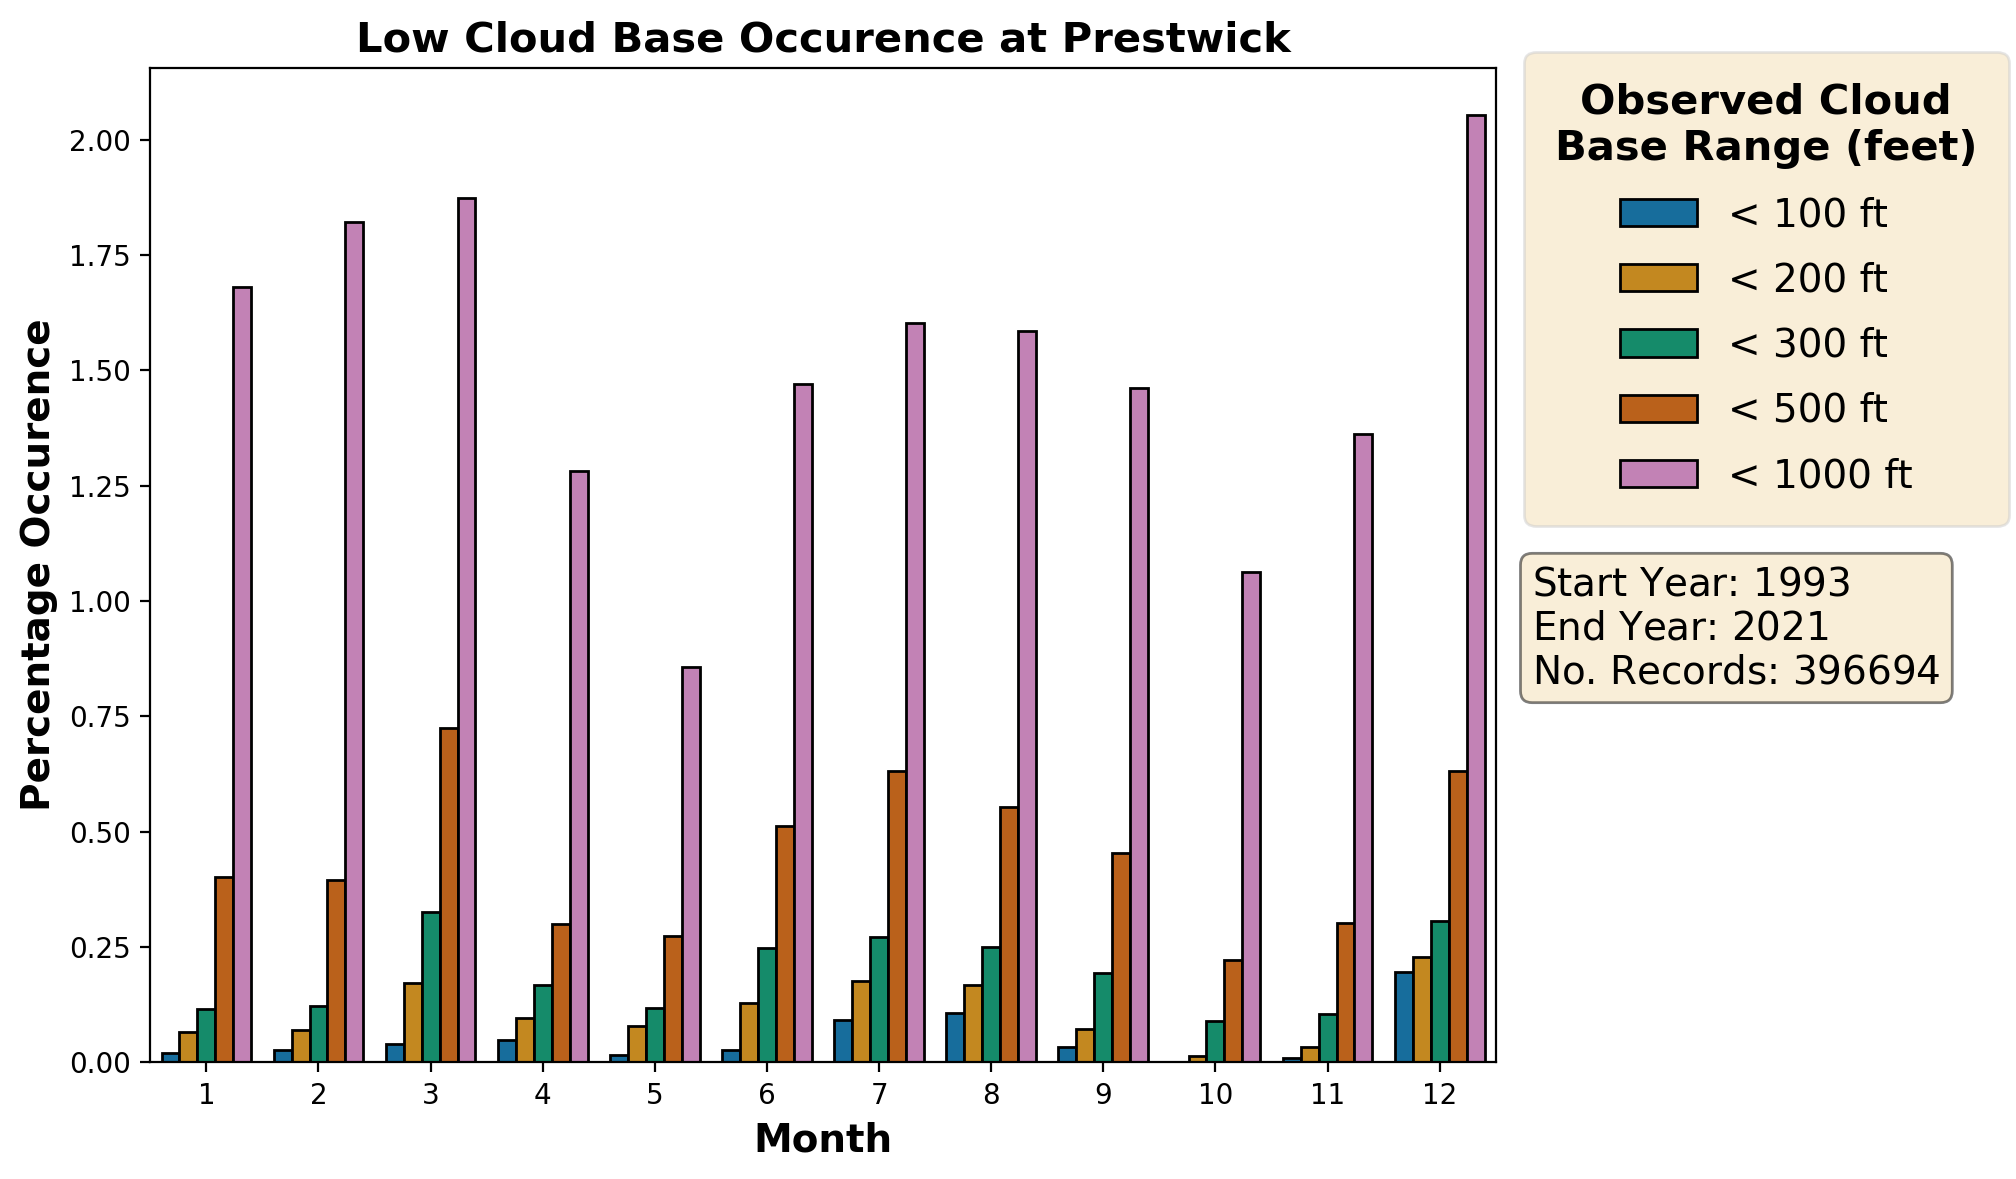
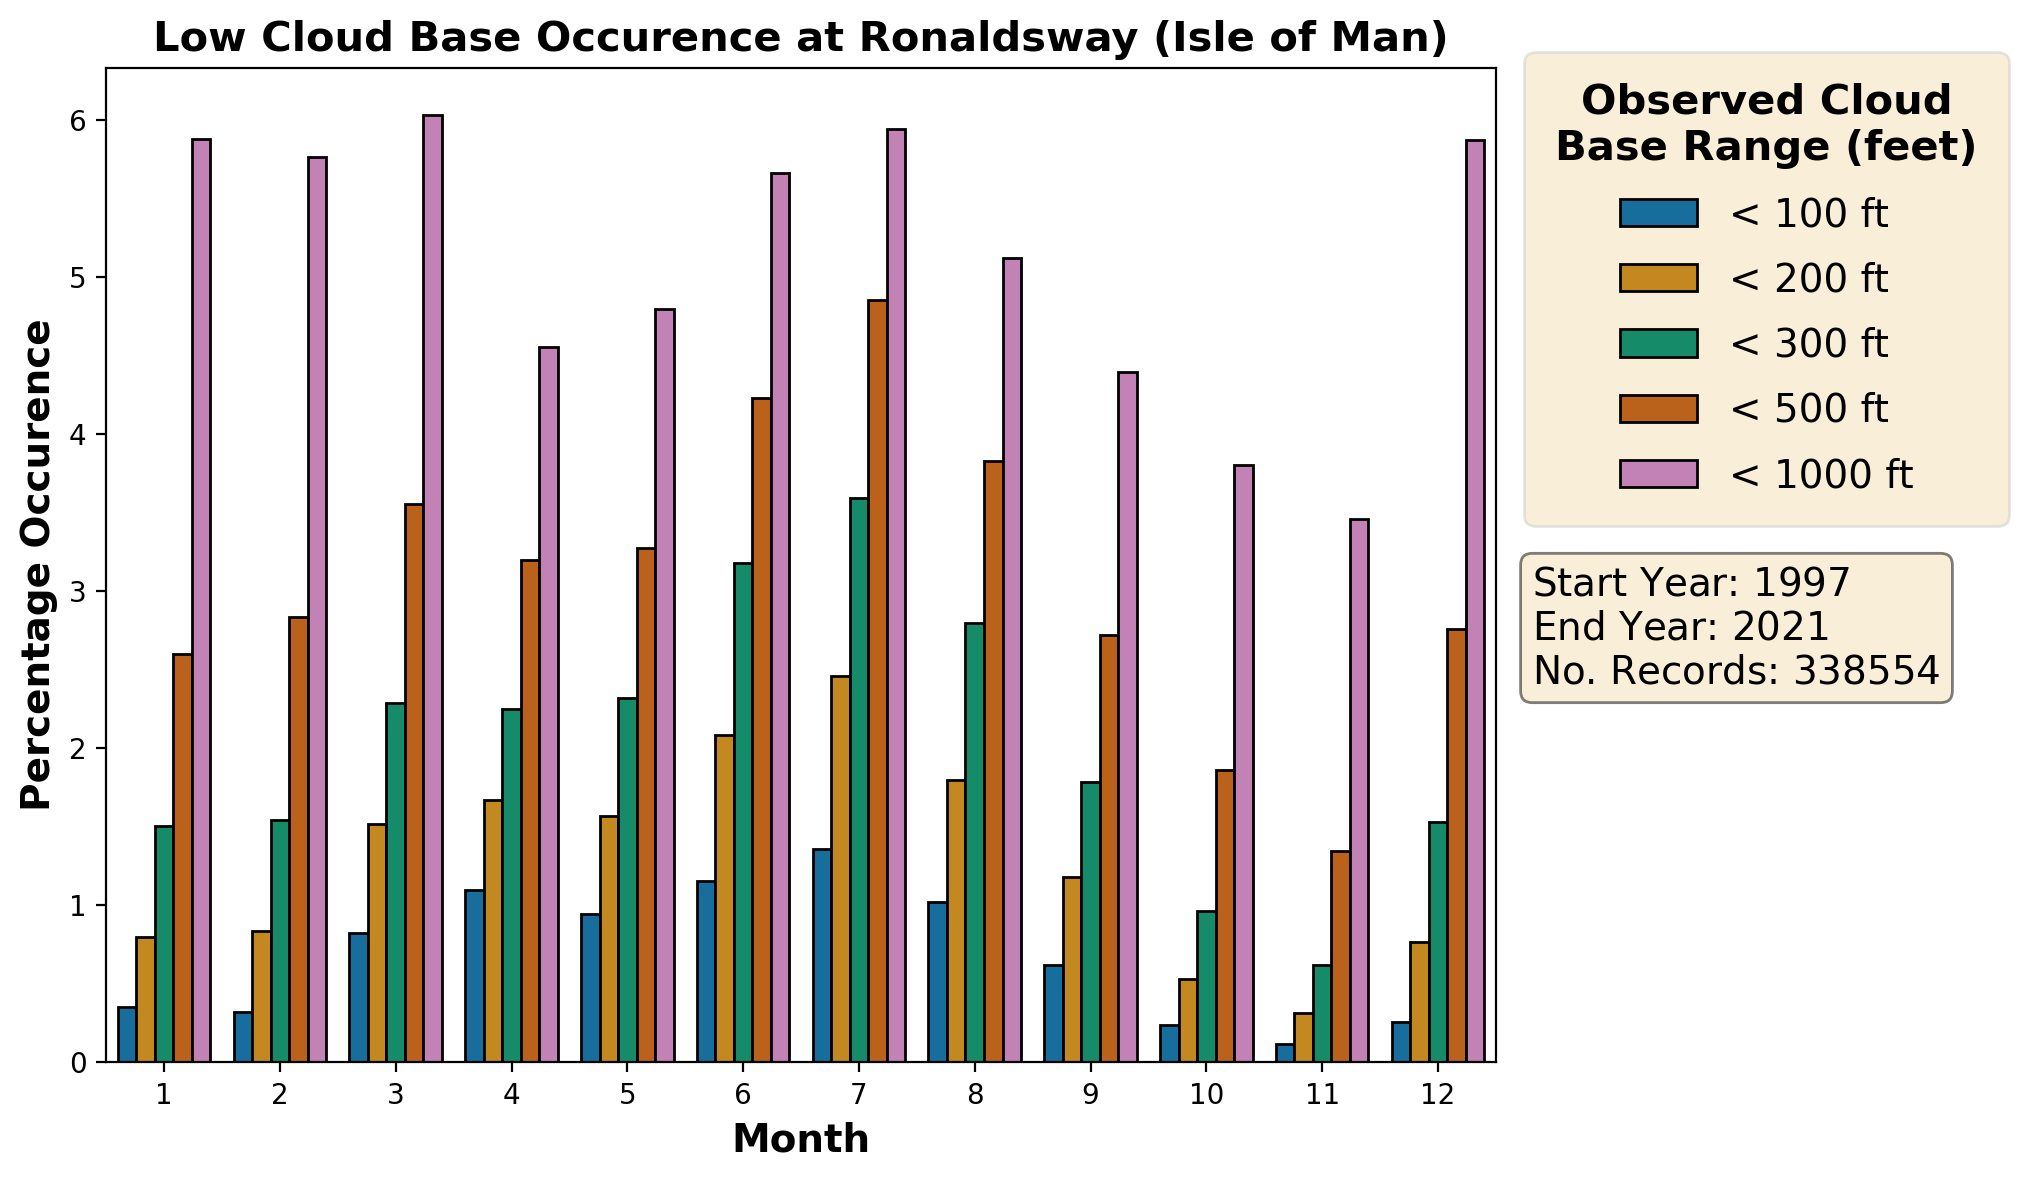
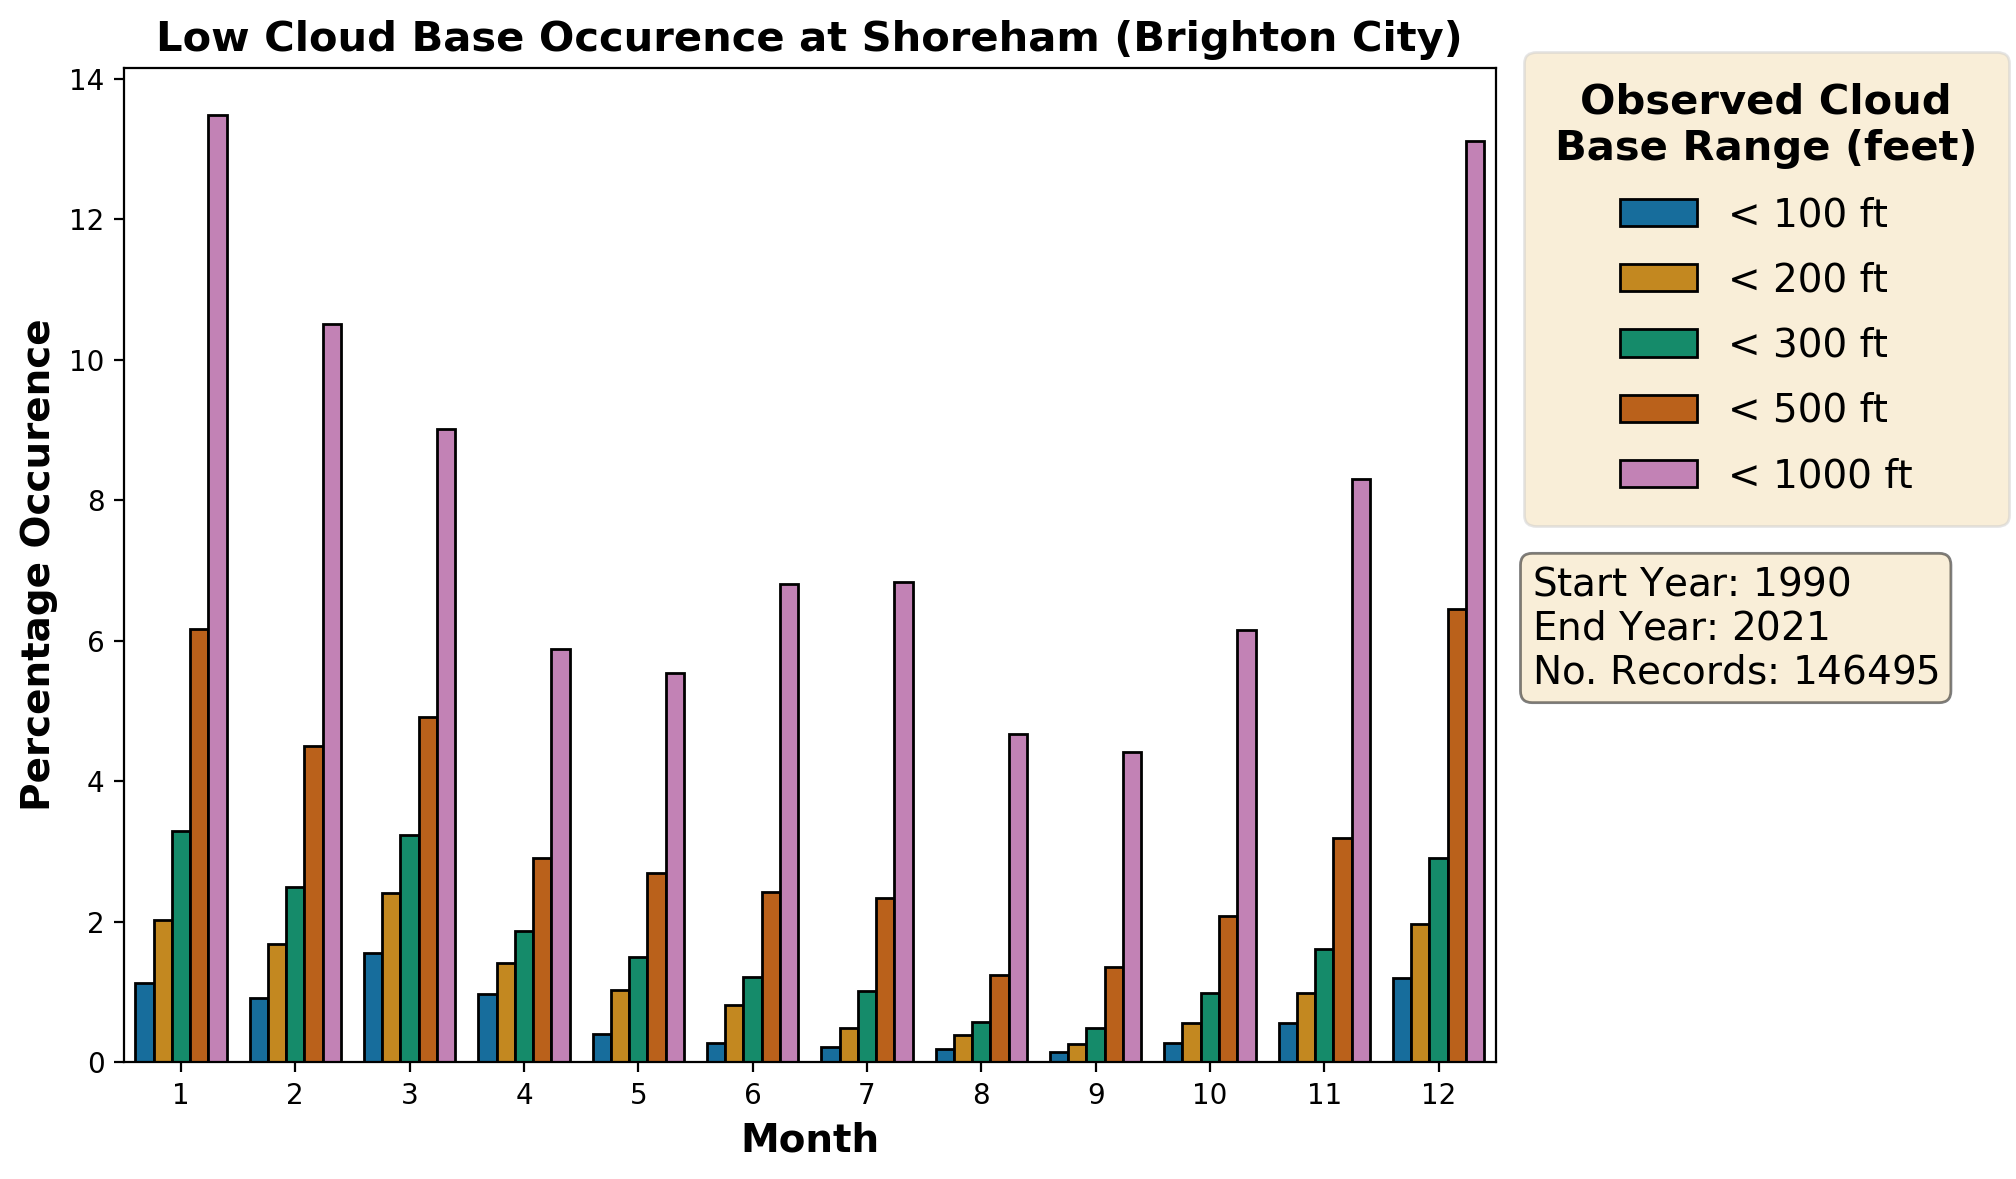
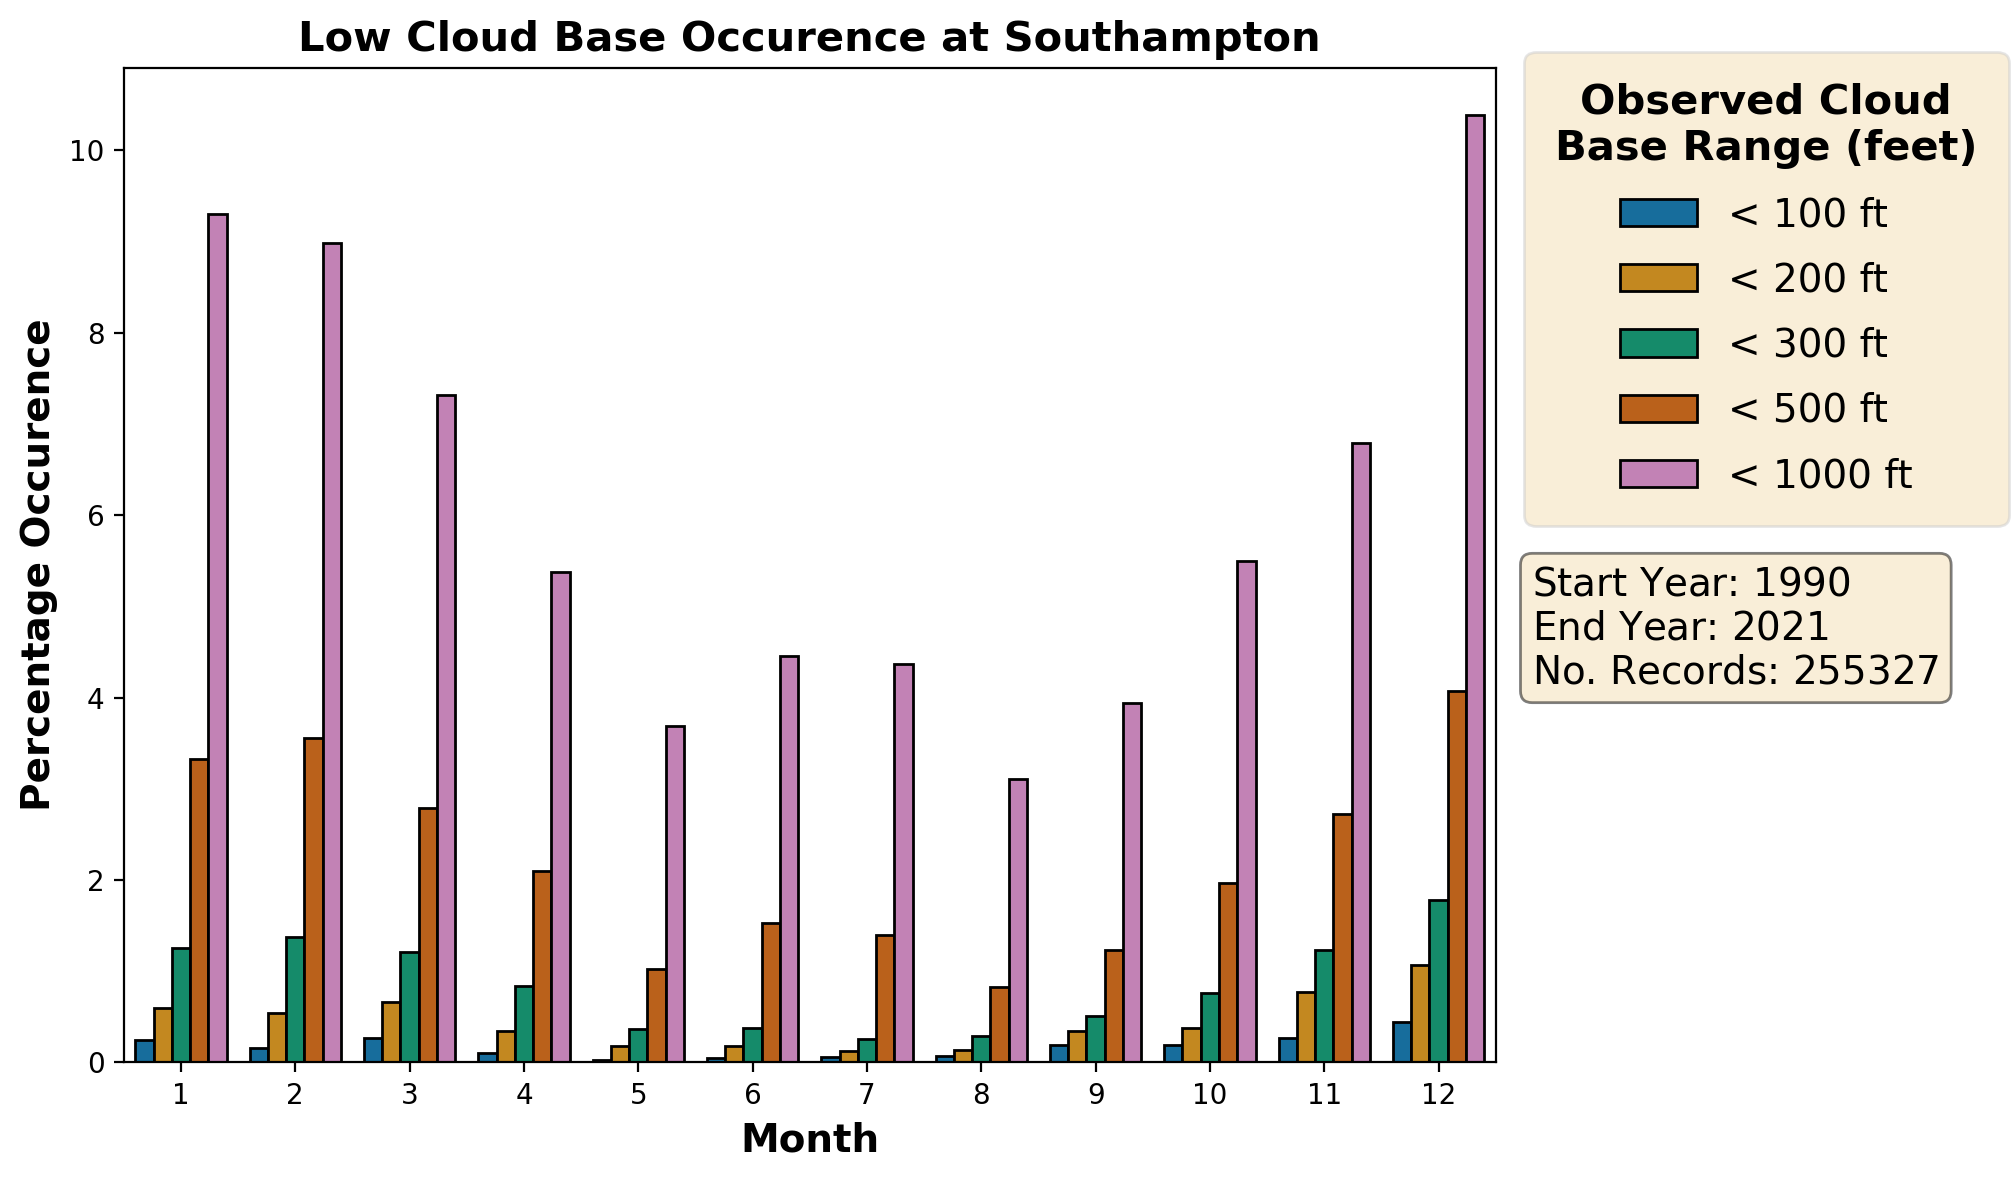
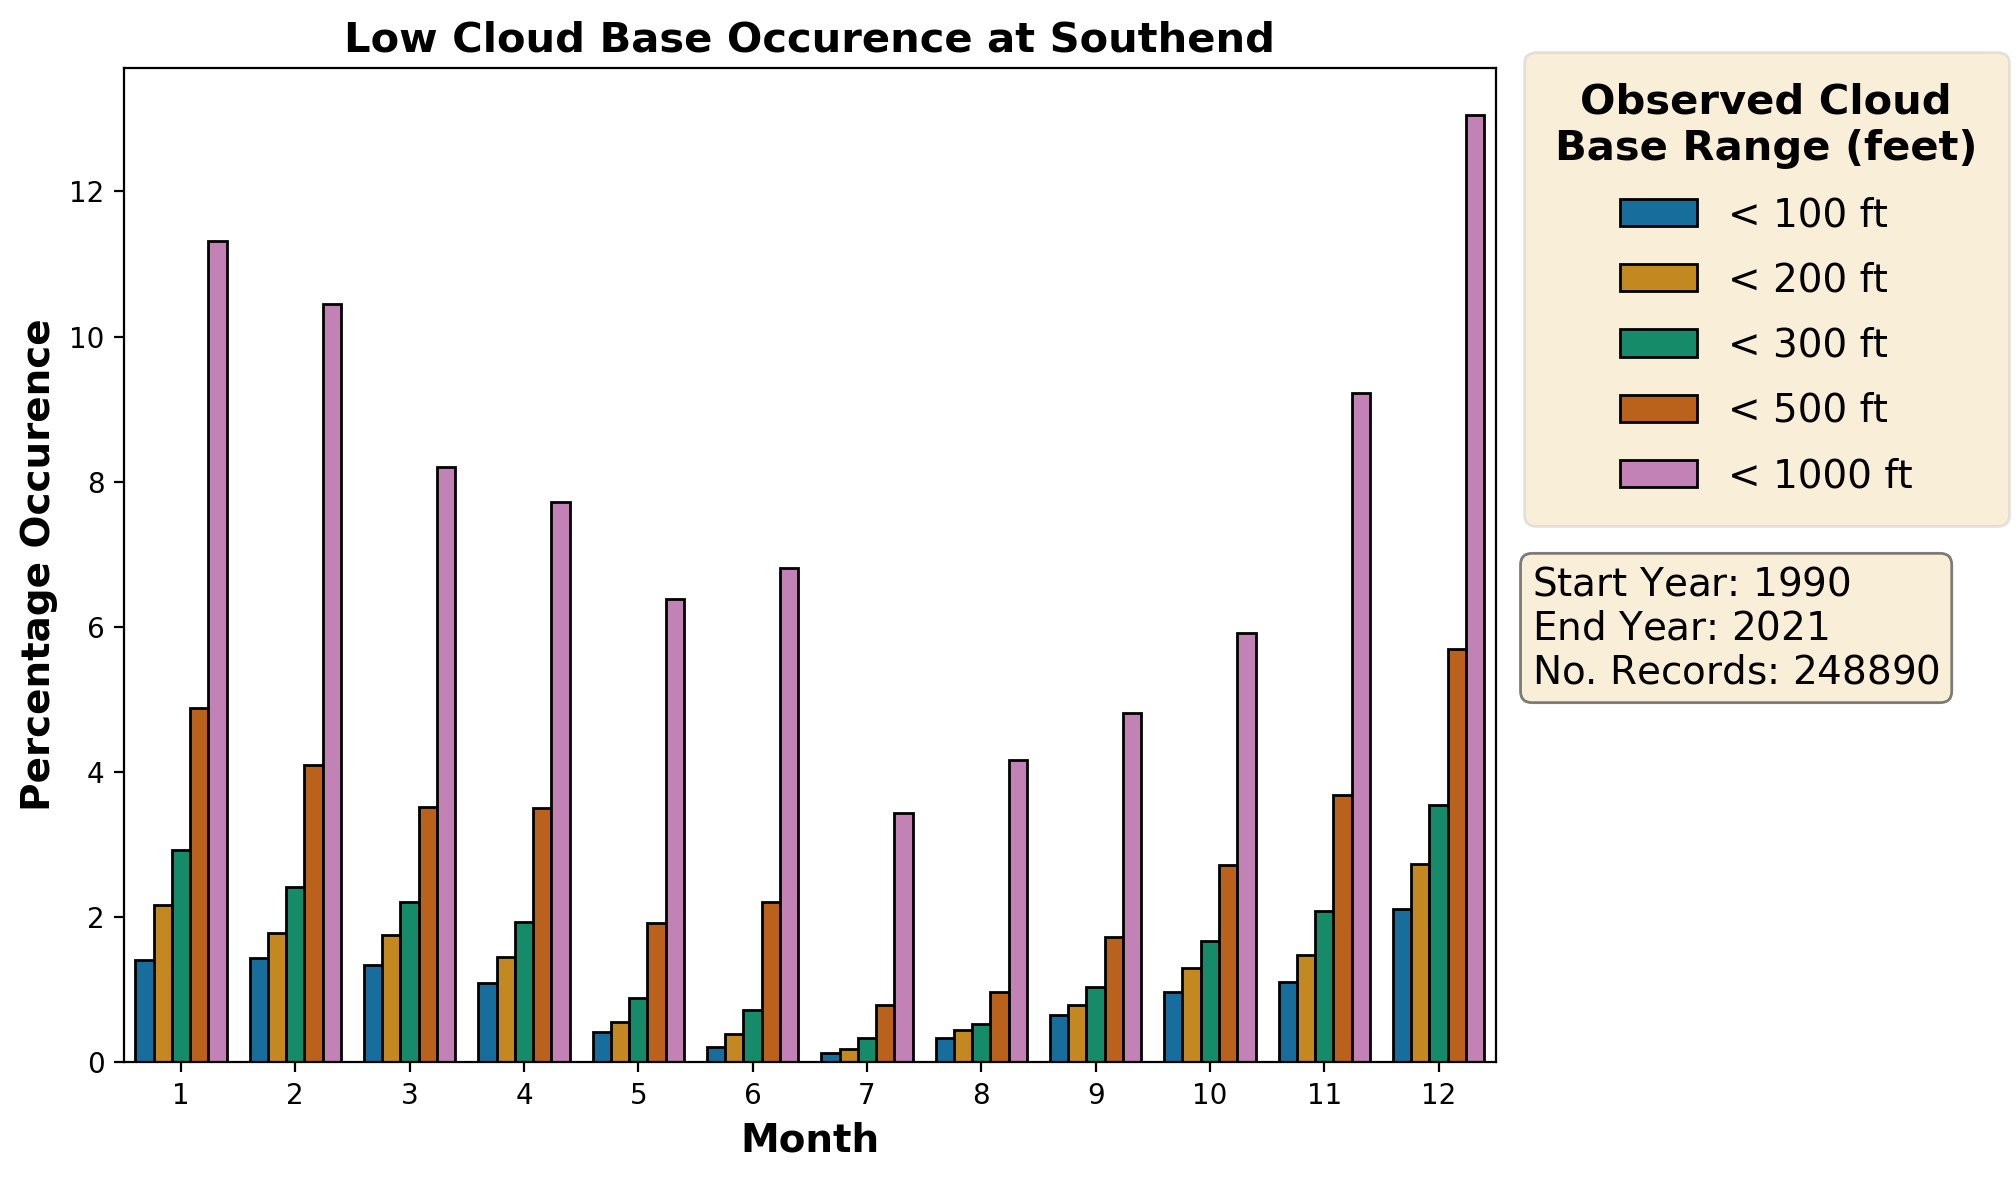
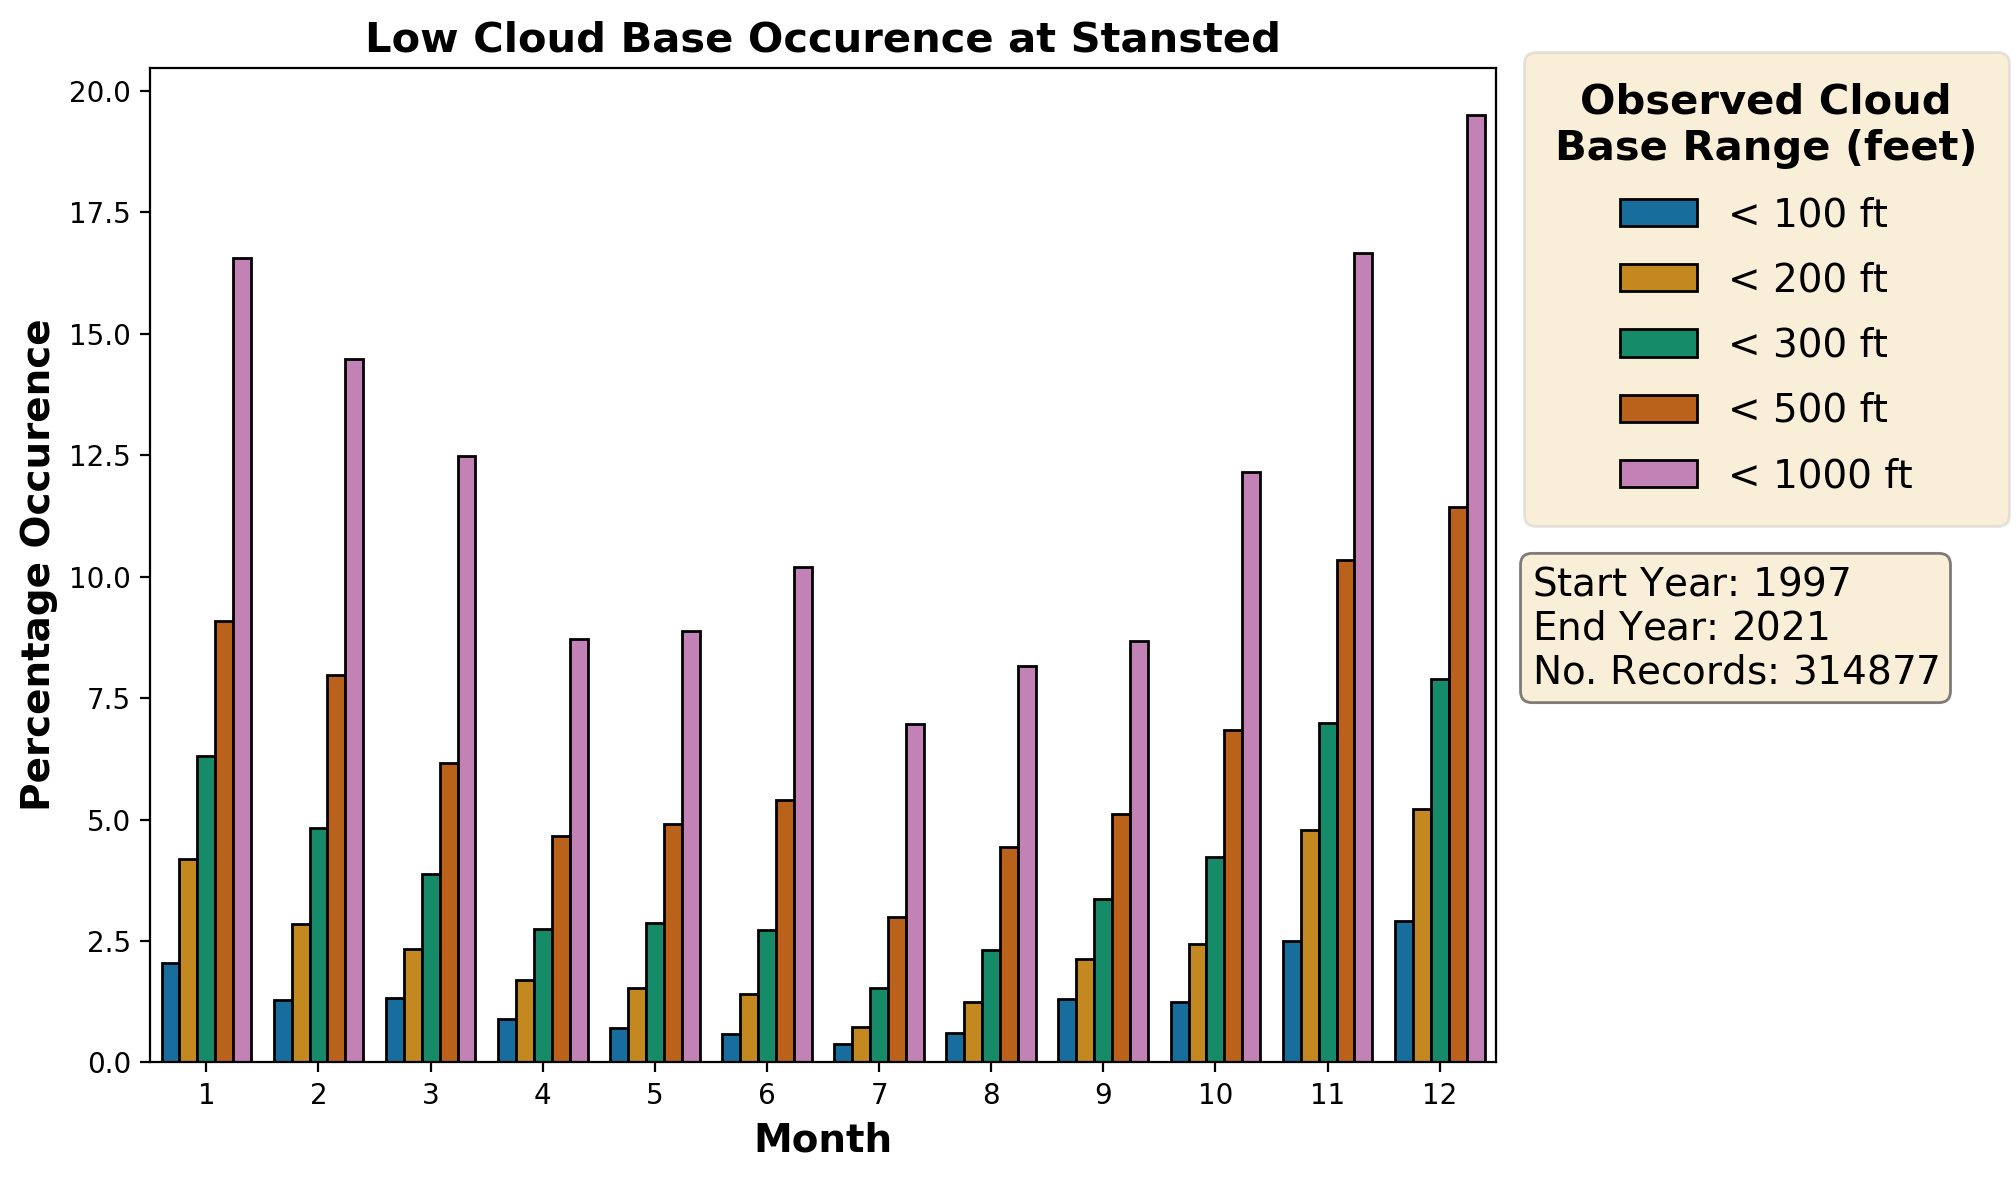
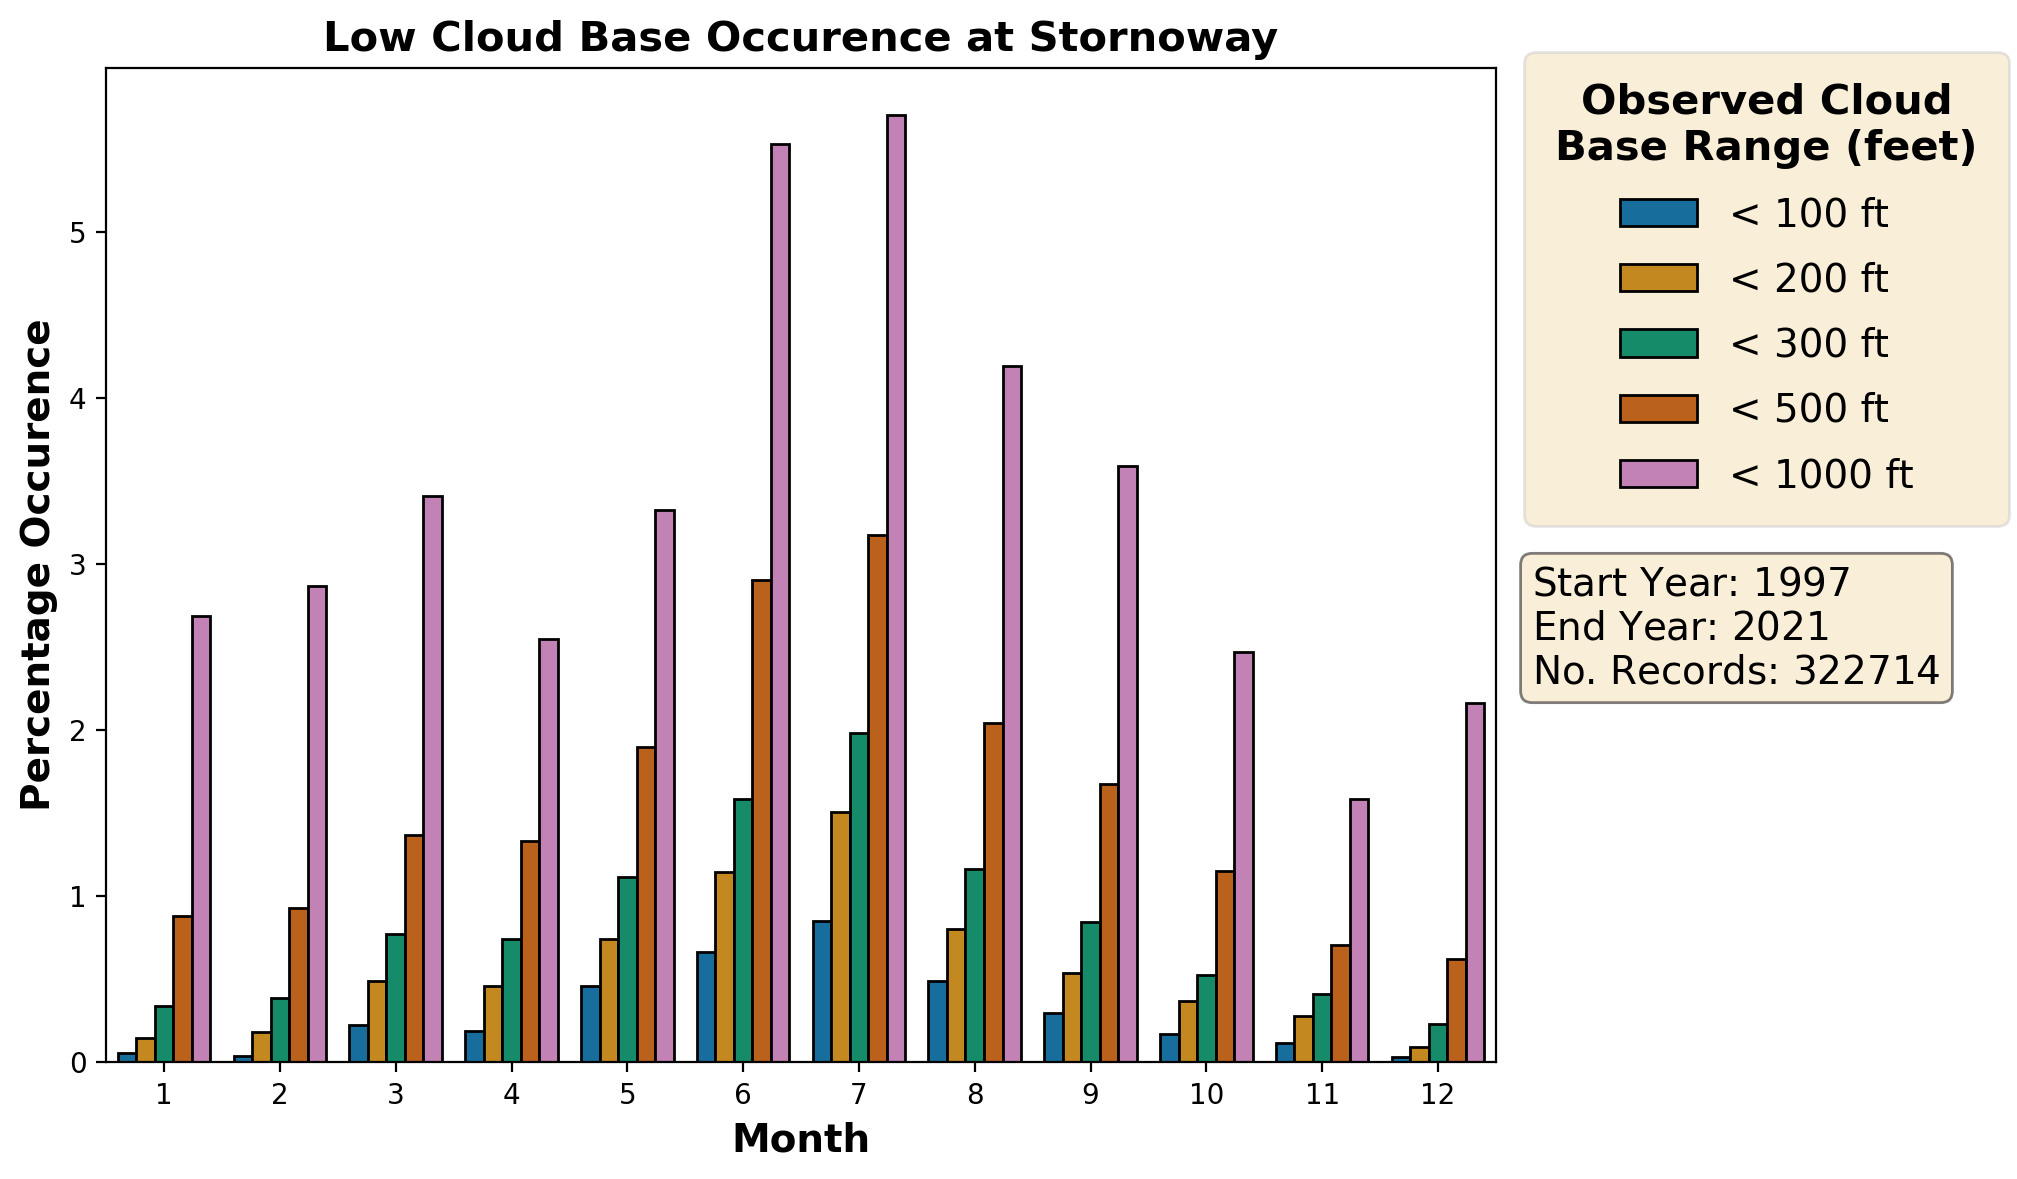
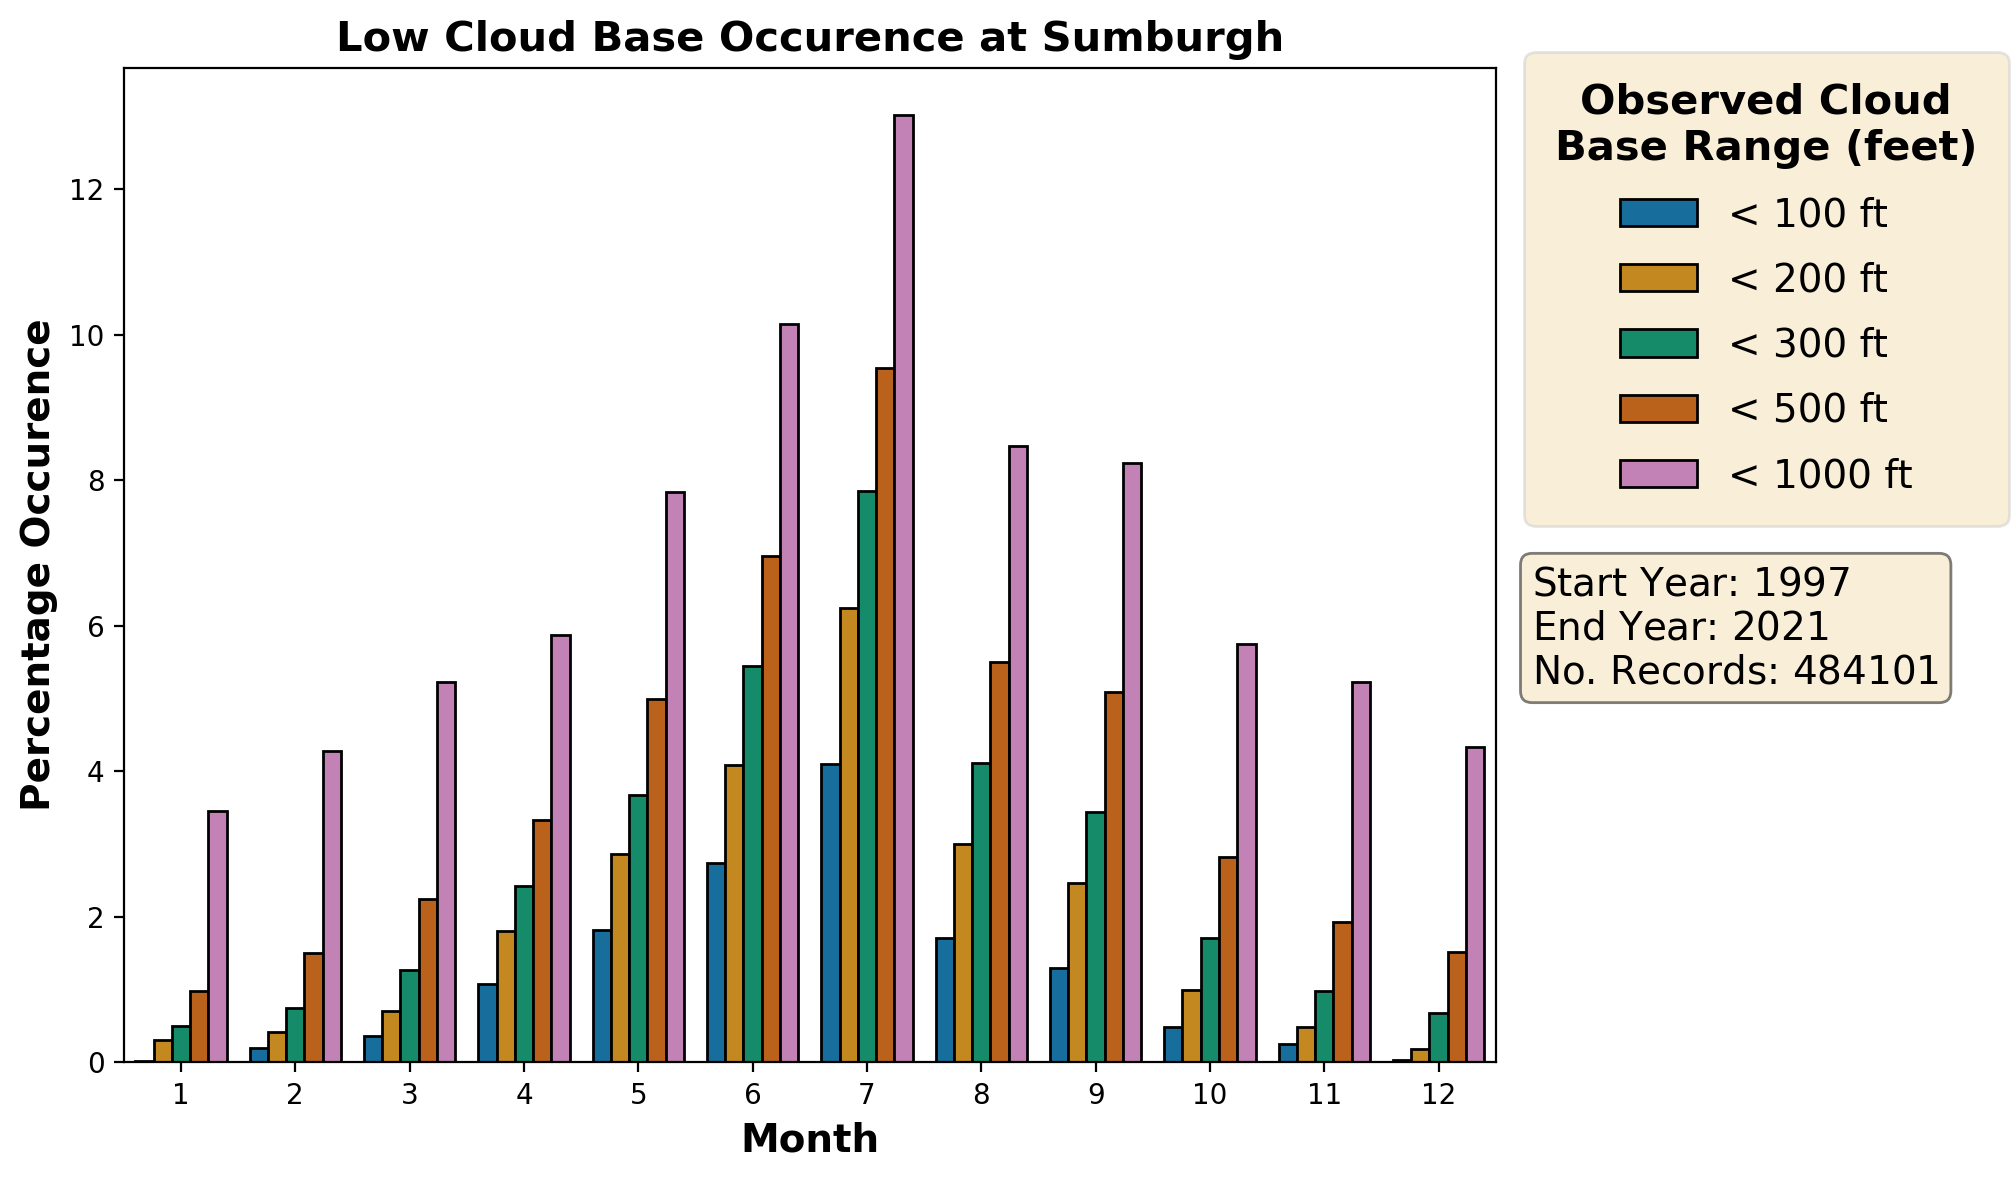
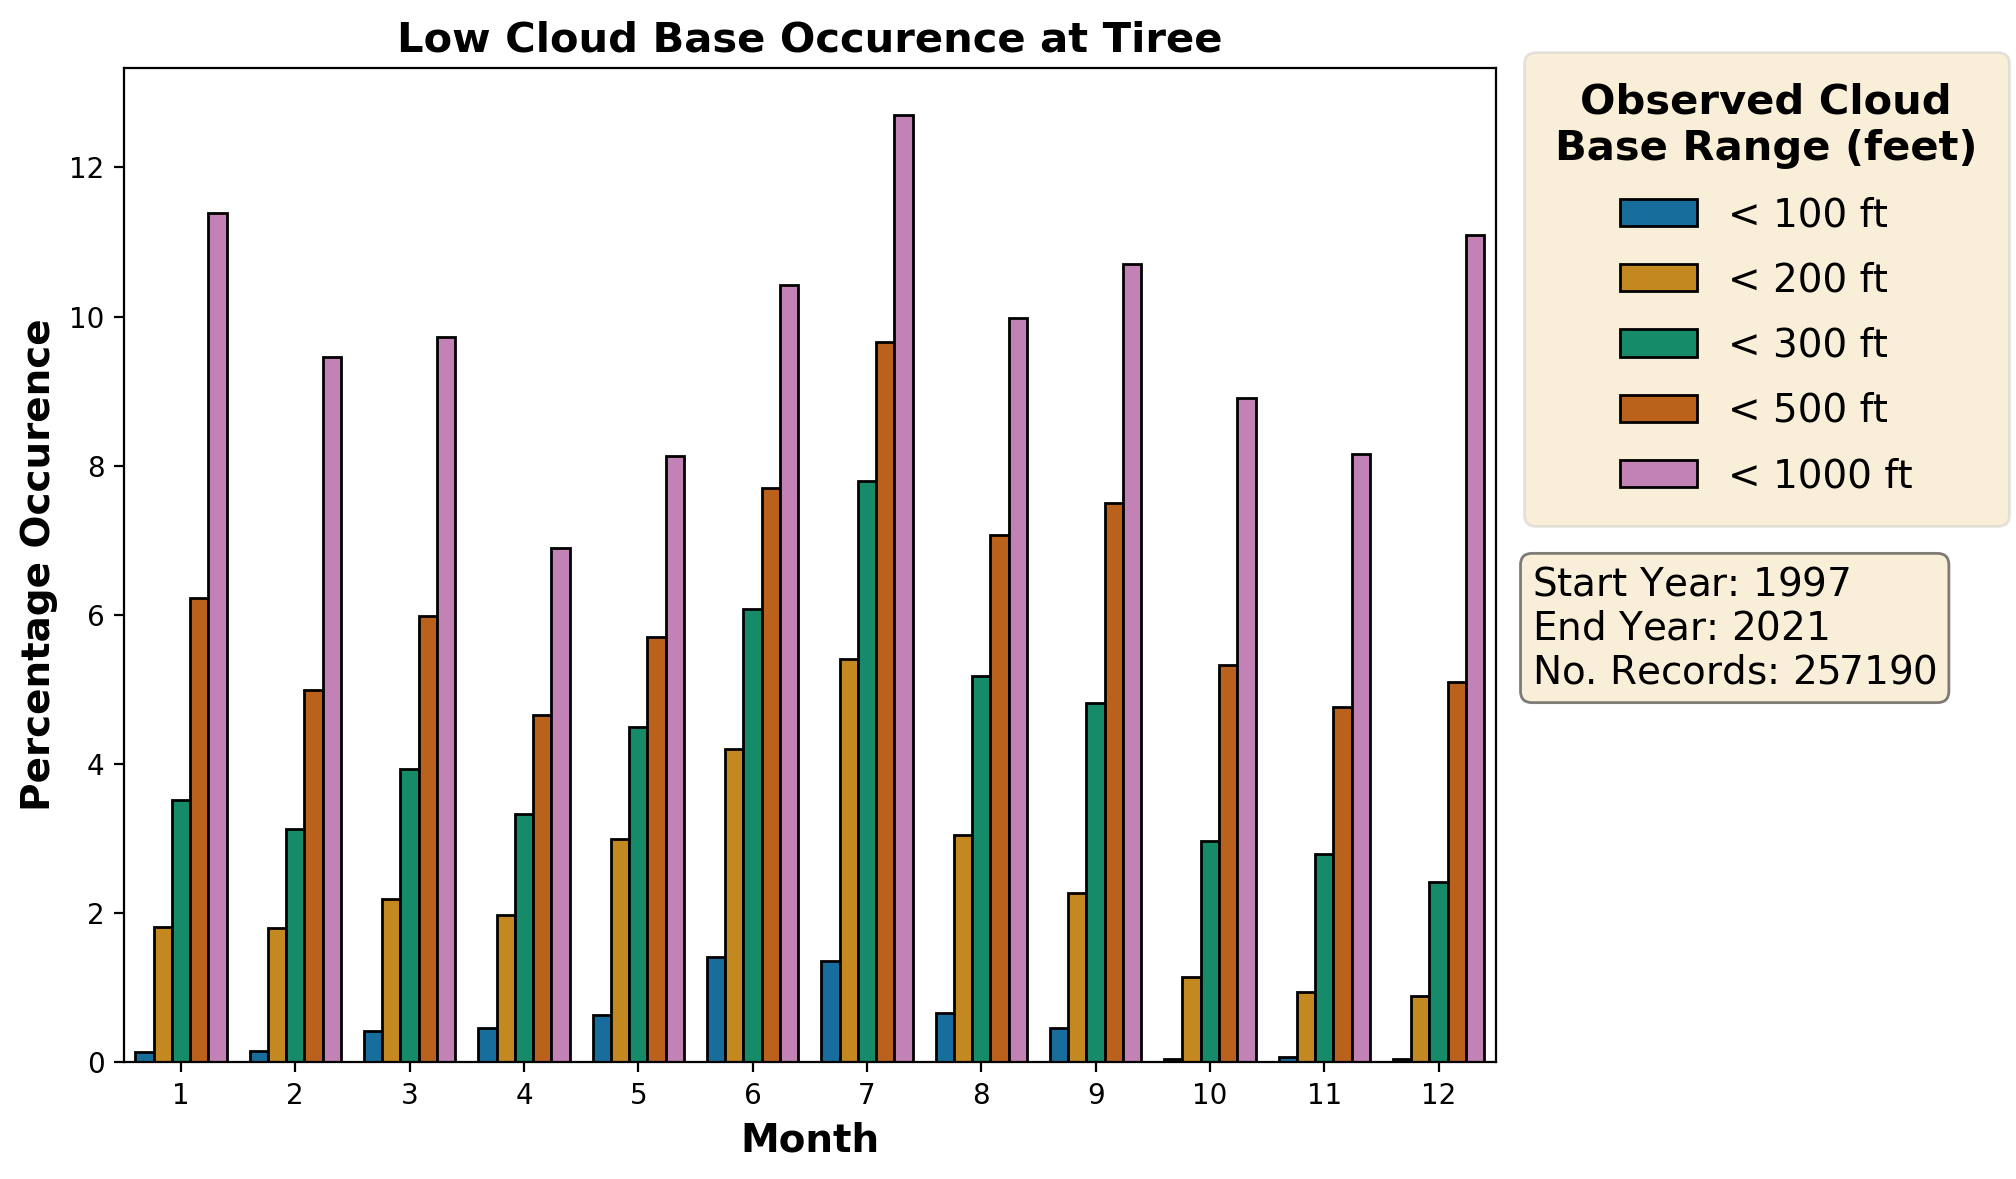
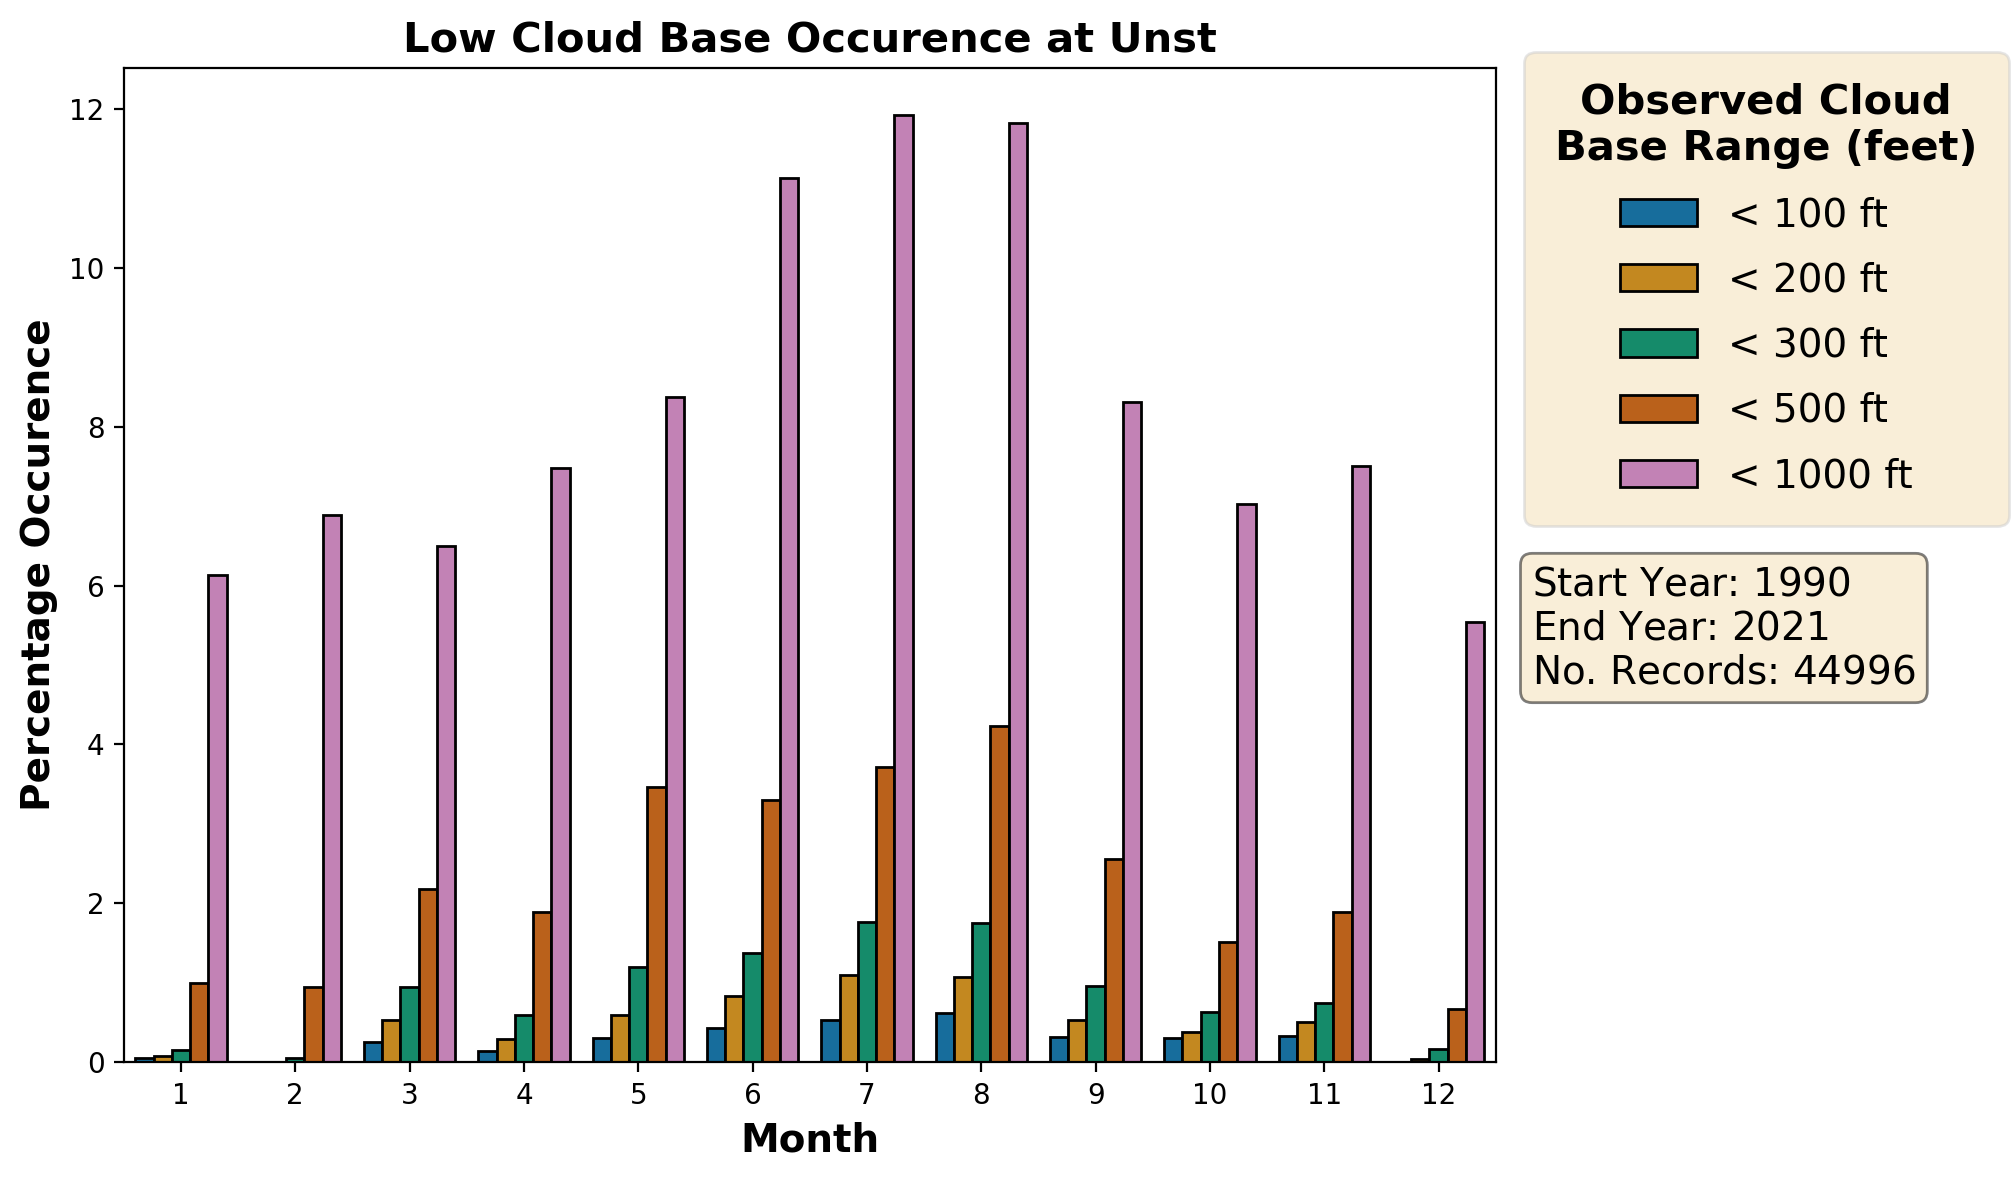
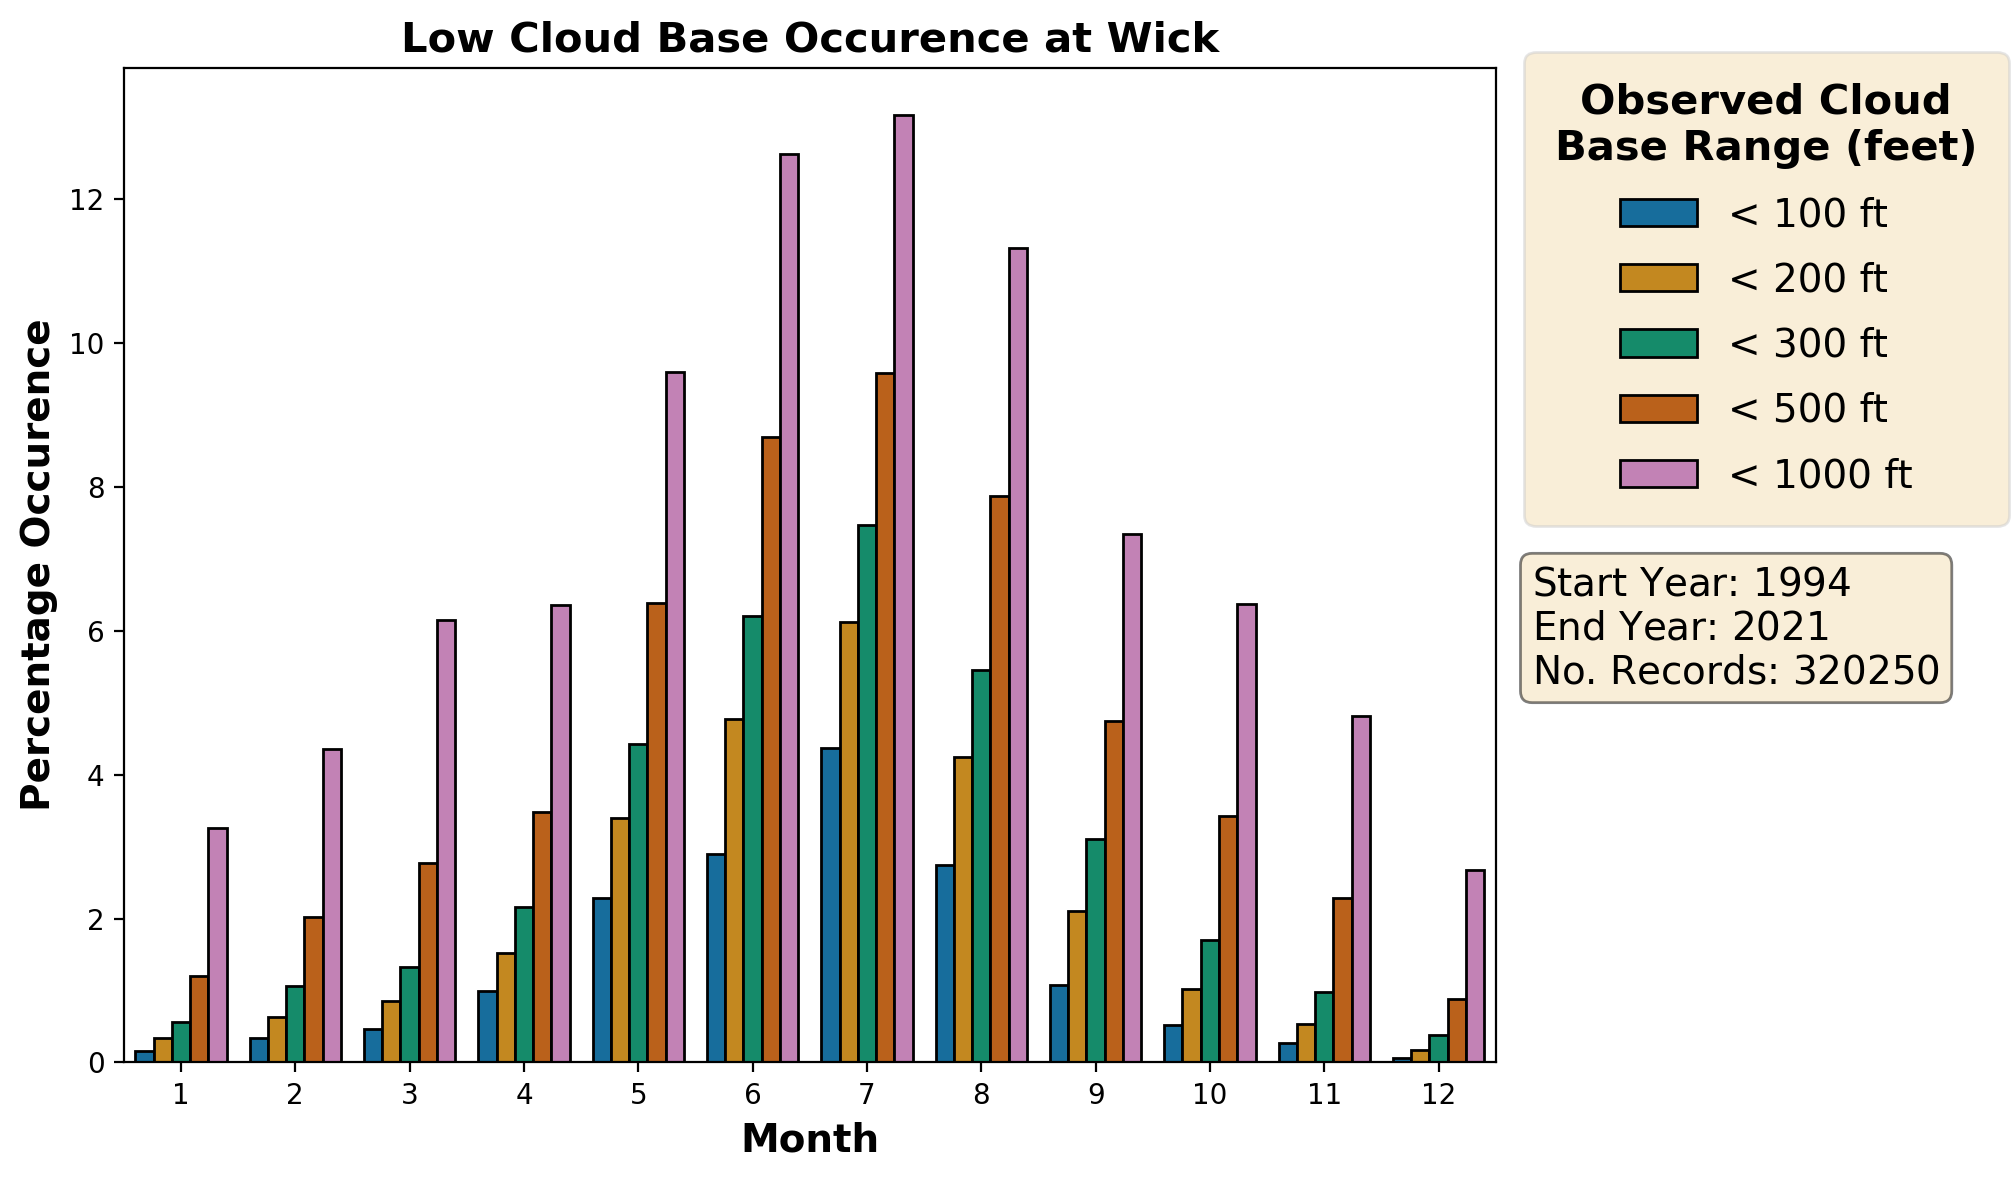
Cloud-base Occurence
This plot shows the percentage of observations per month where a cloud base (at least 5 oktas coverage) falls between thresholds.
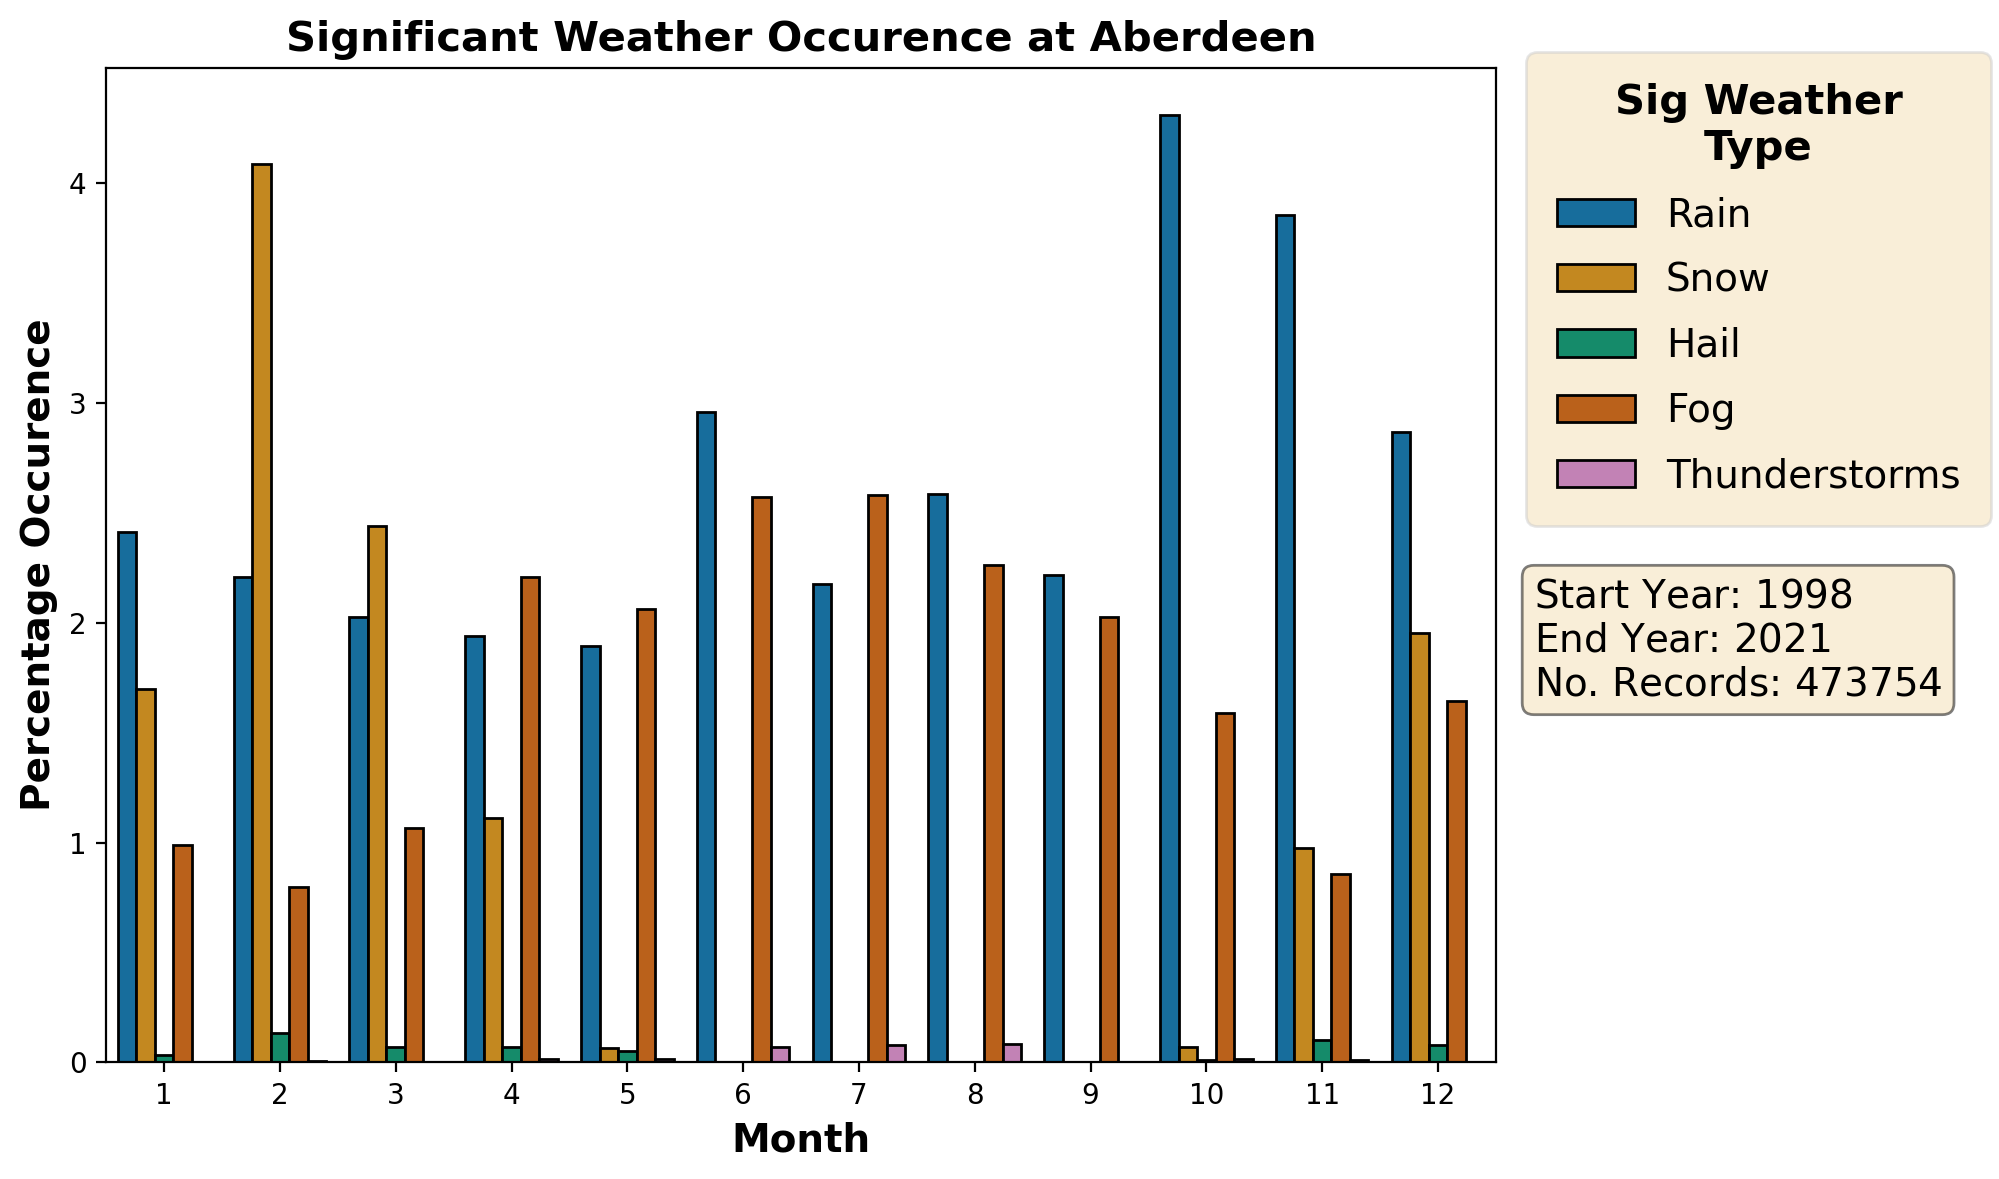
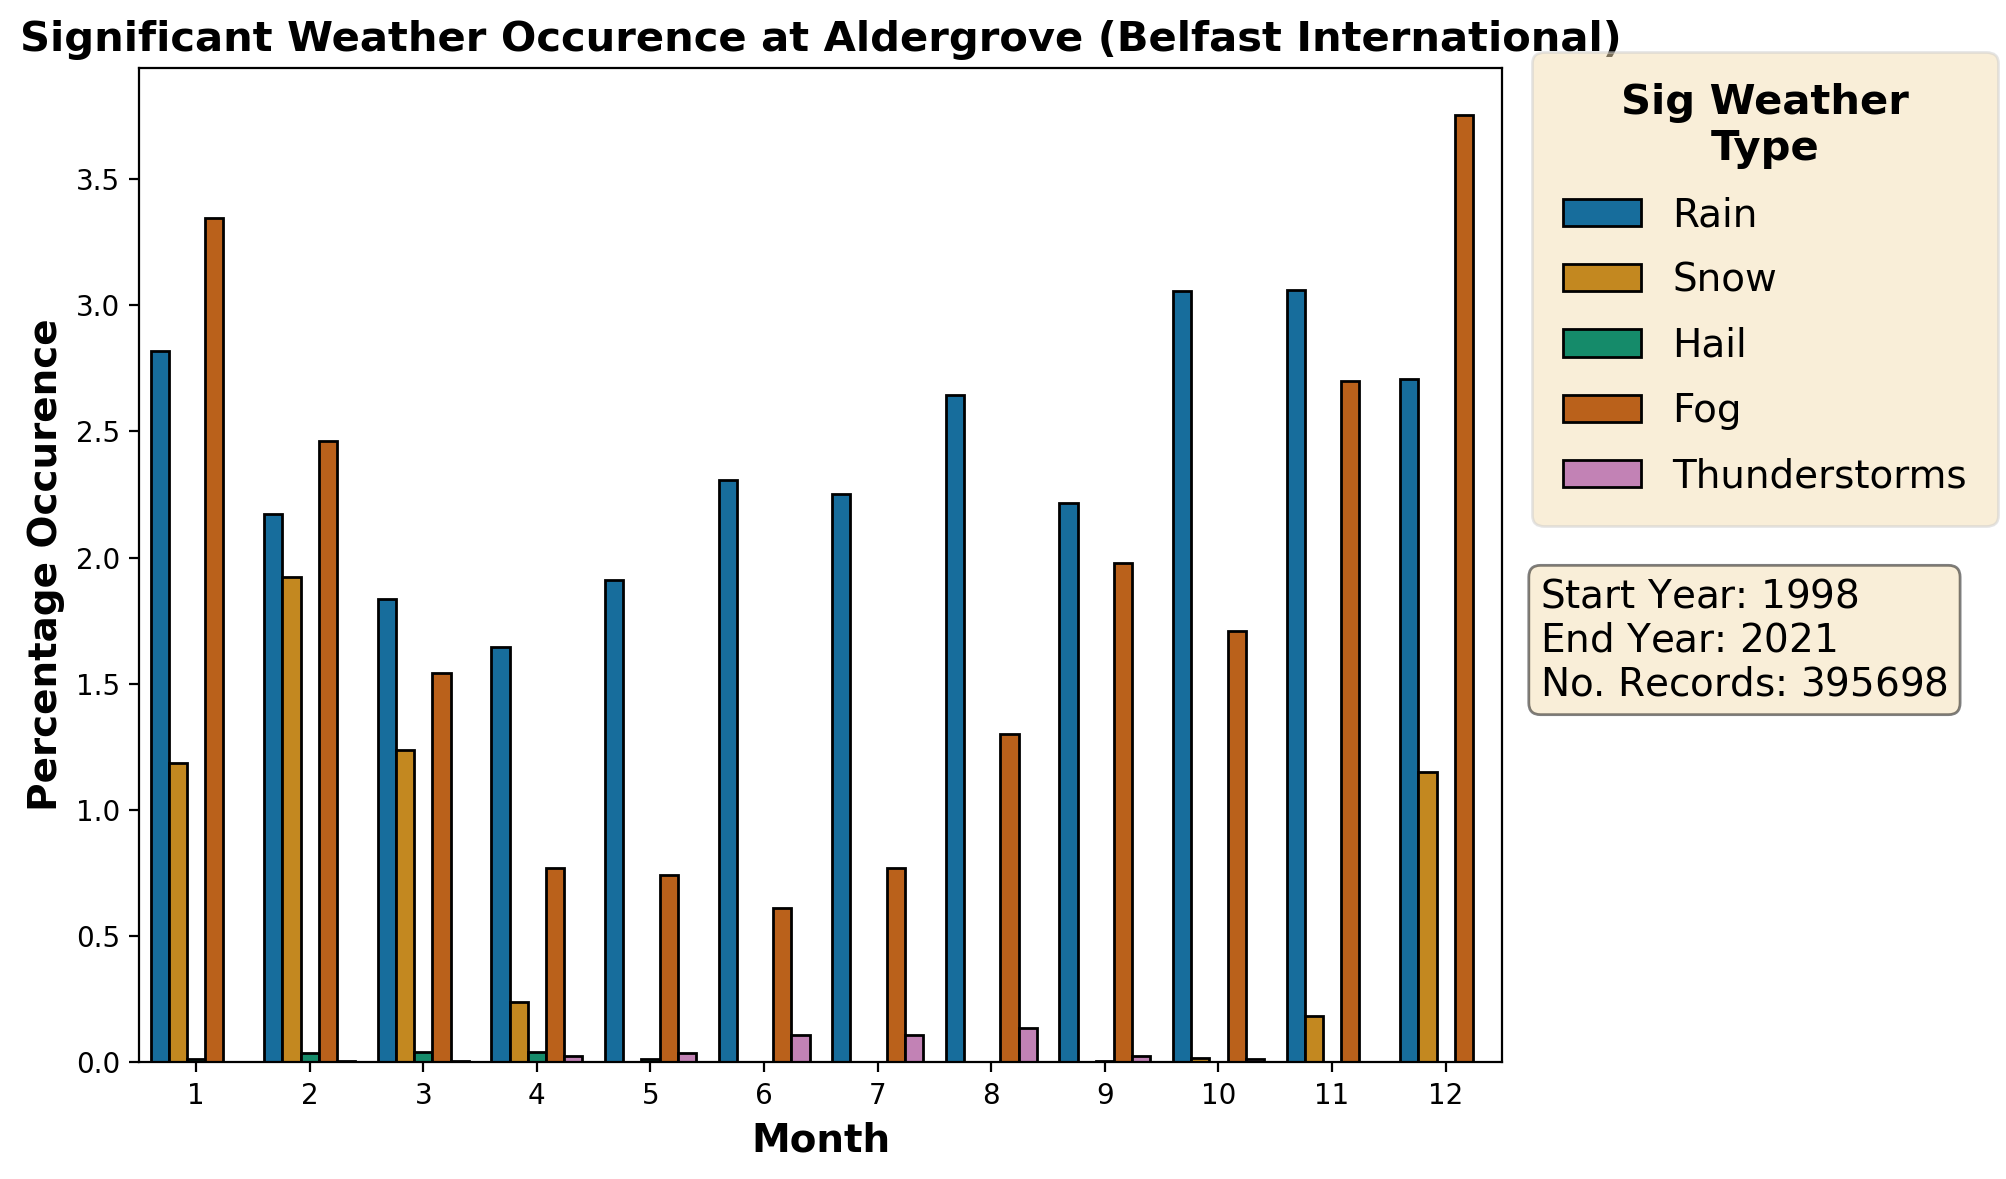
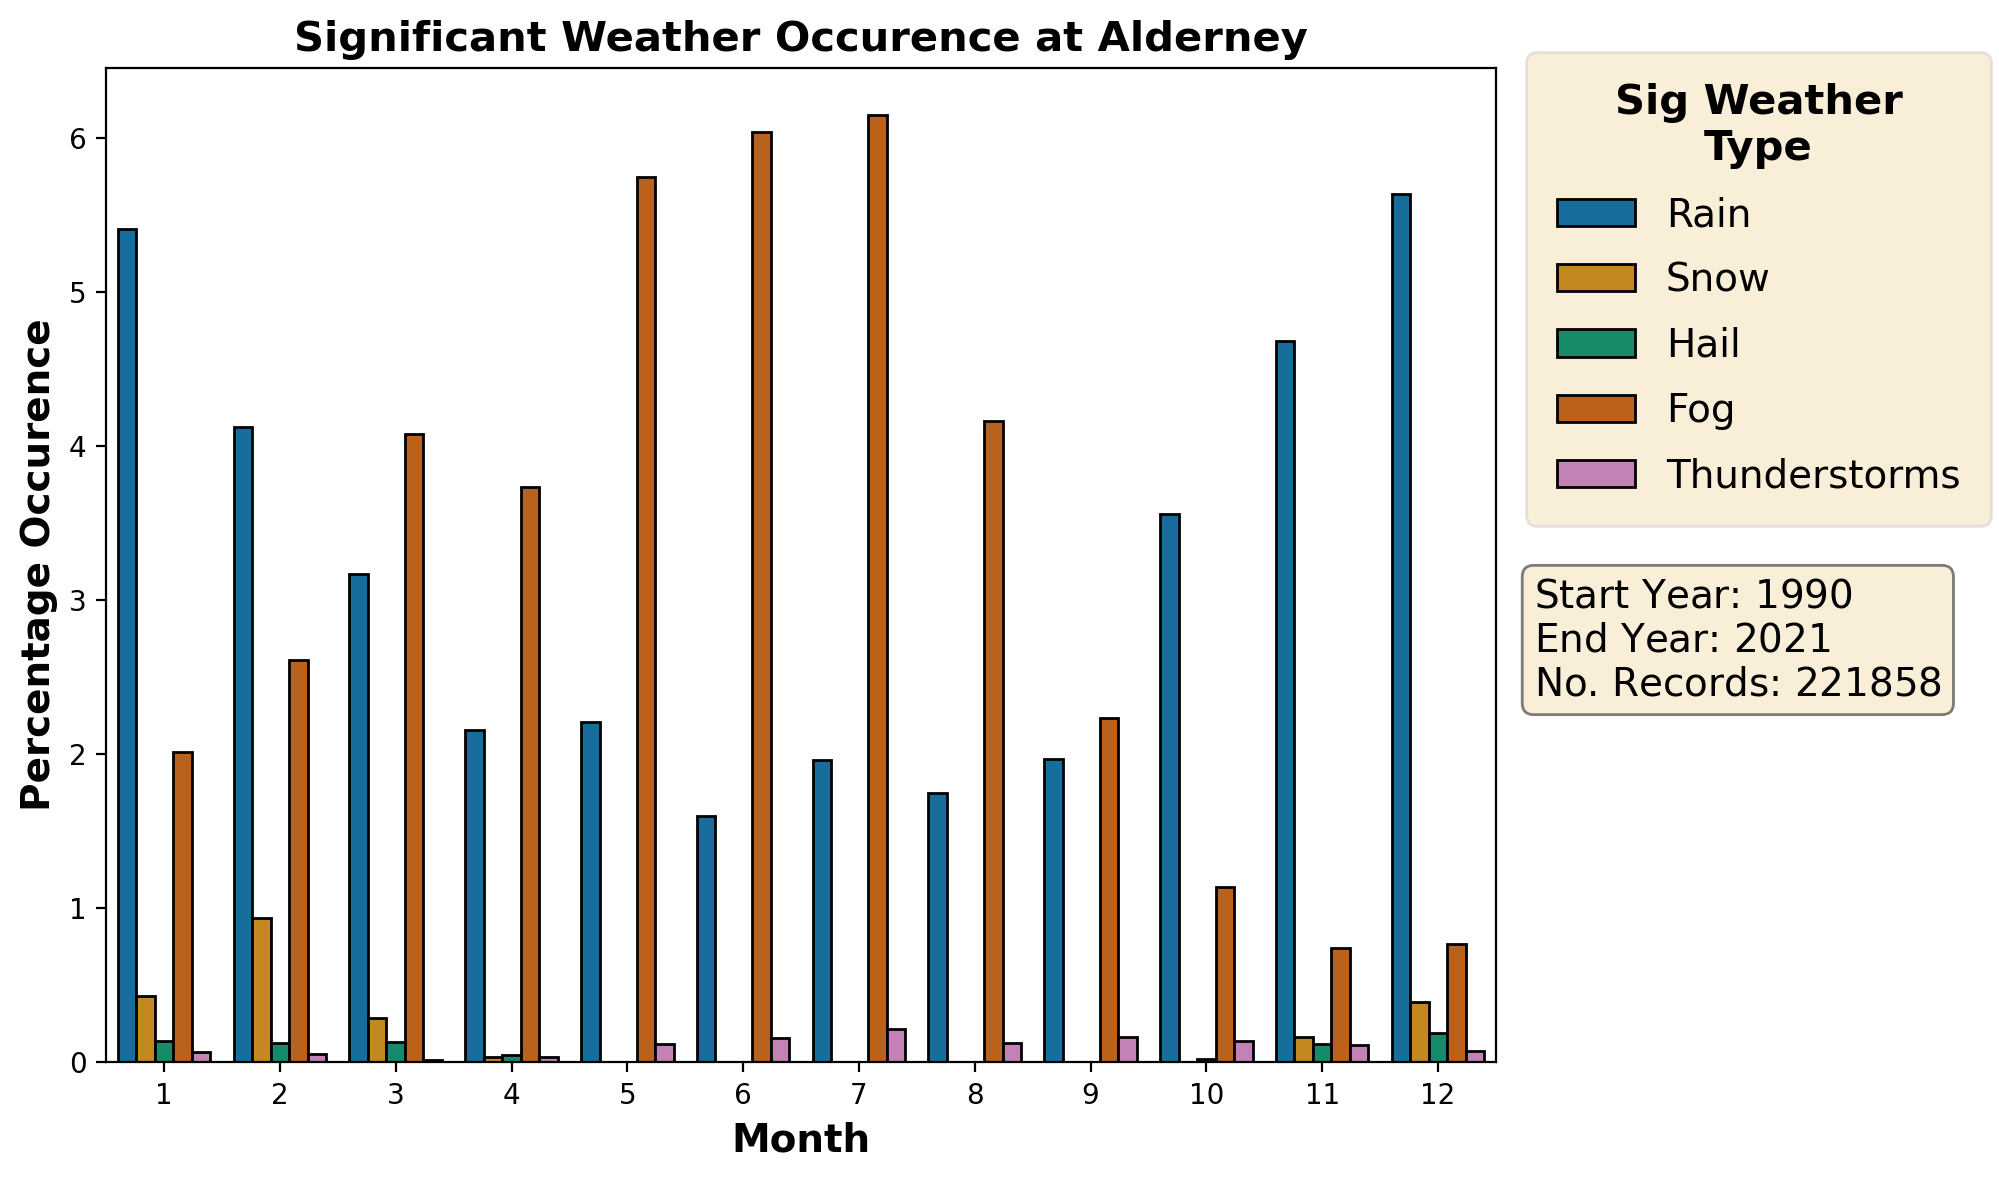
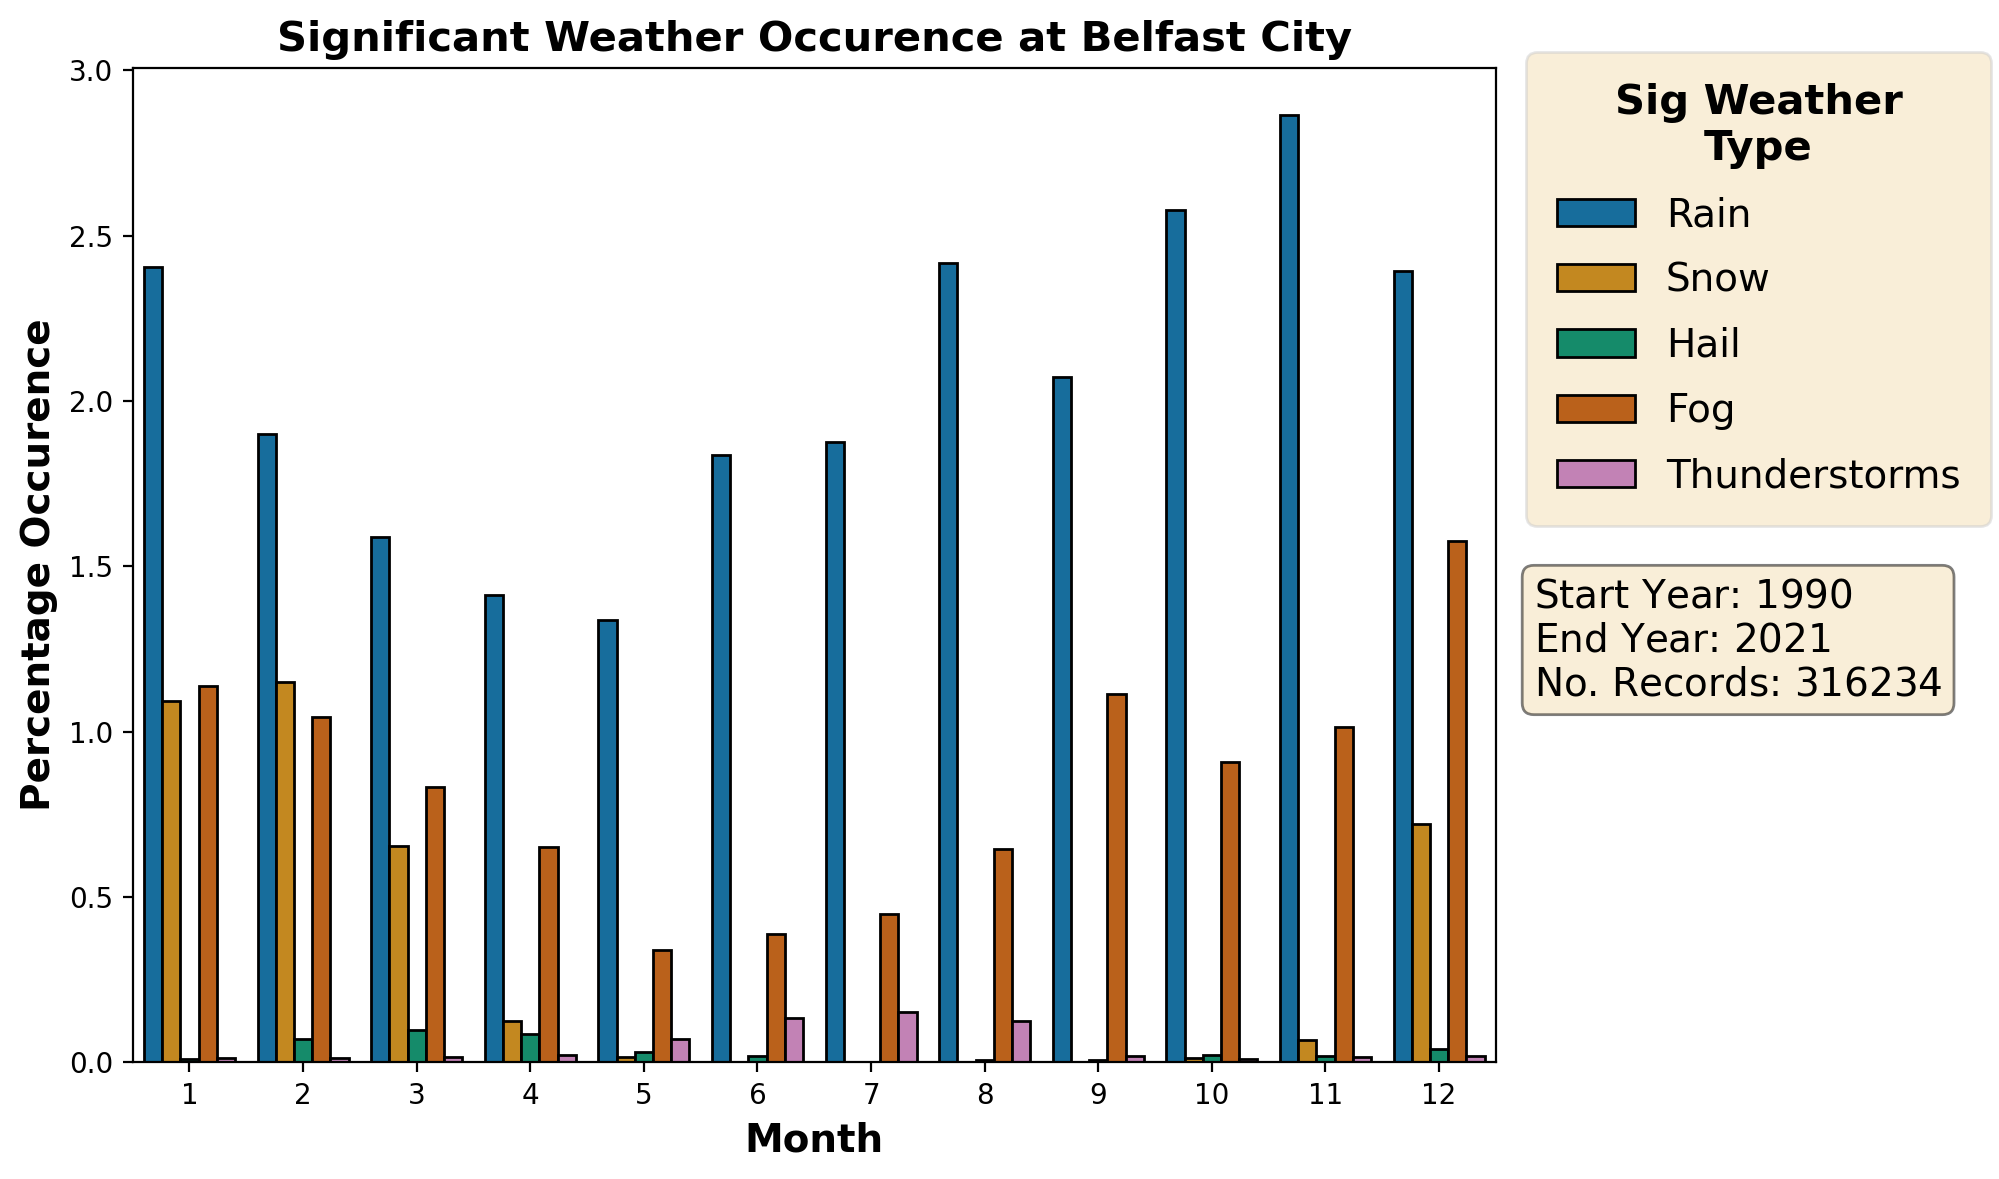
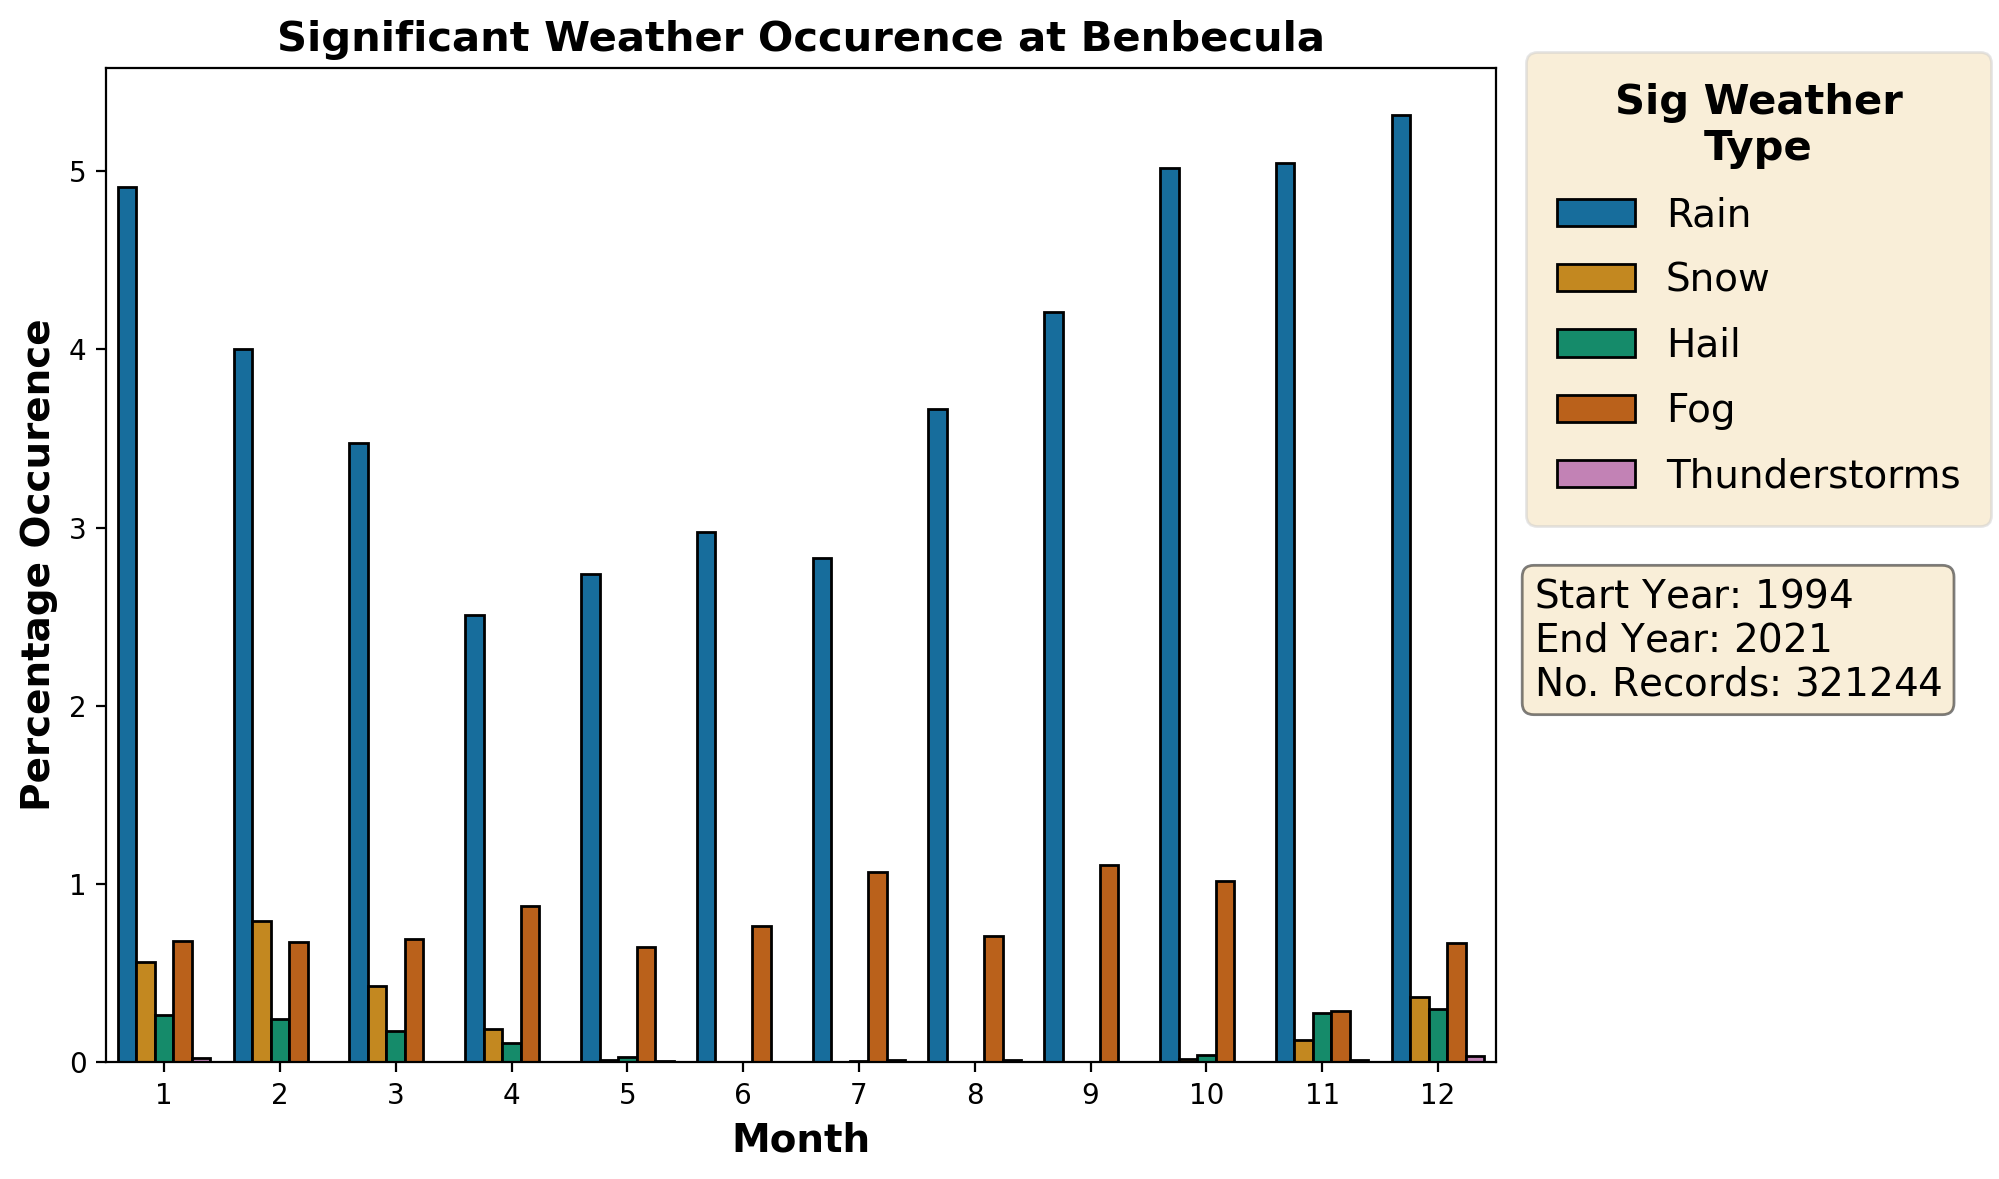
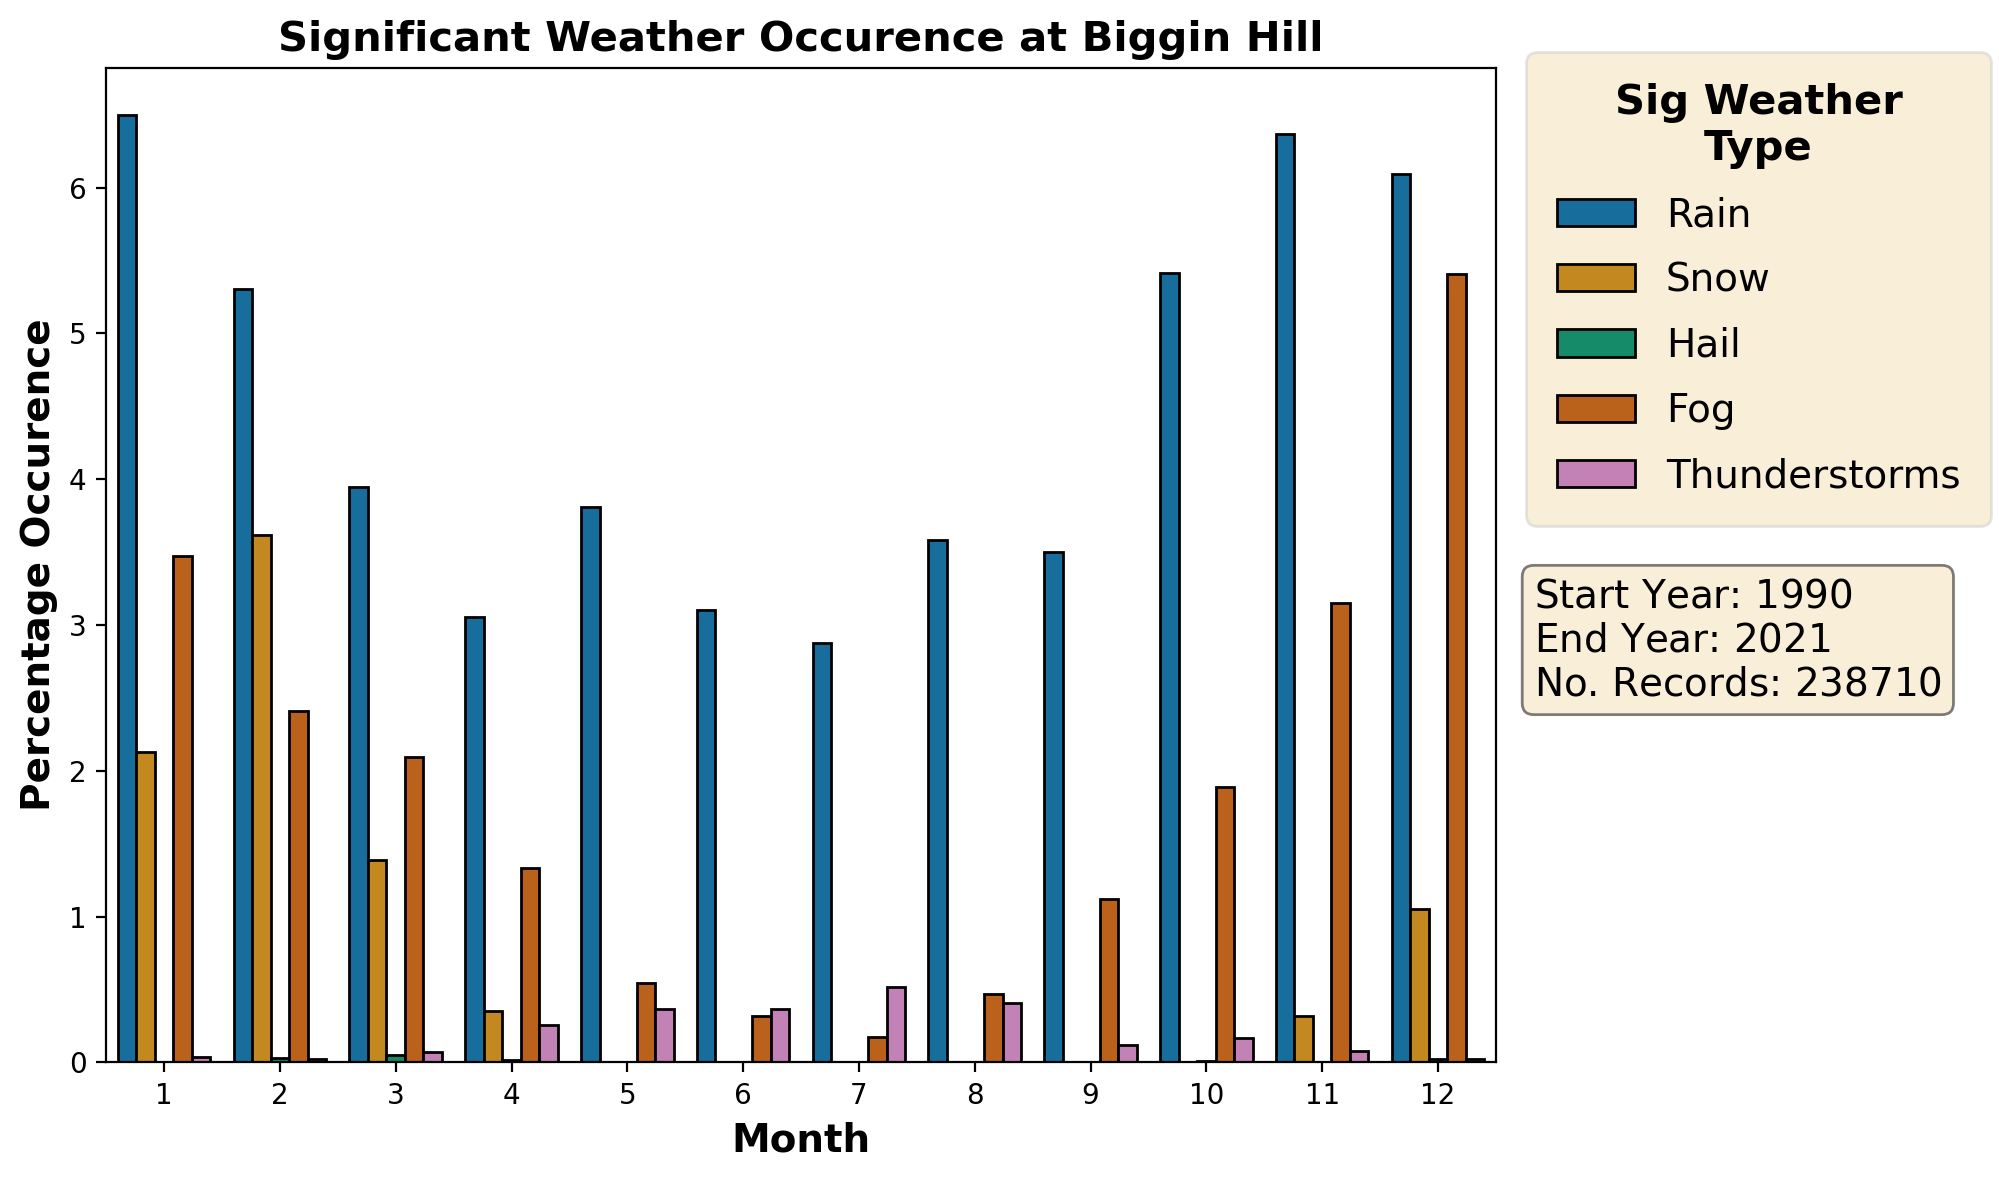
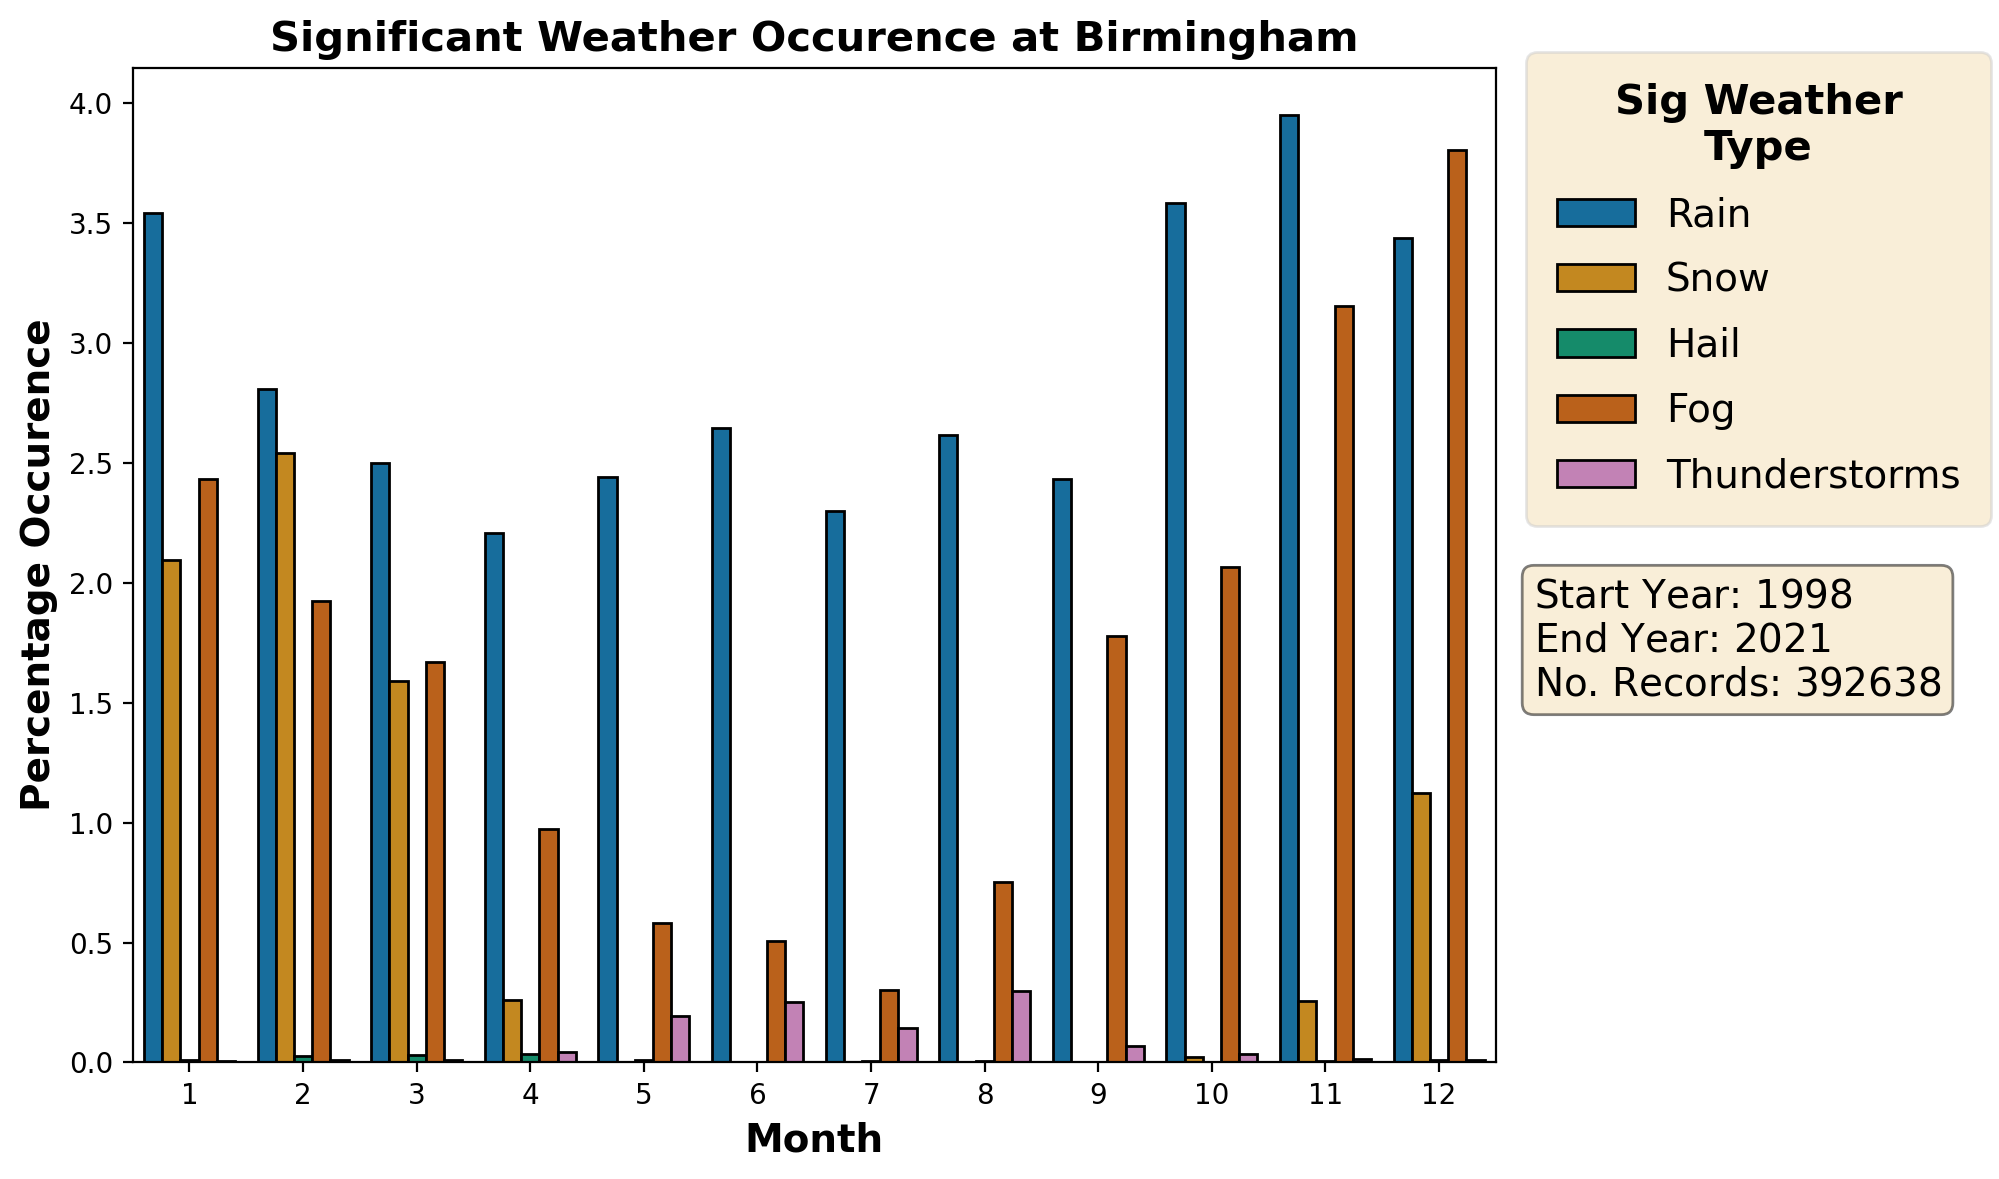
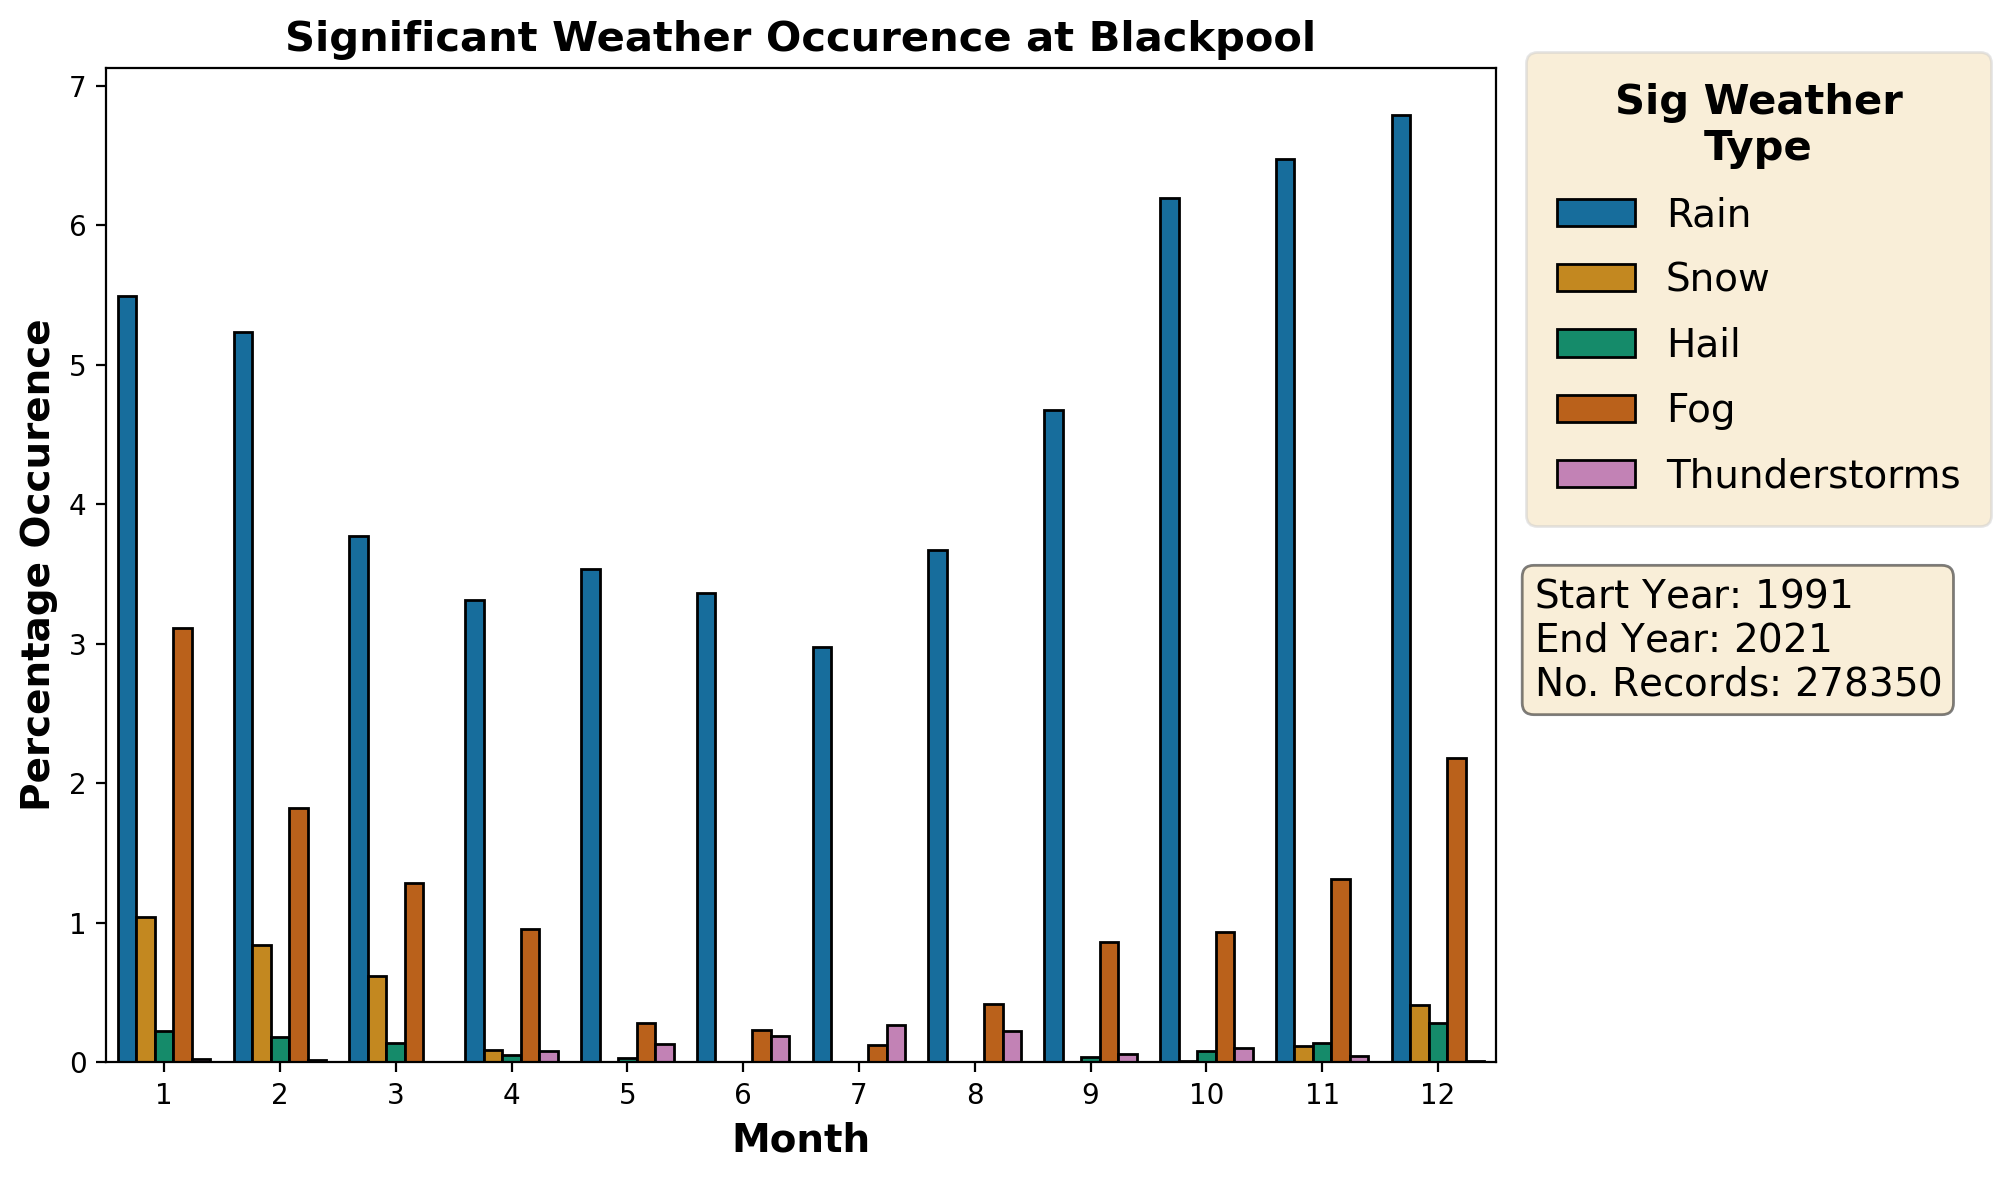
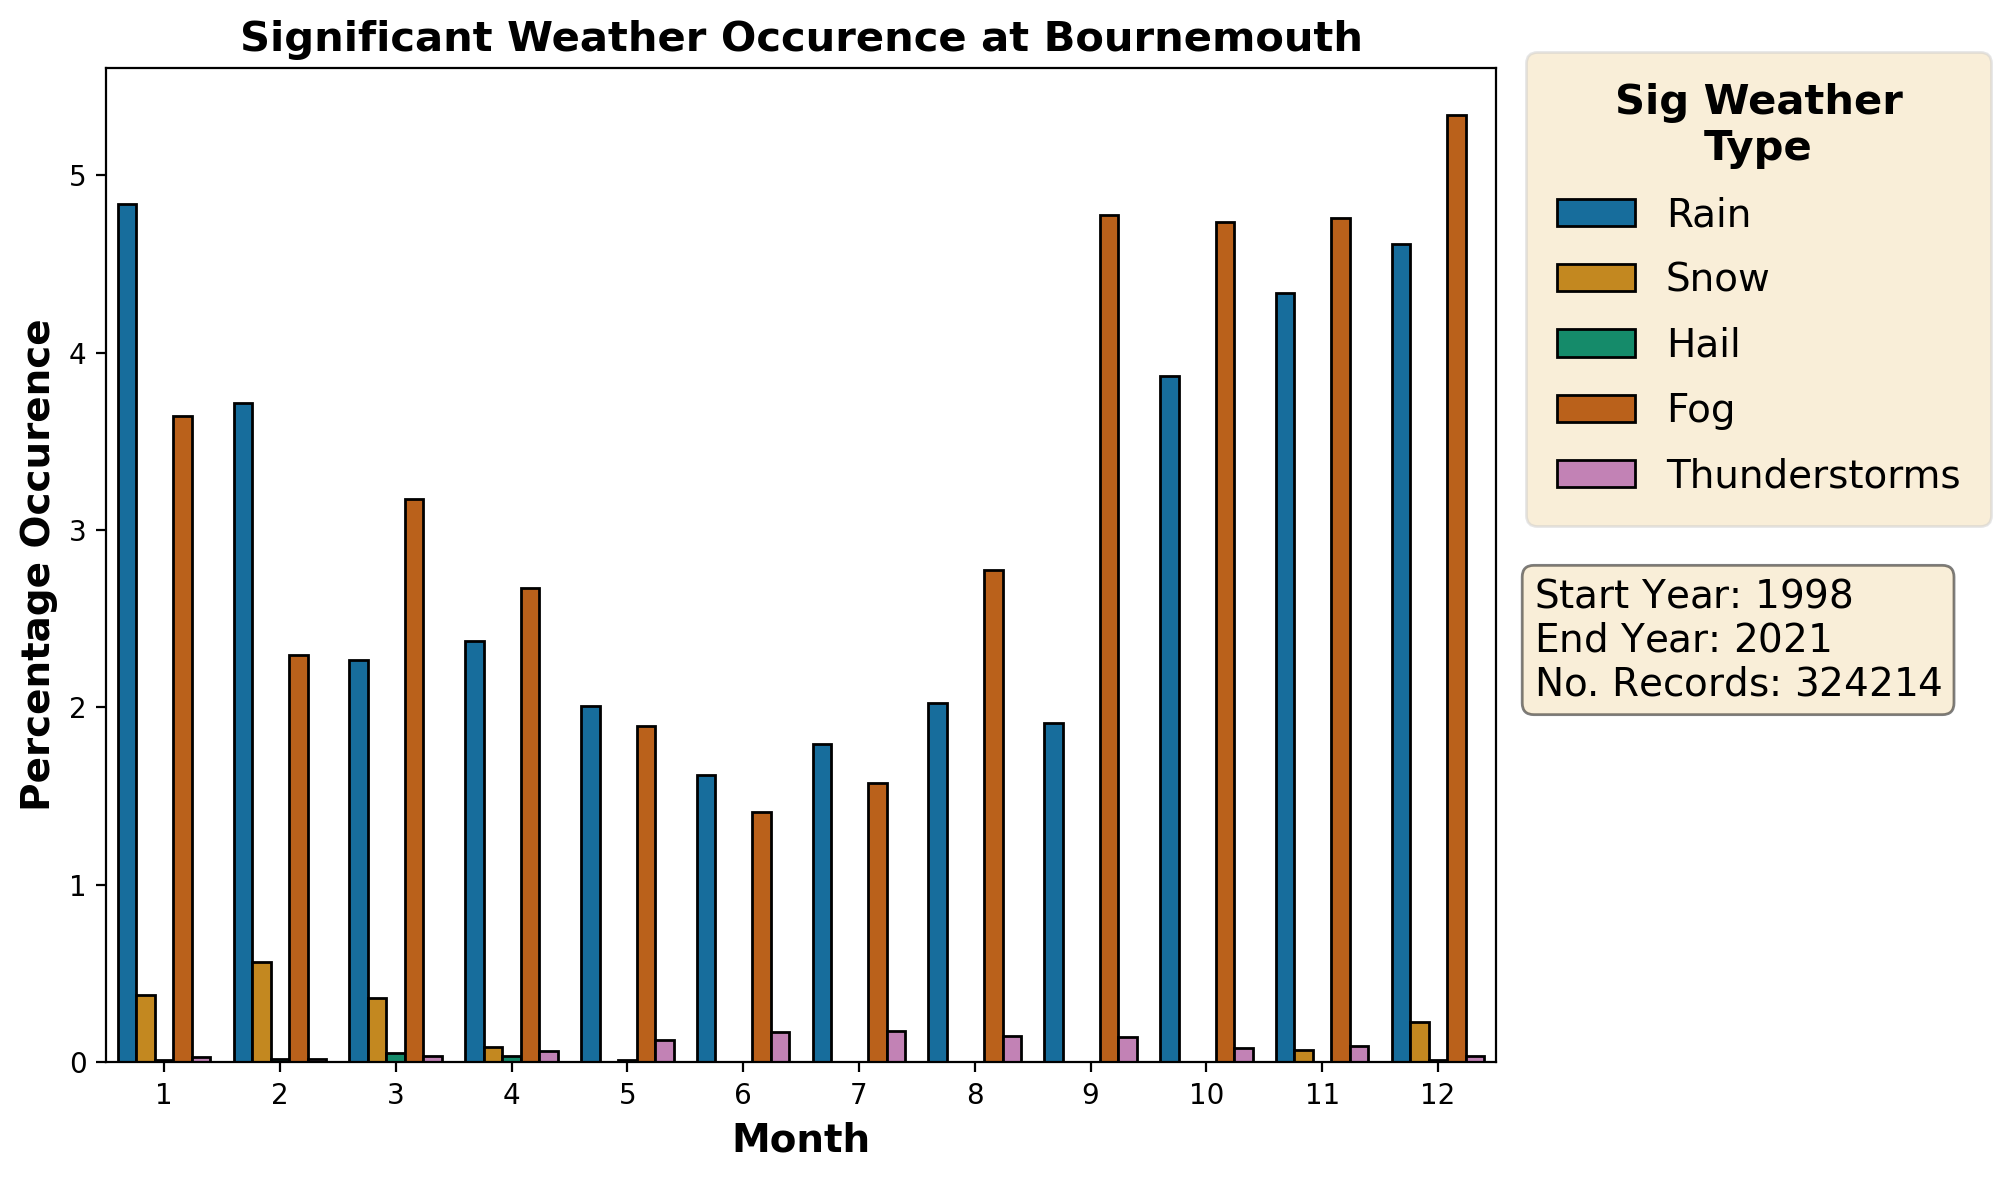
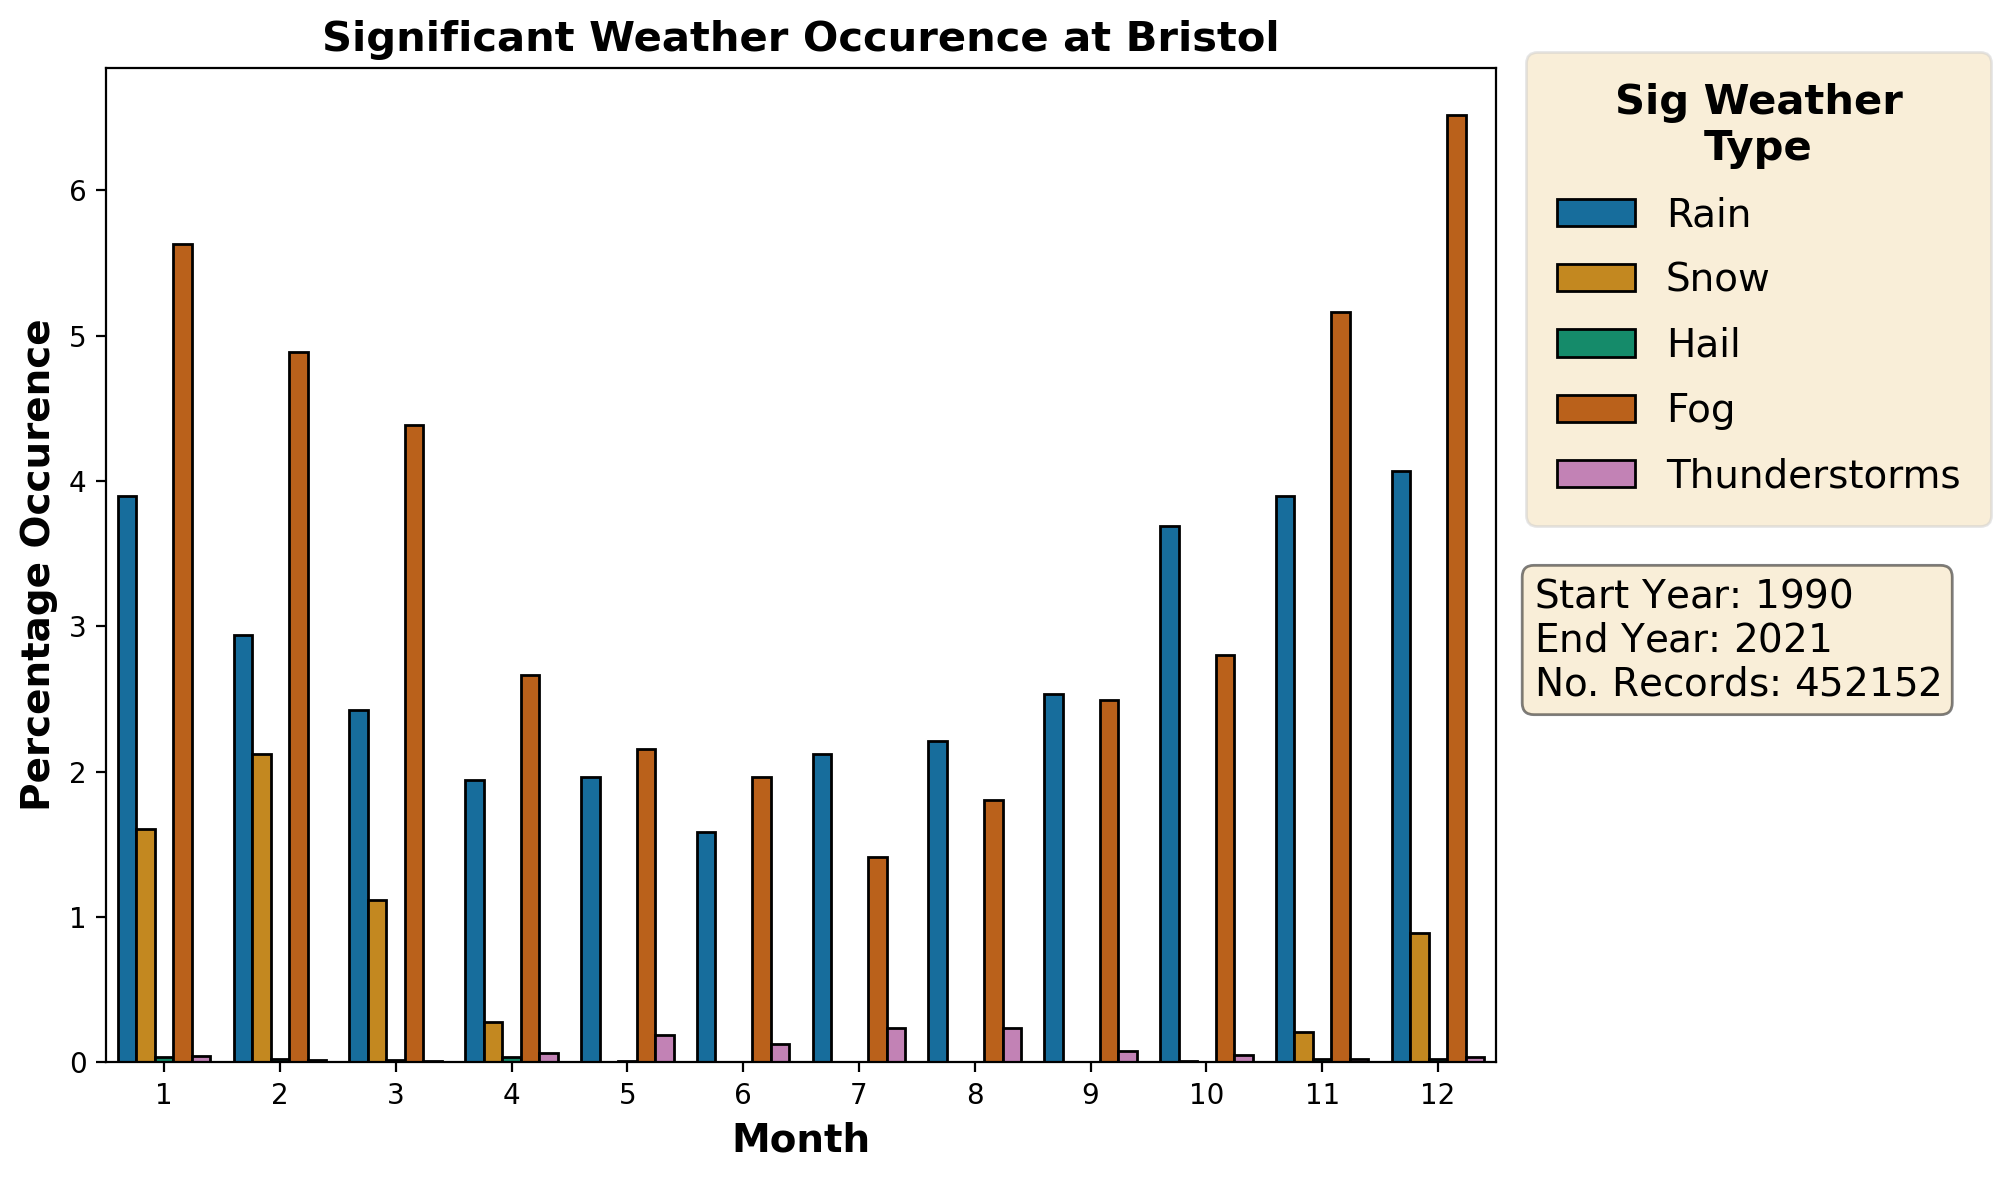
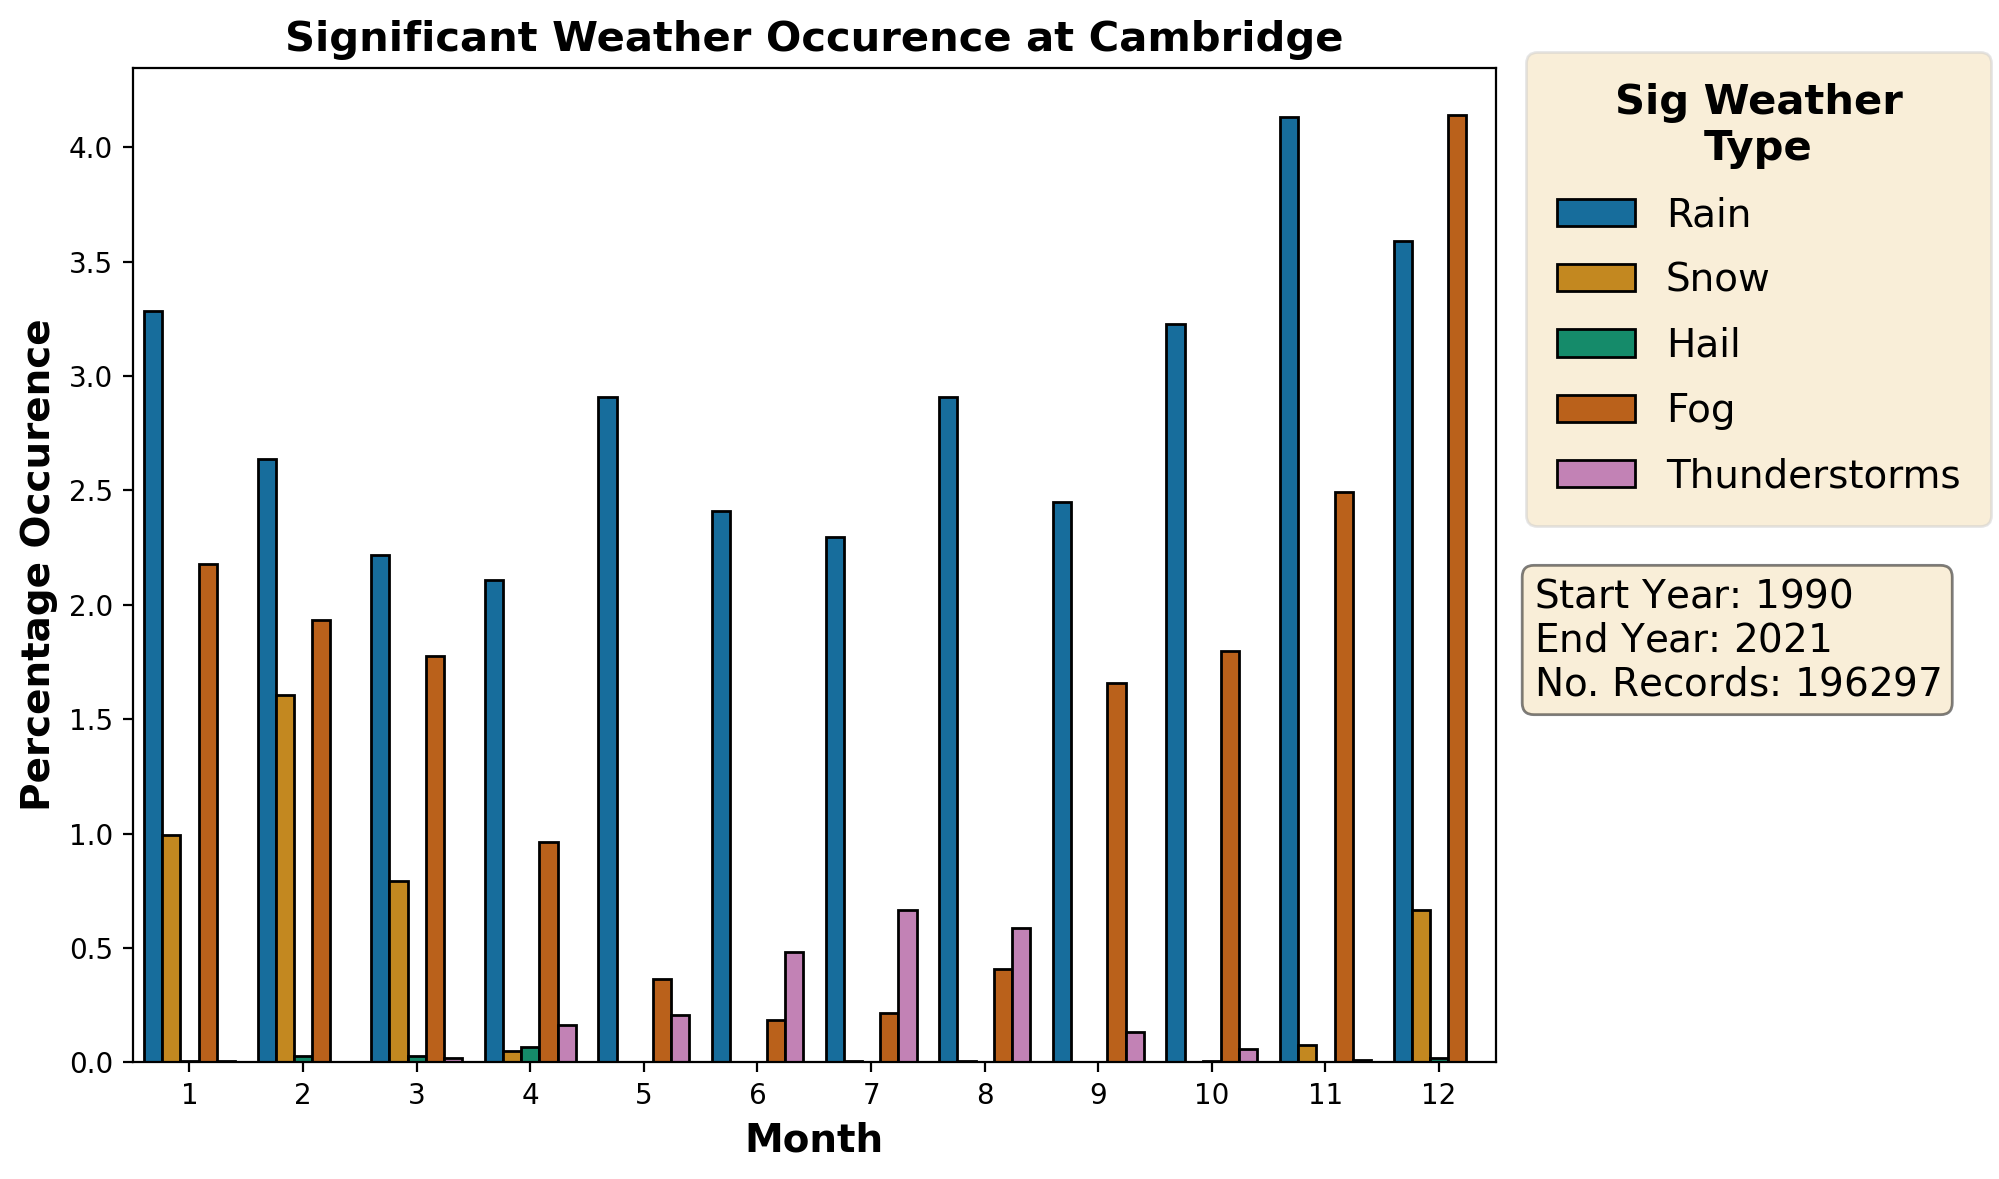
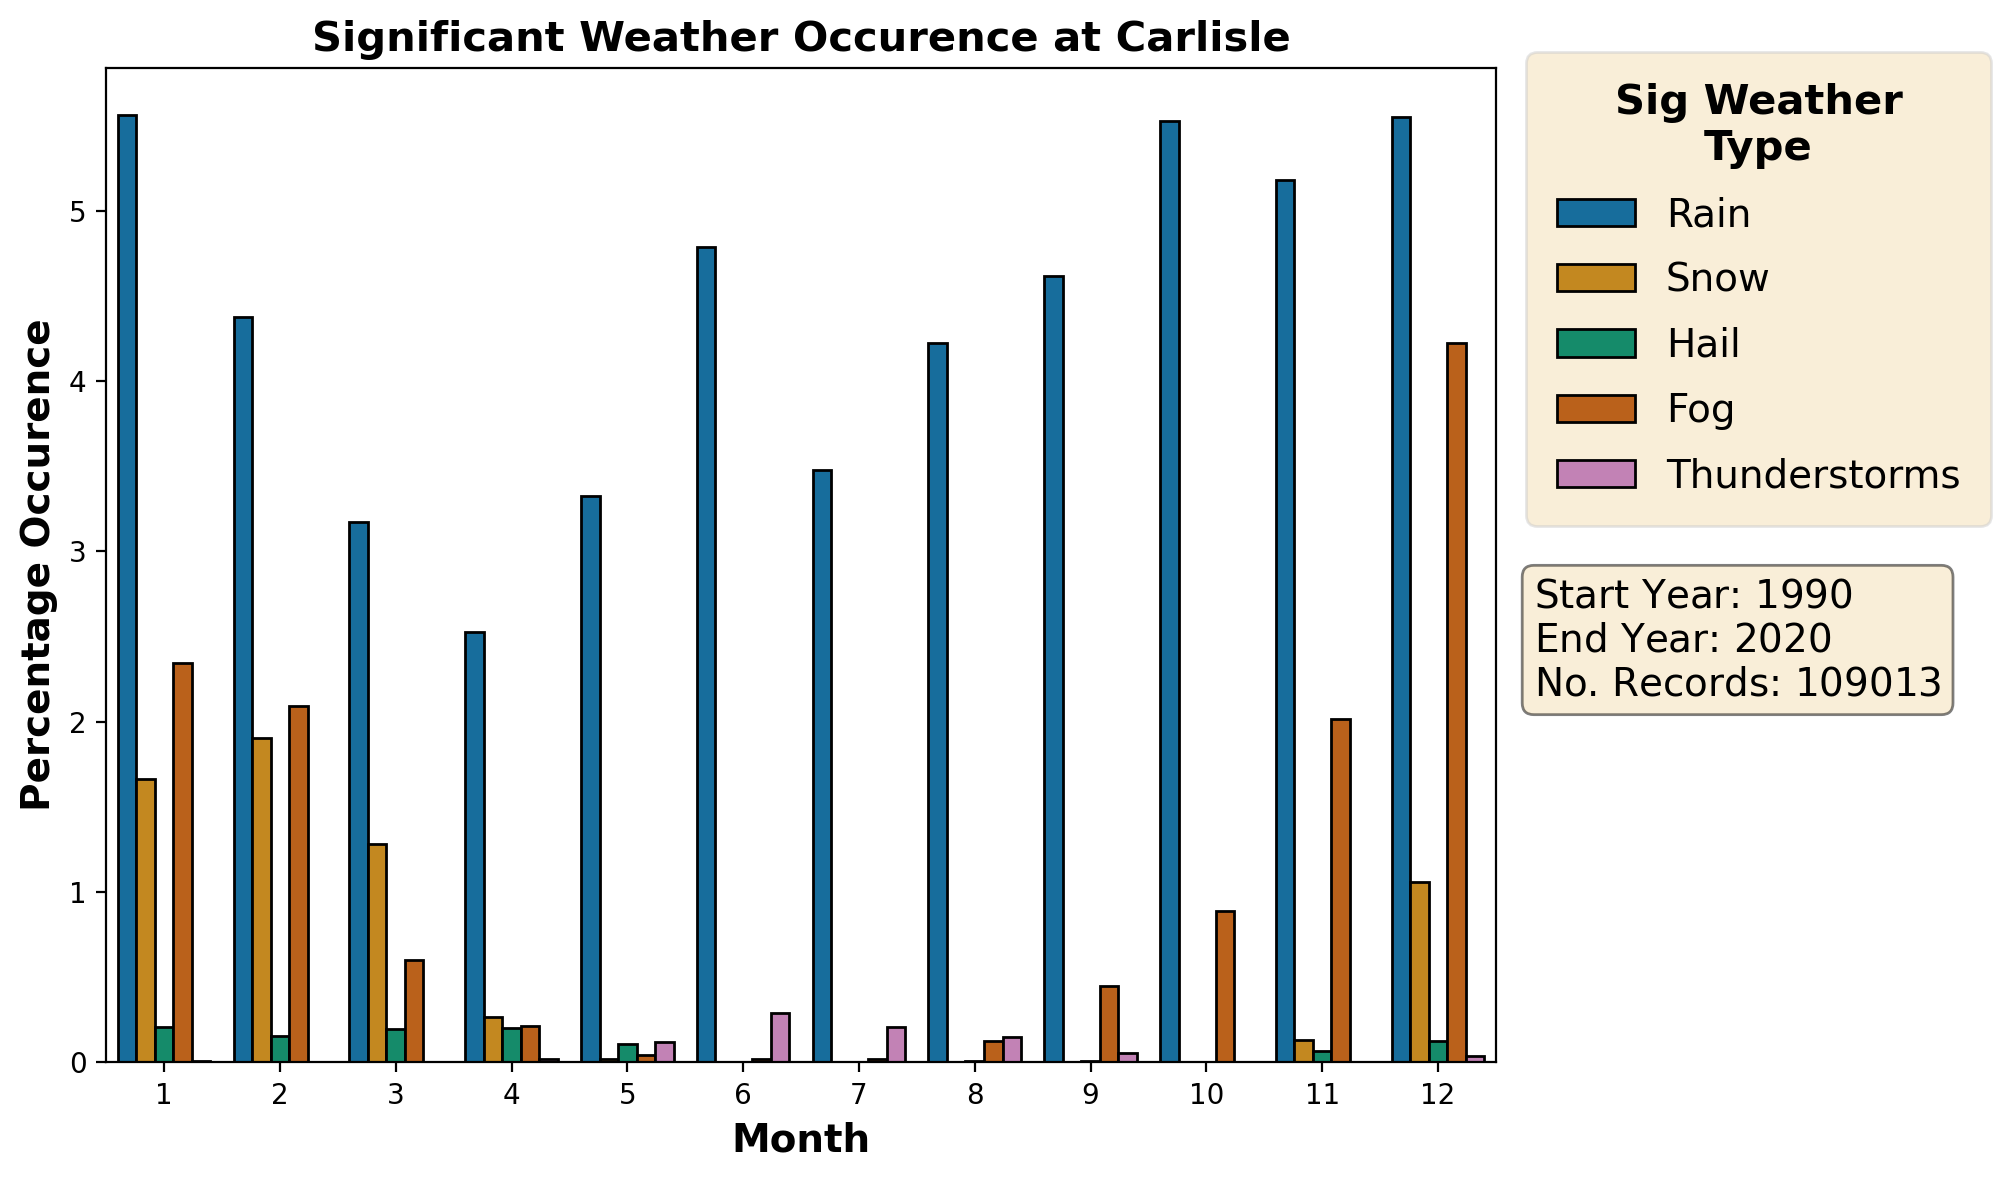
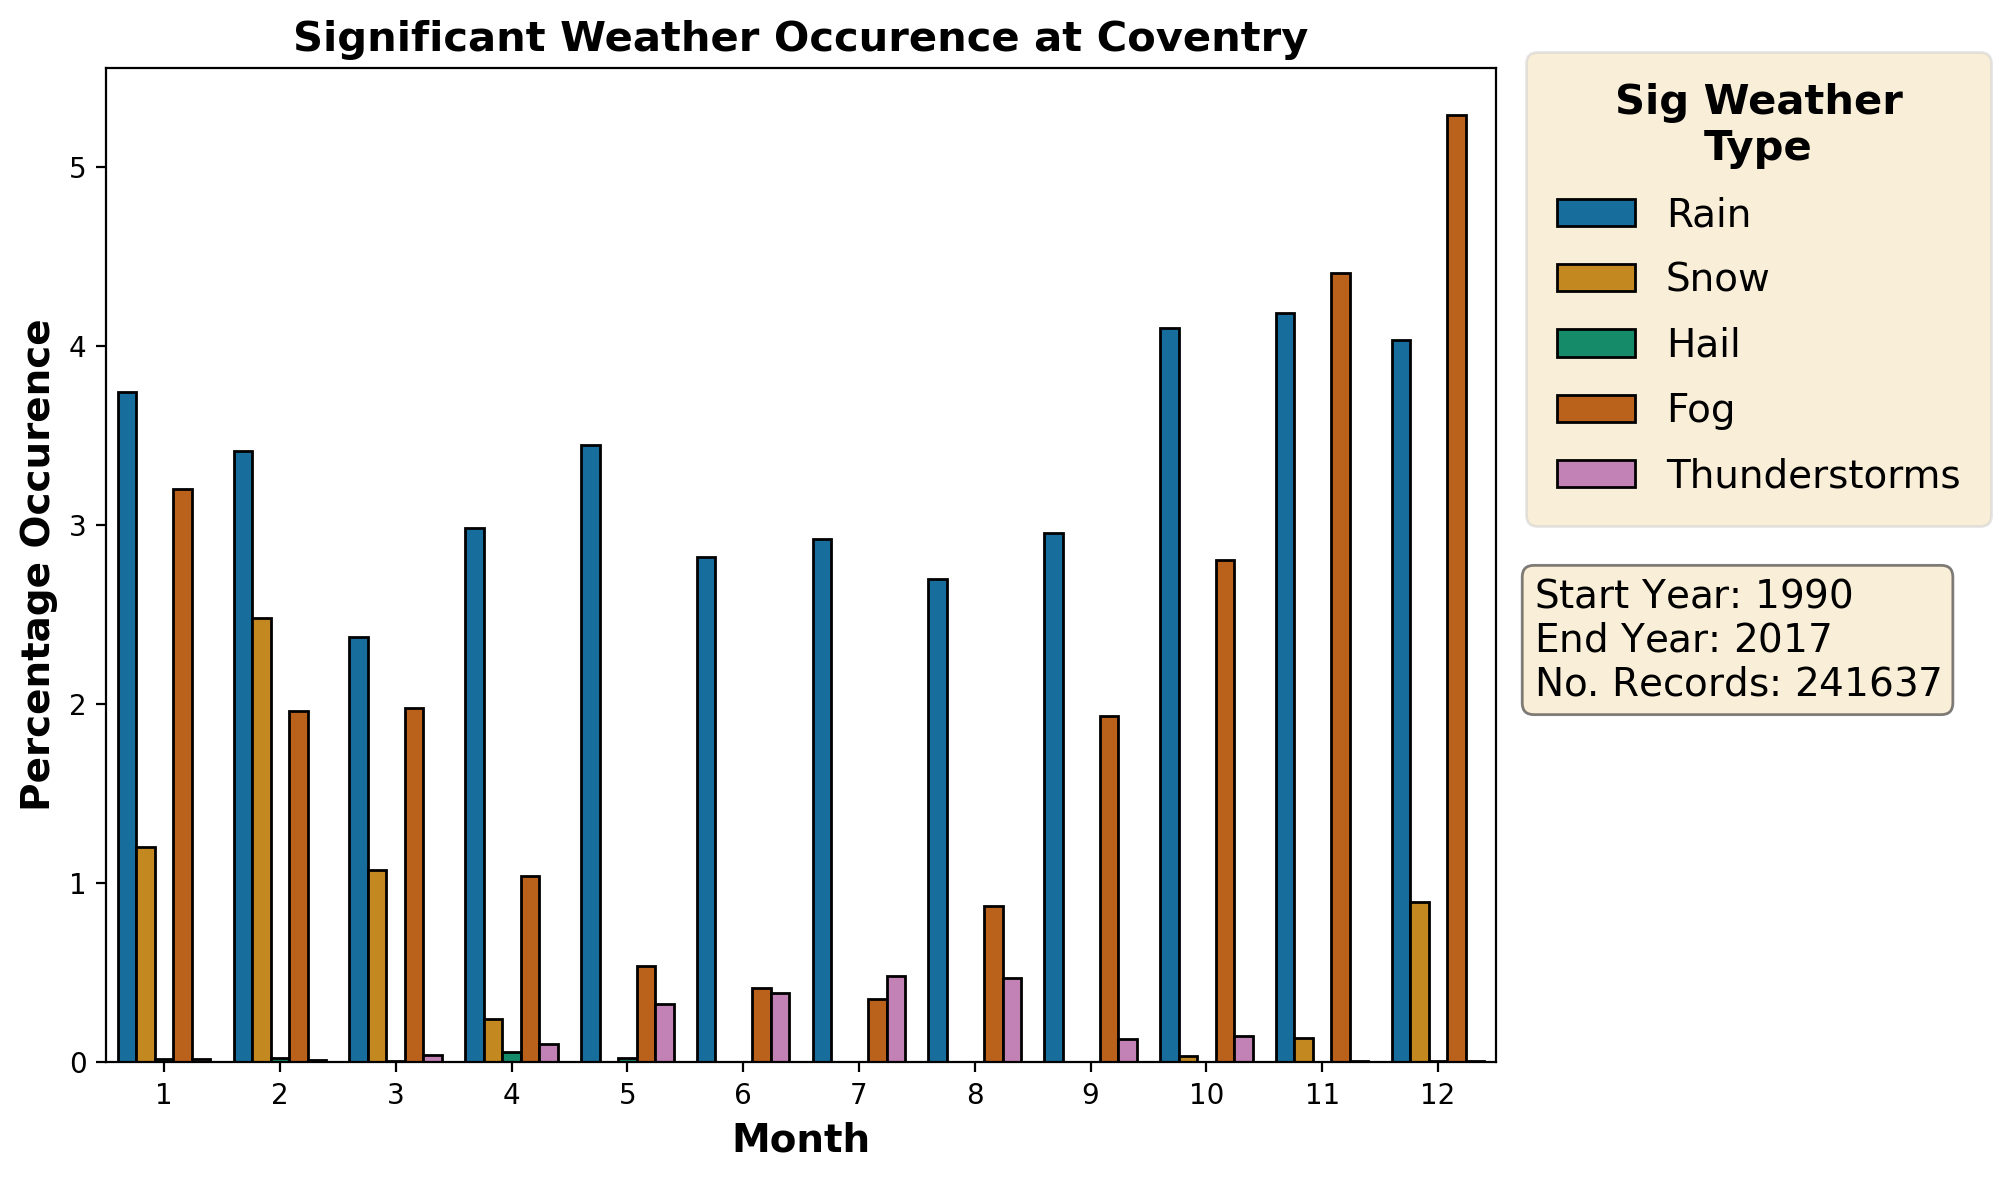
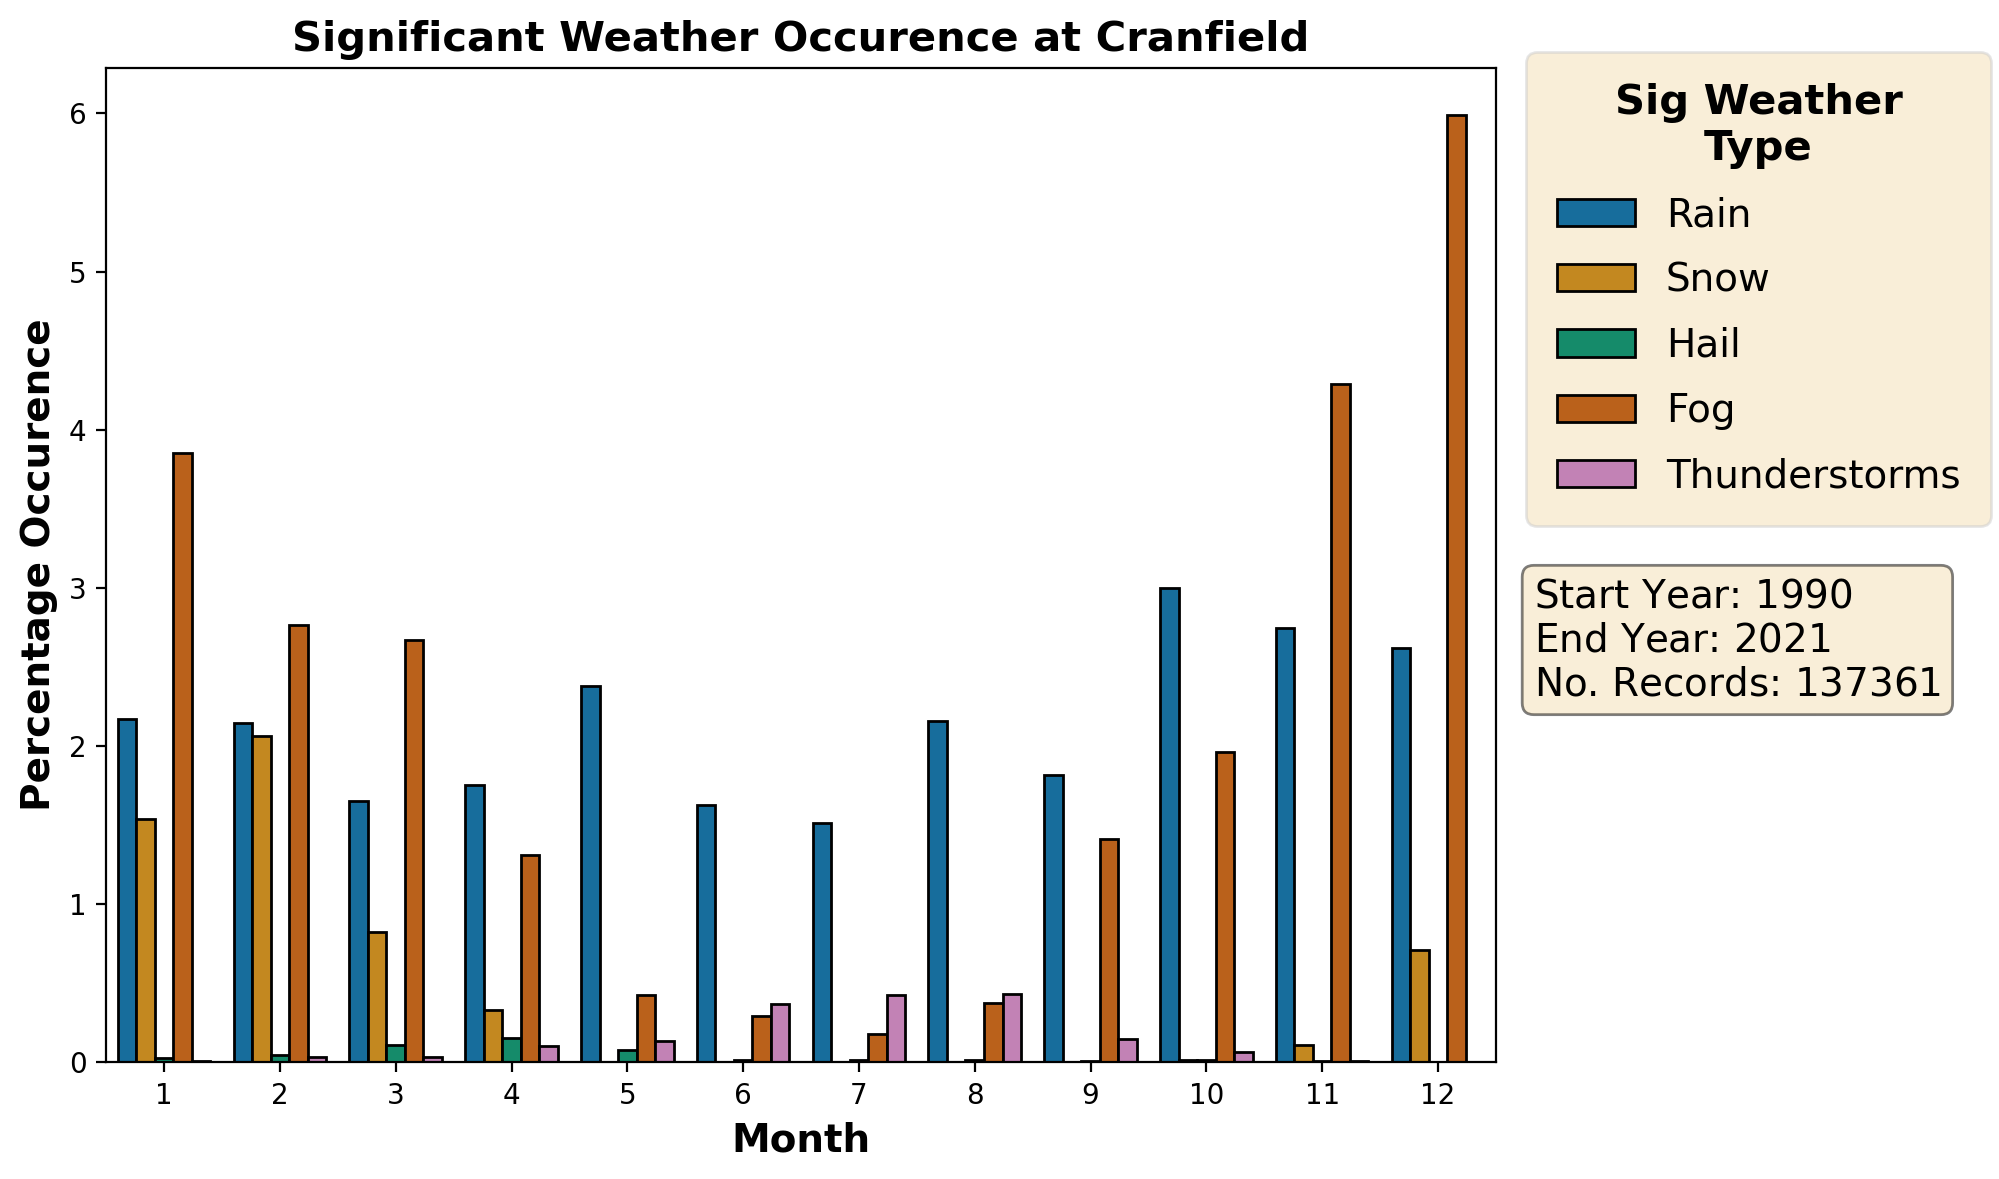
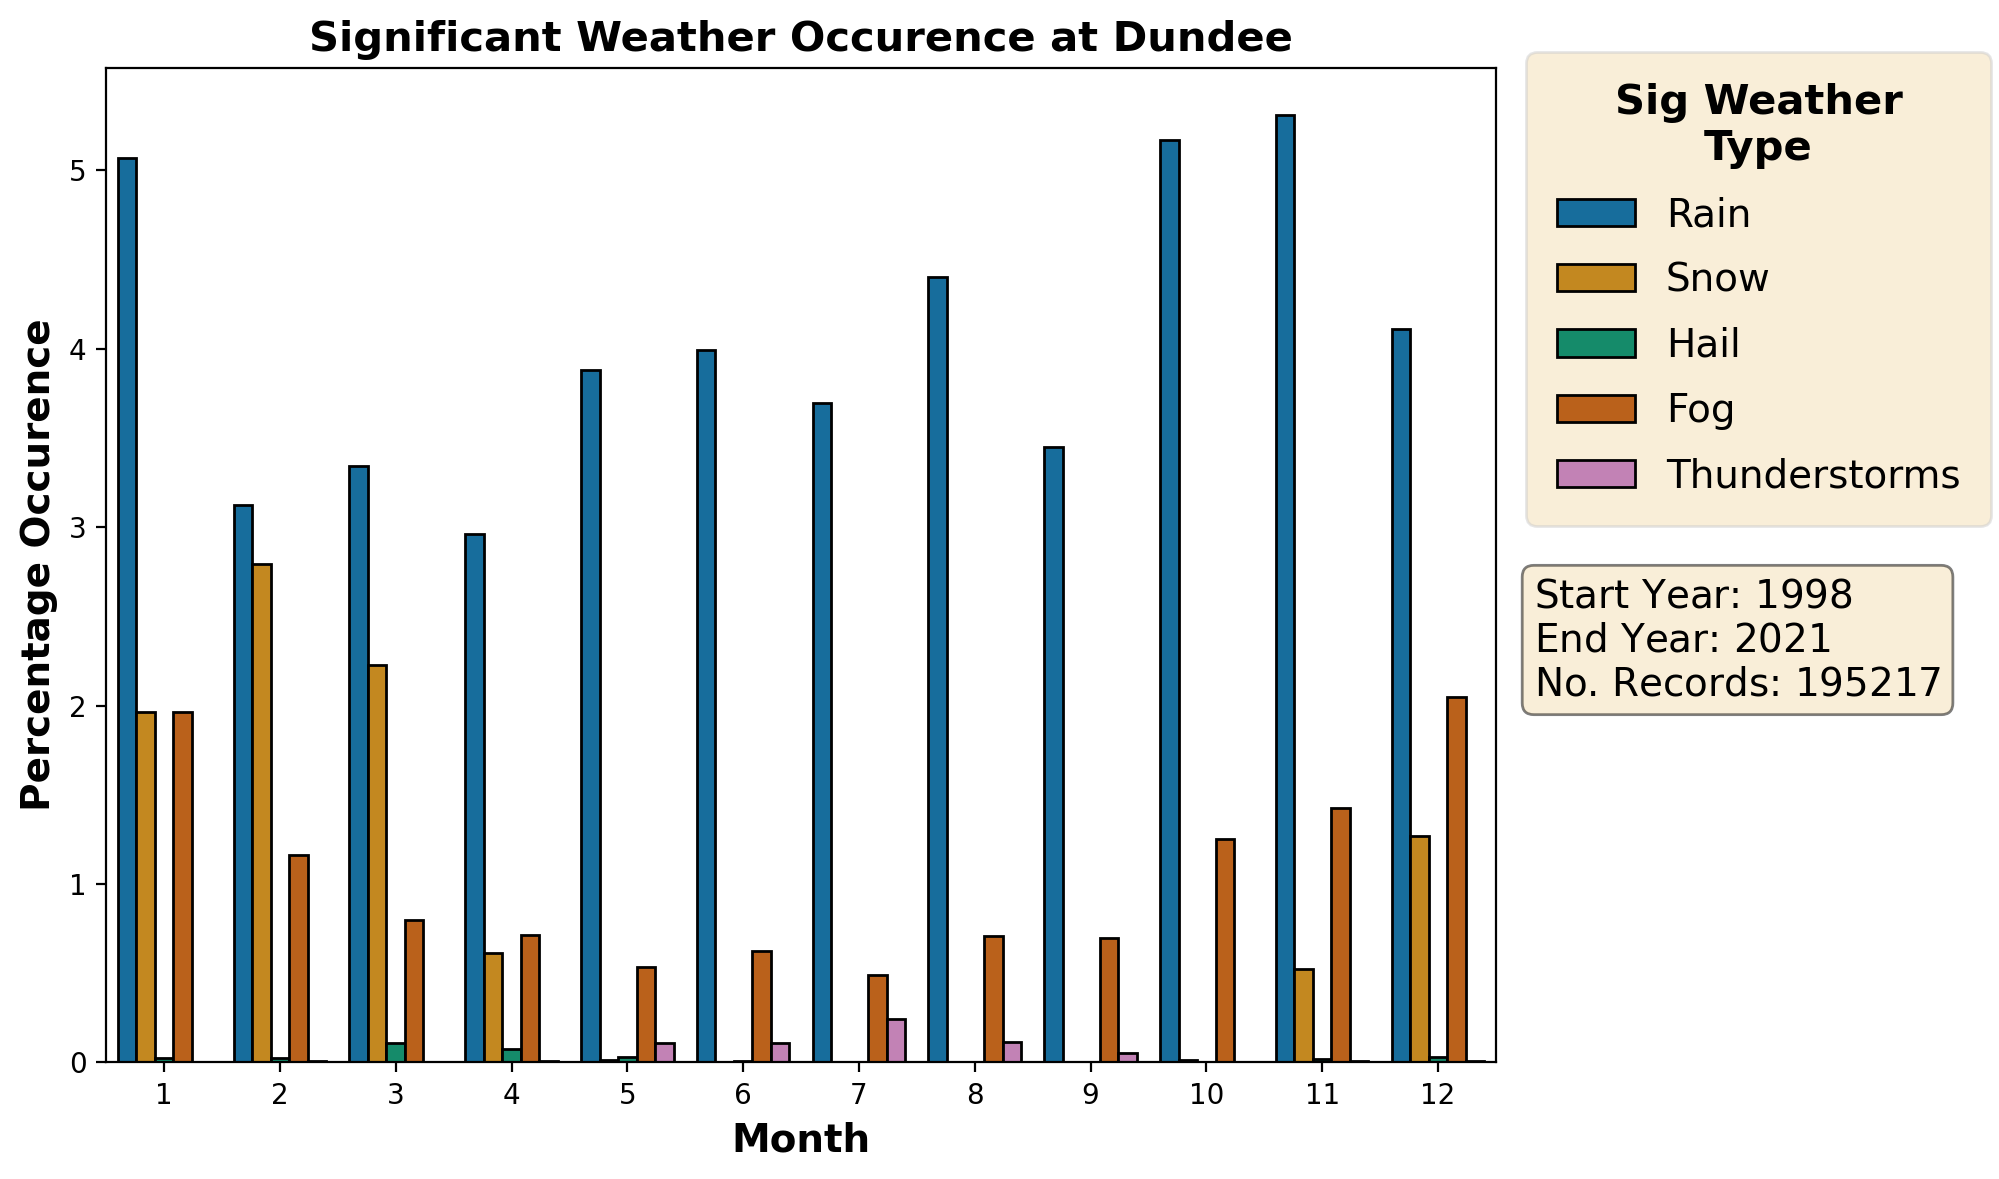
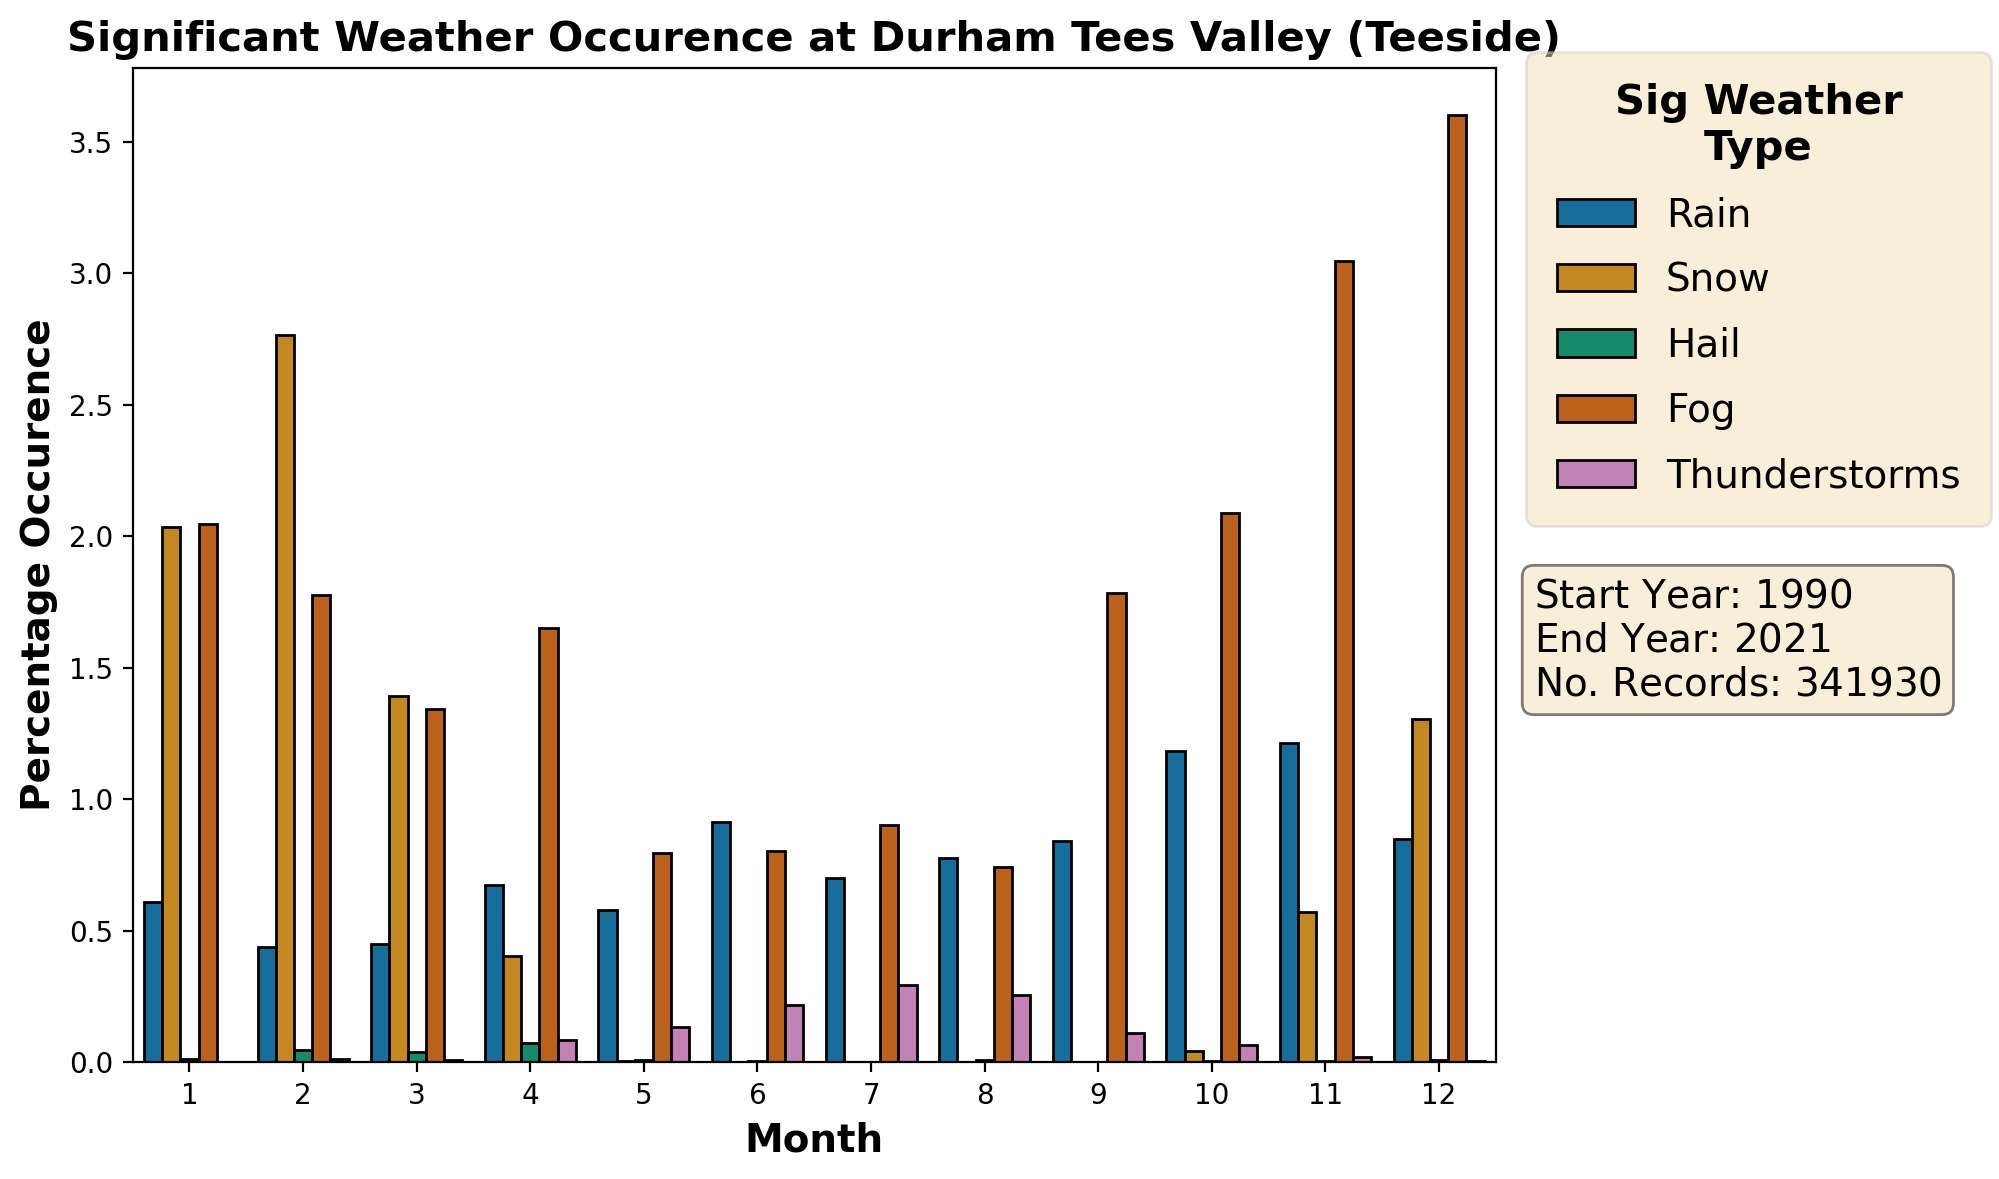
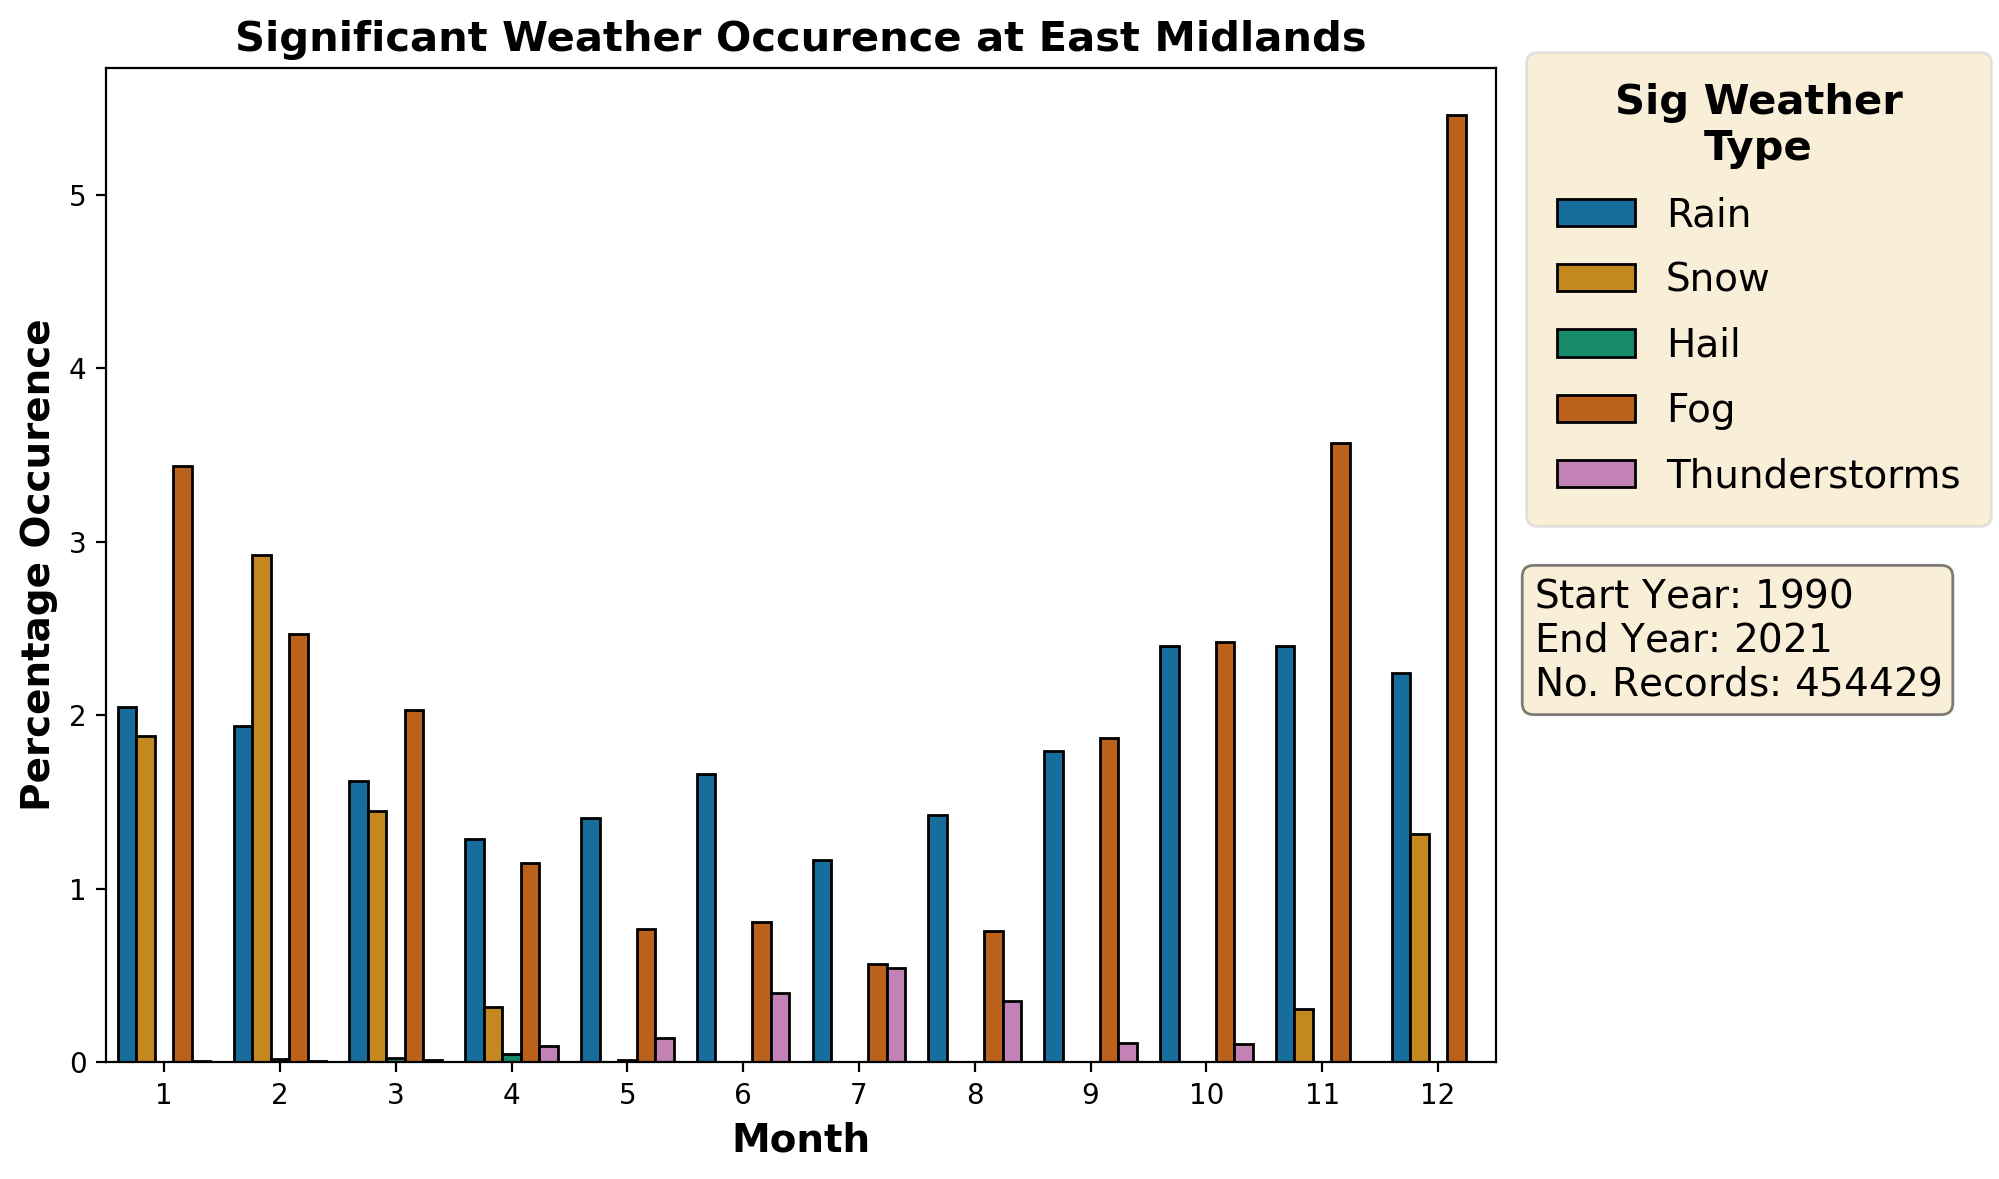
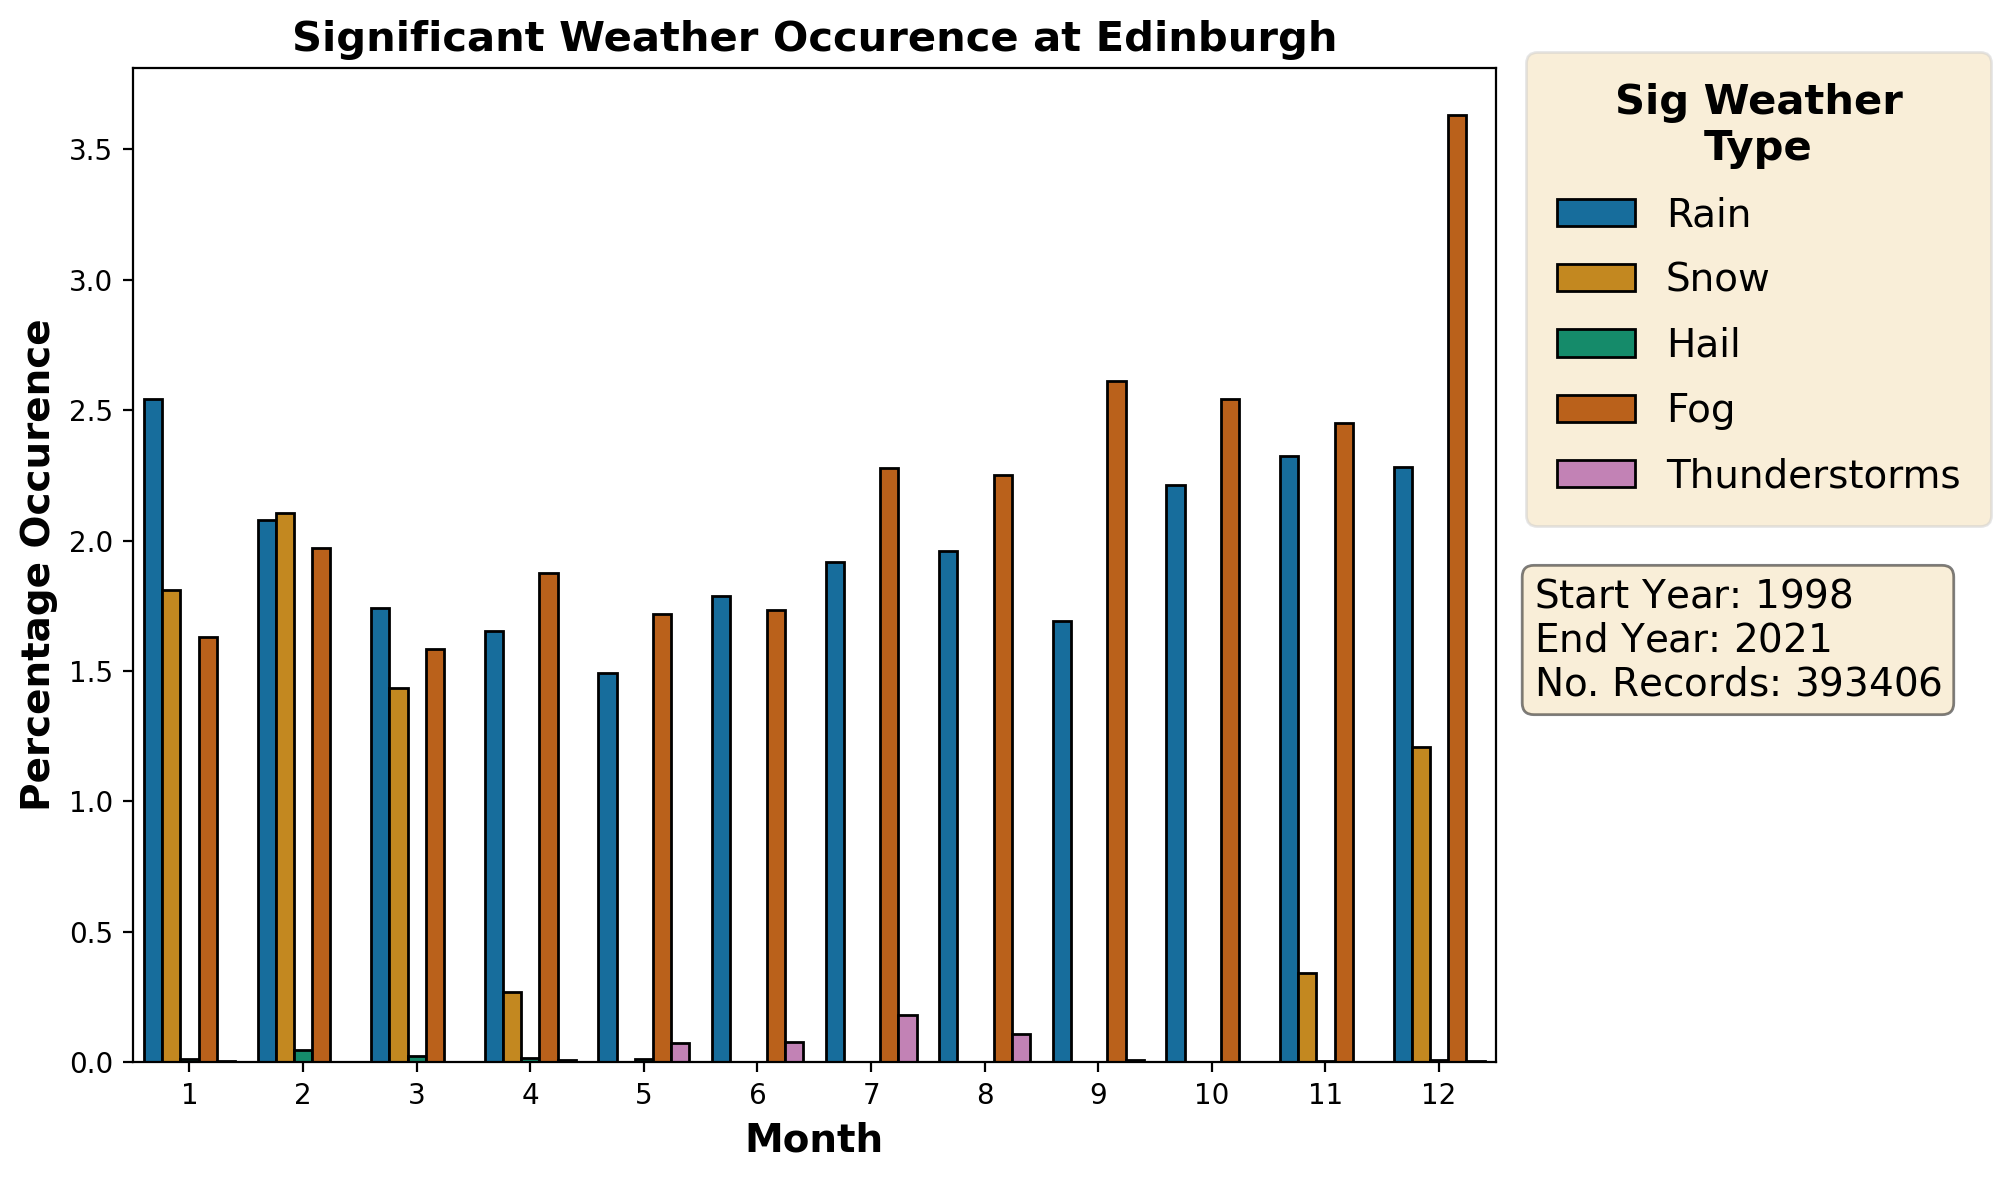
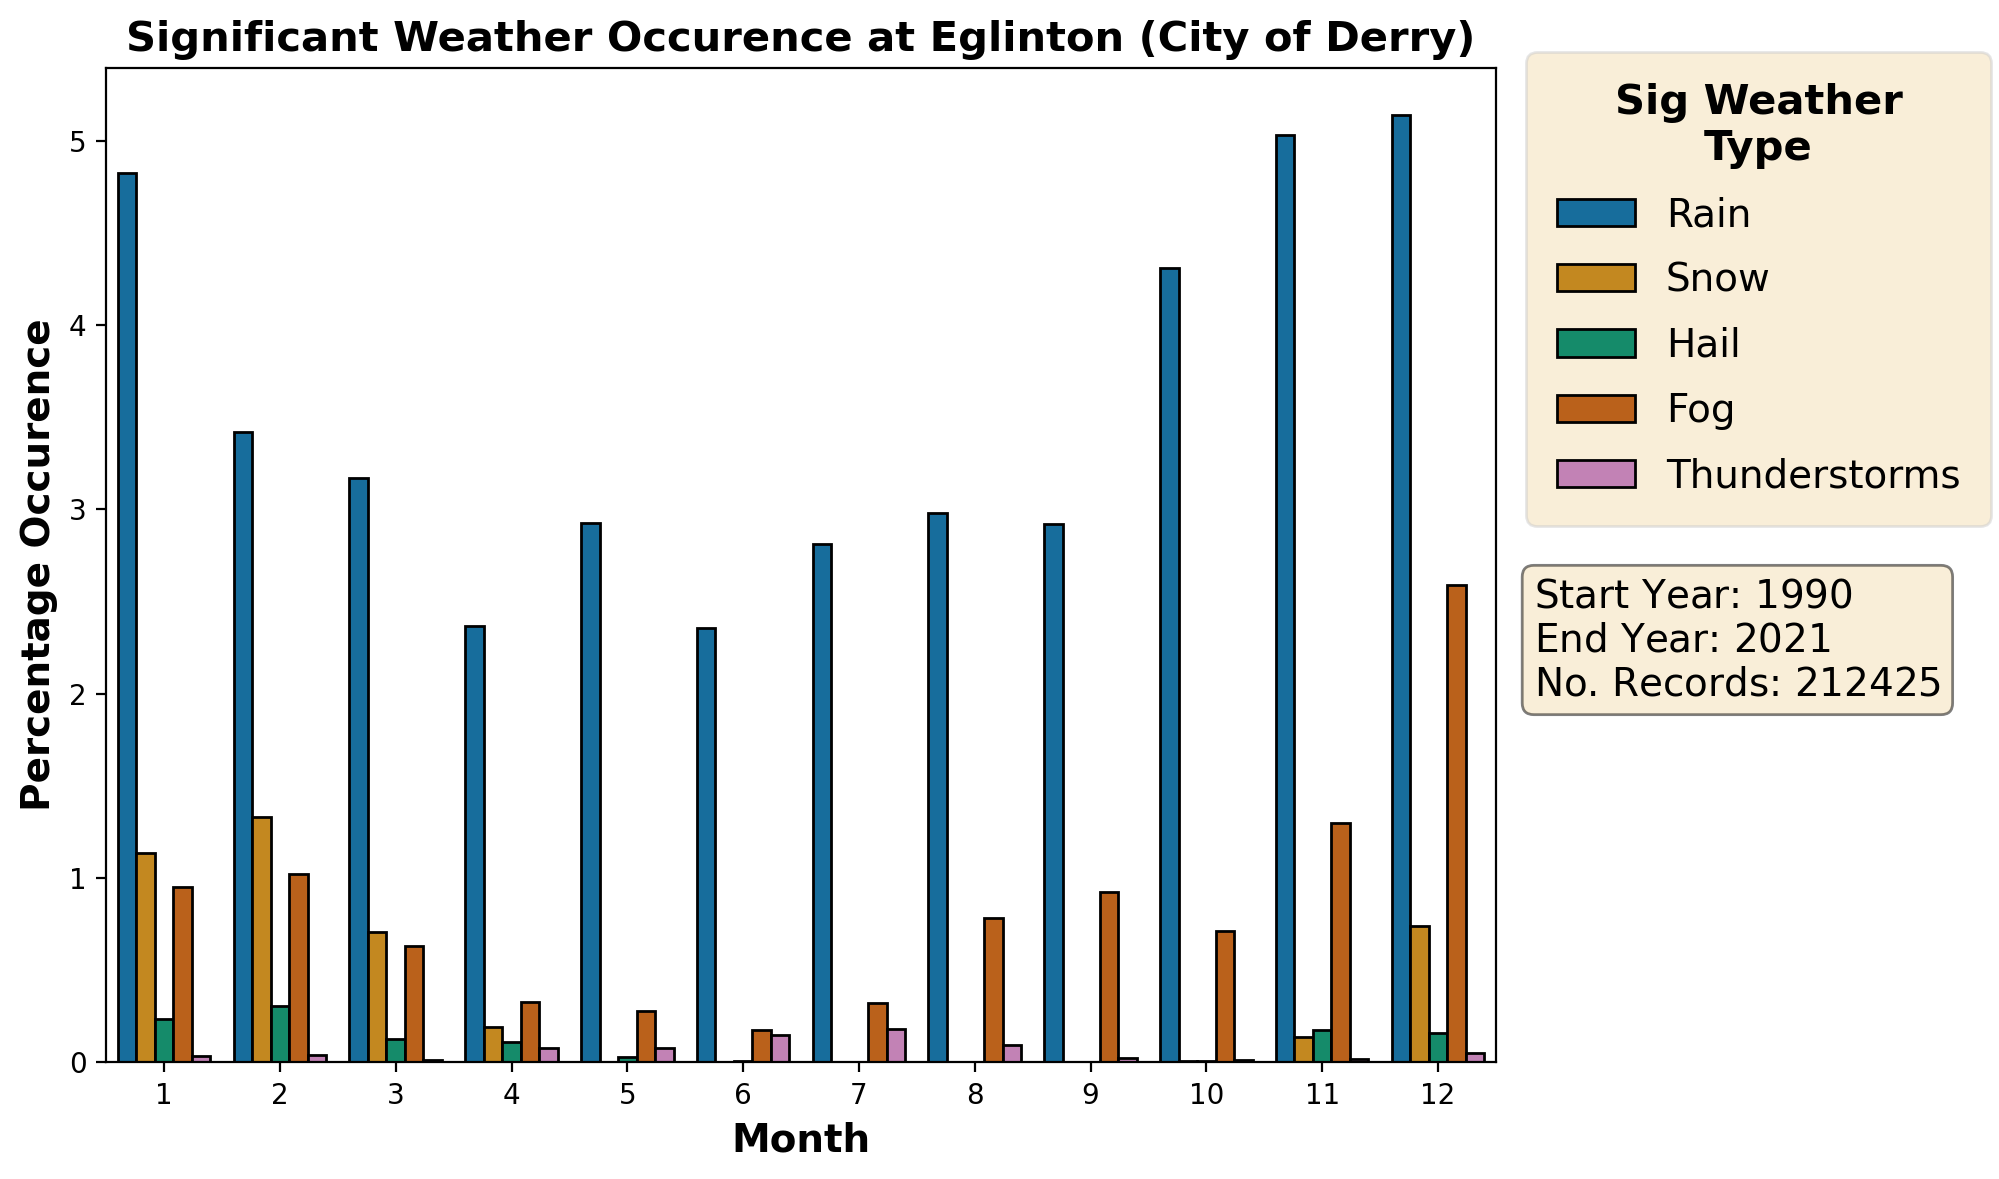
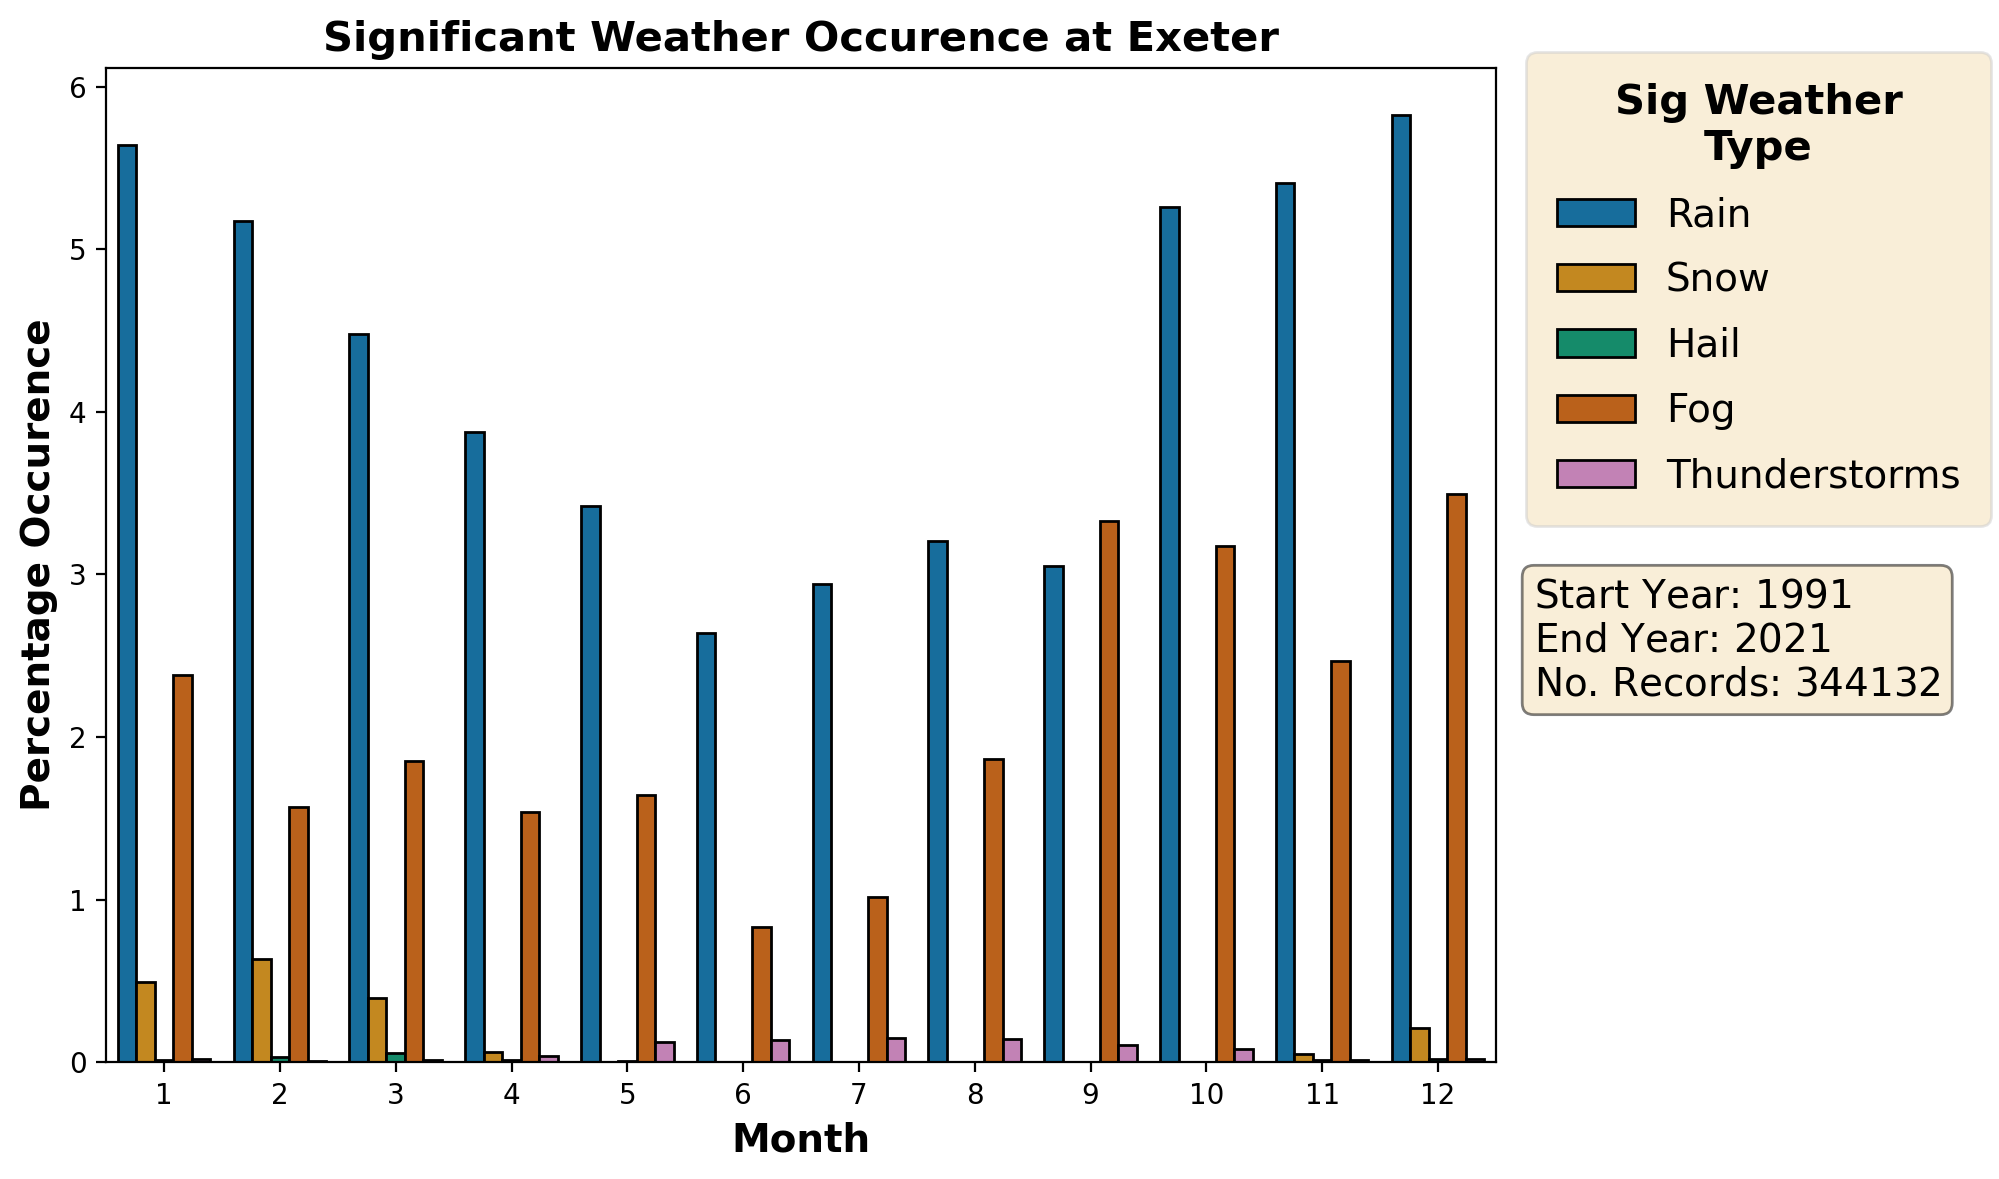
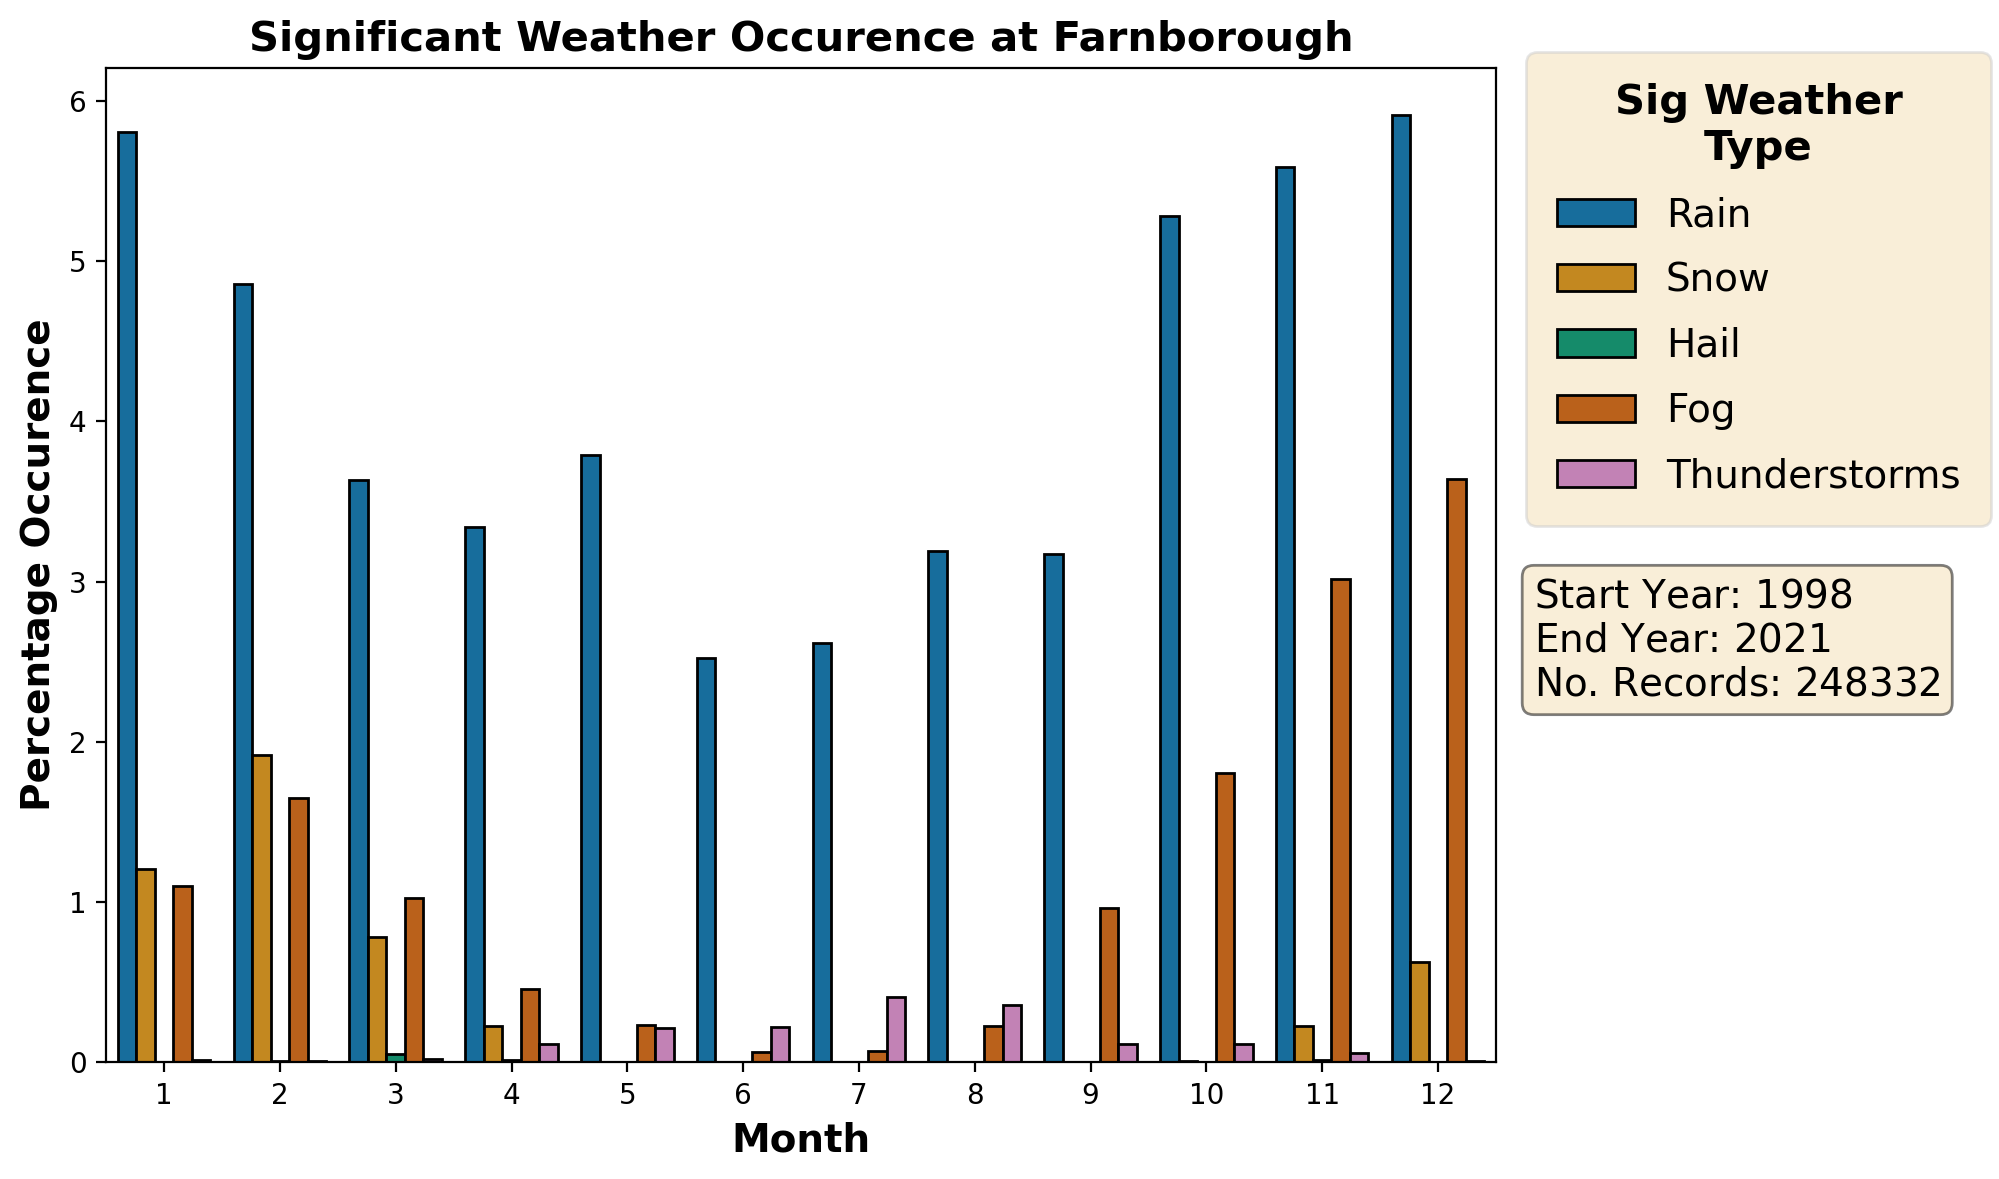
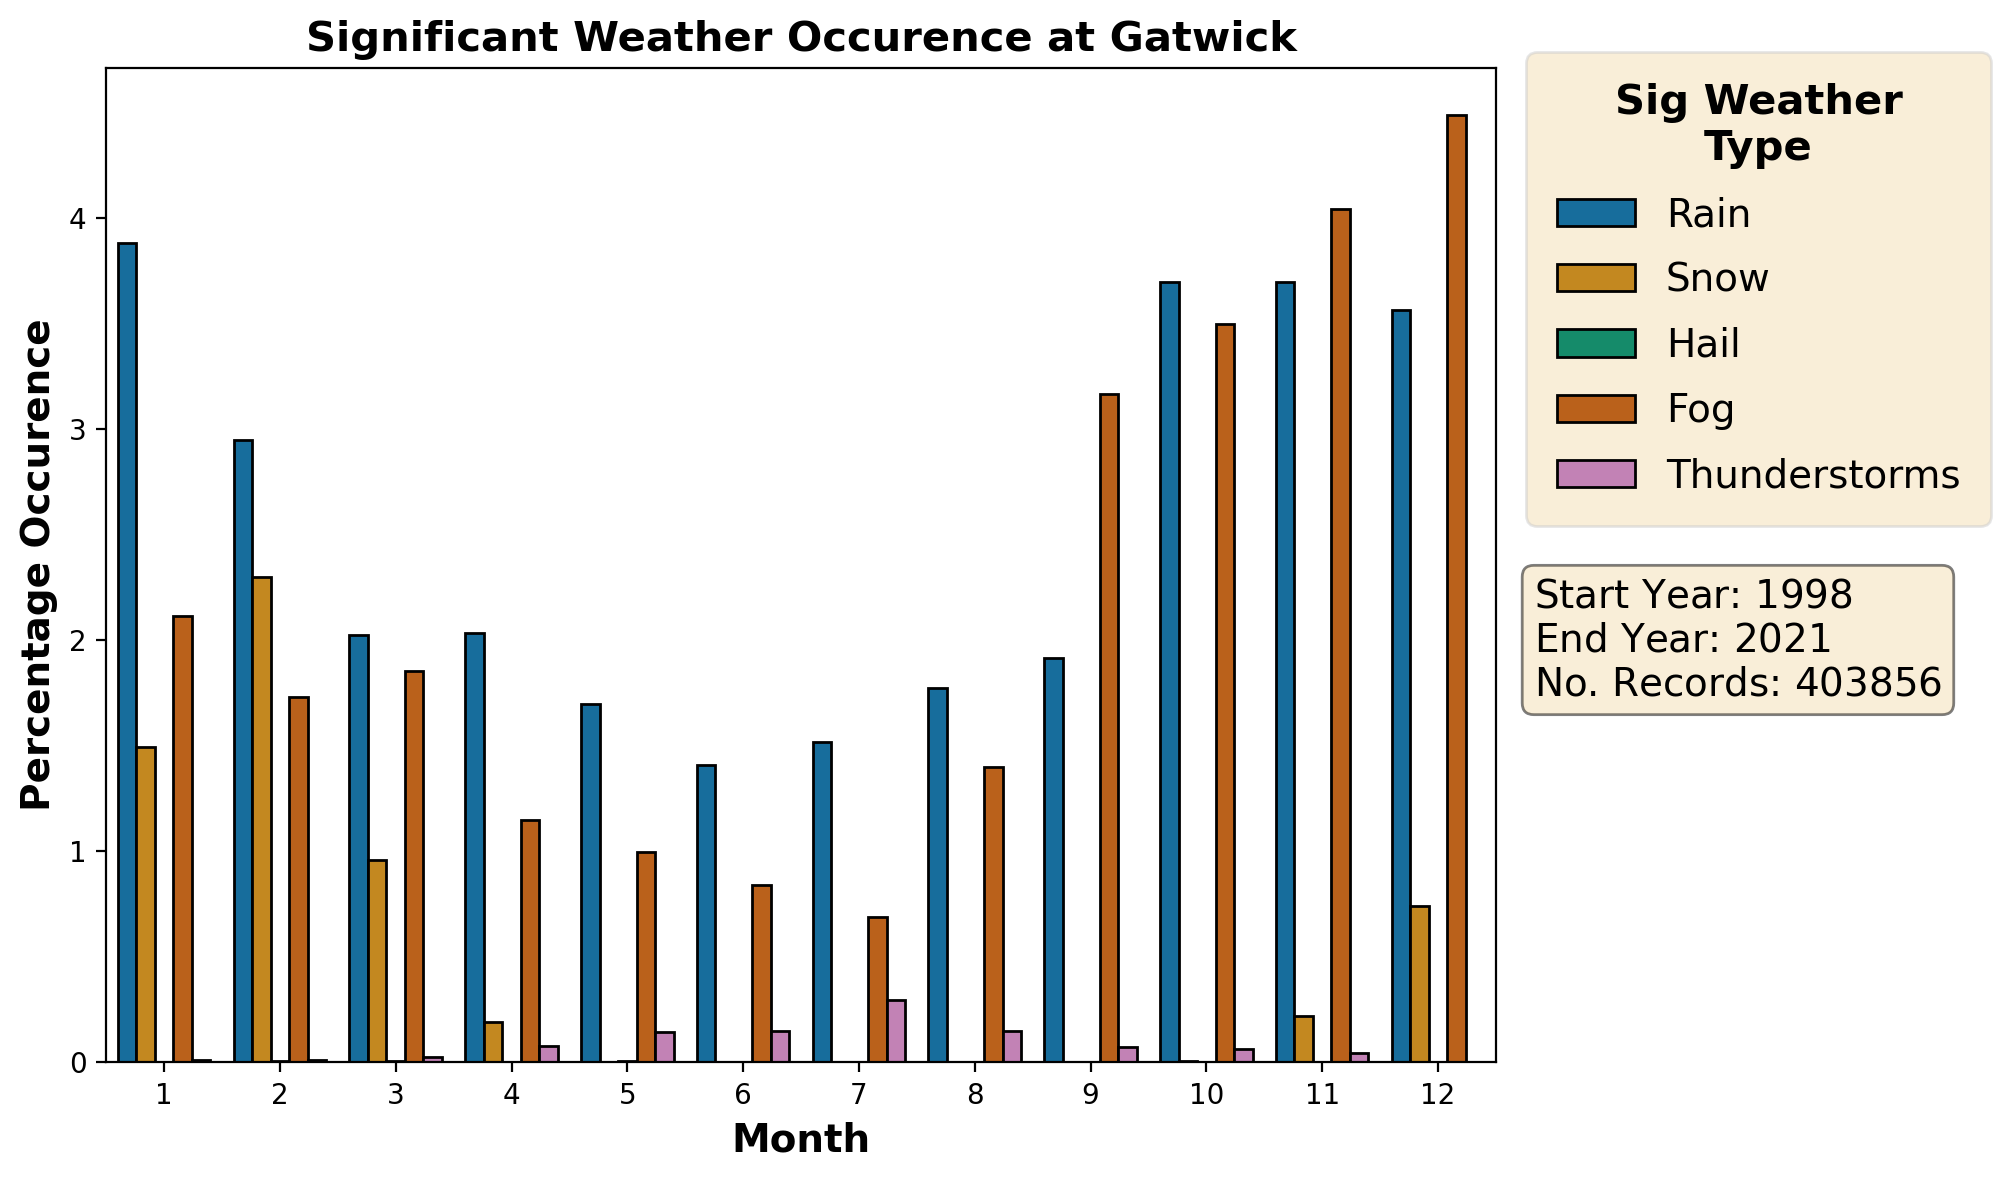
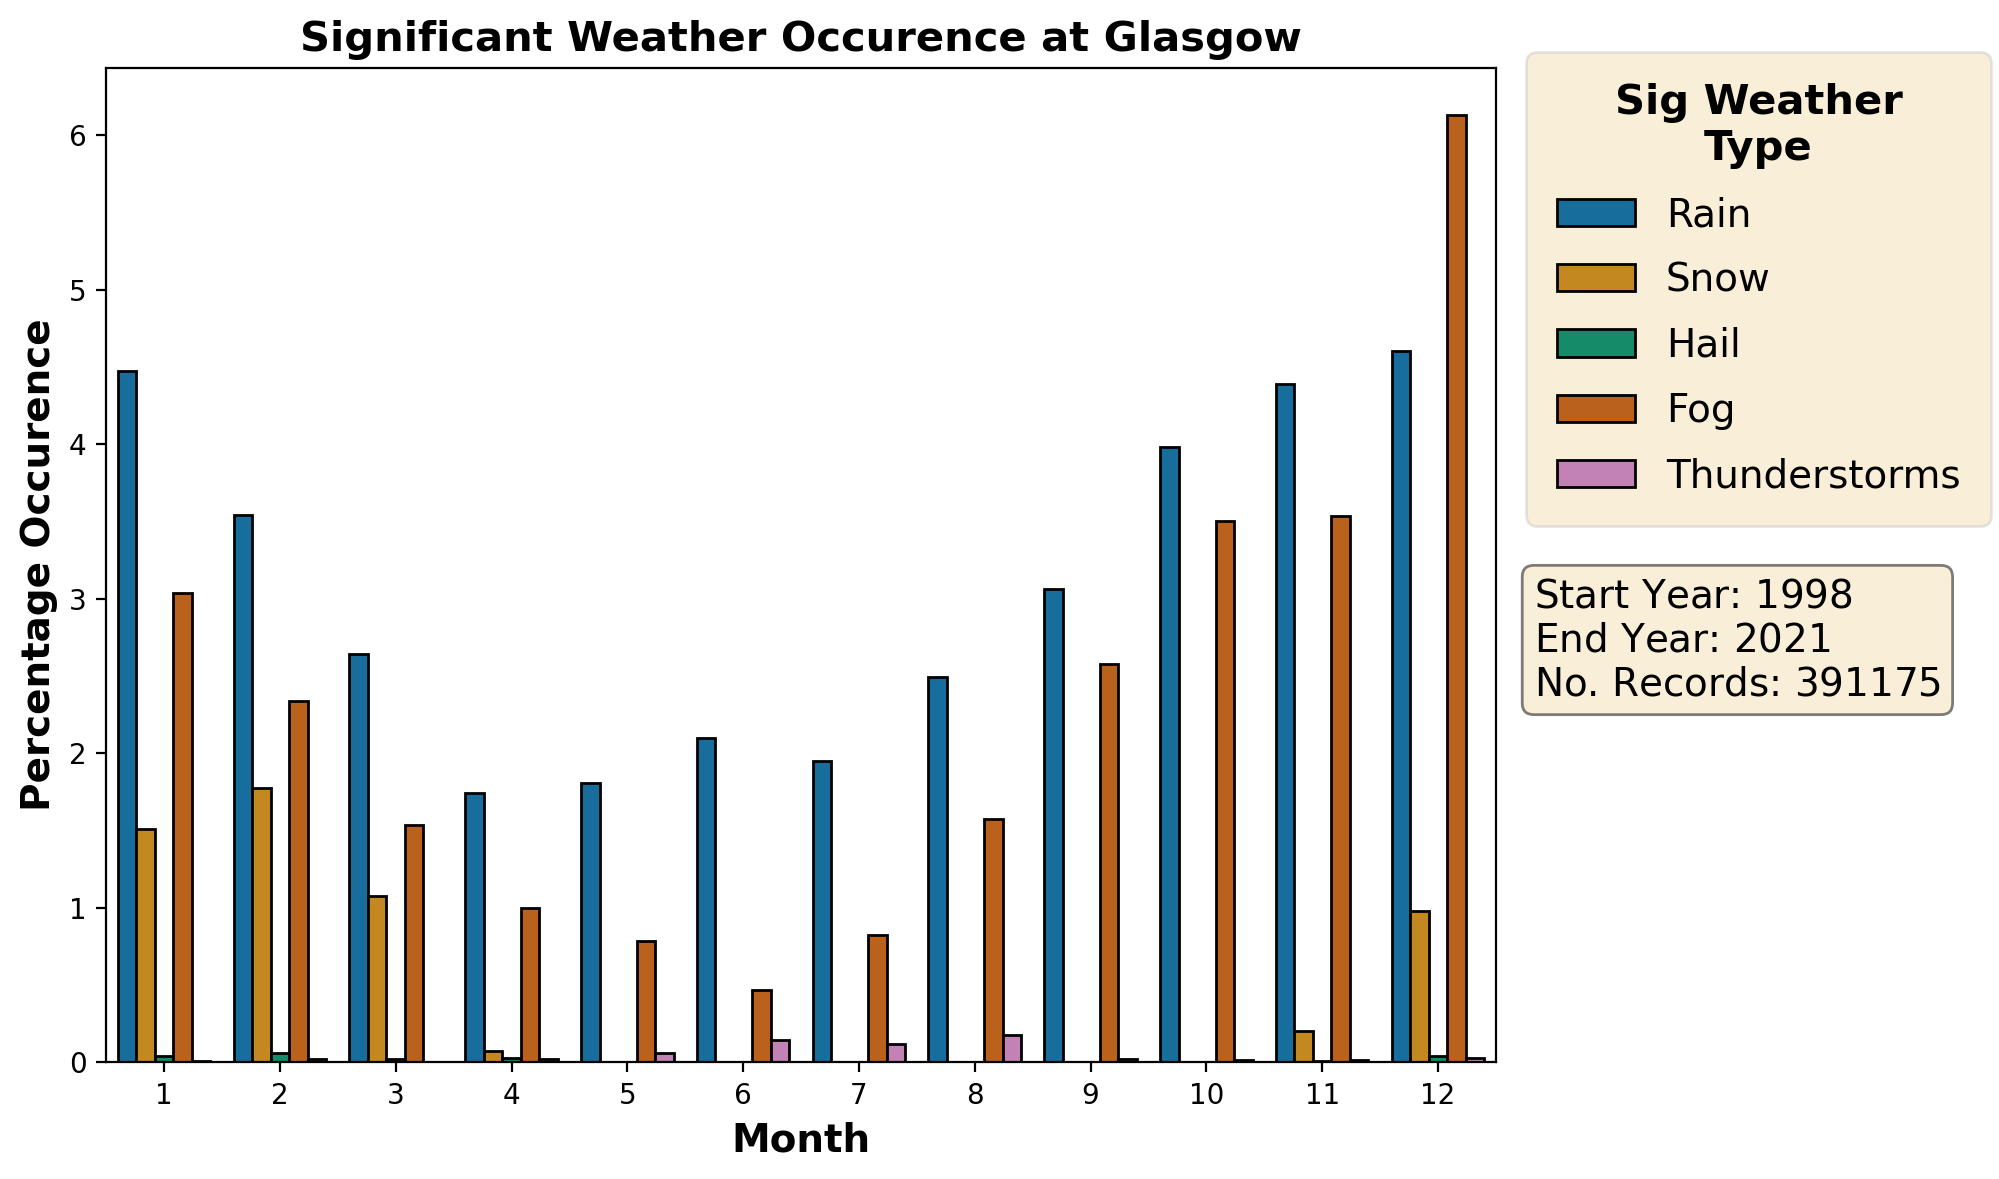
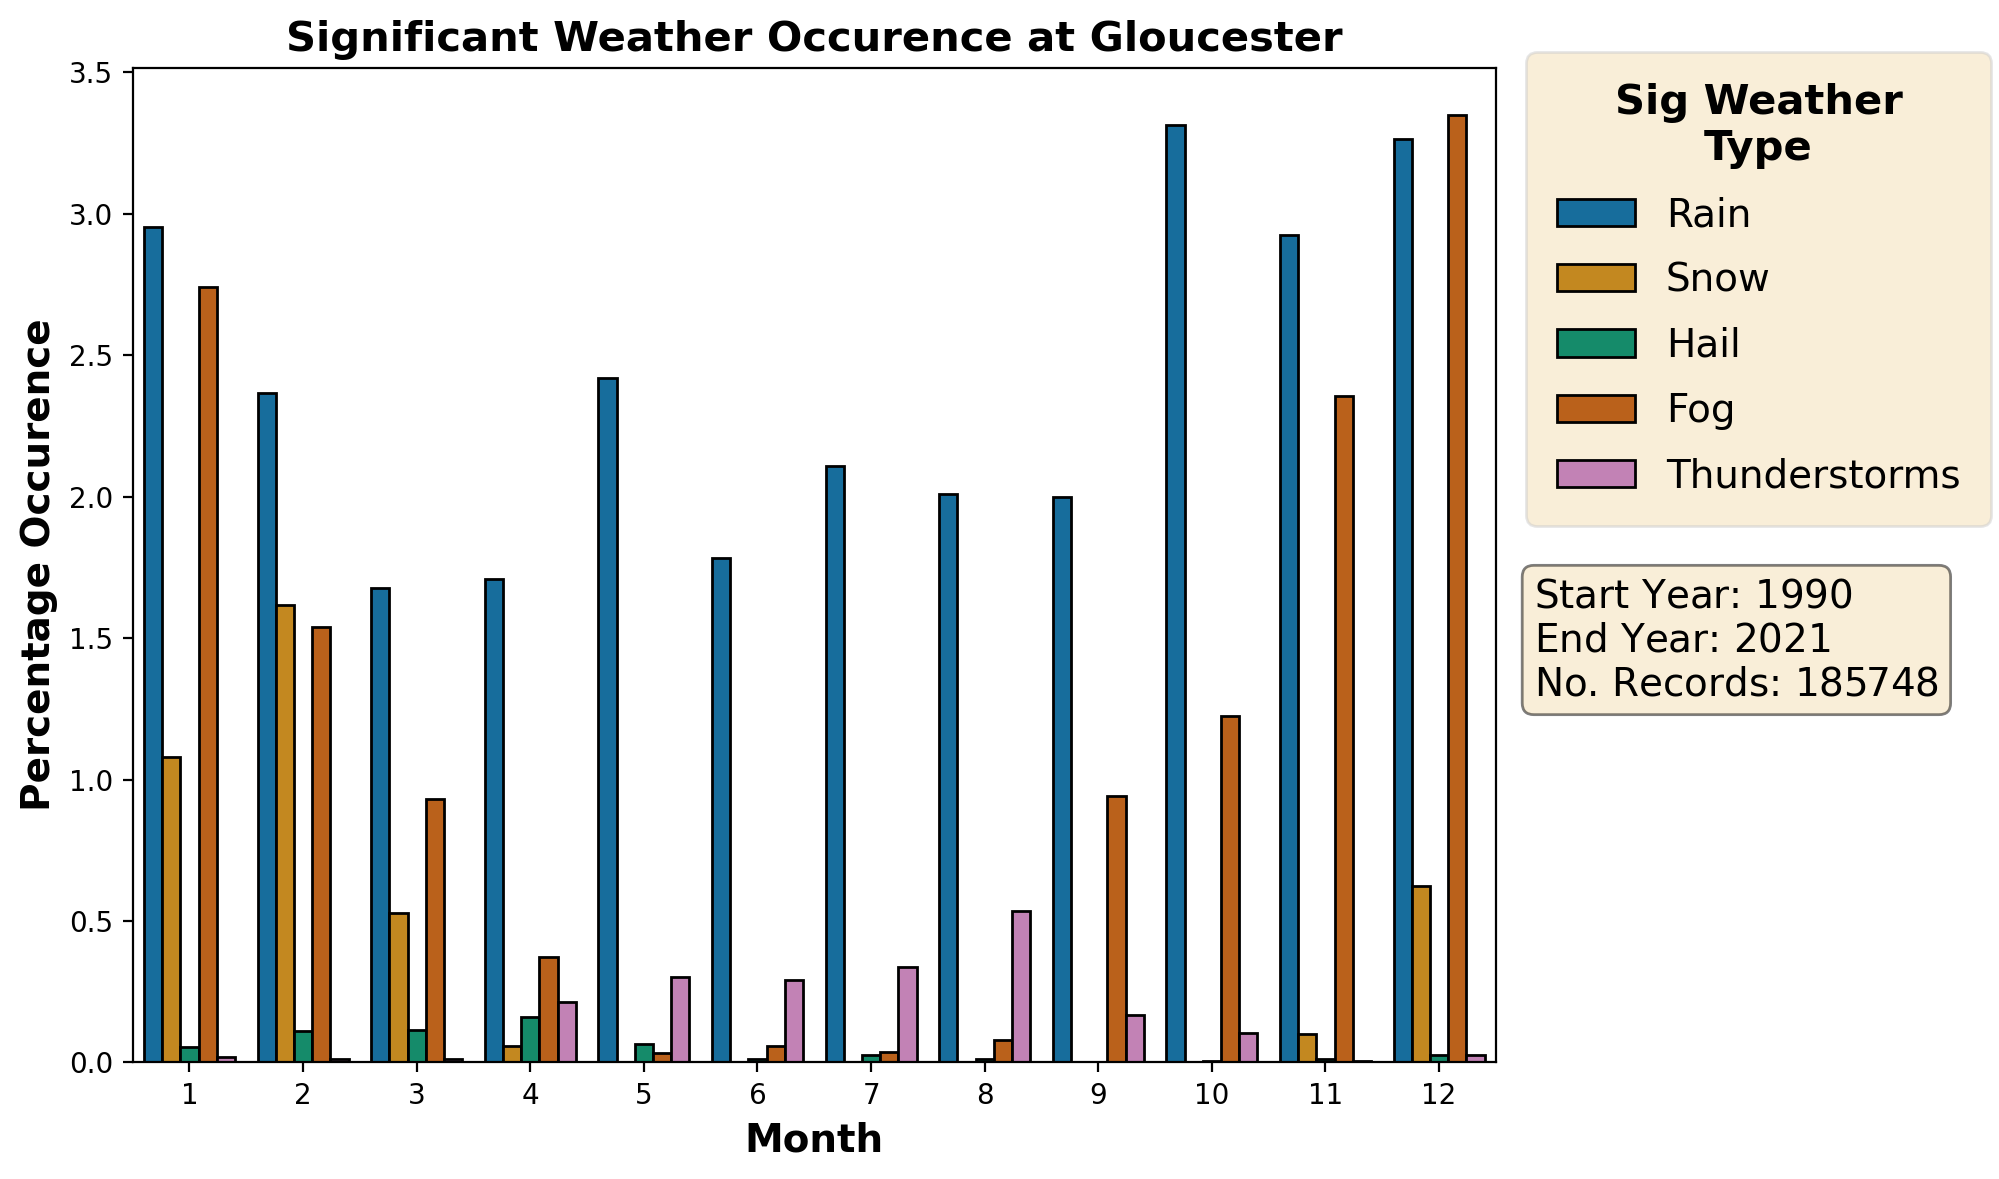
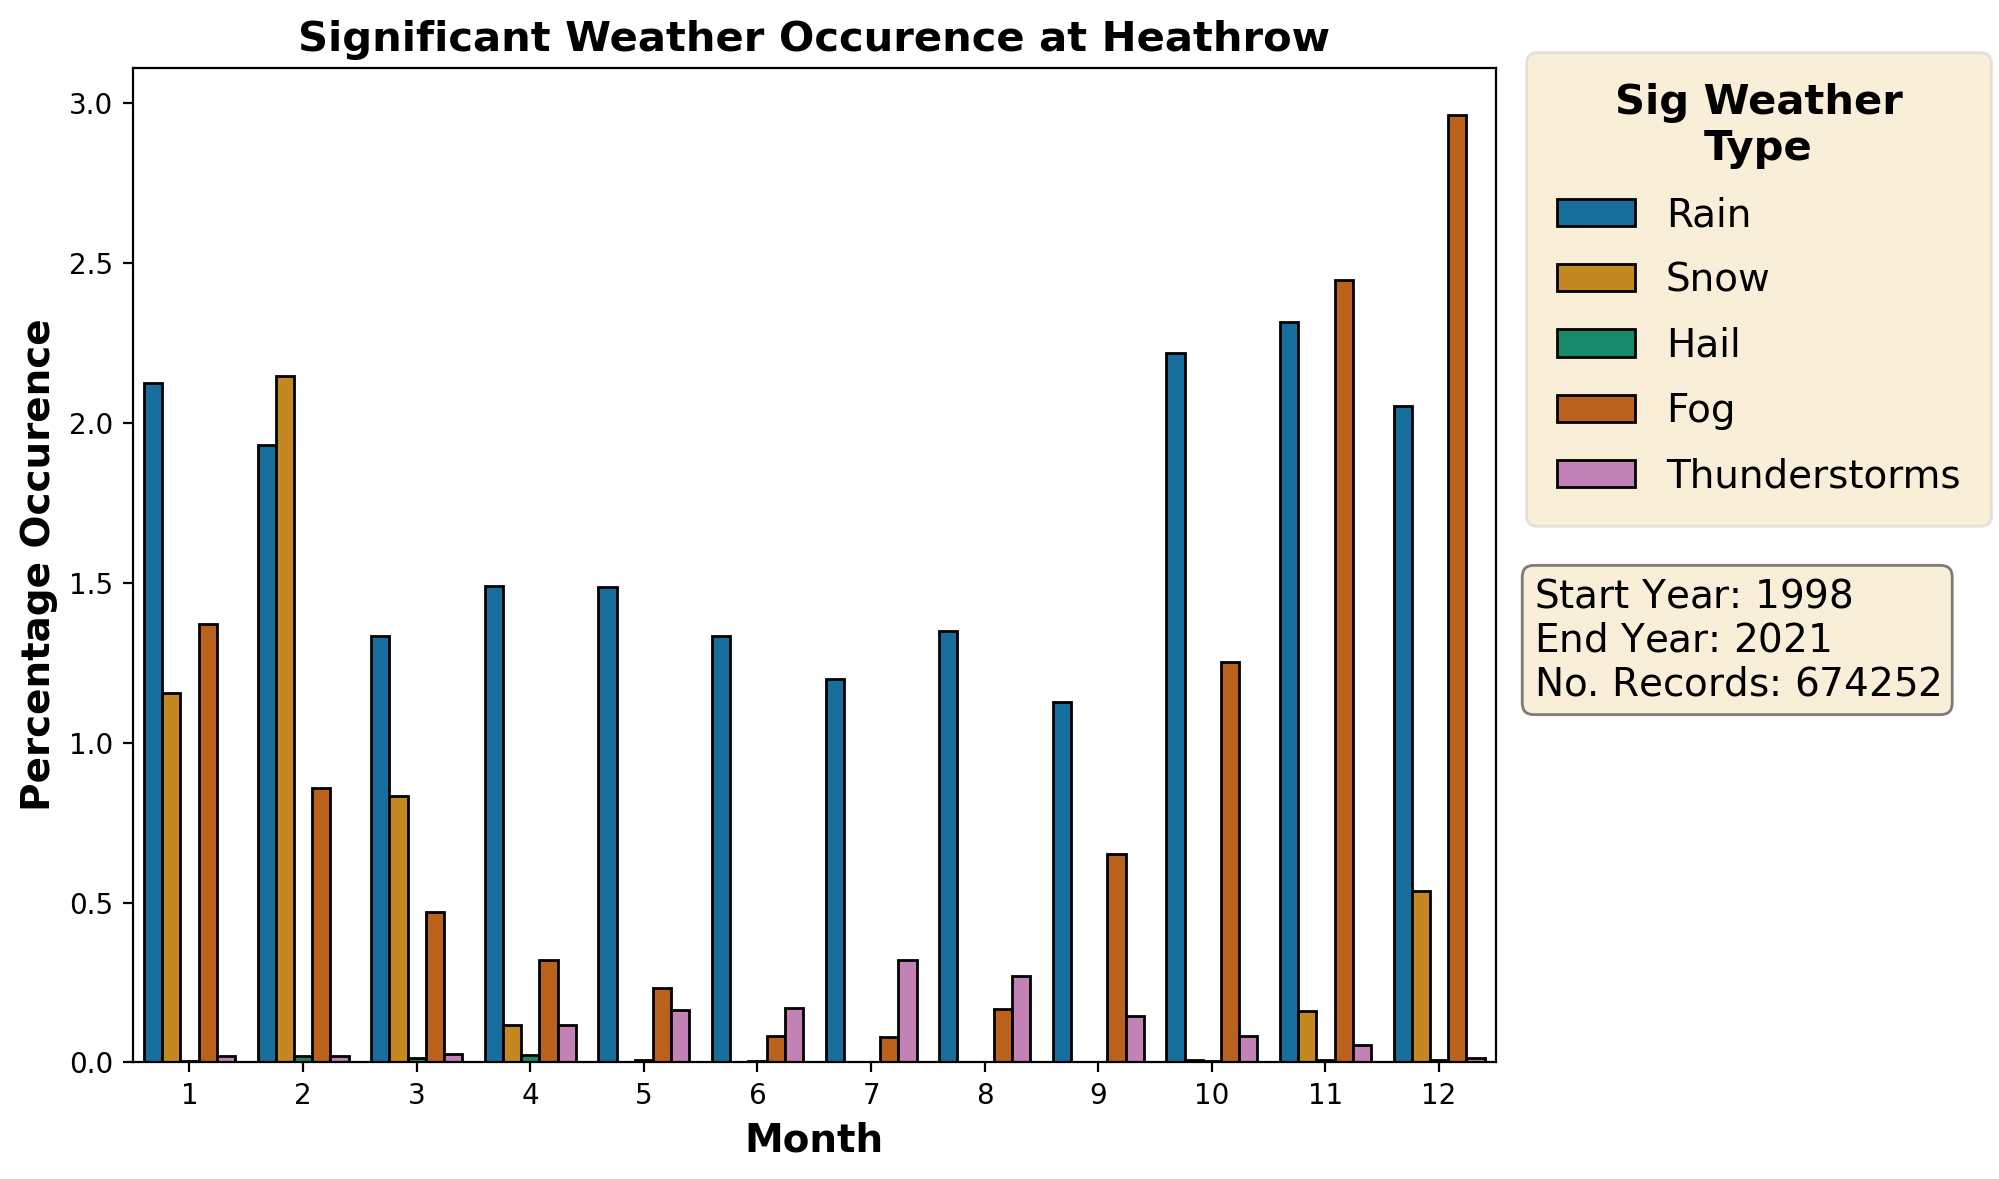
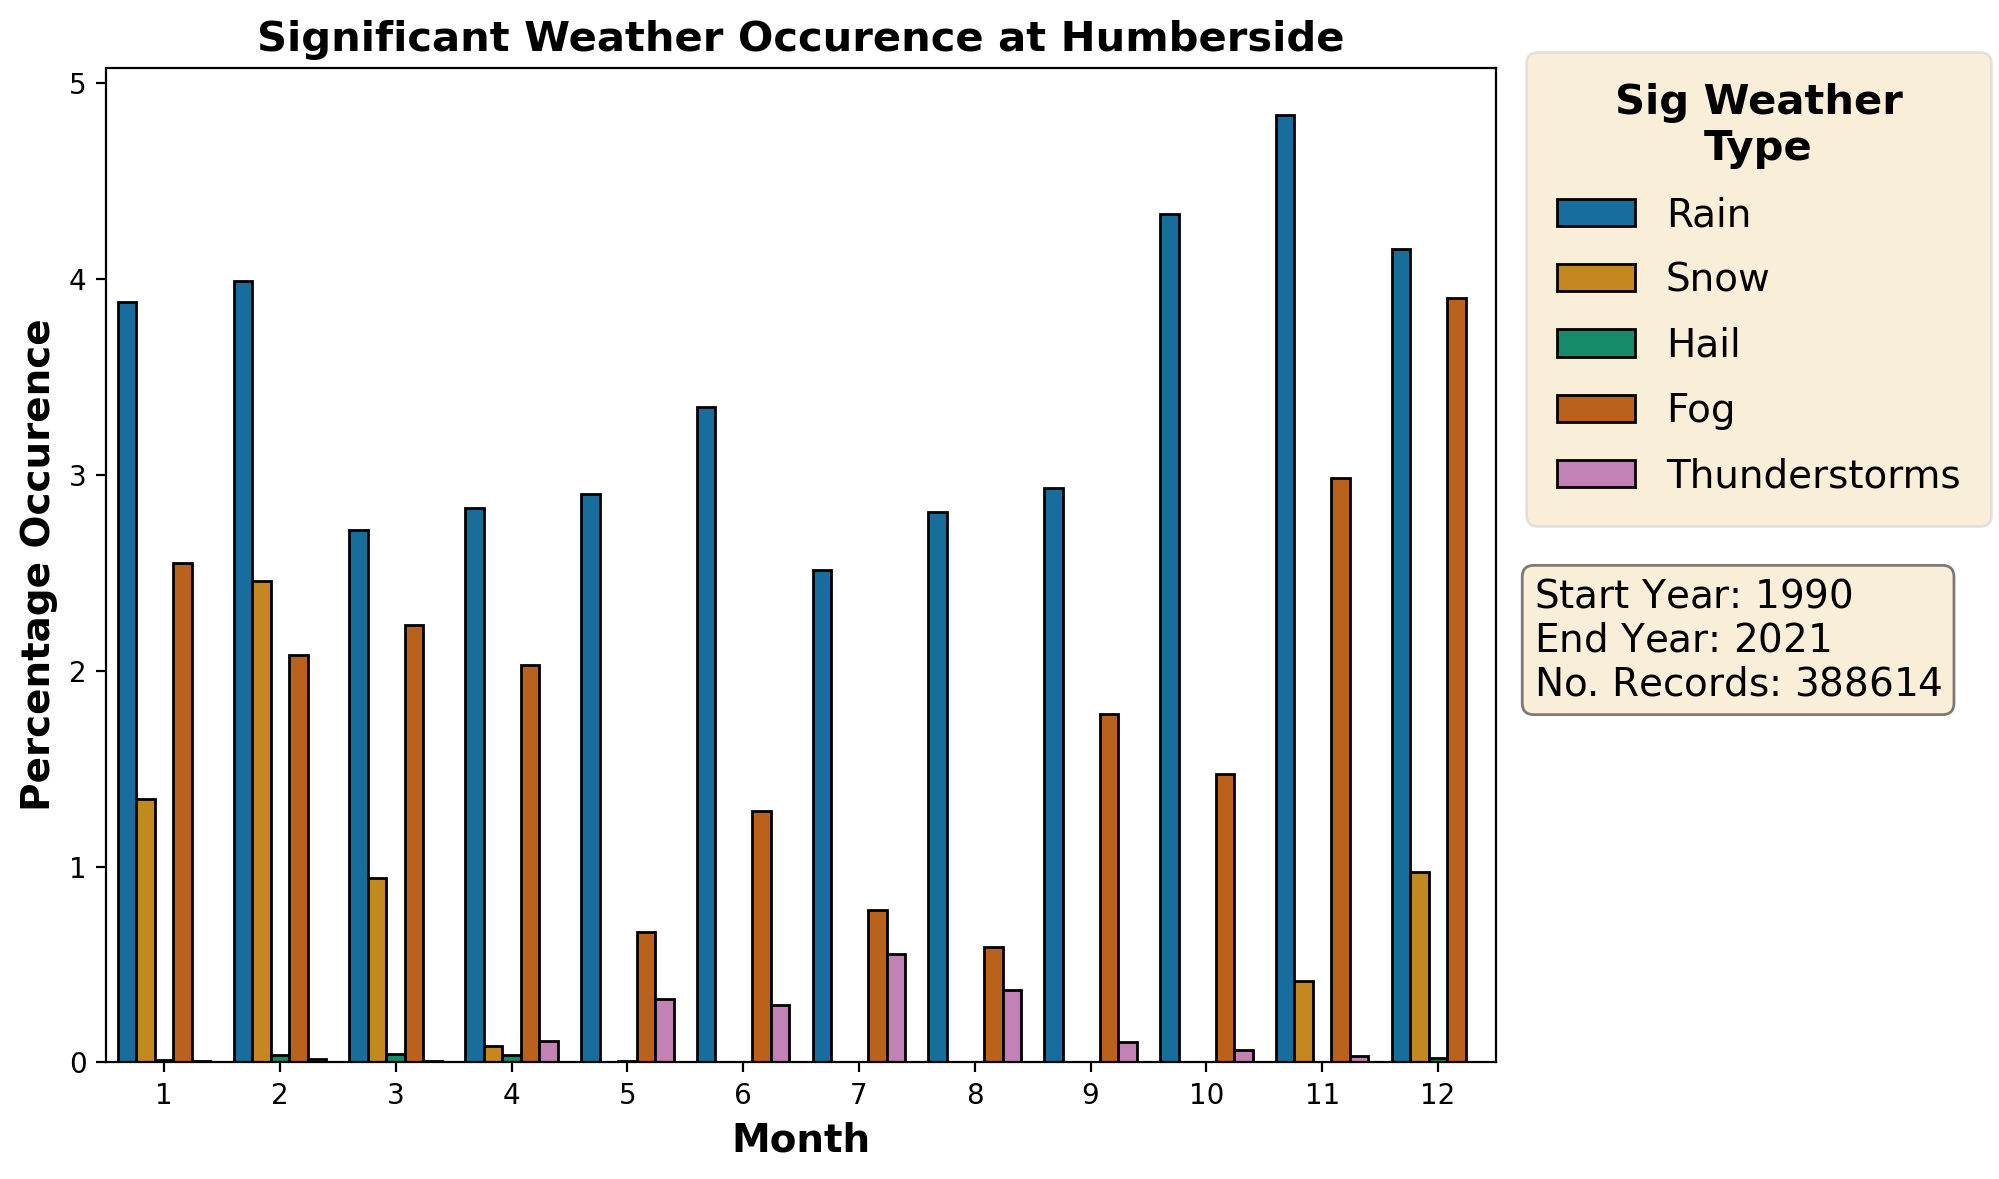
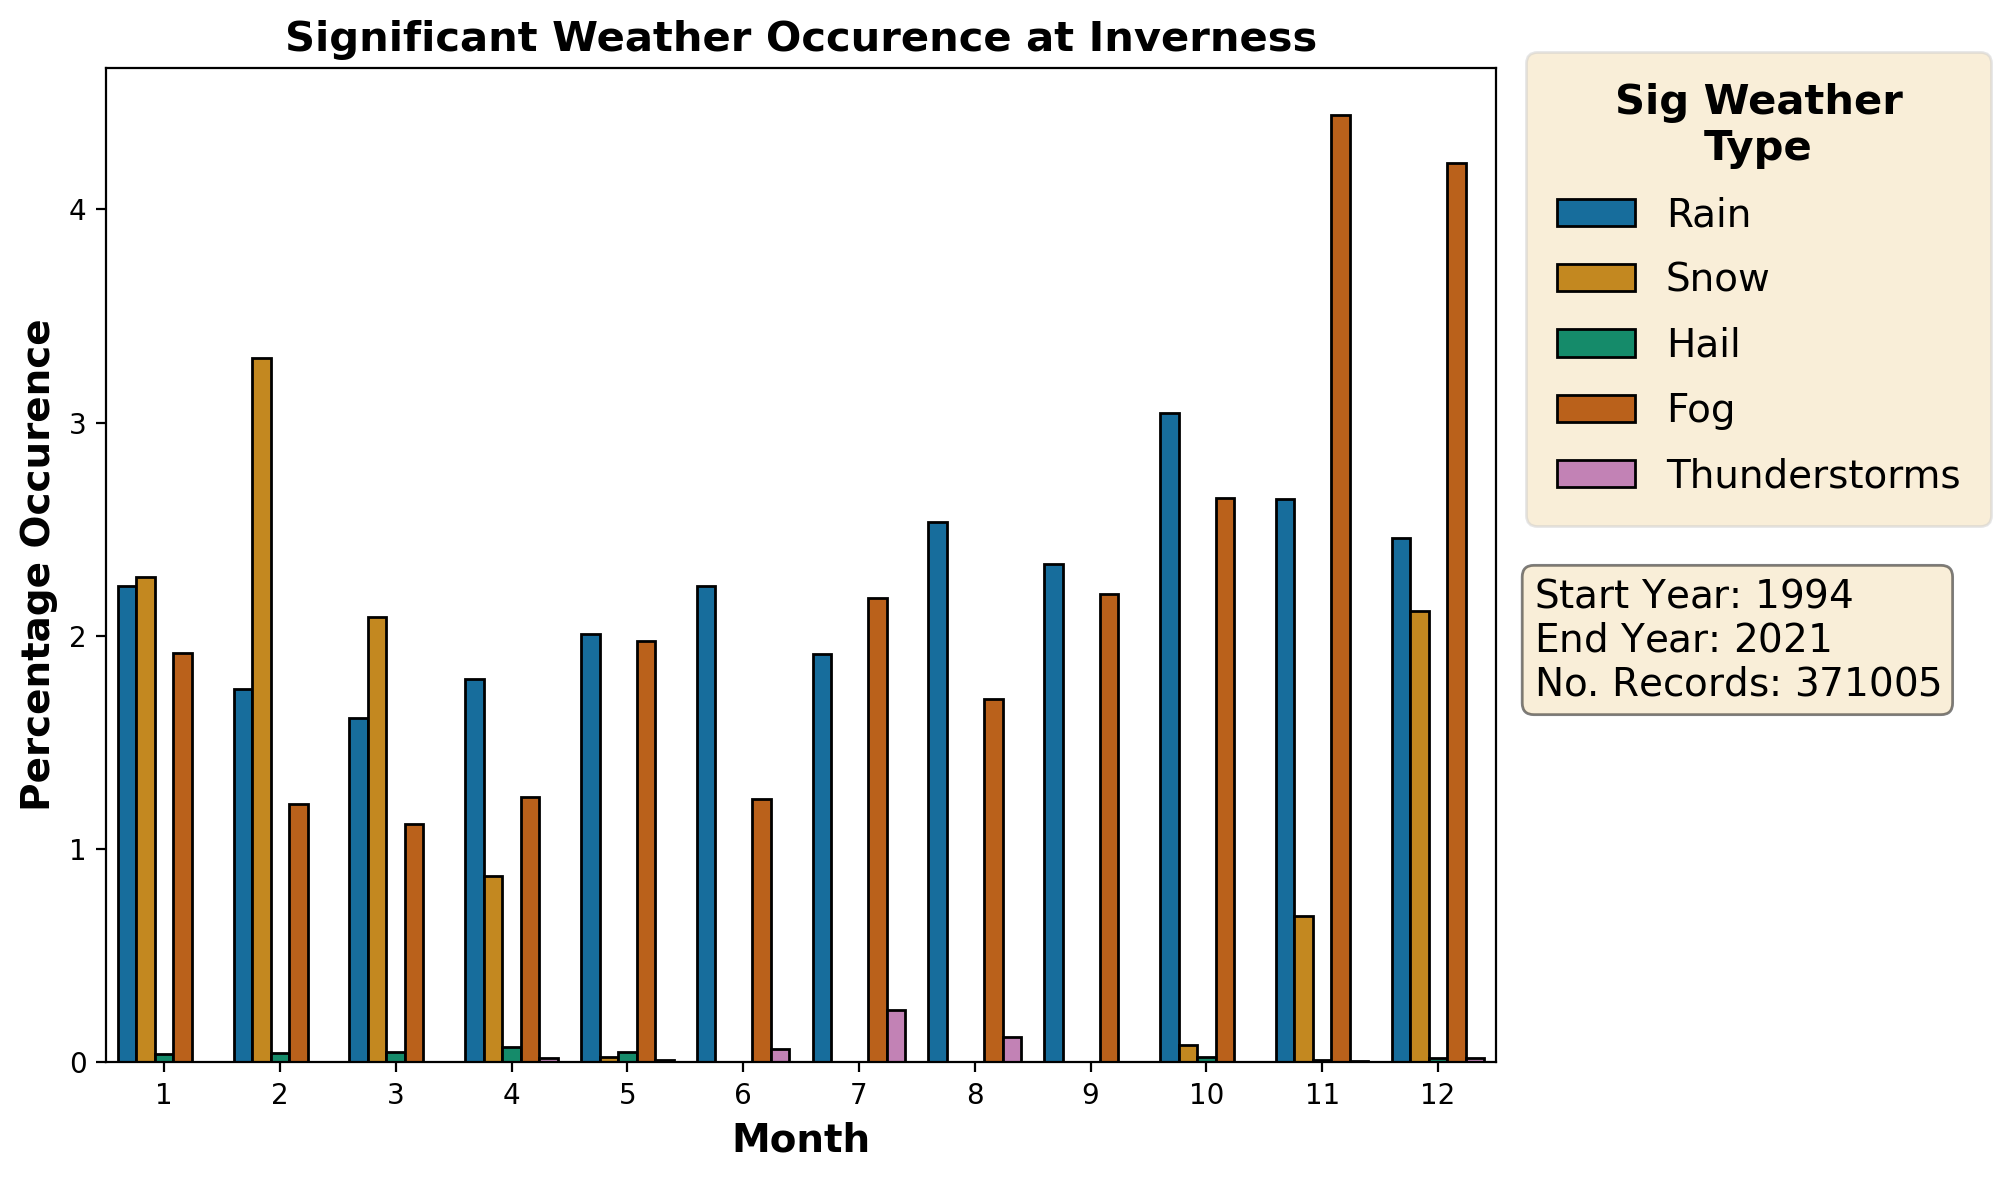
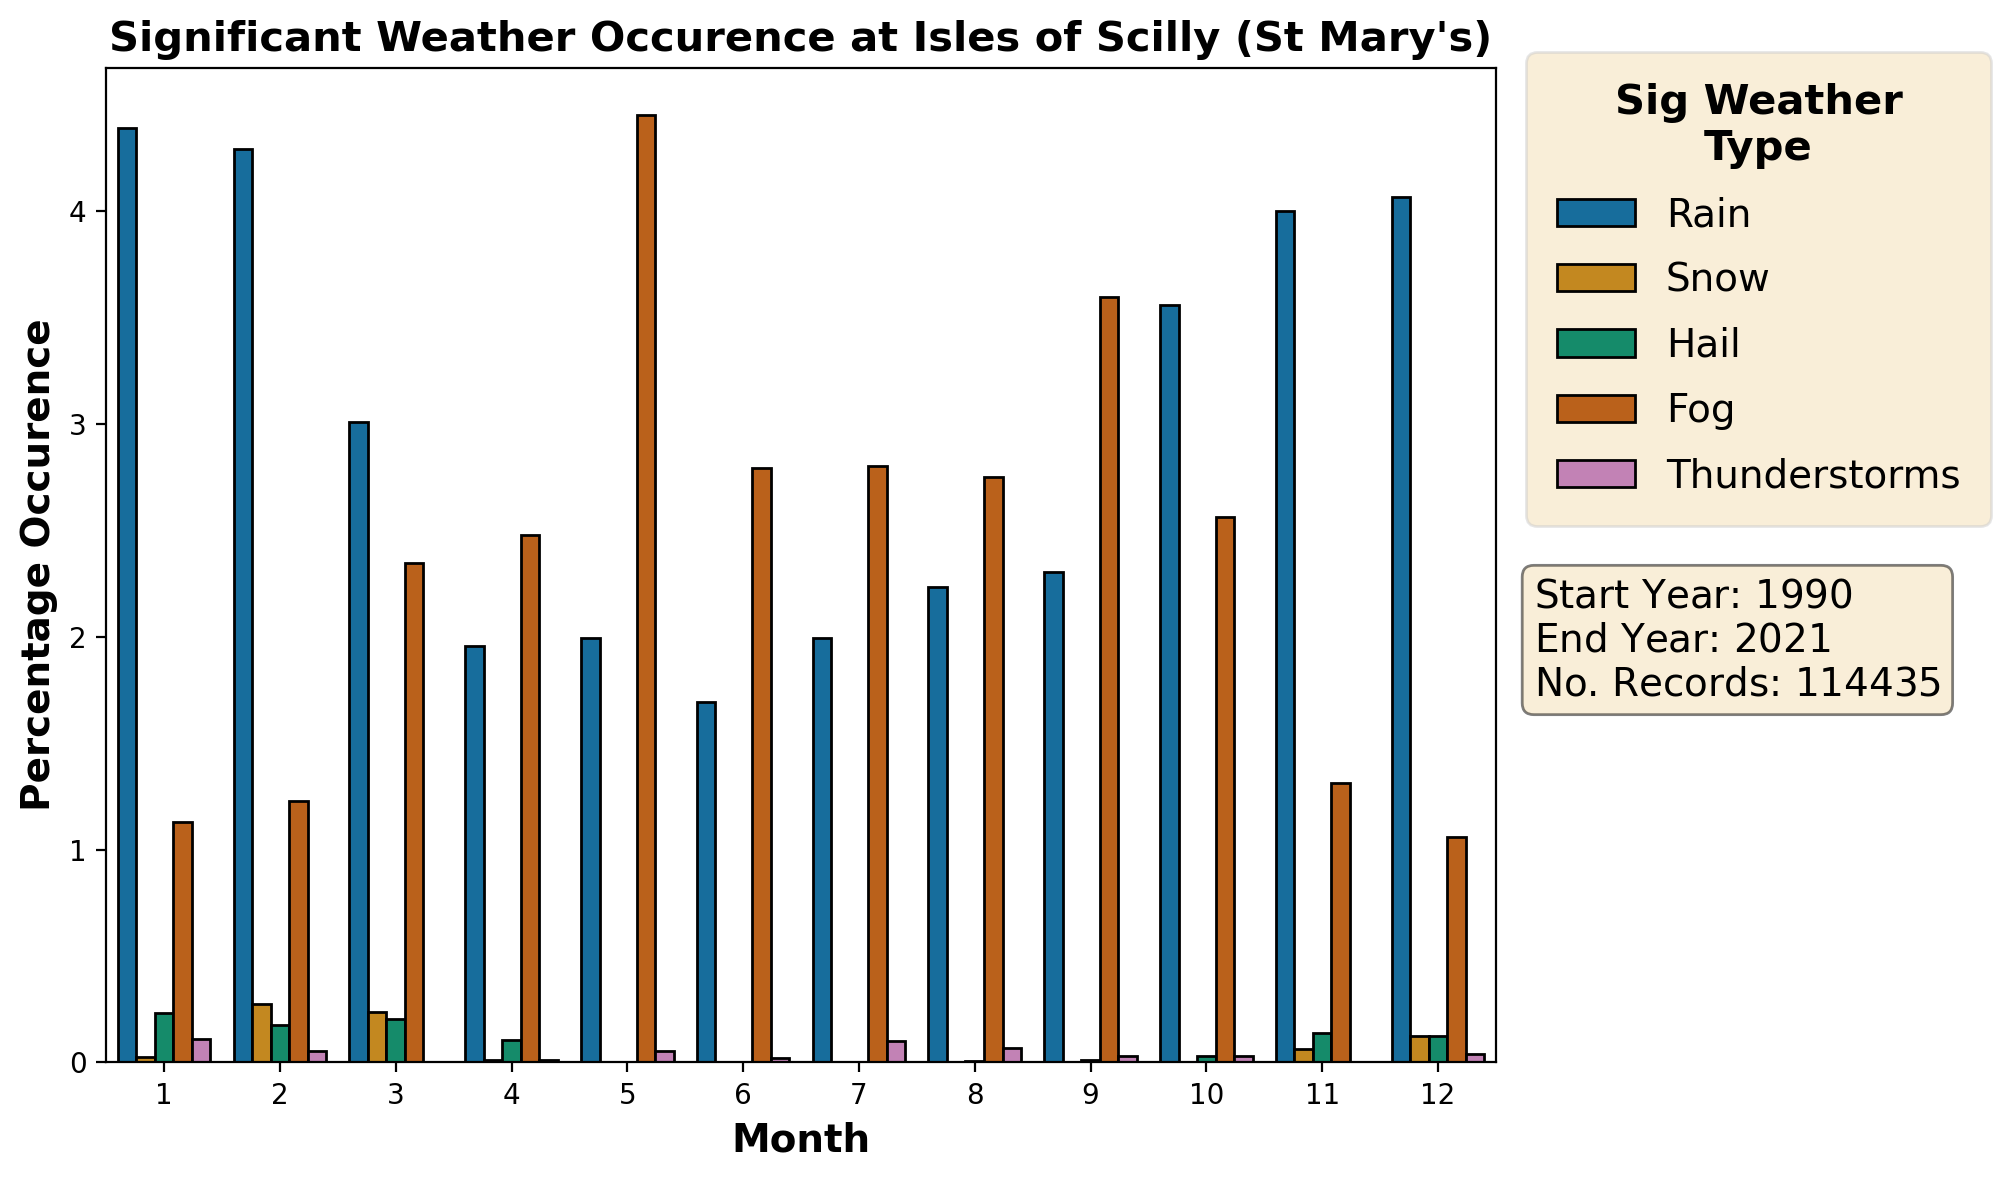
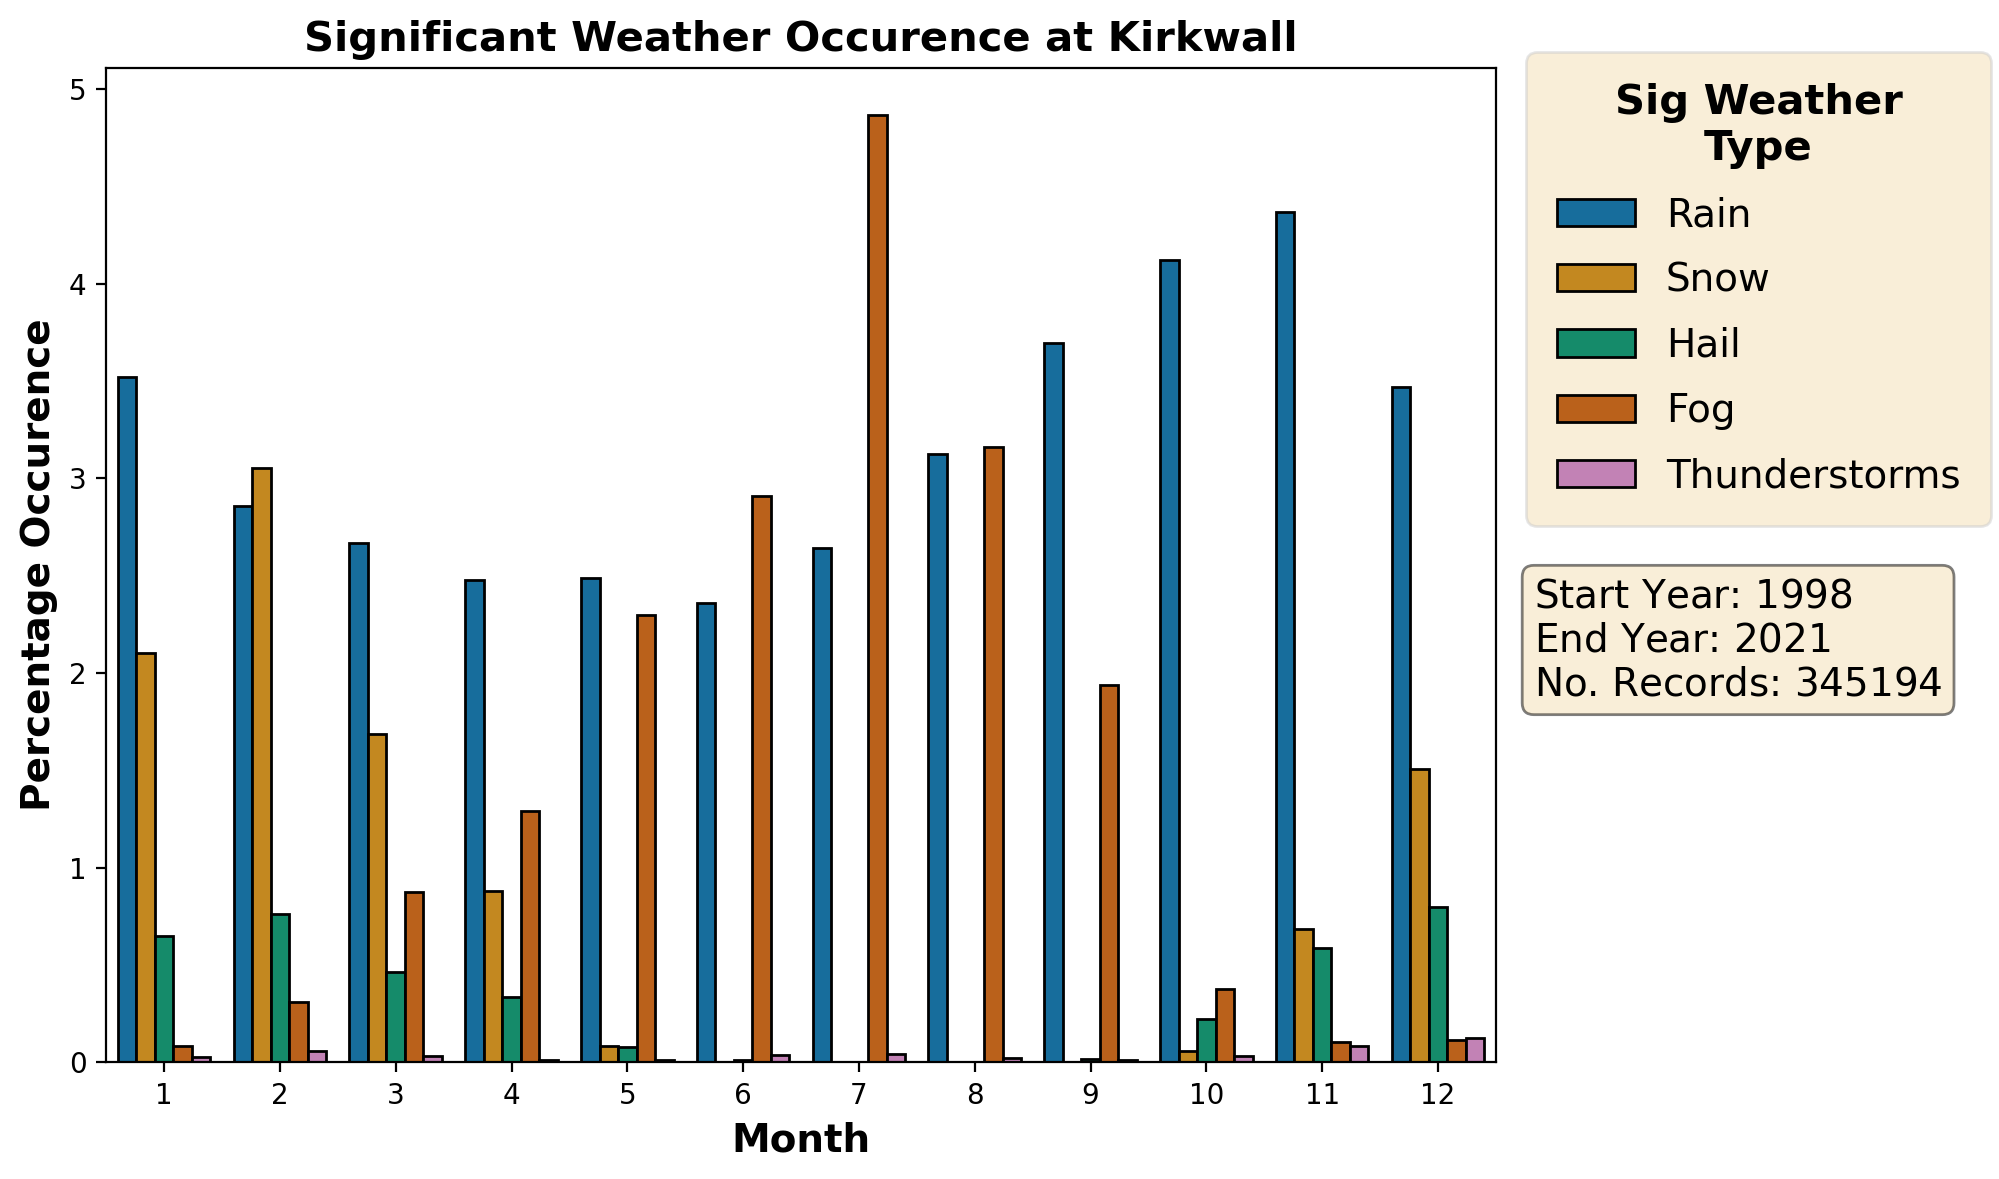
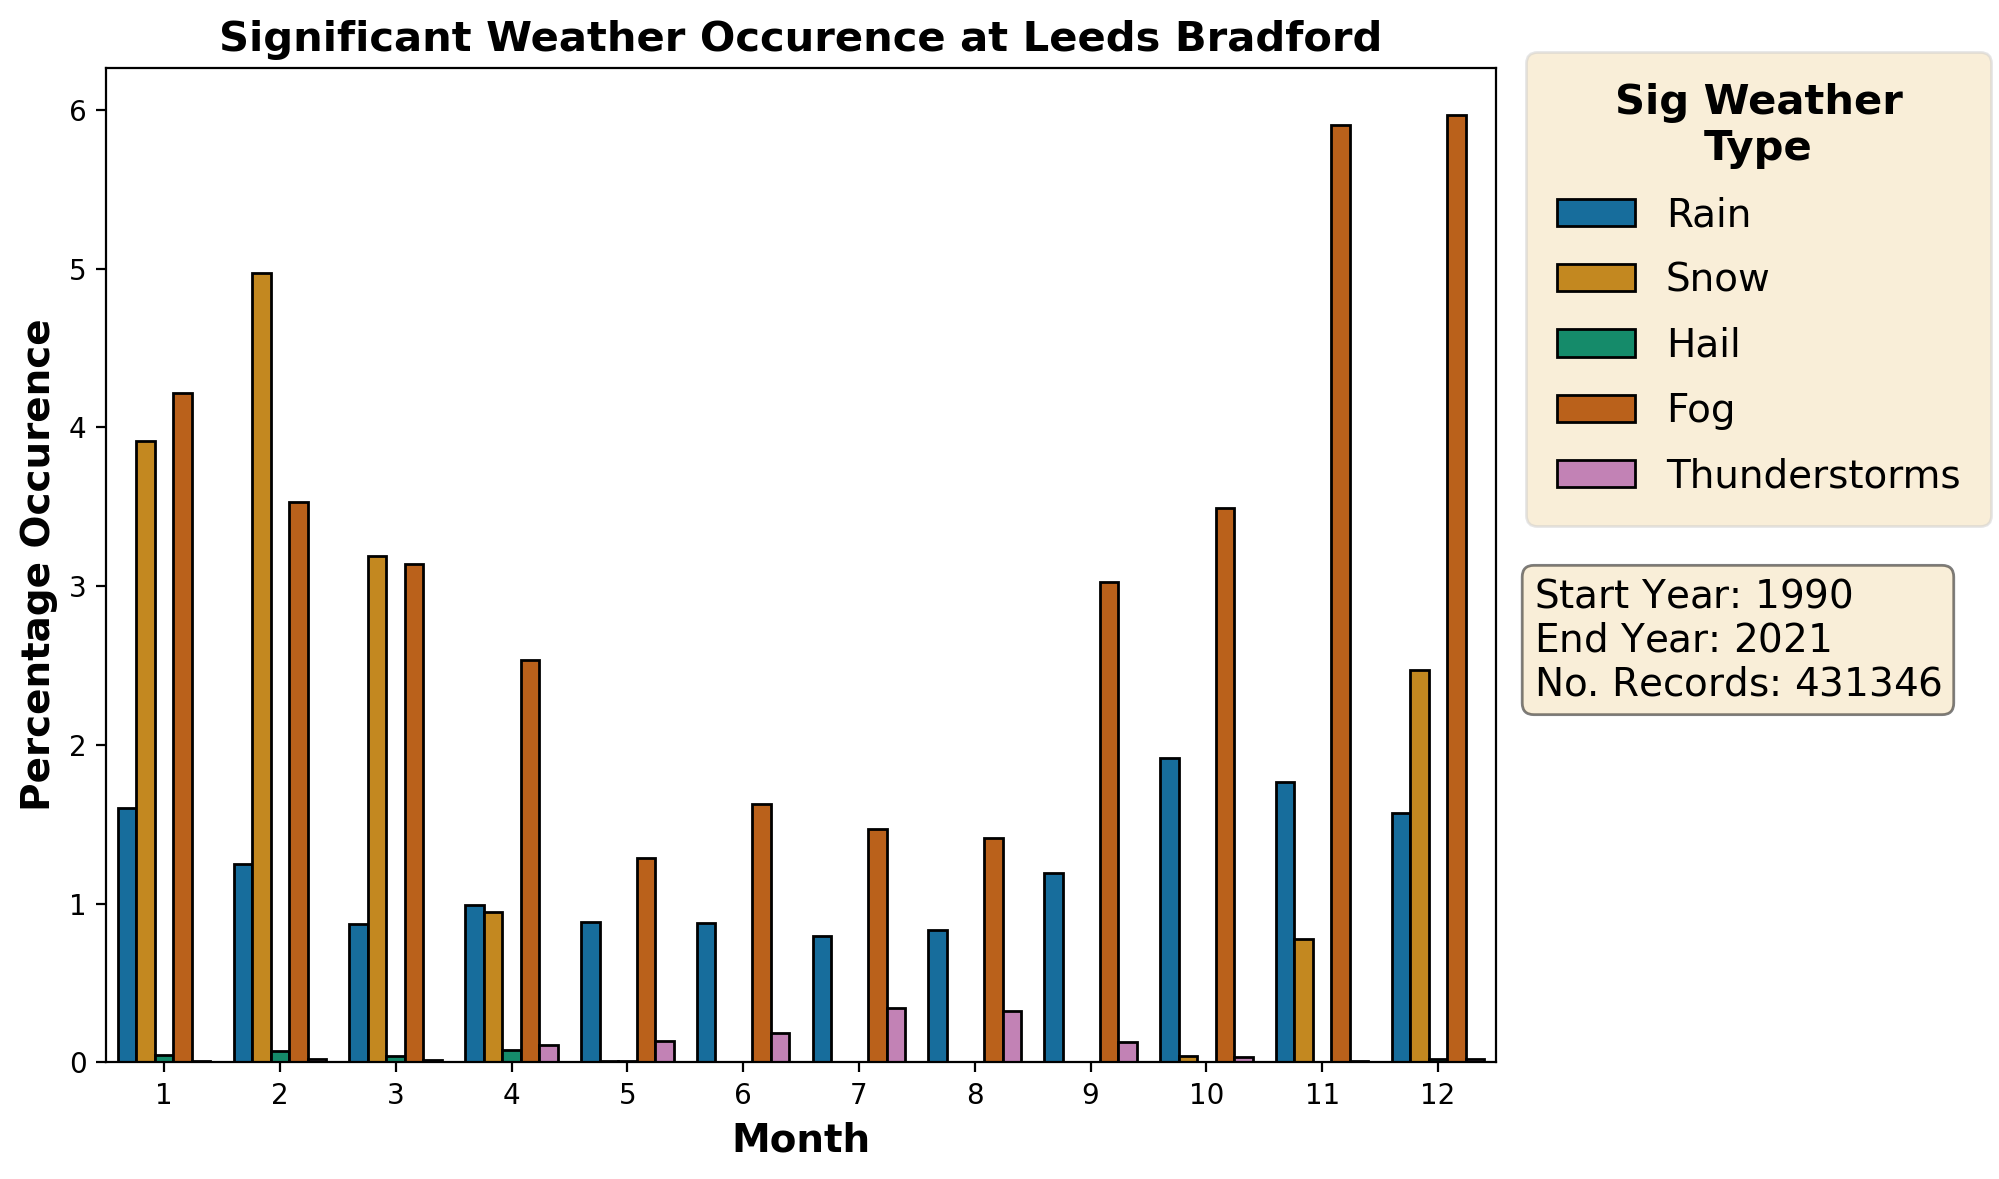
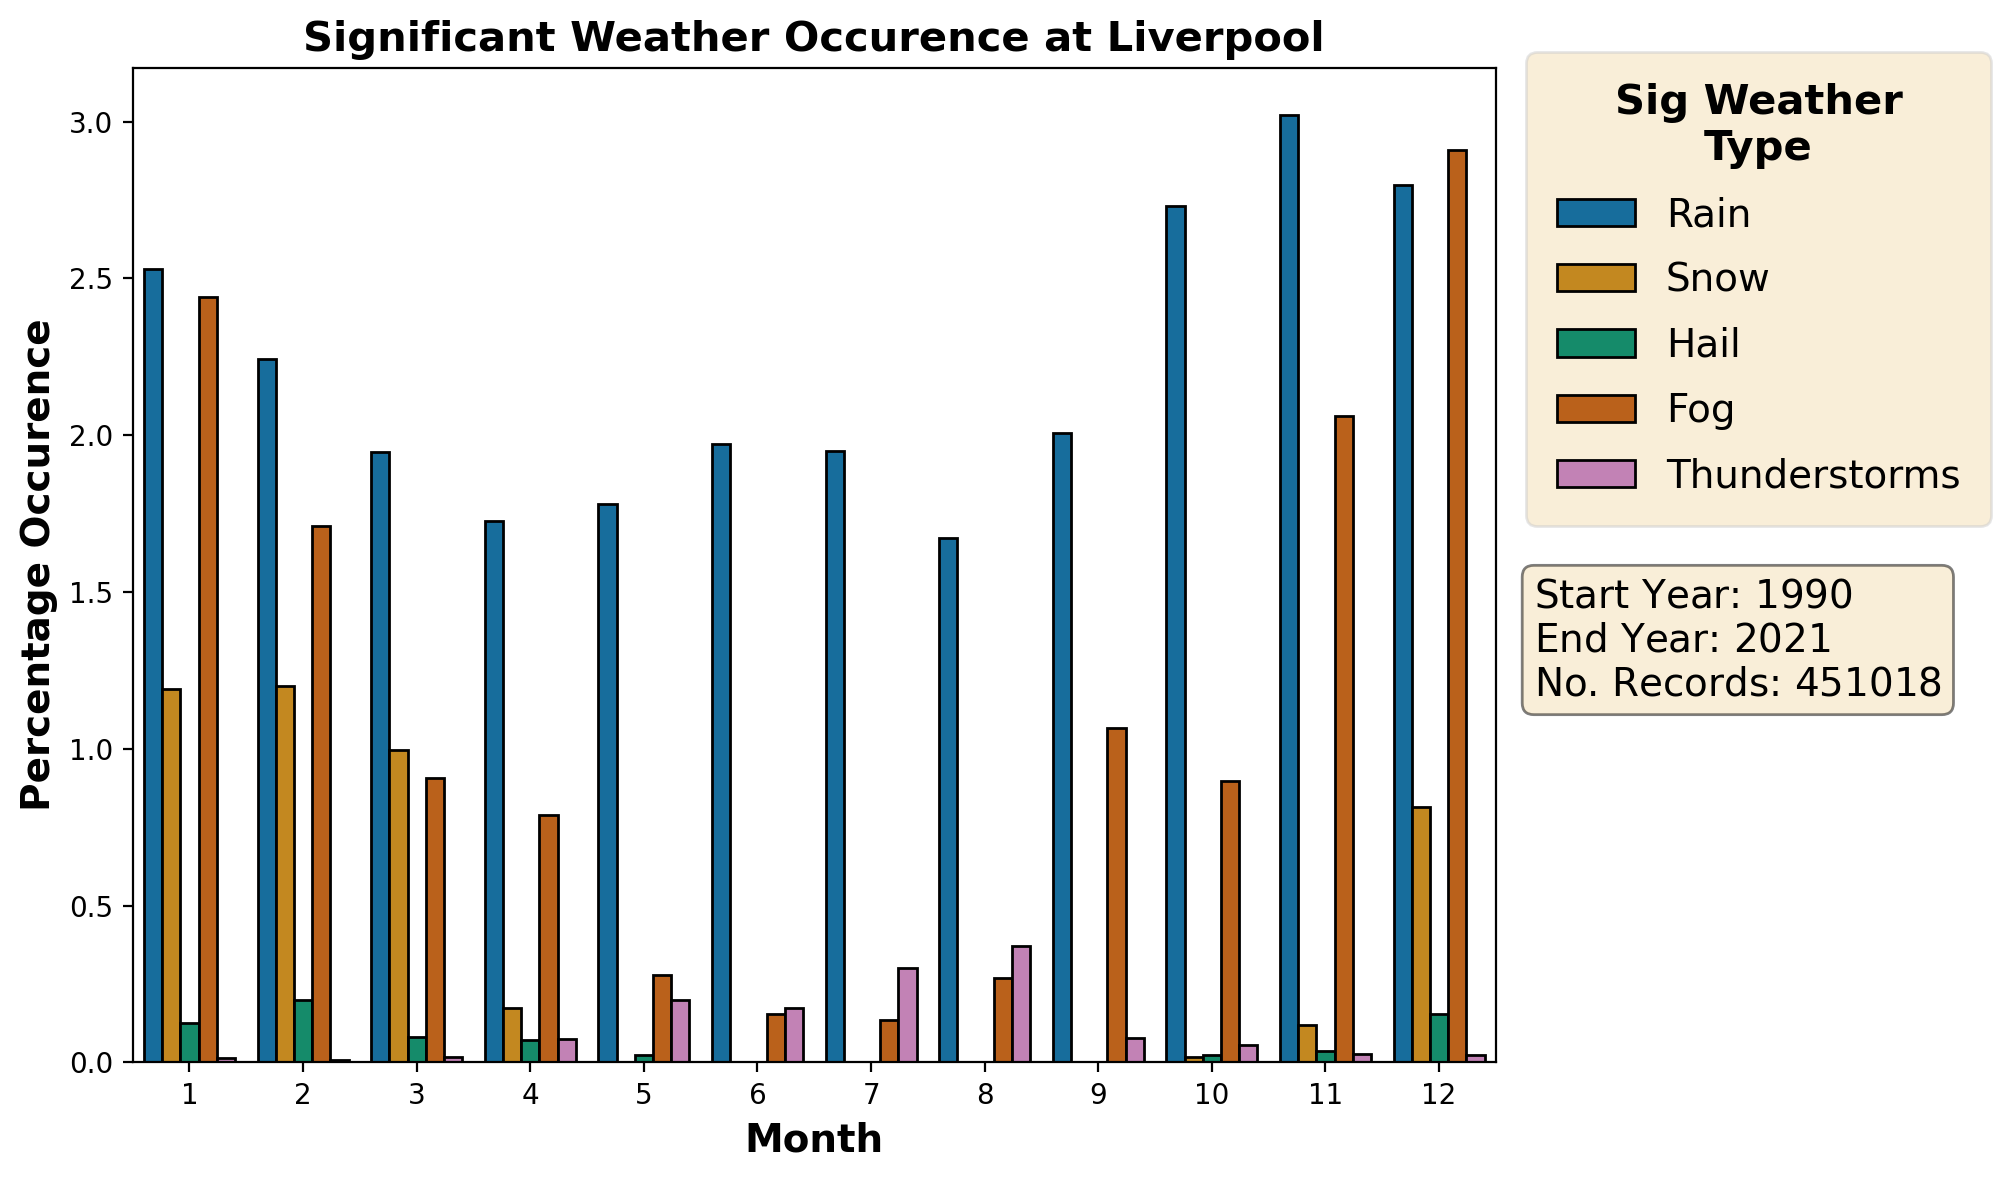
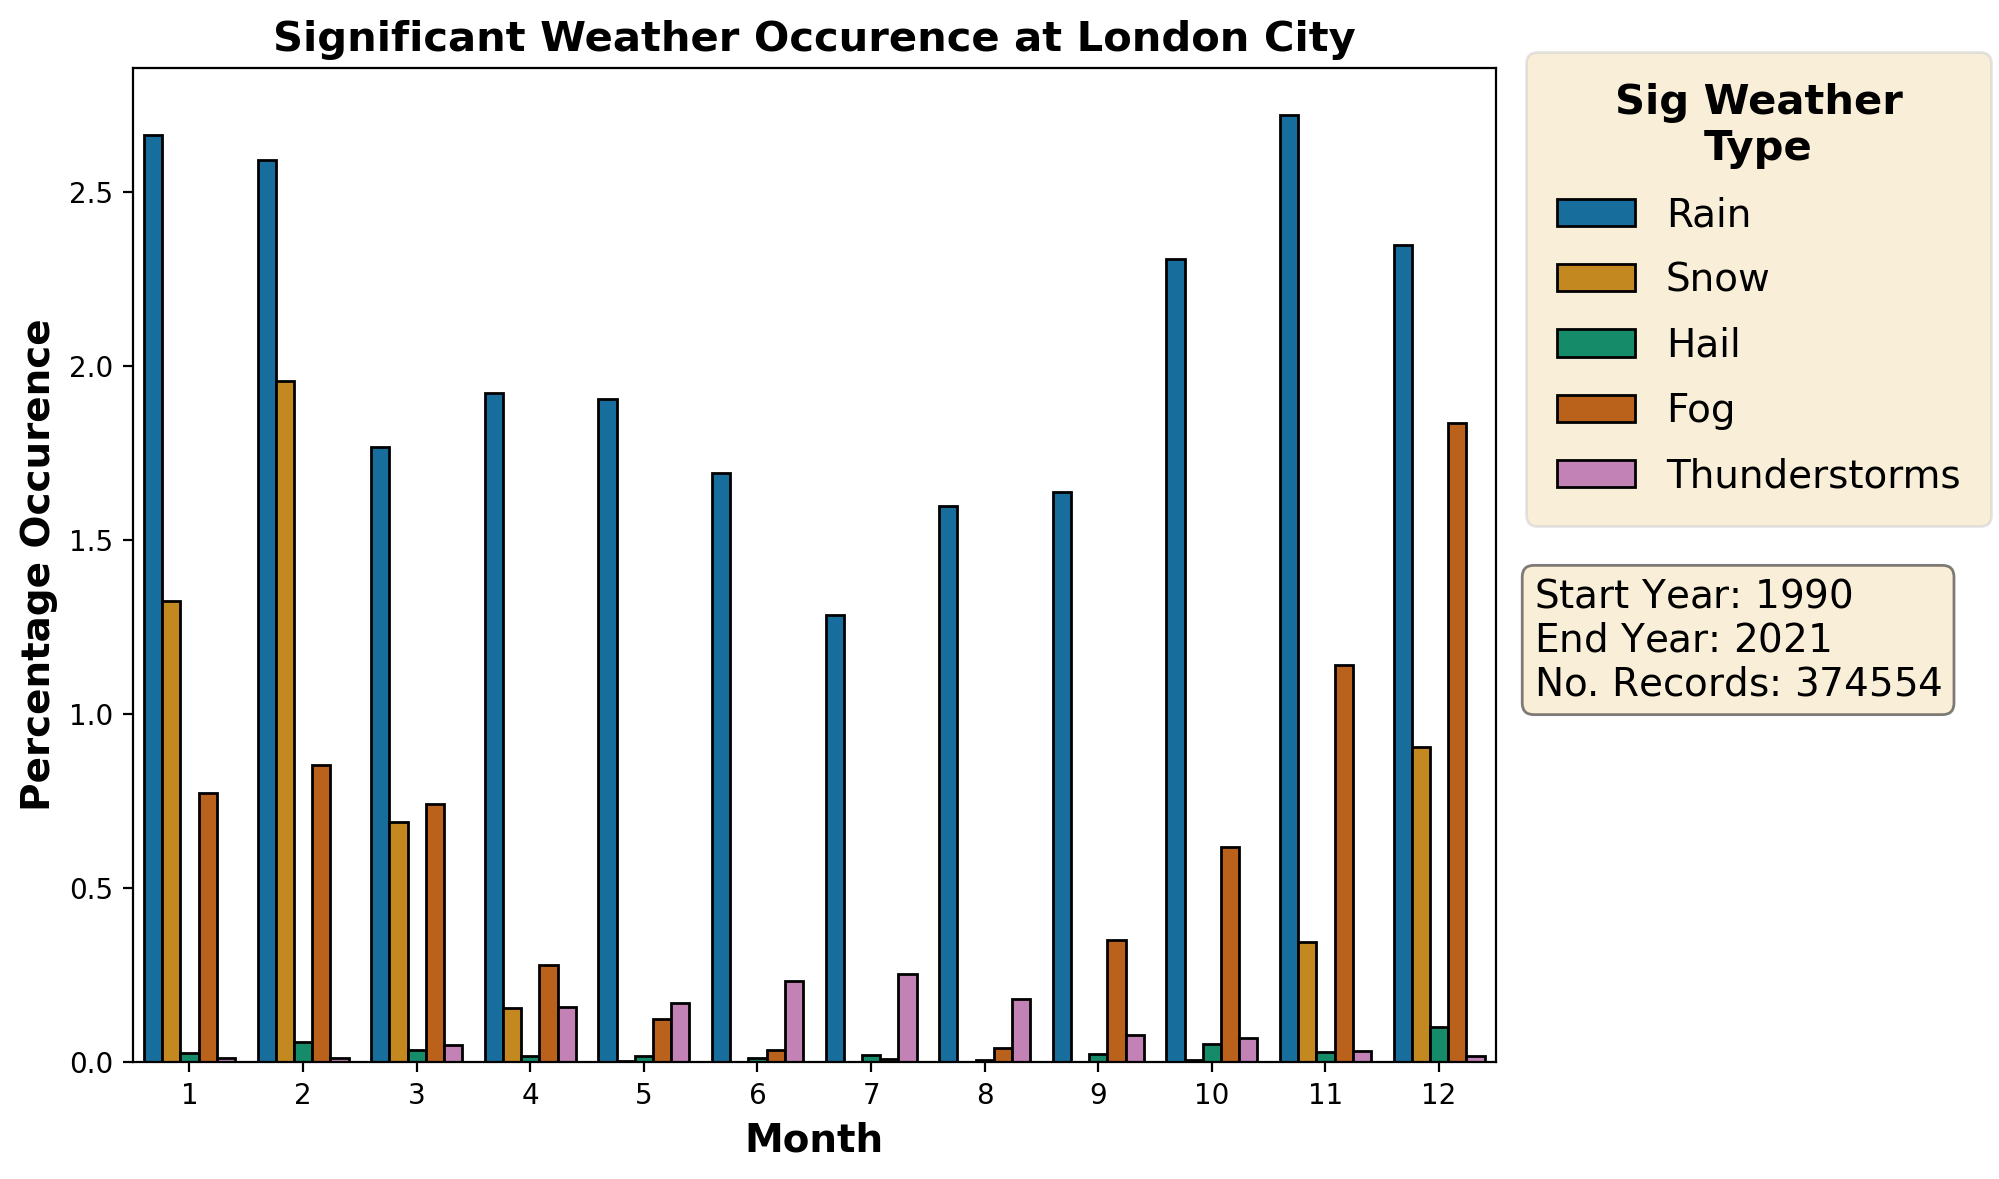
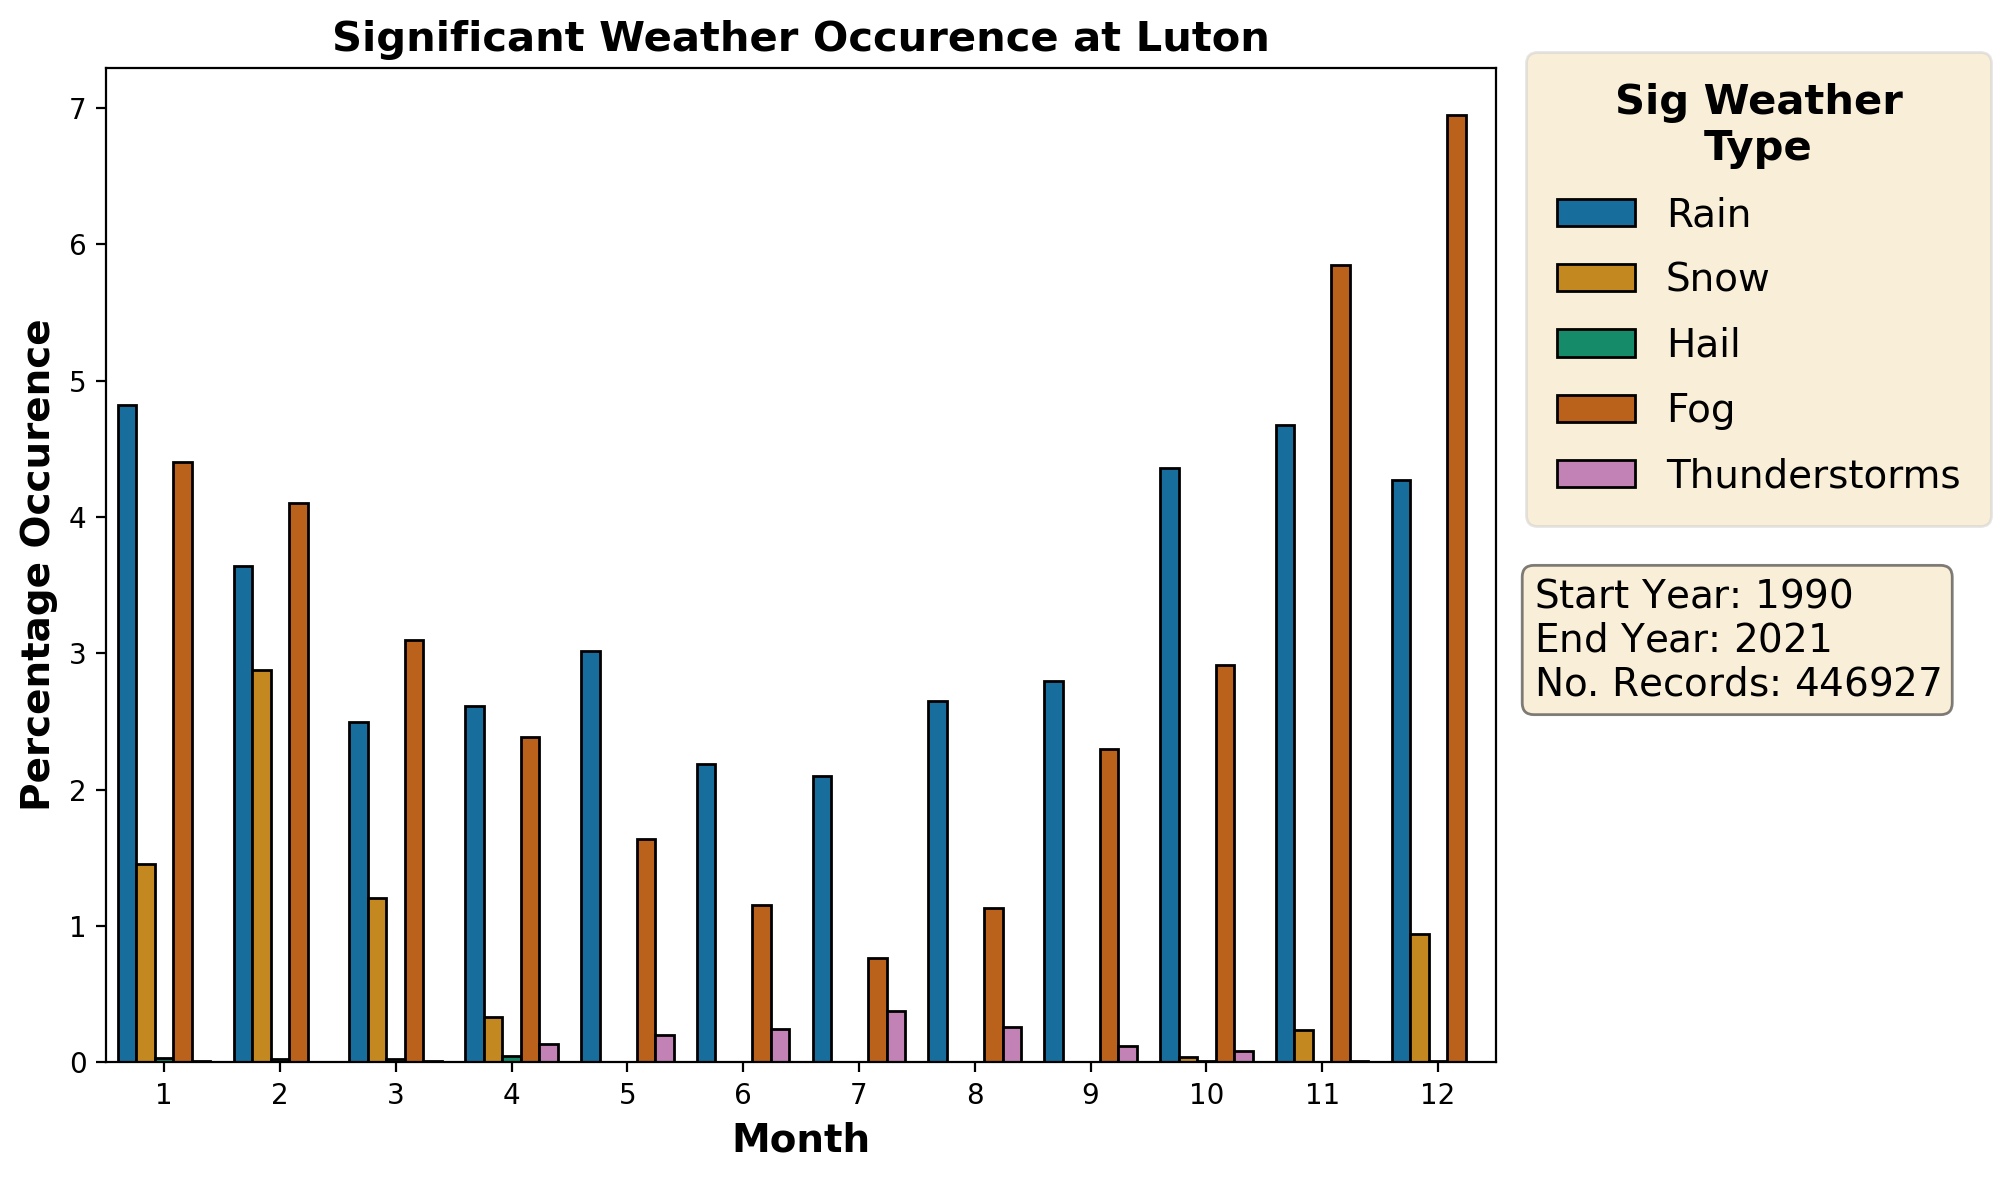
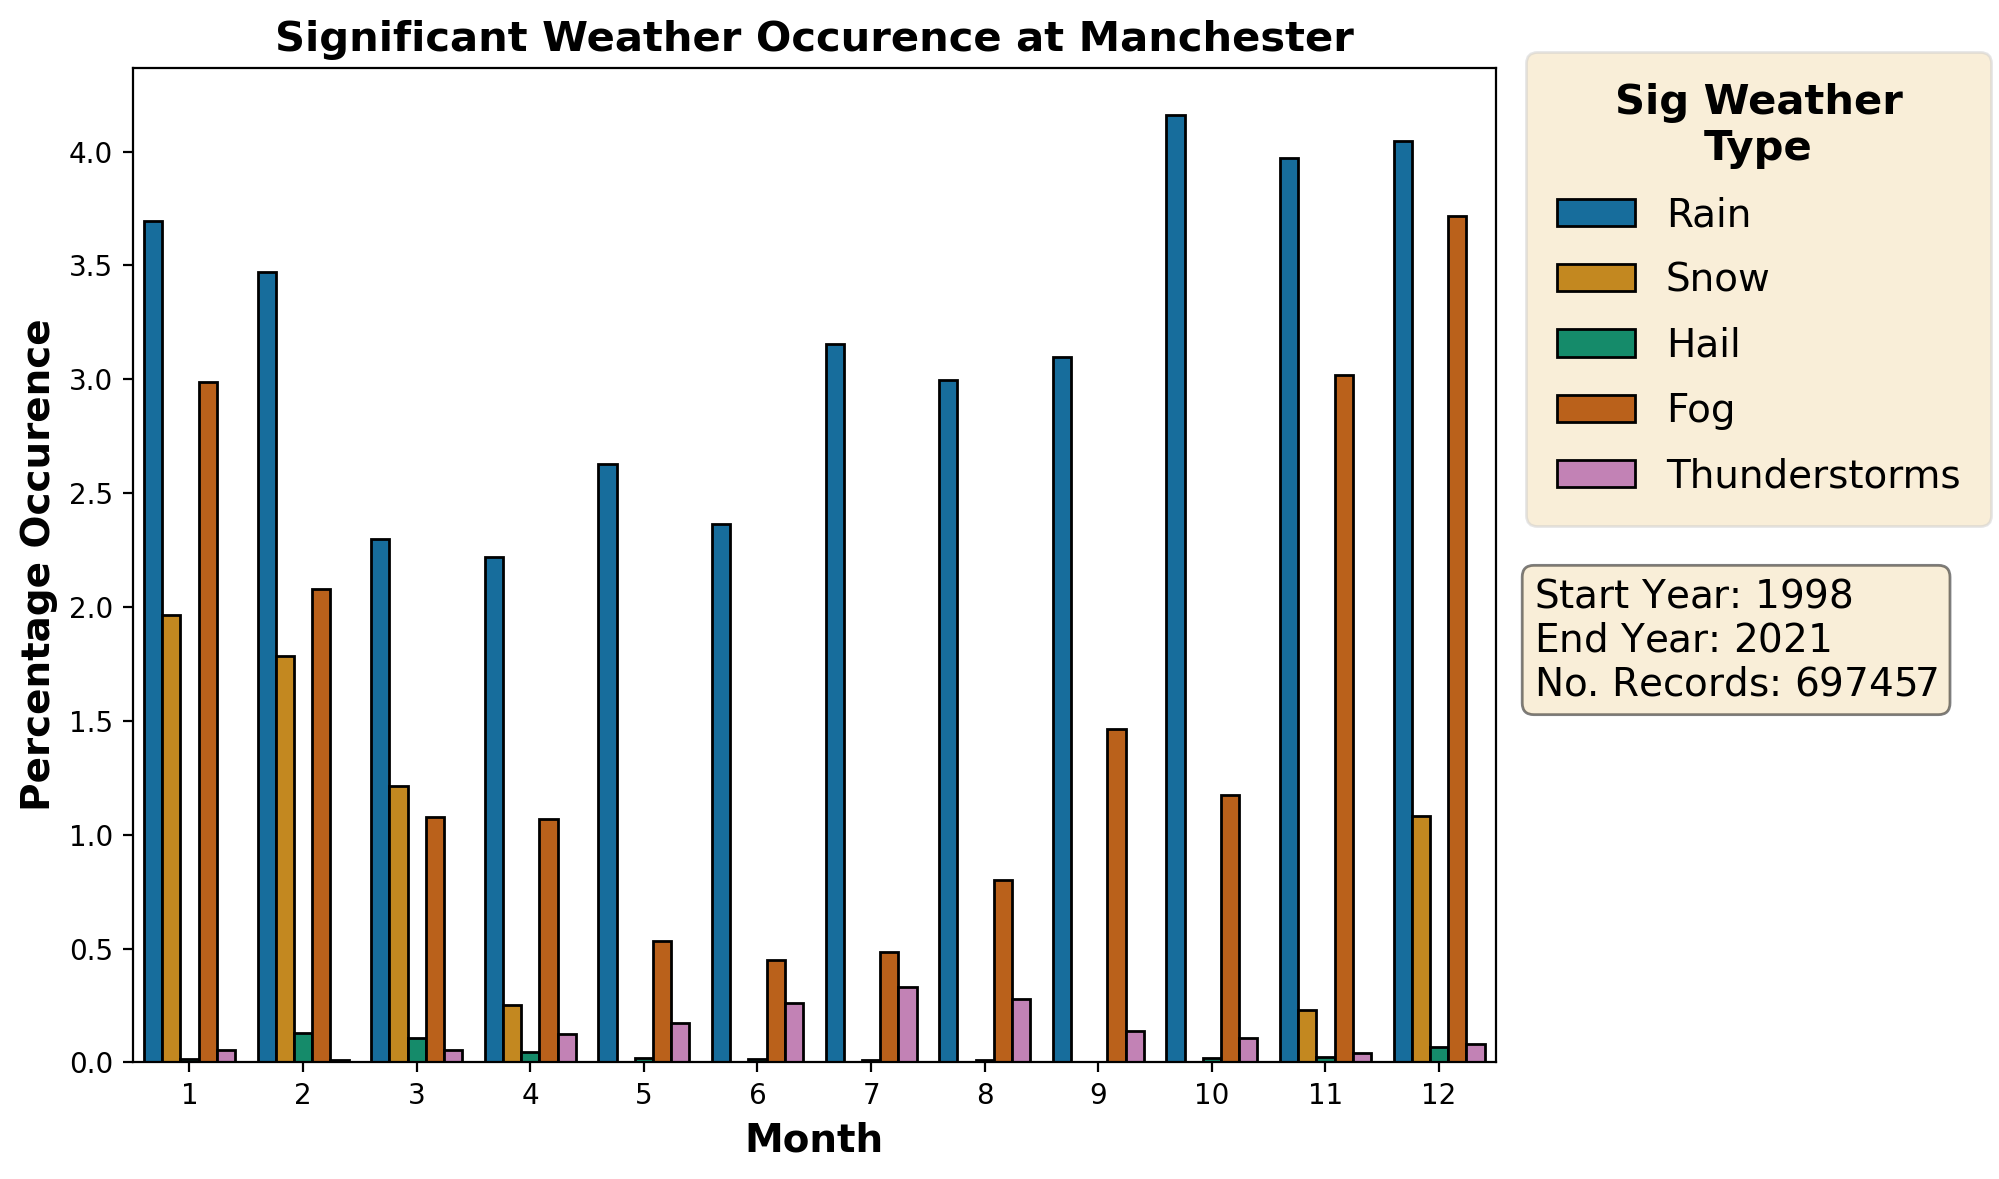
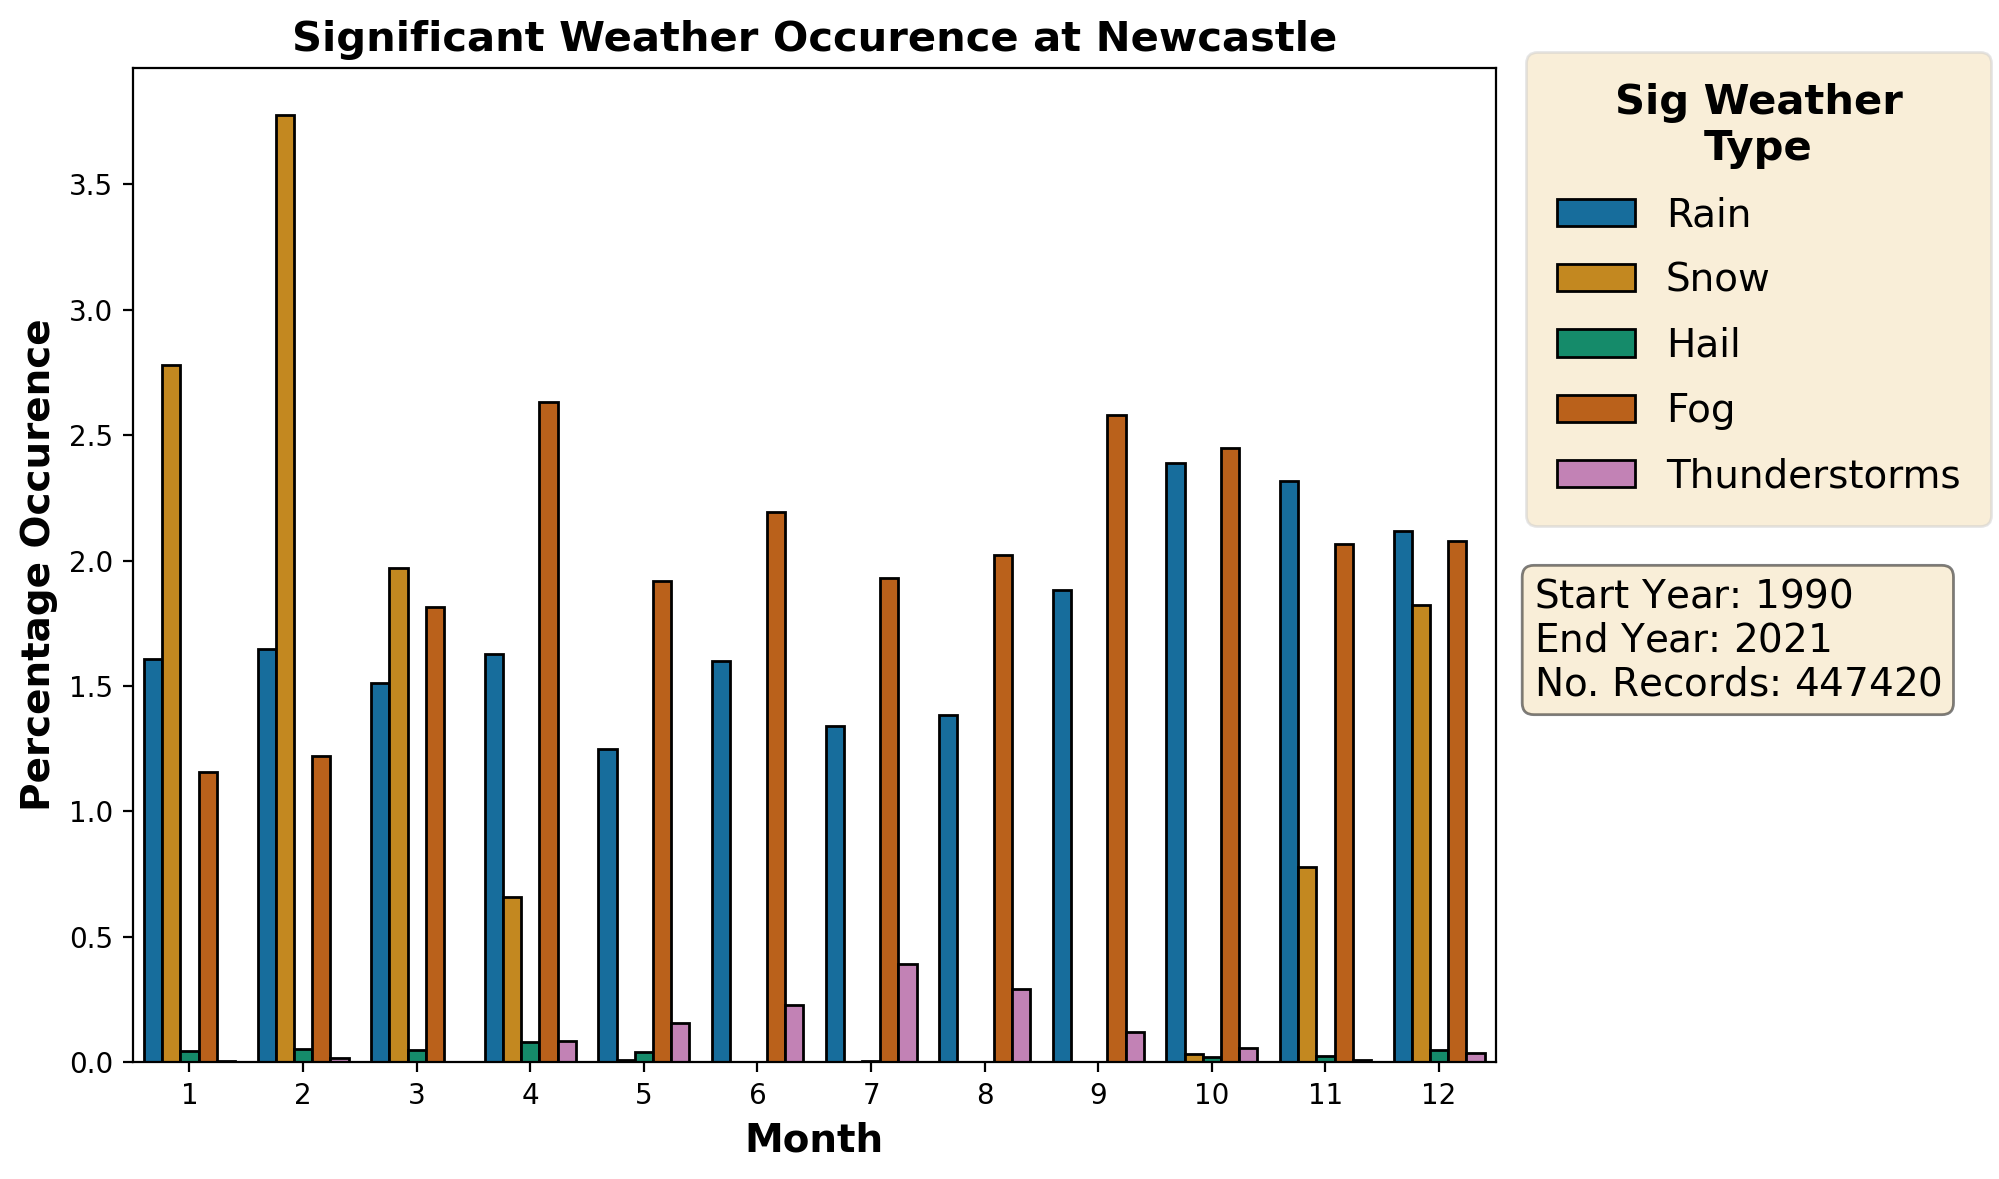
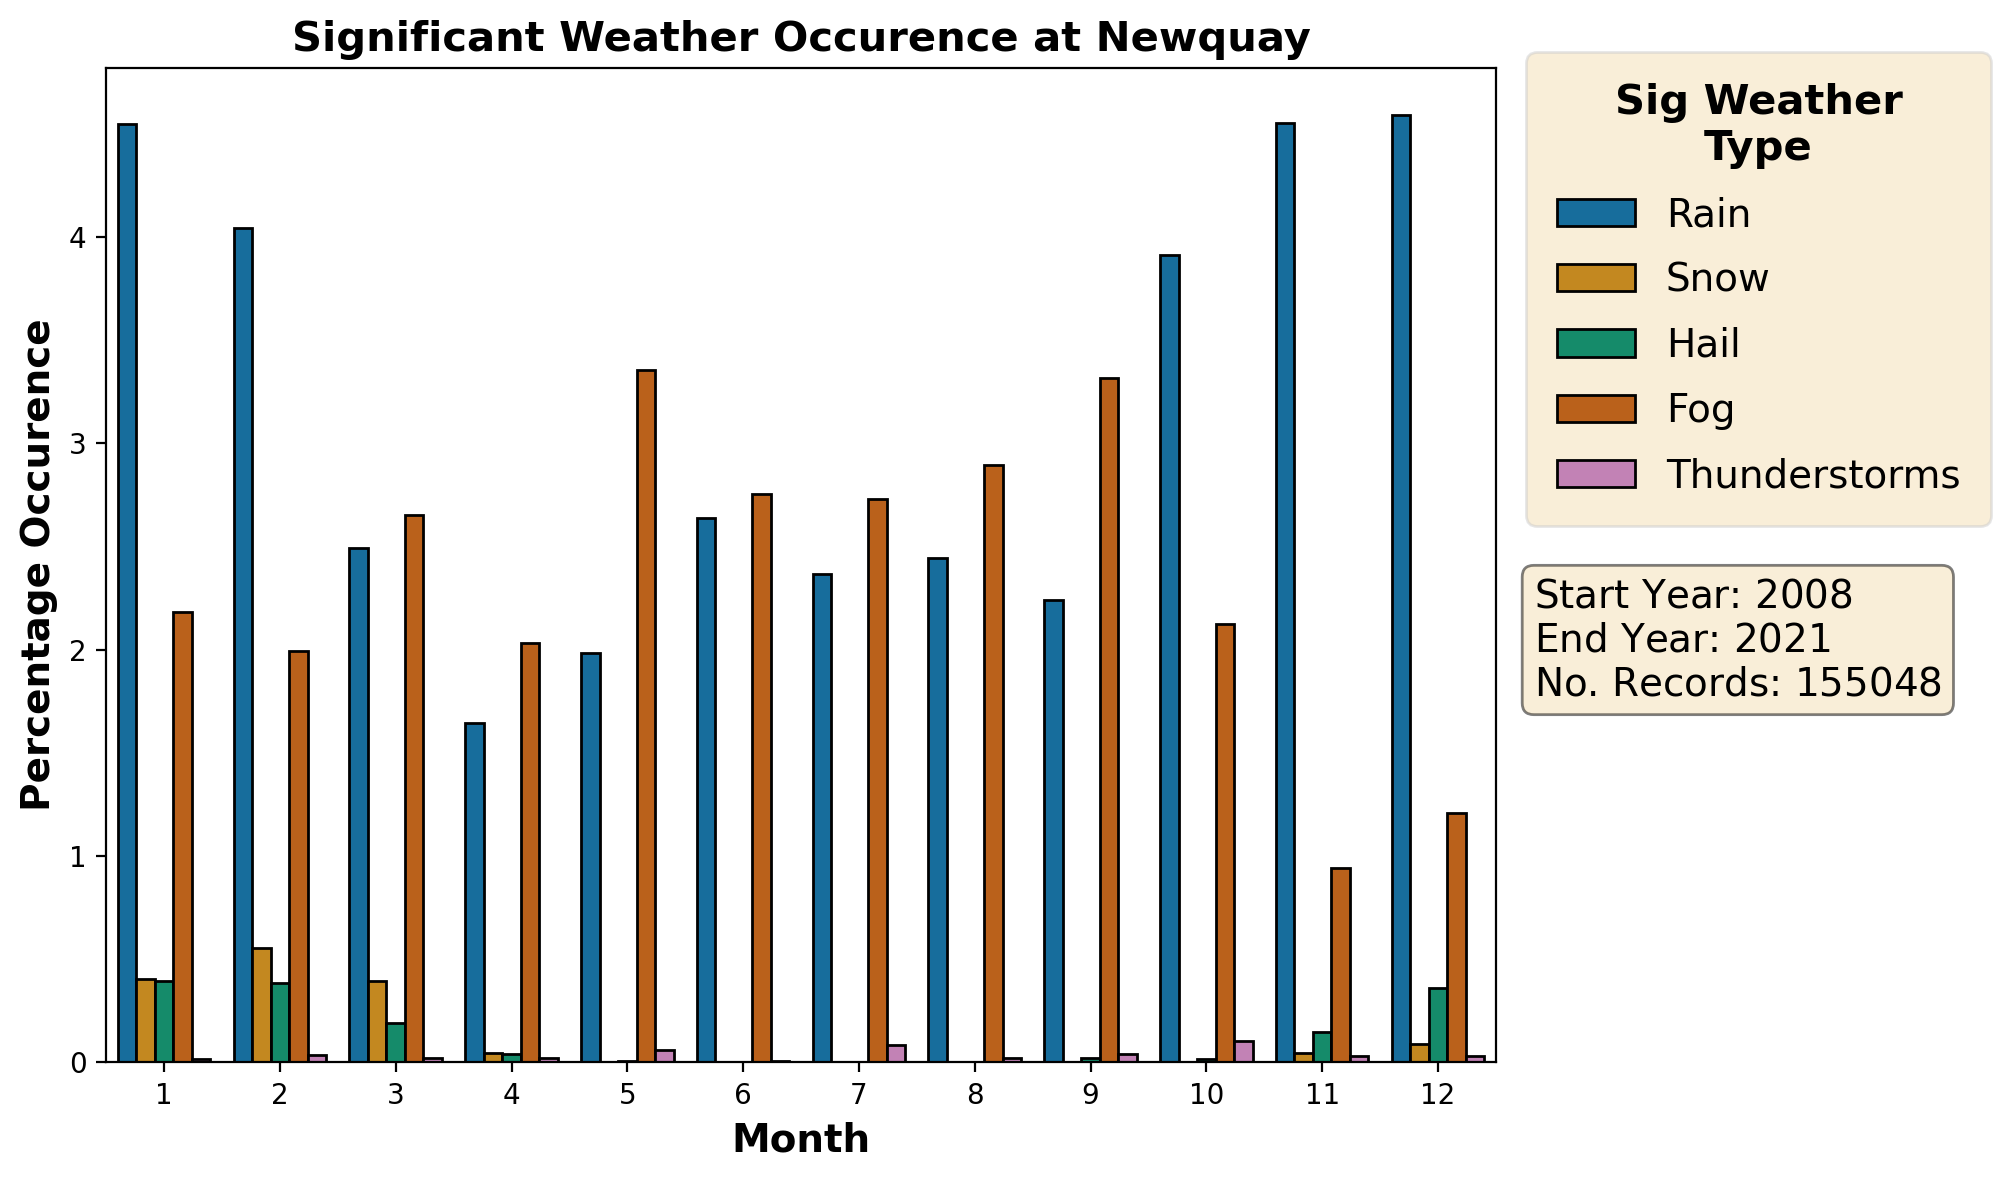
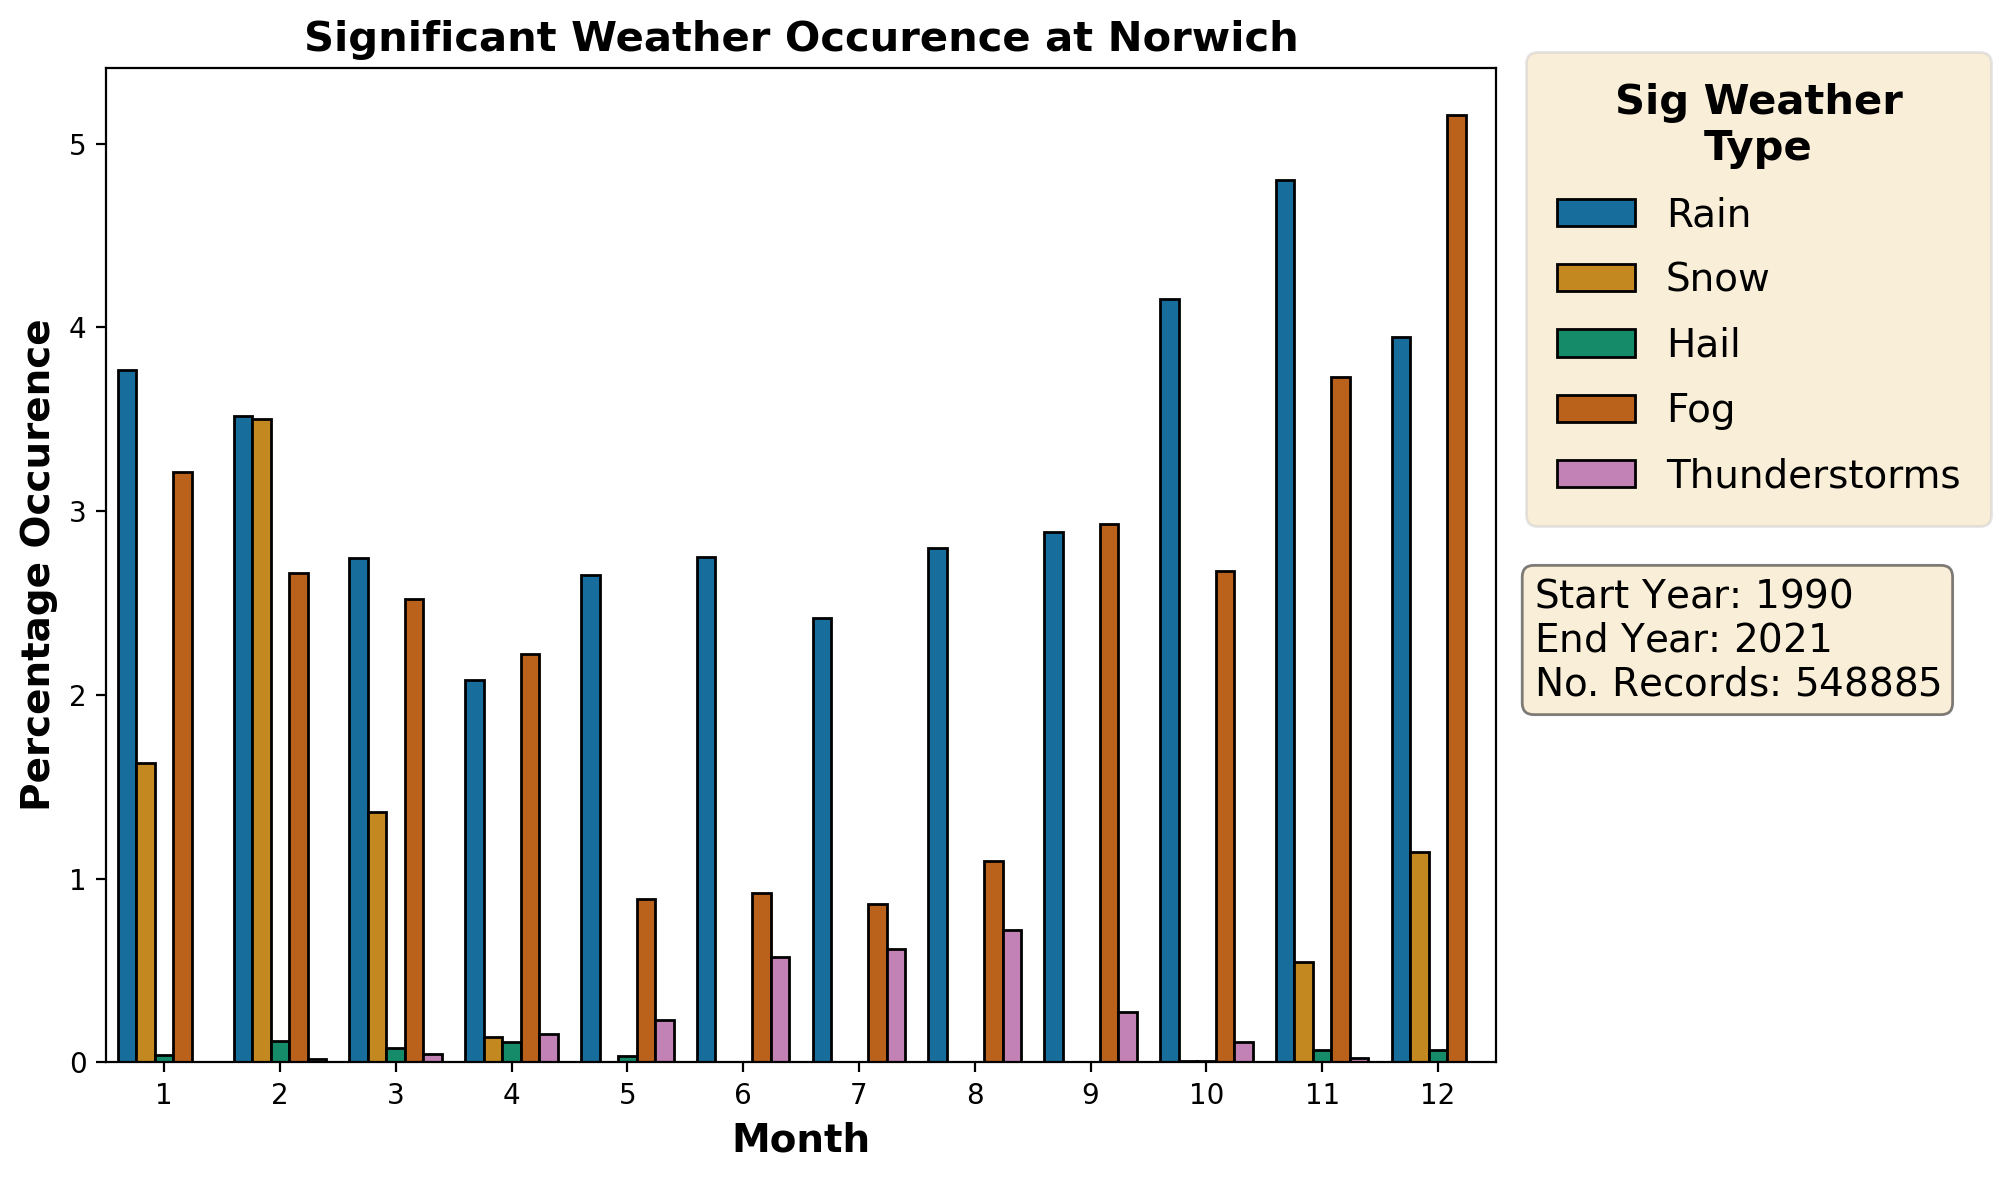
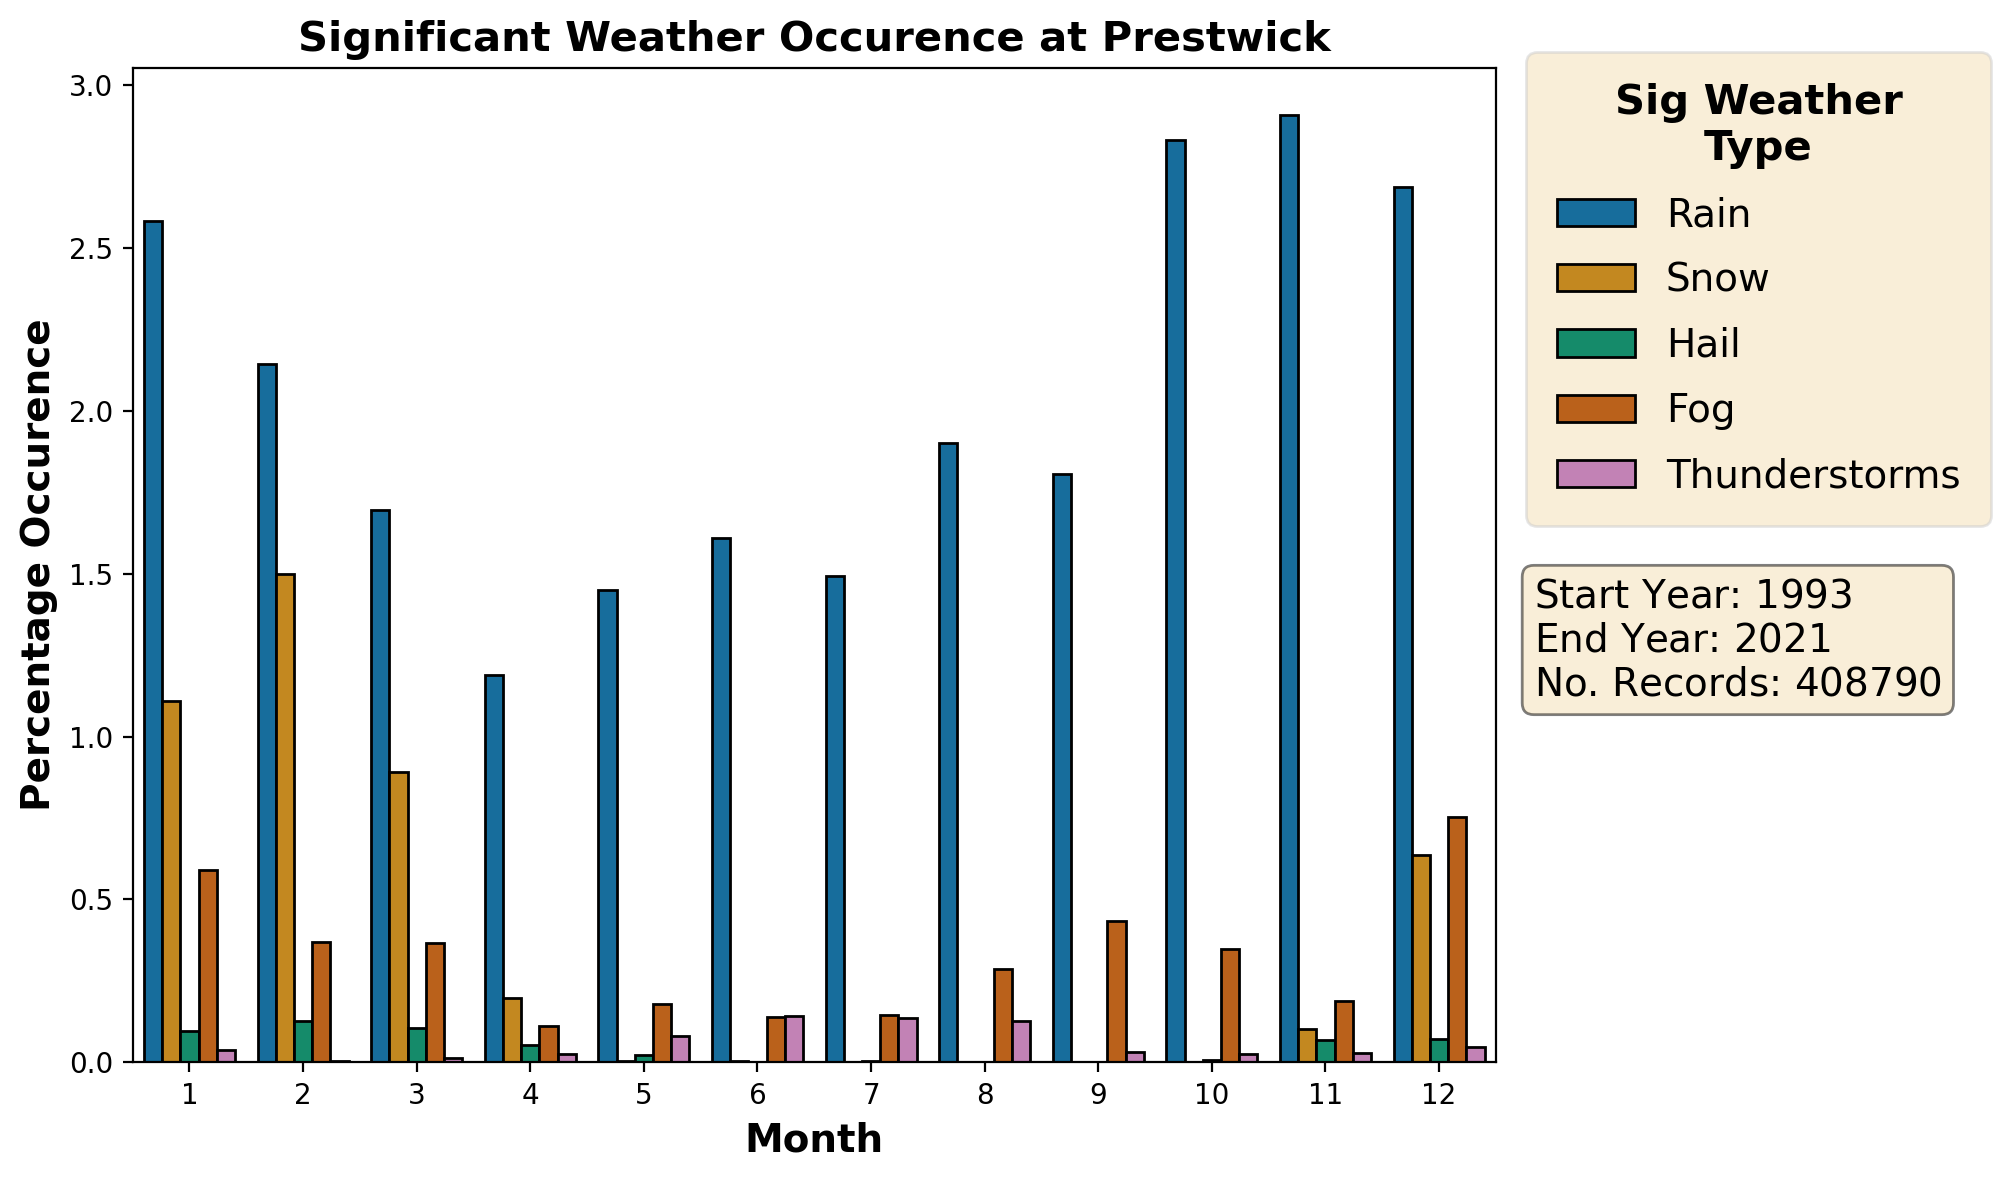
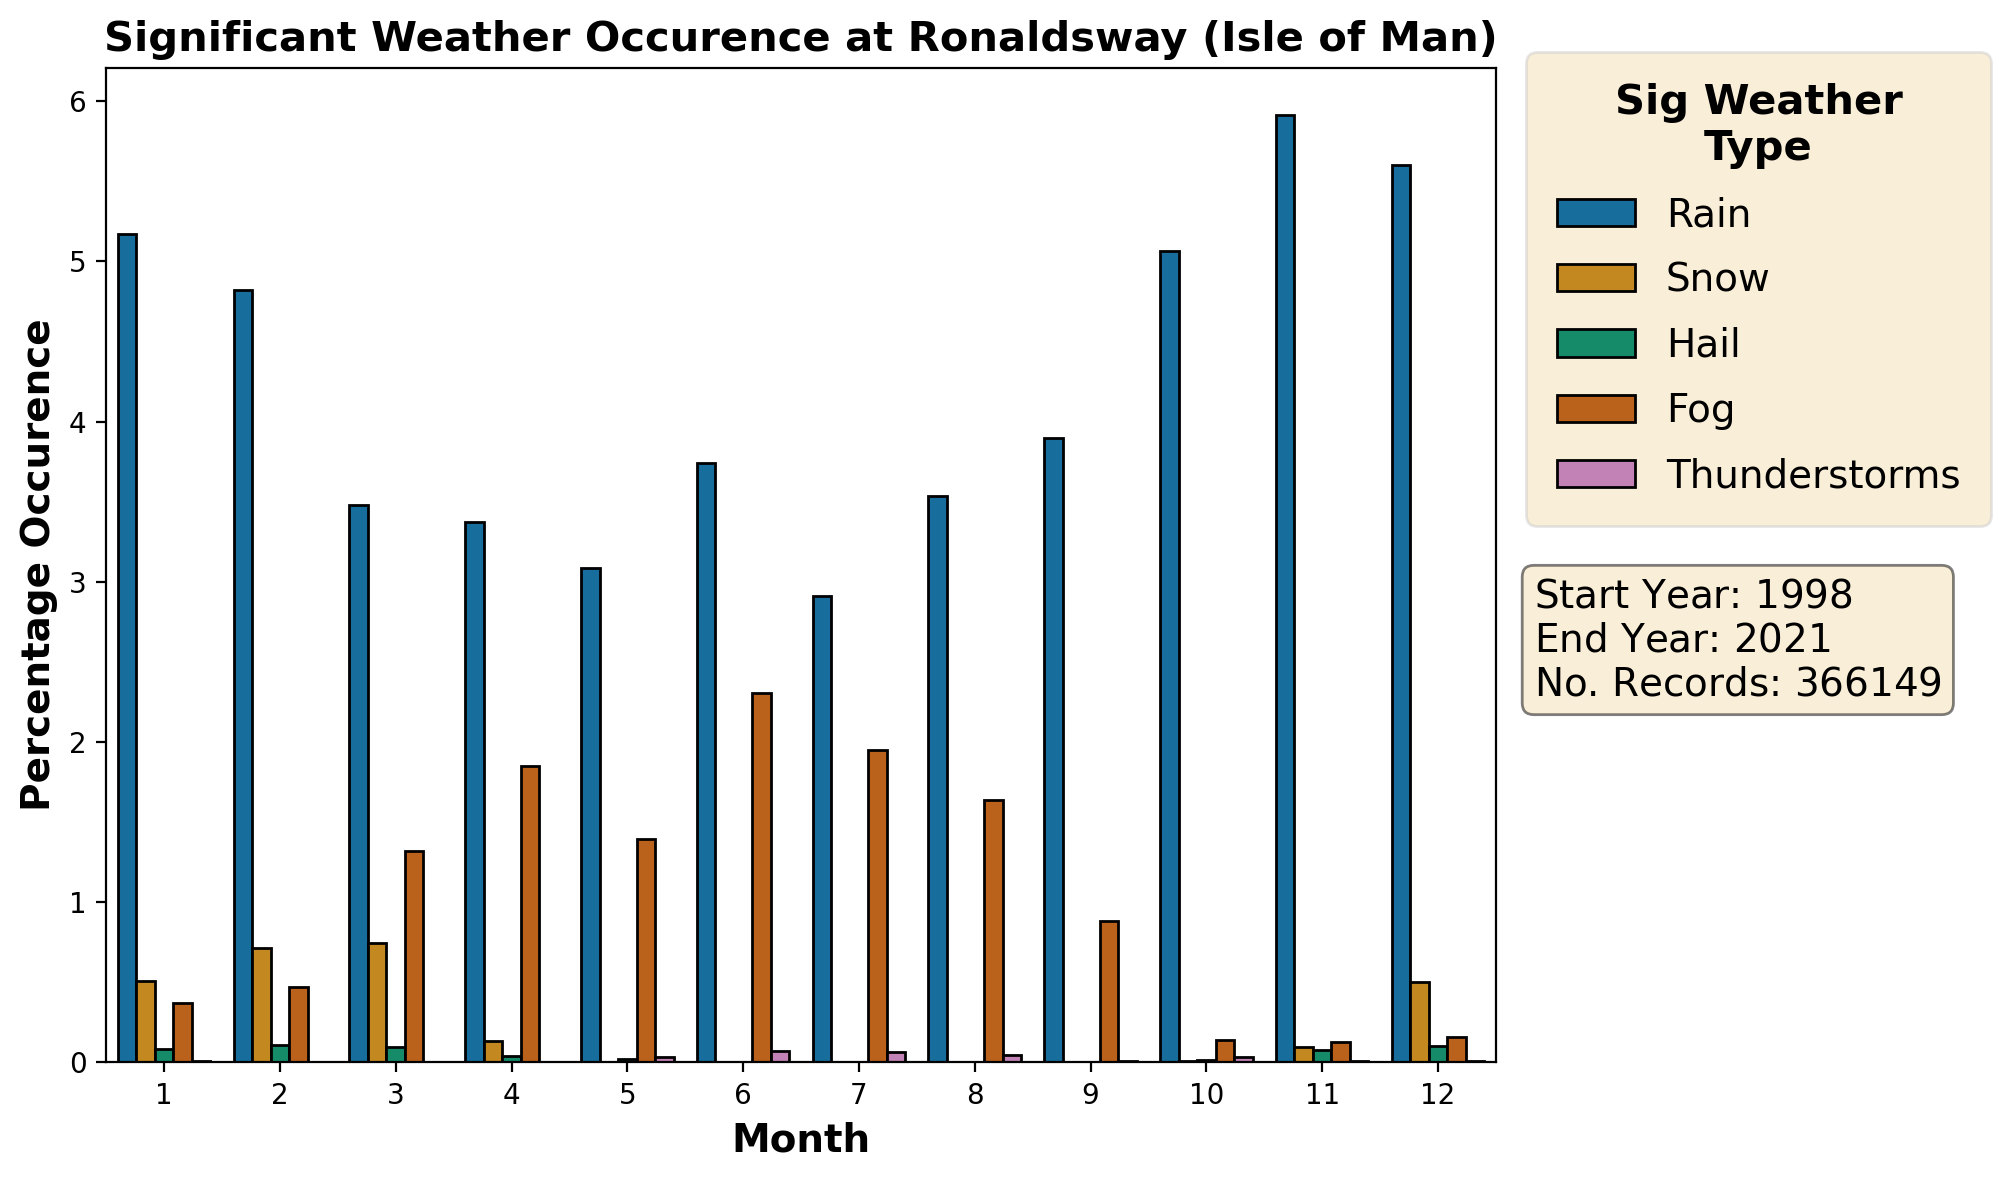
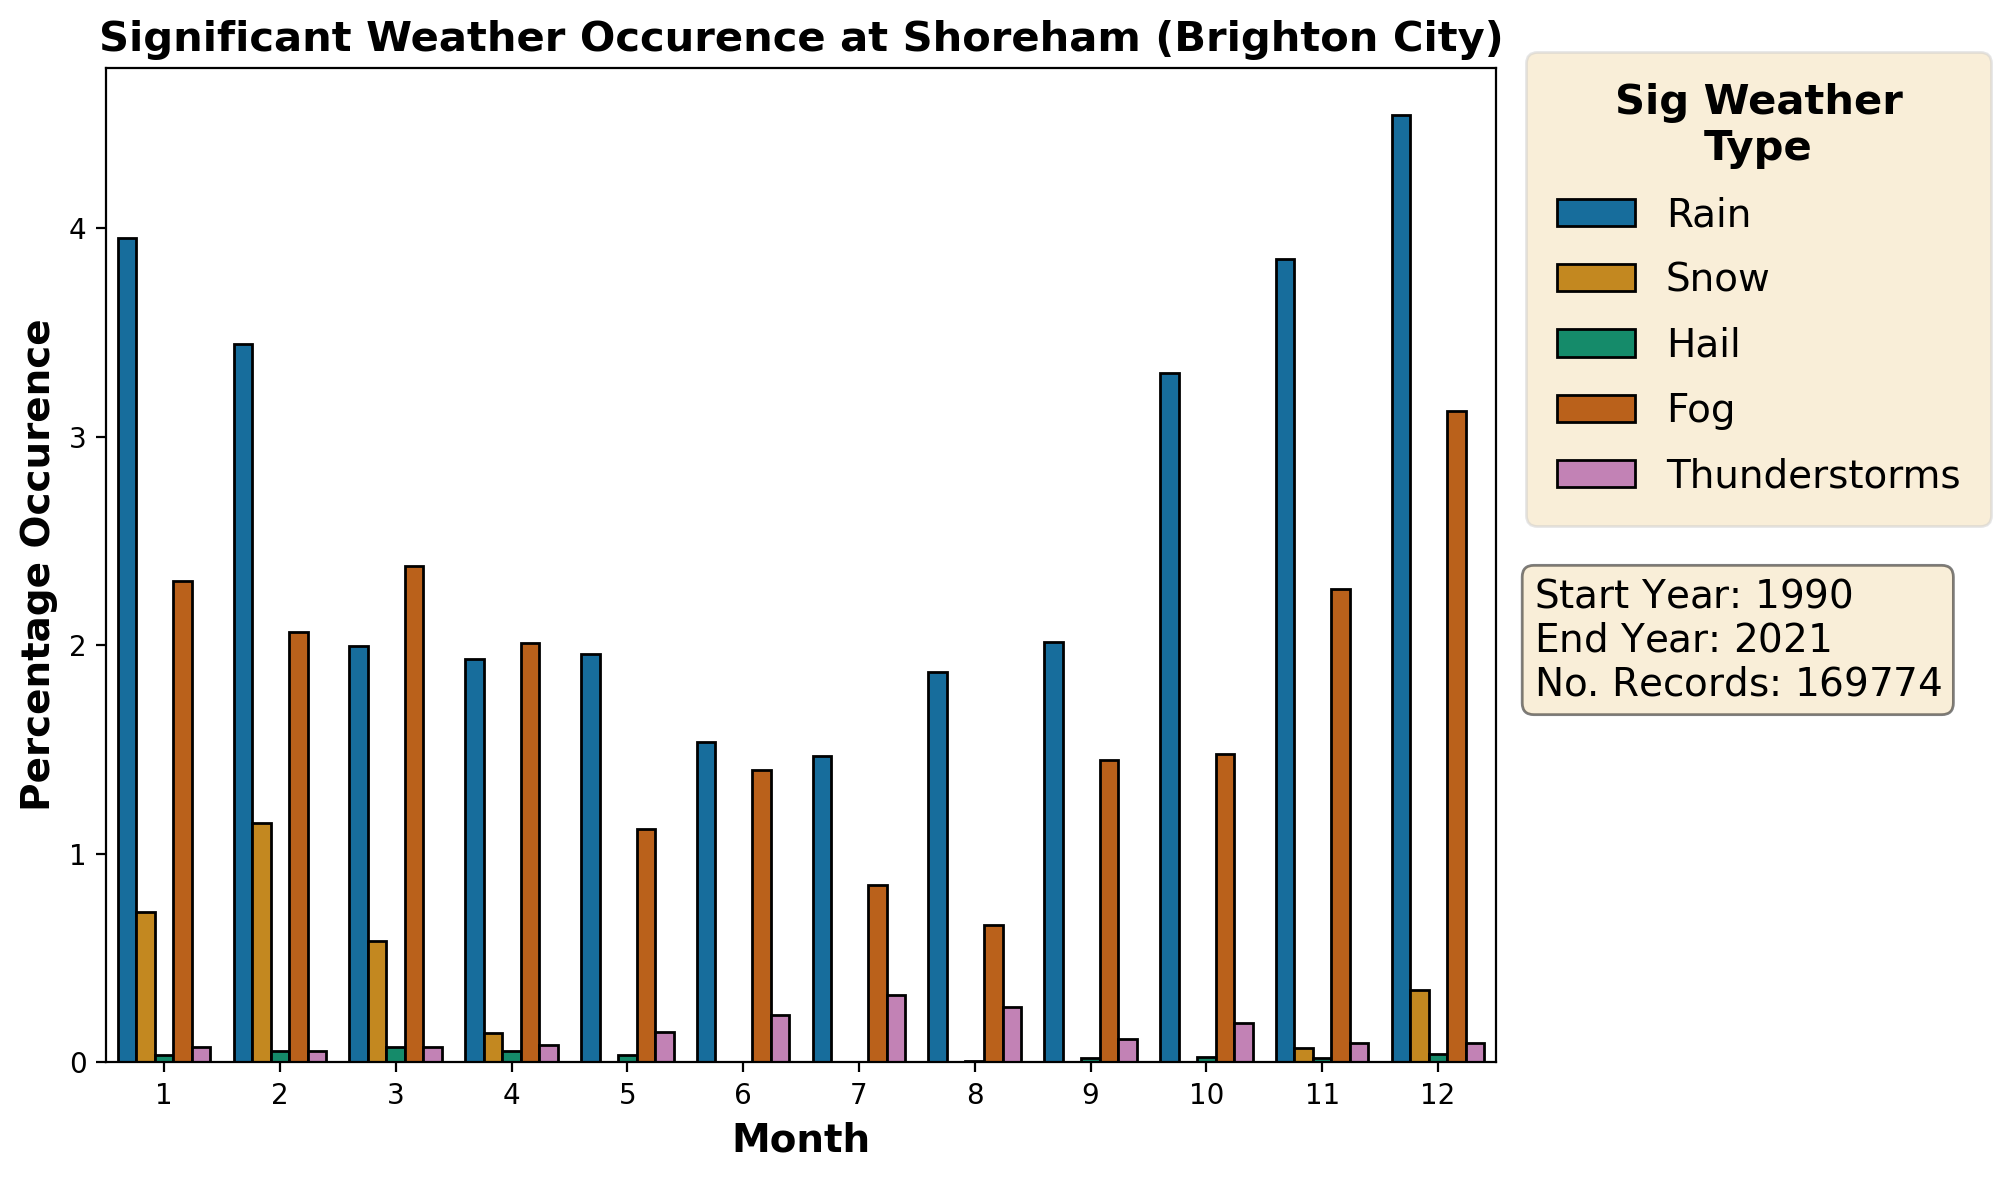
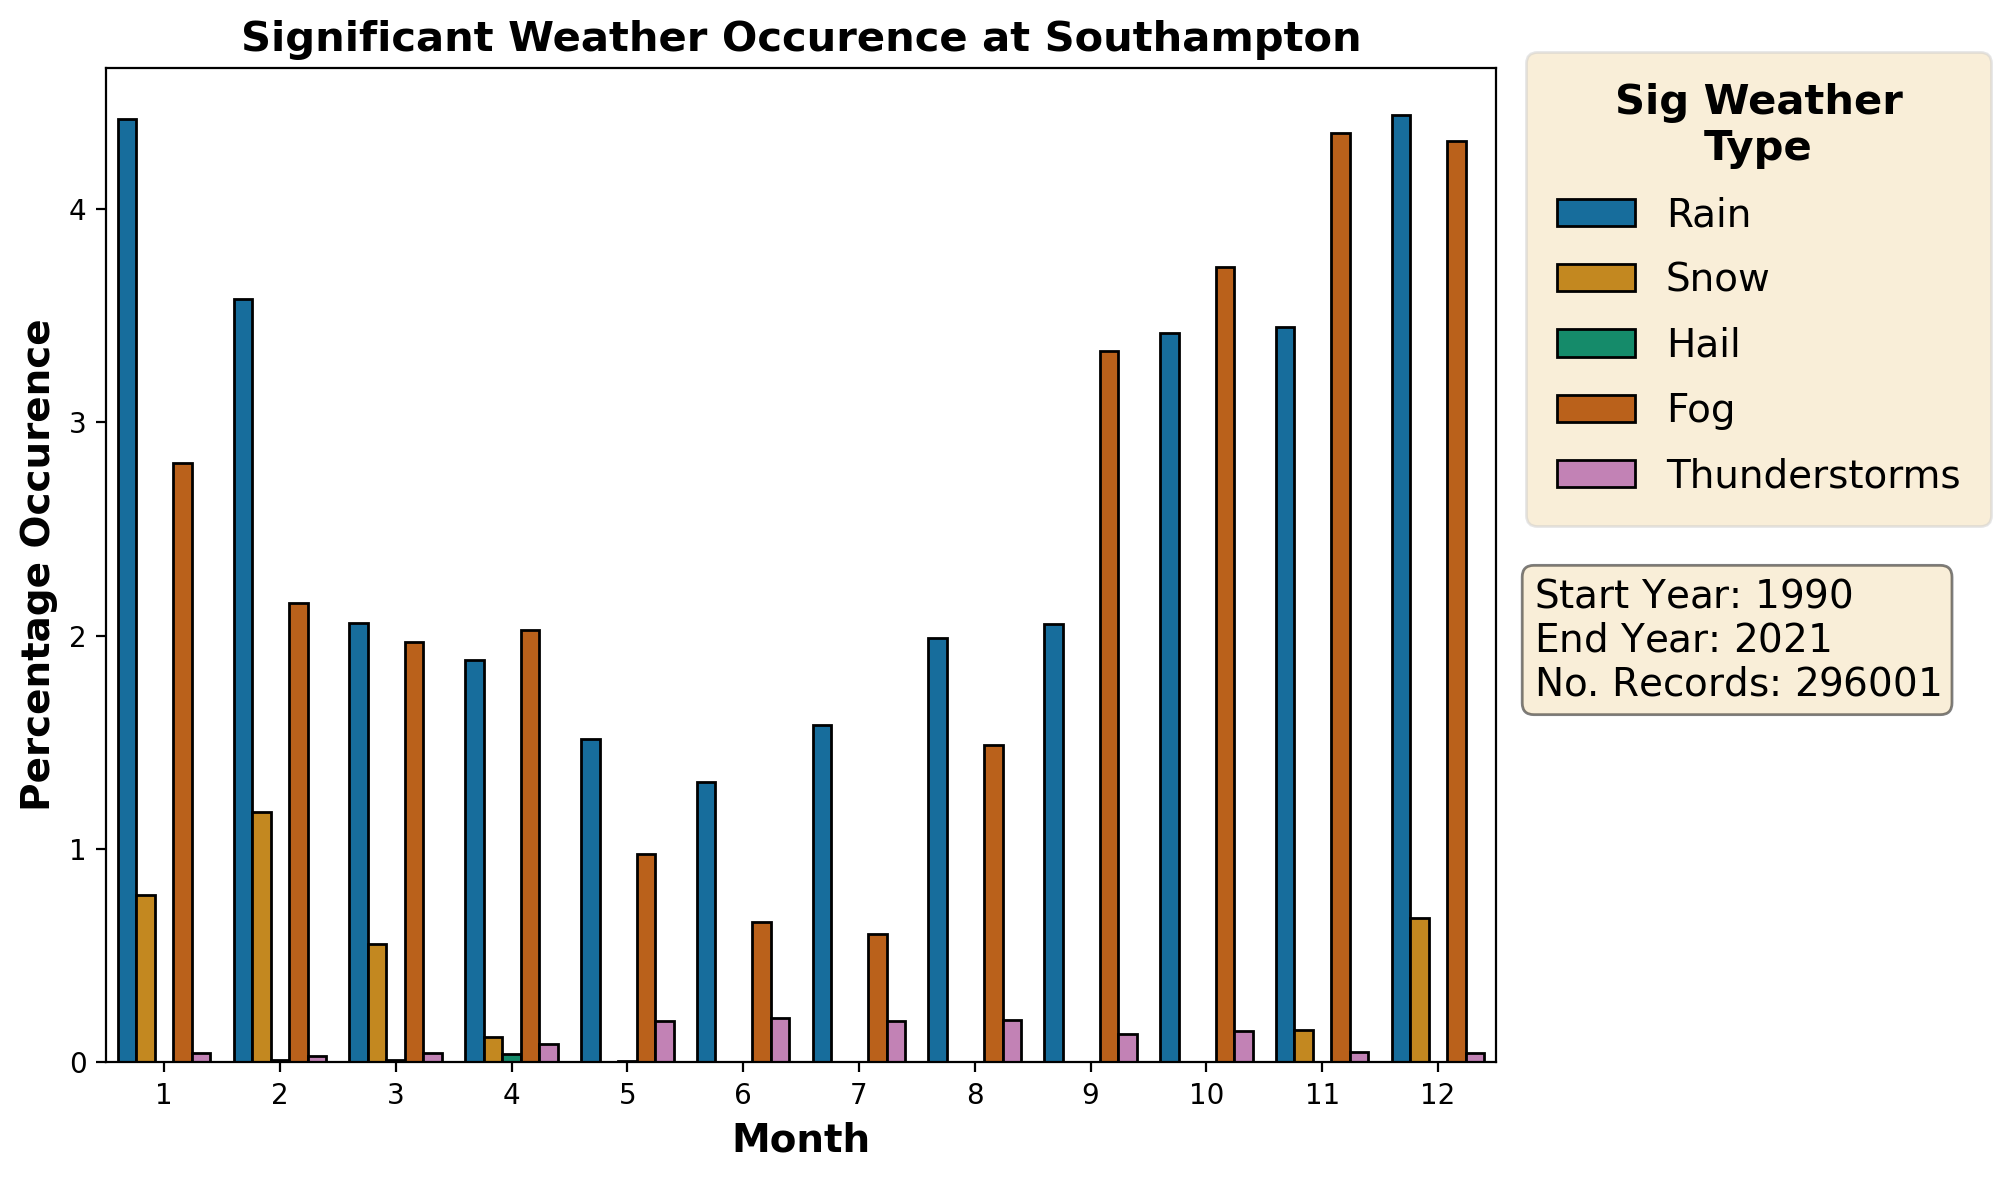
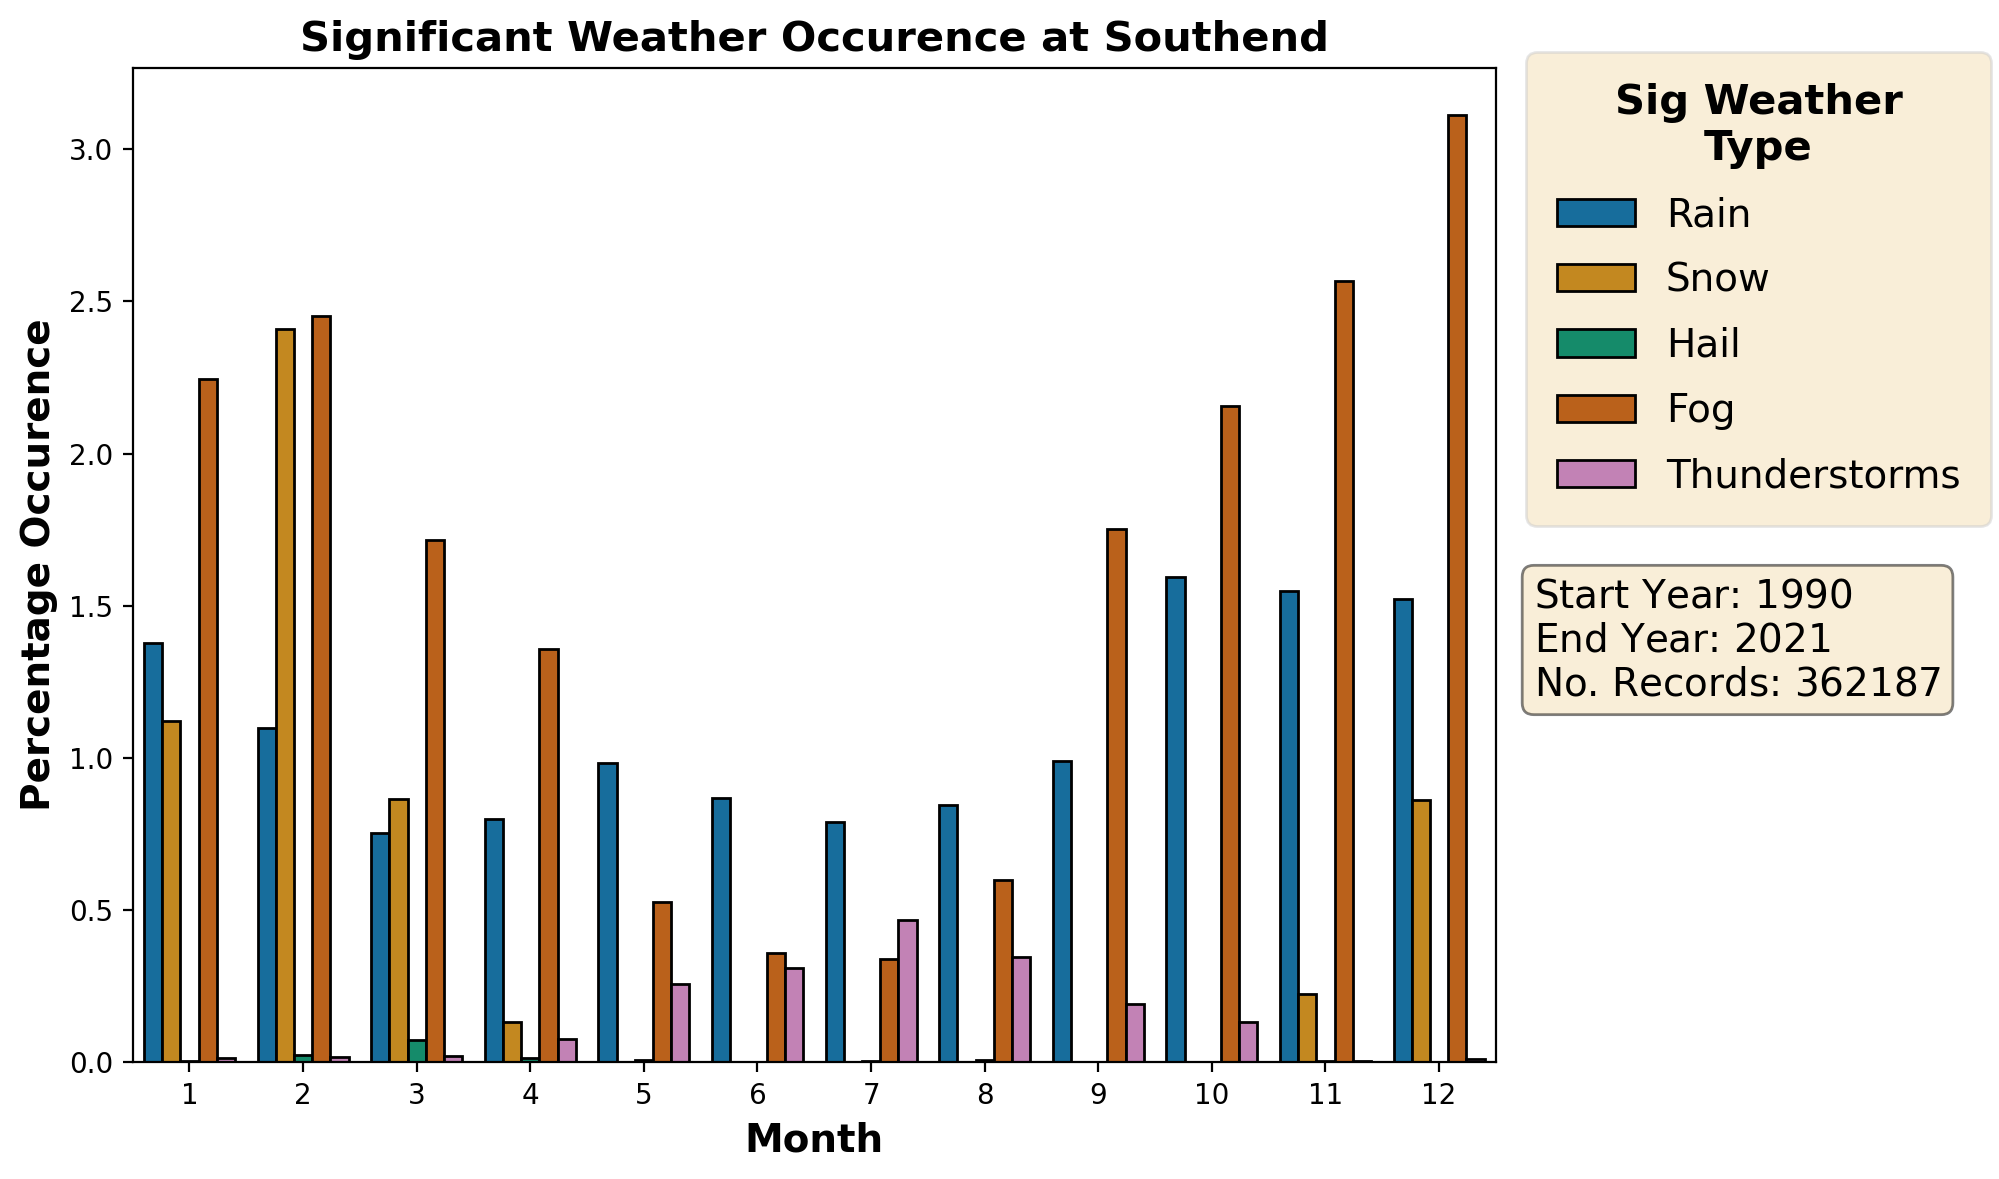
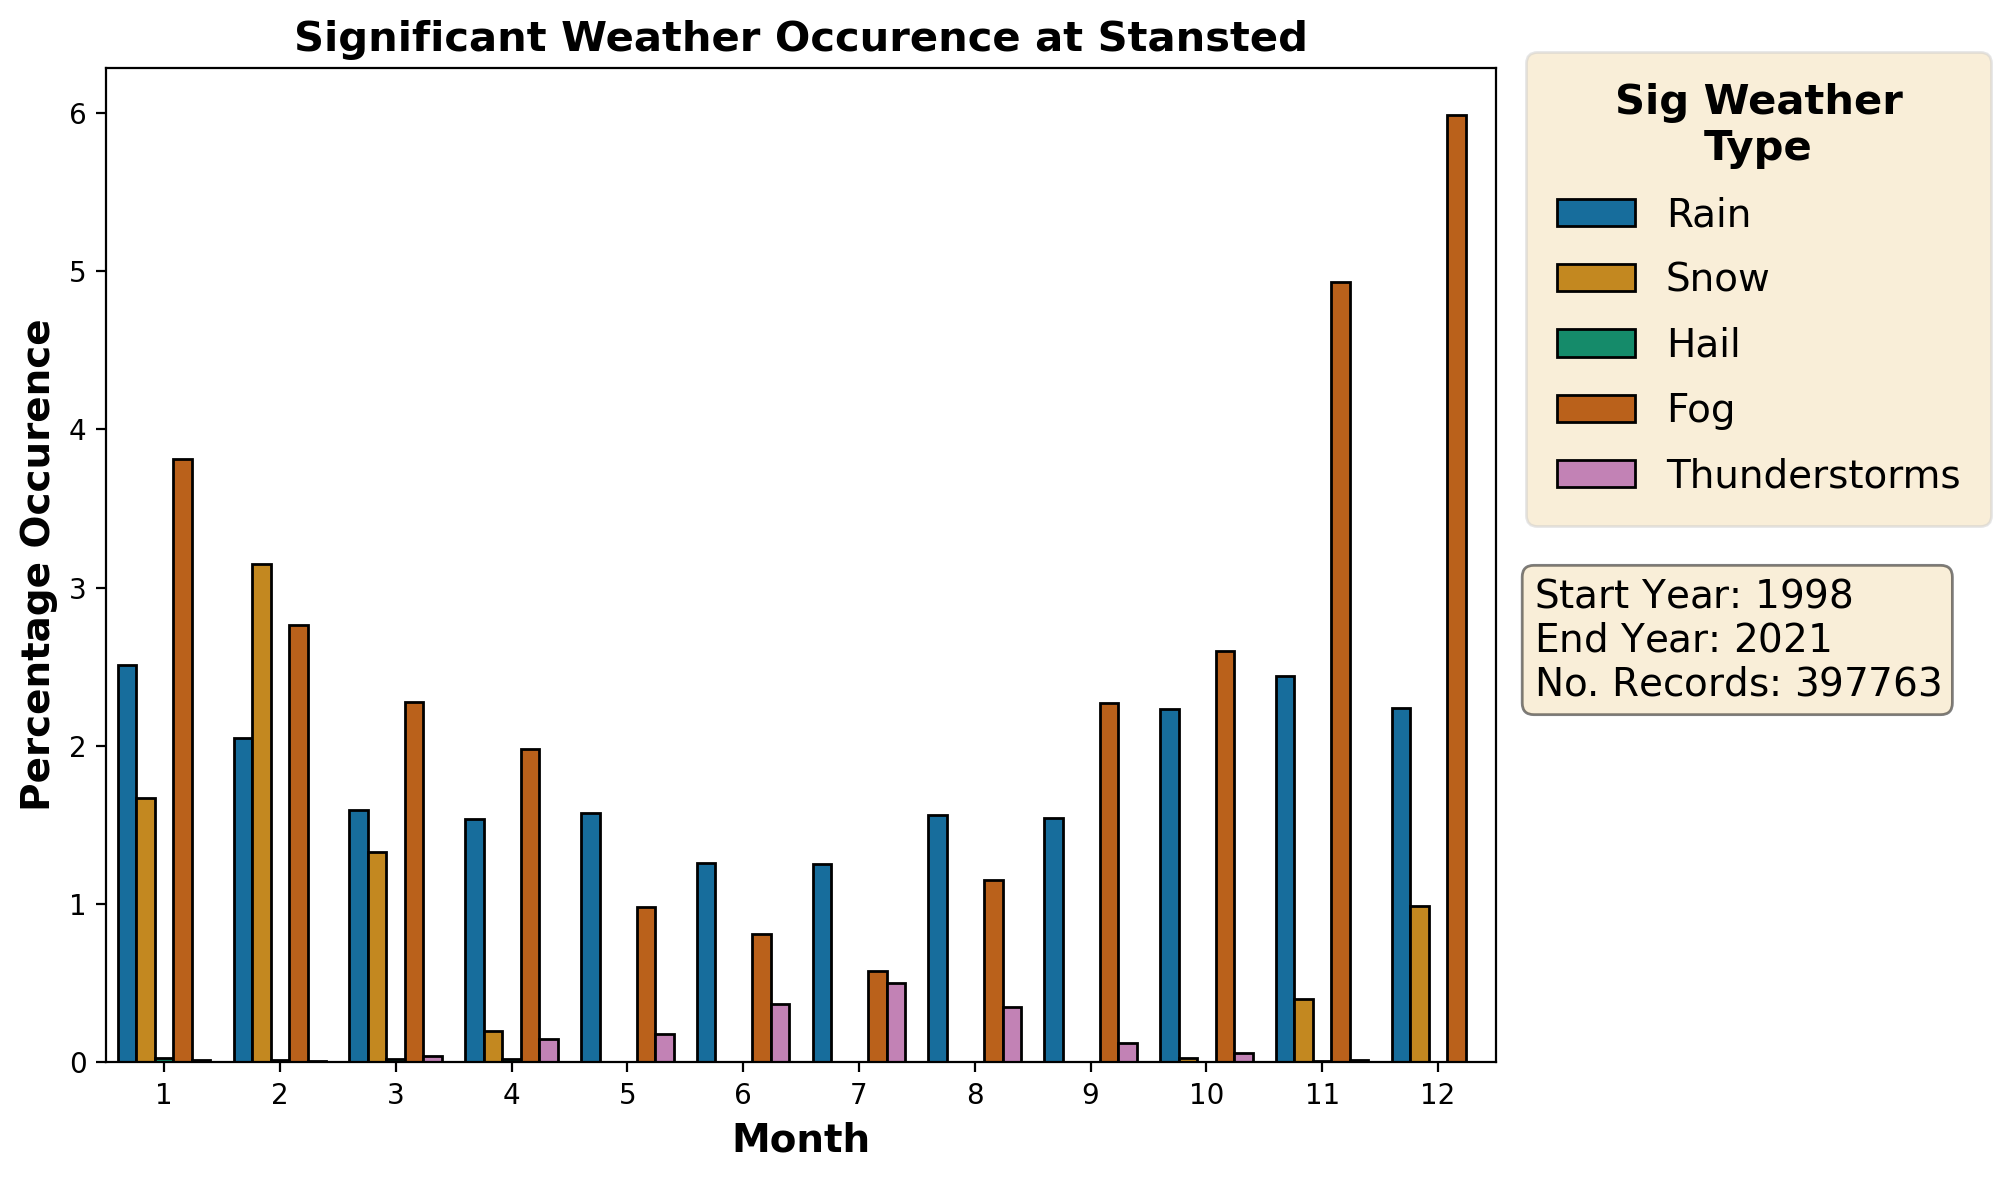
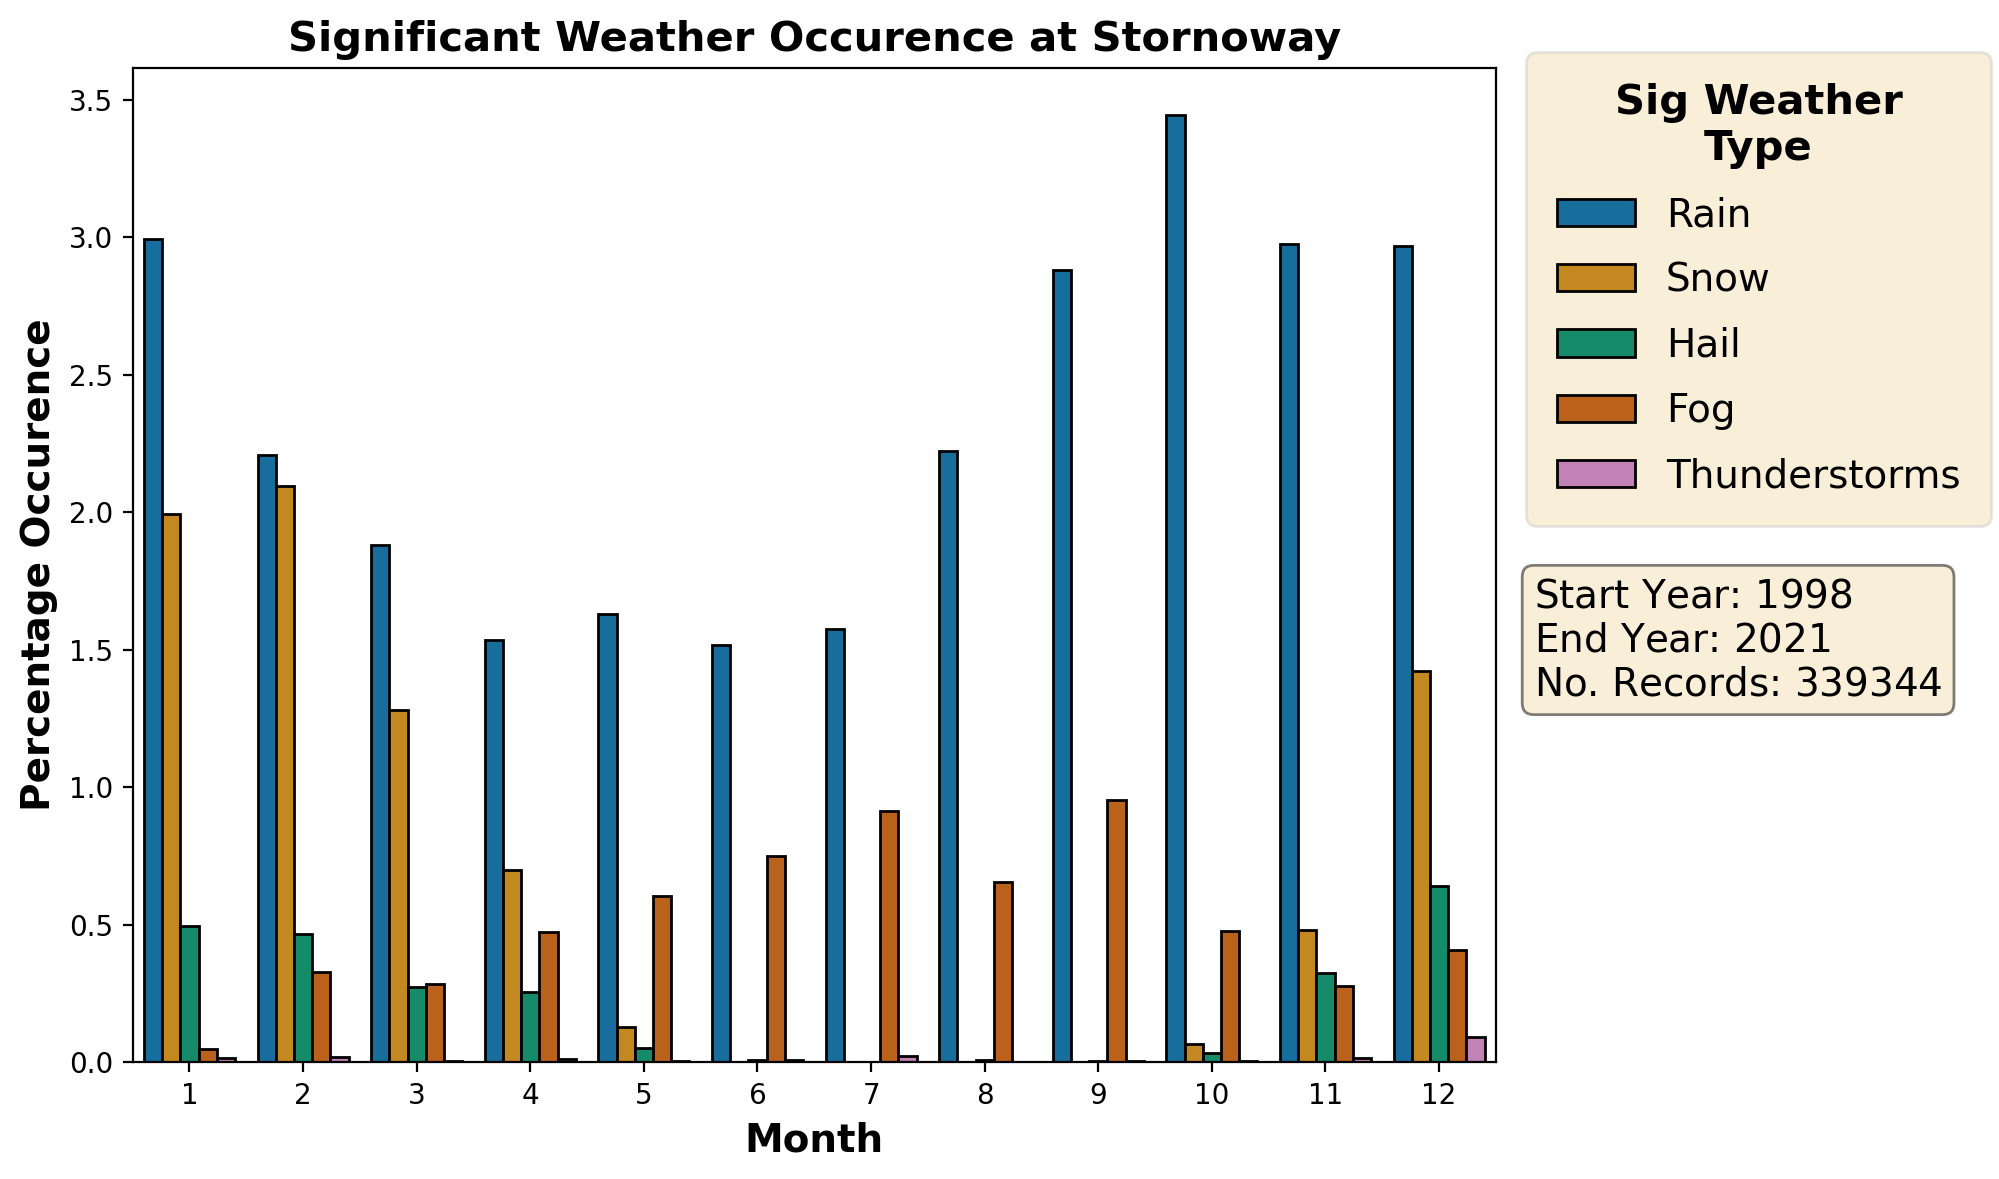
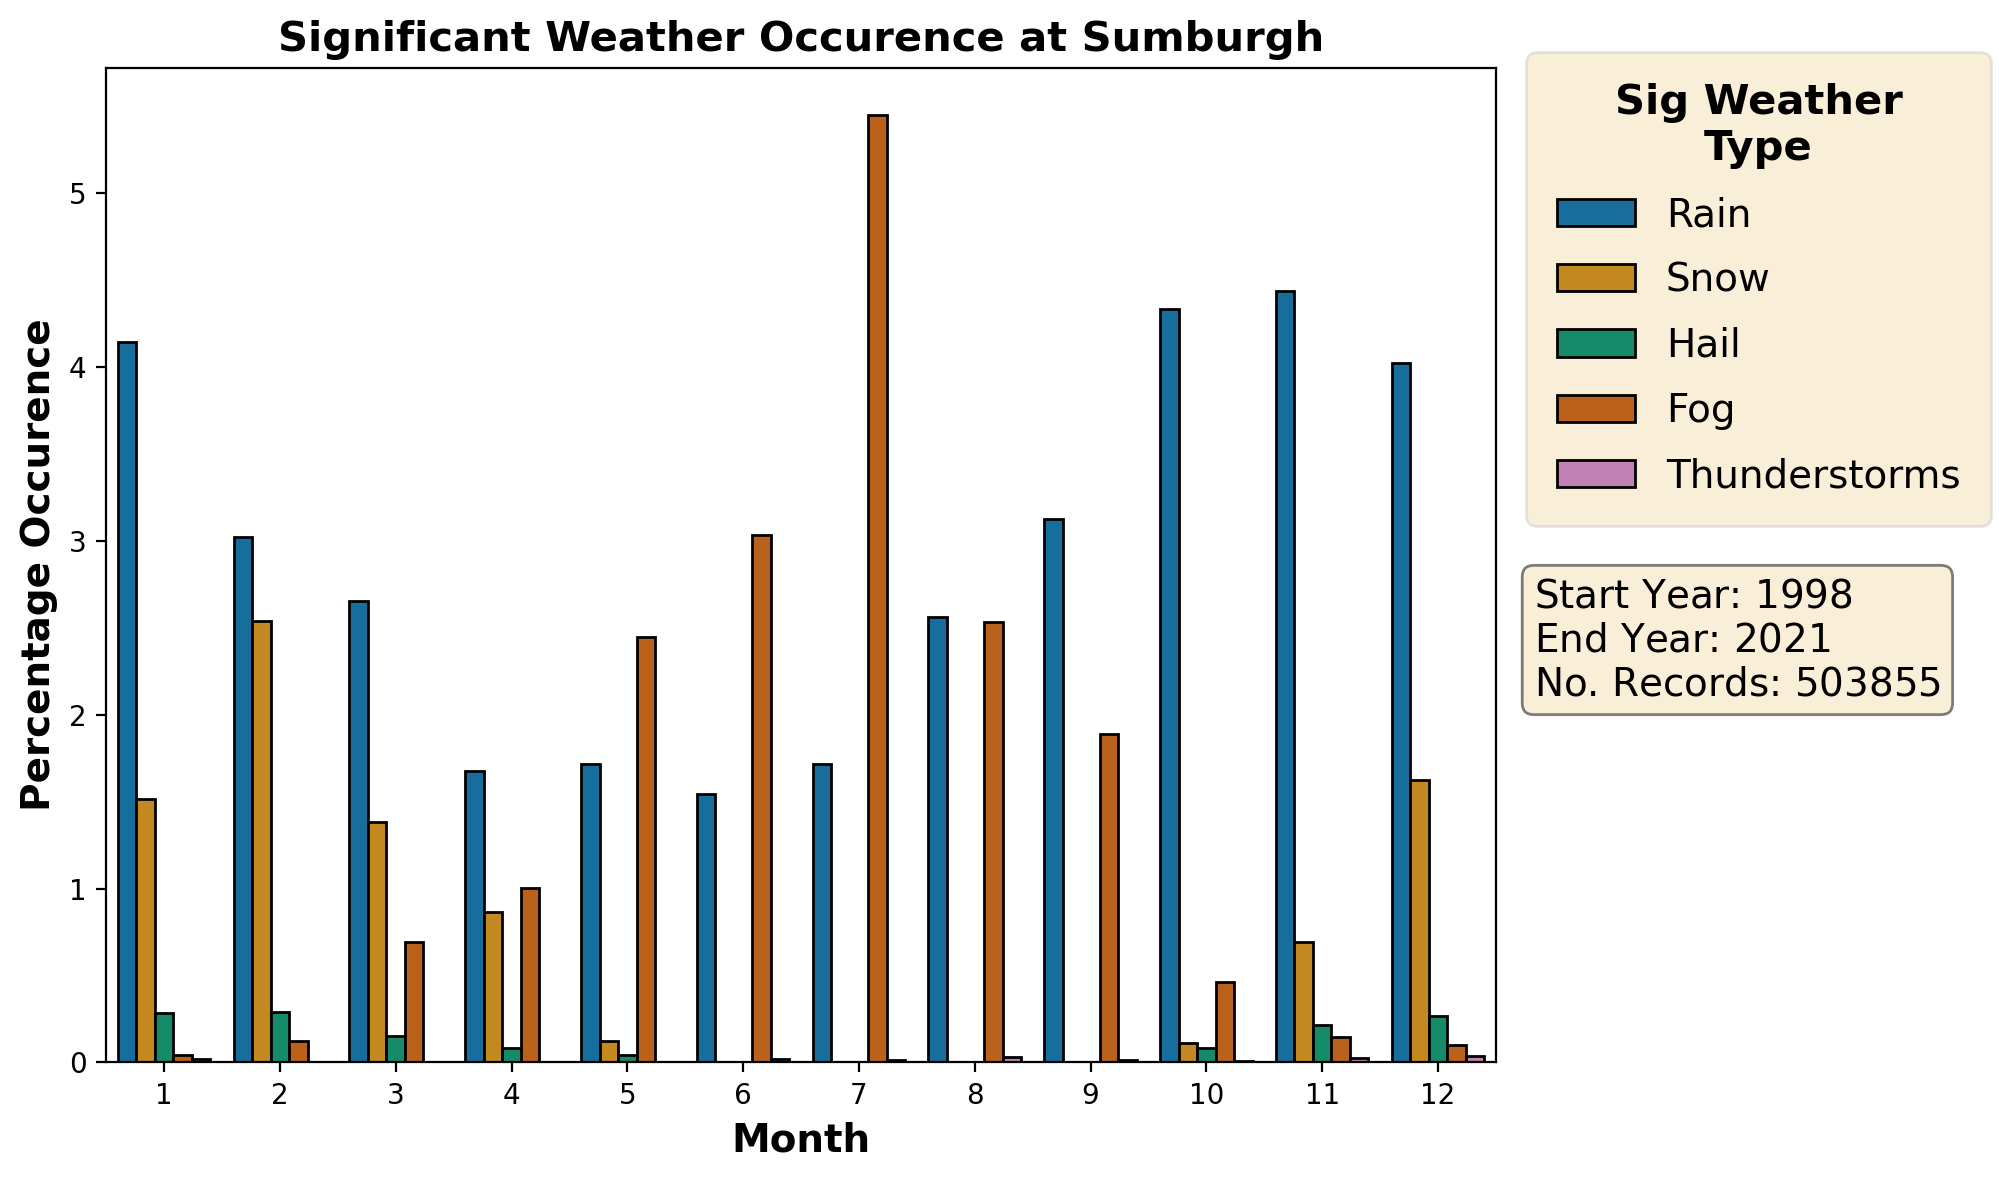
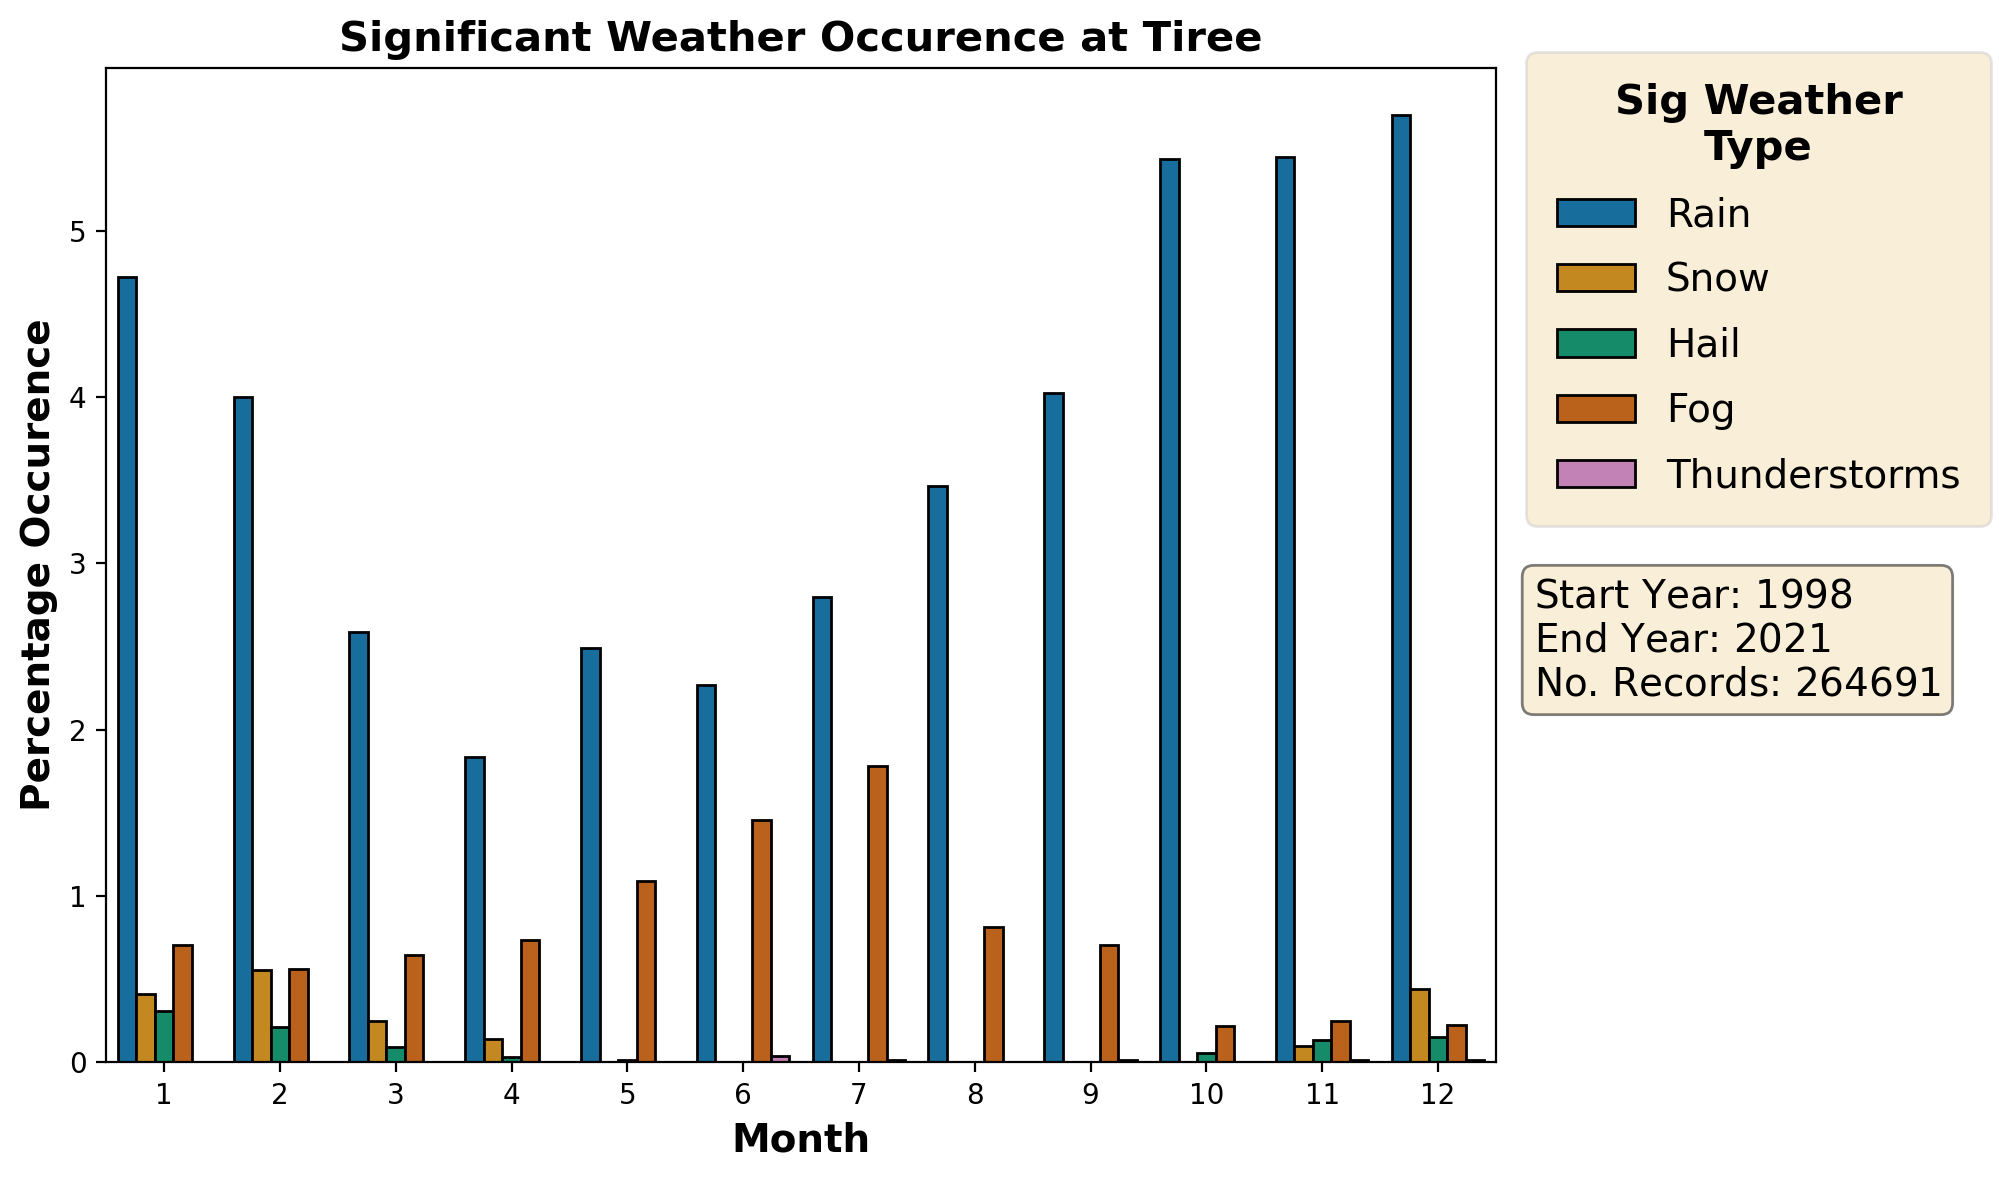
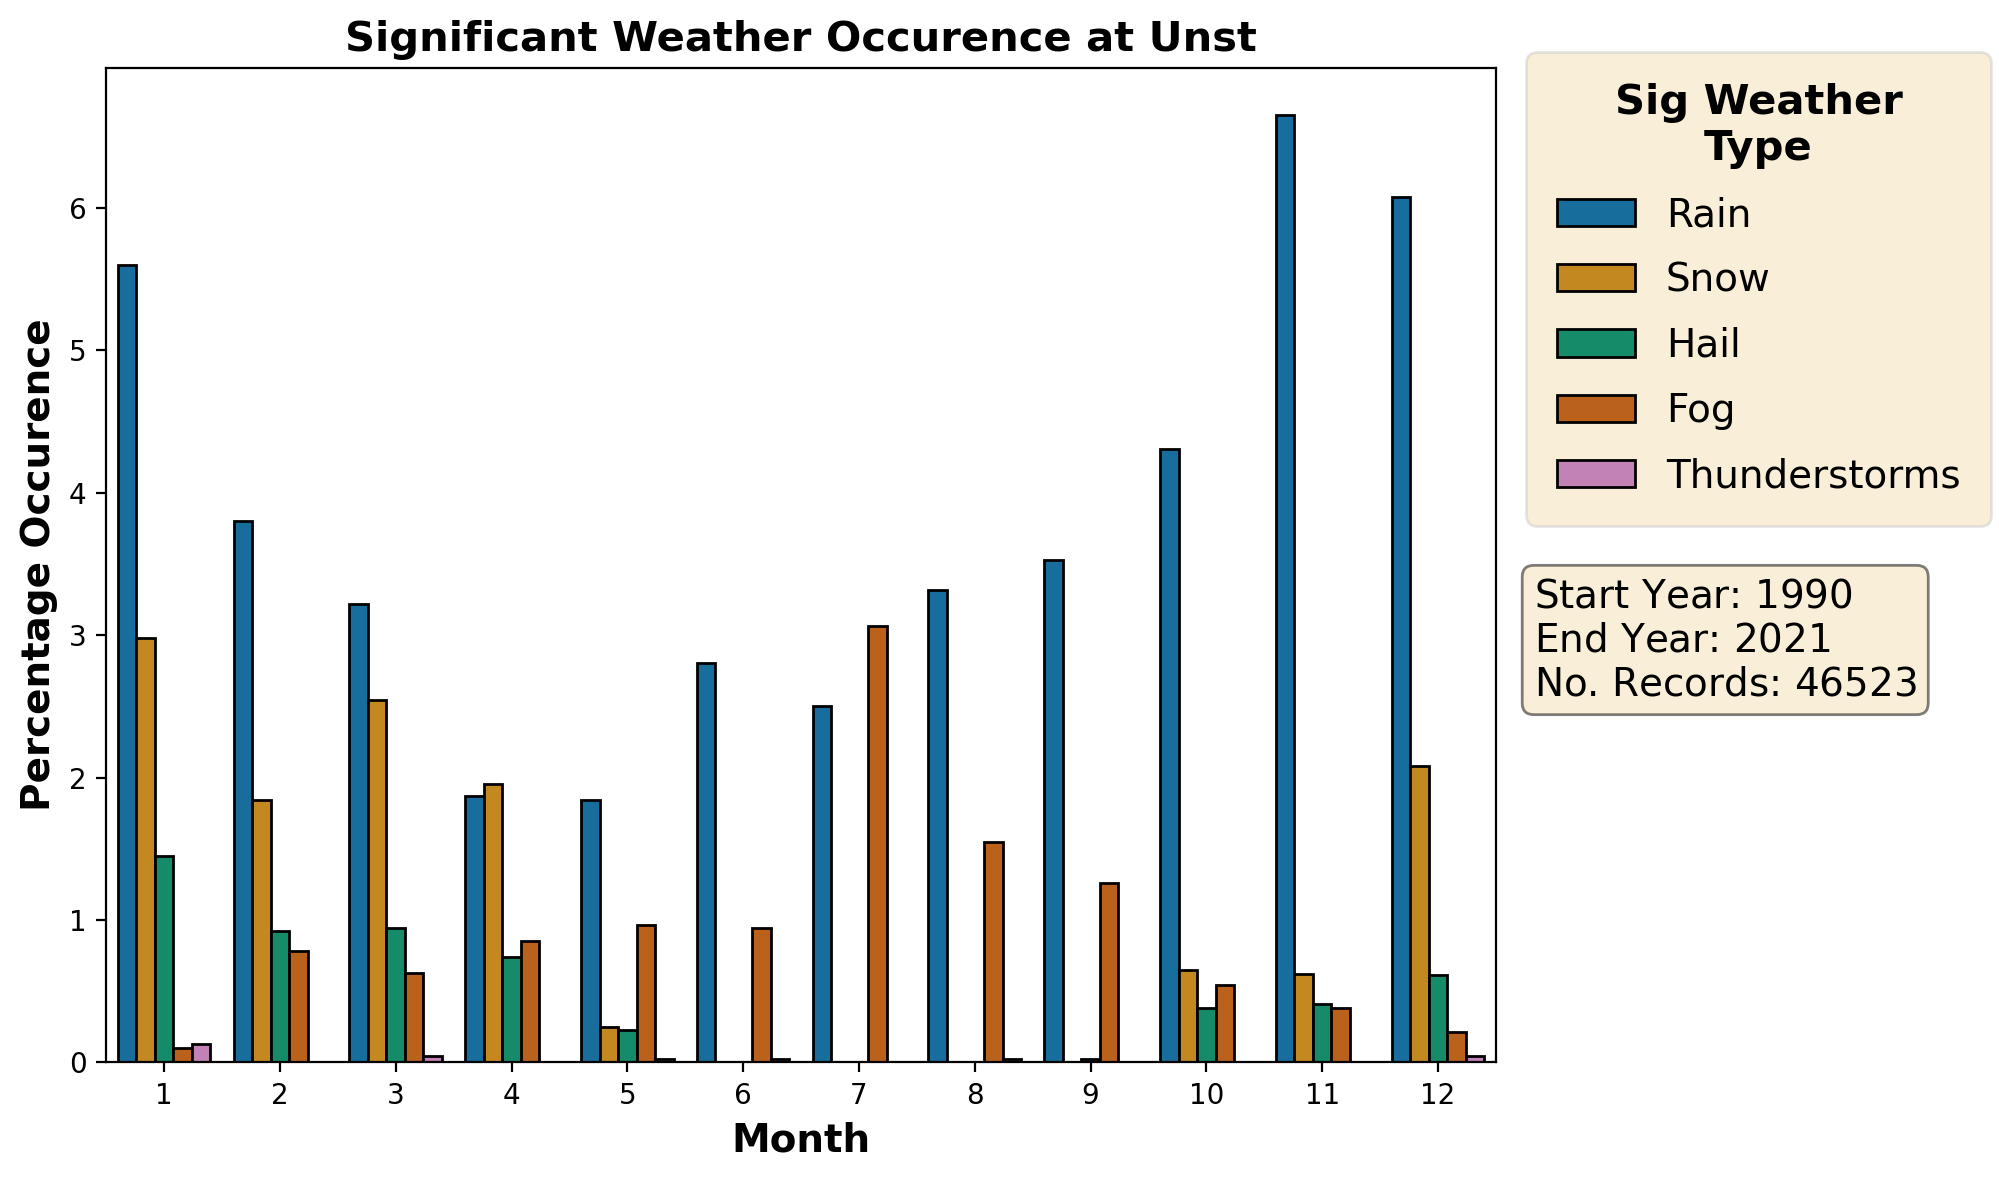
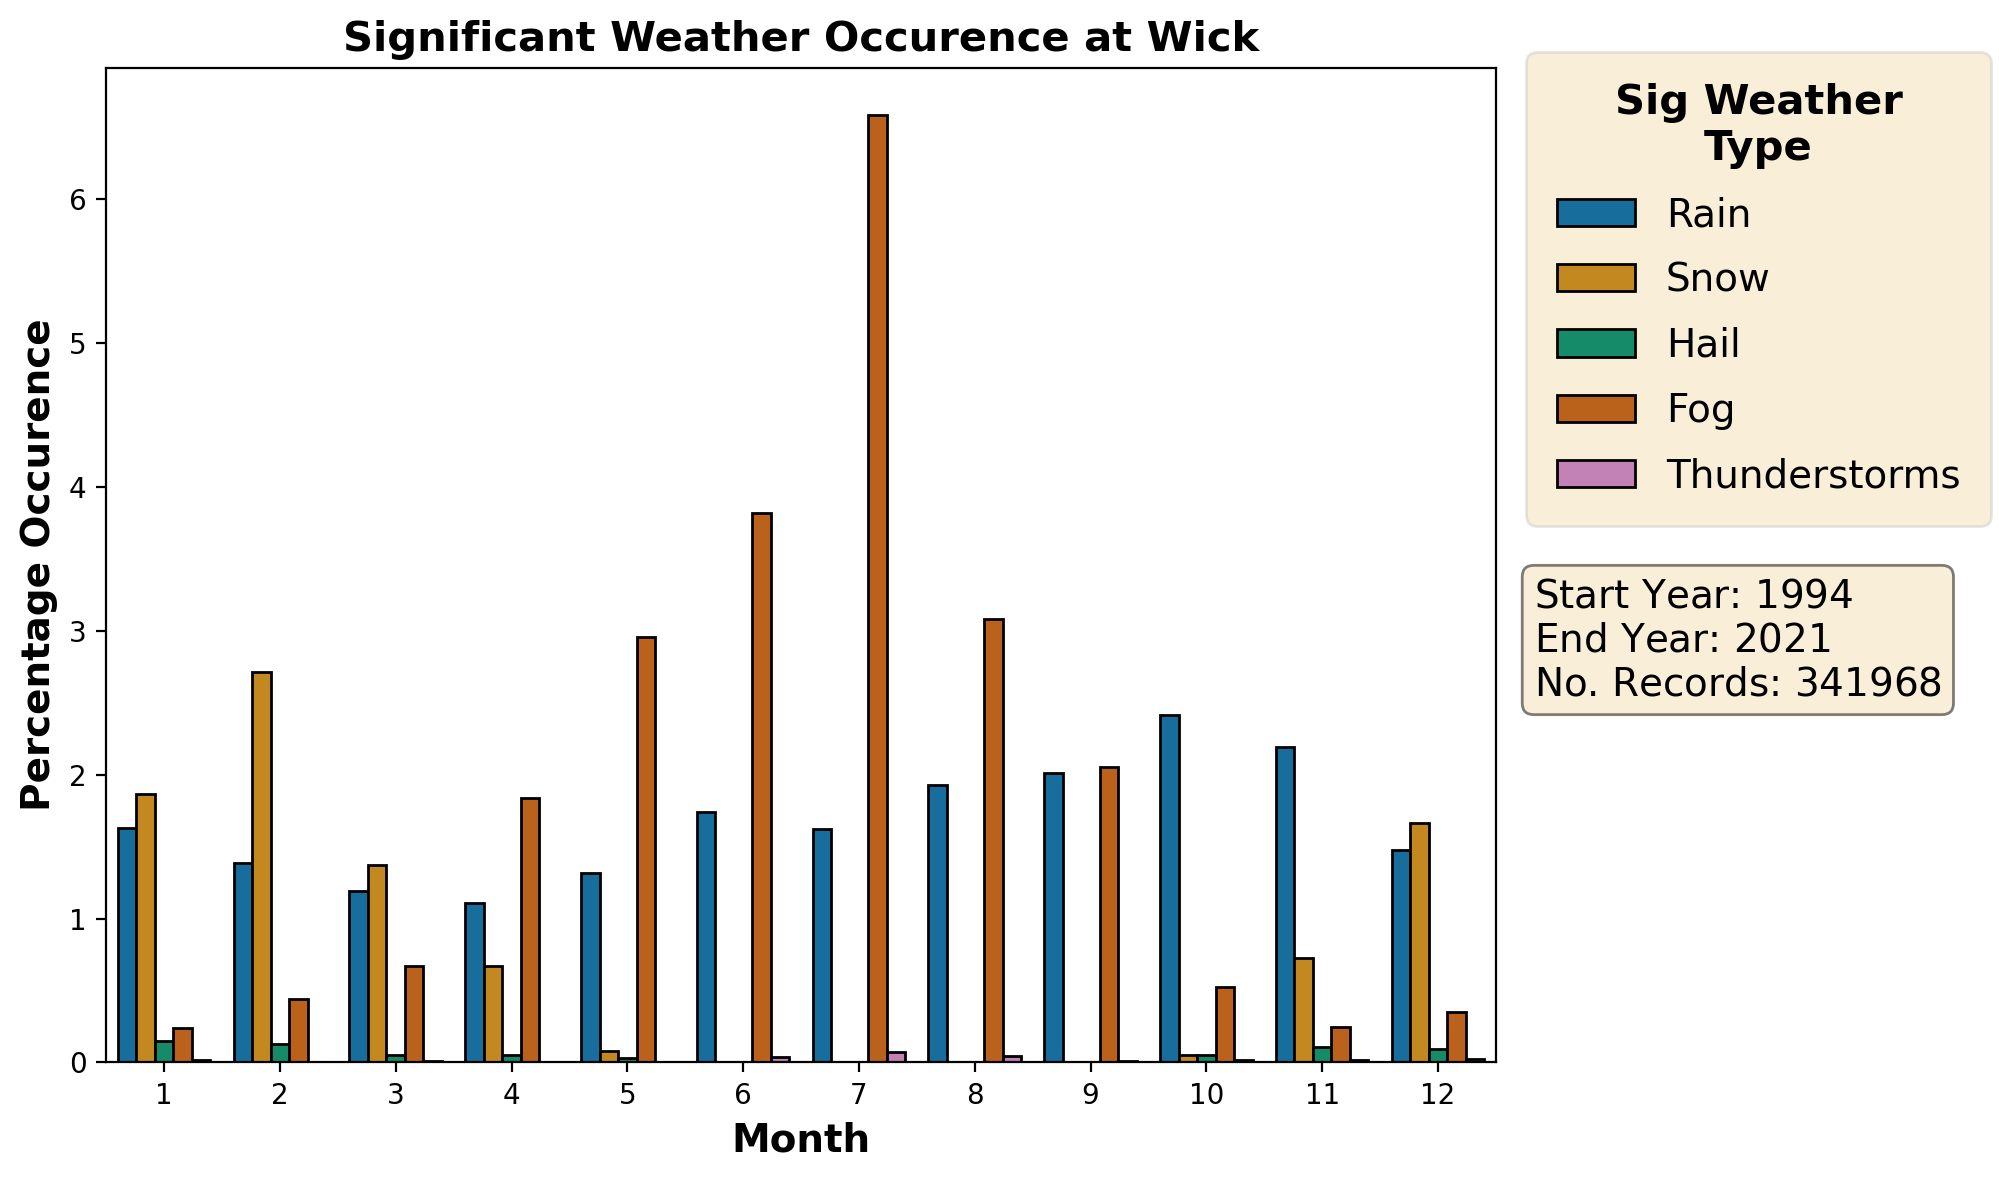
Weather Percentage
This plot shows the percentage of total observations per month where hazardous weather types ** were reported.
**Rain is only included when it is of 'moderate' or 'severe' intensity.
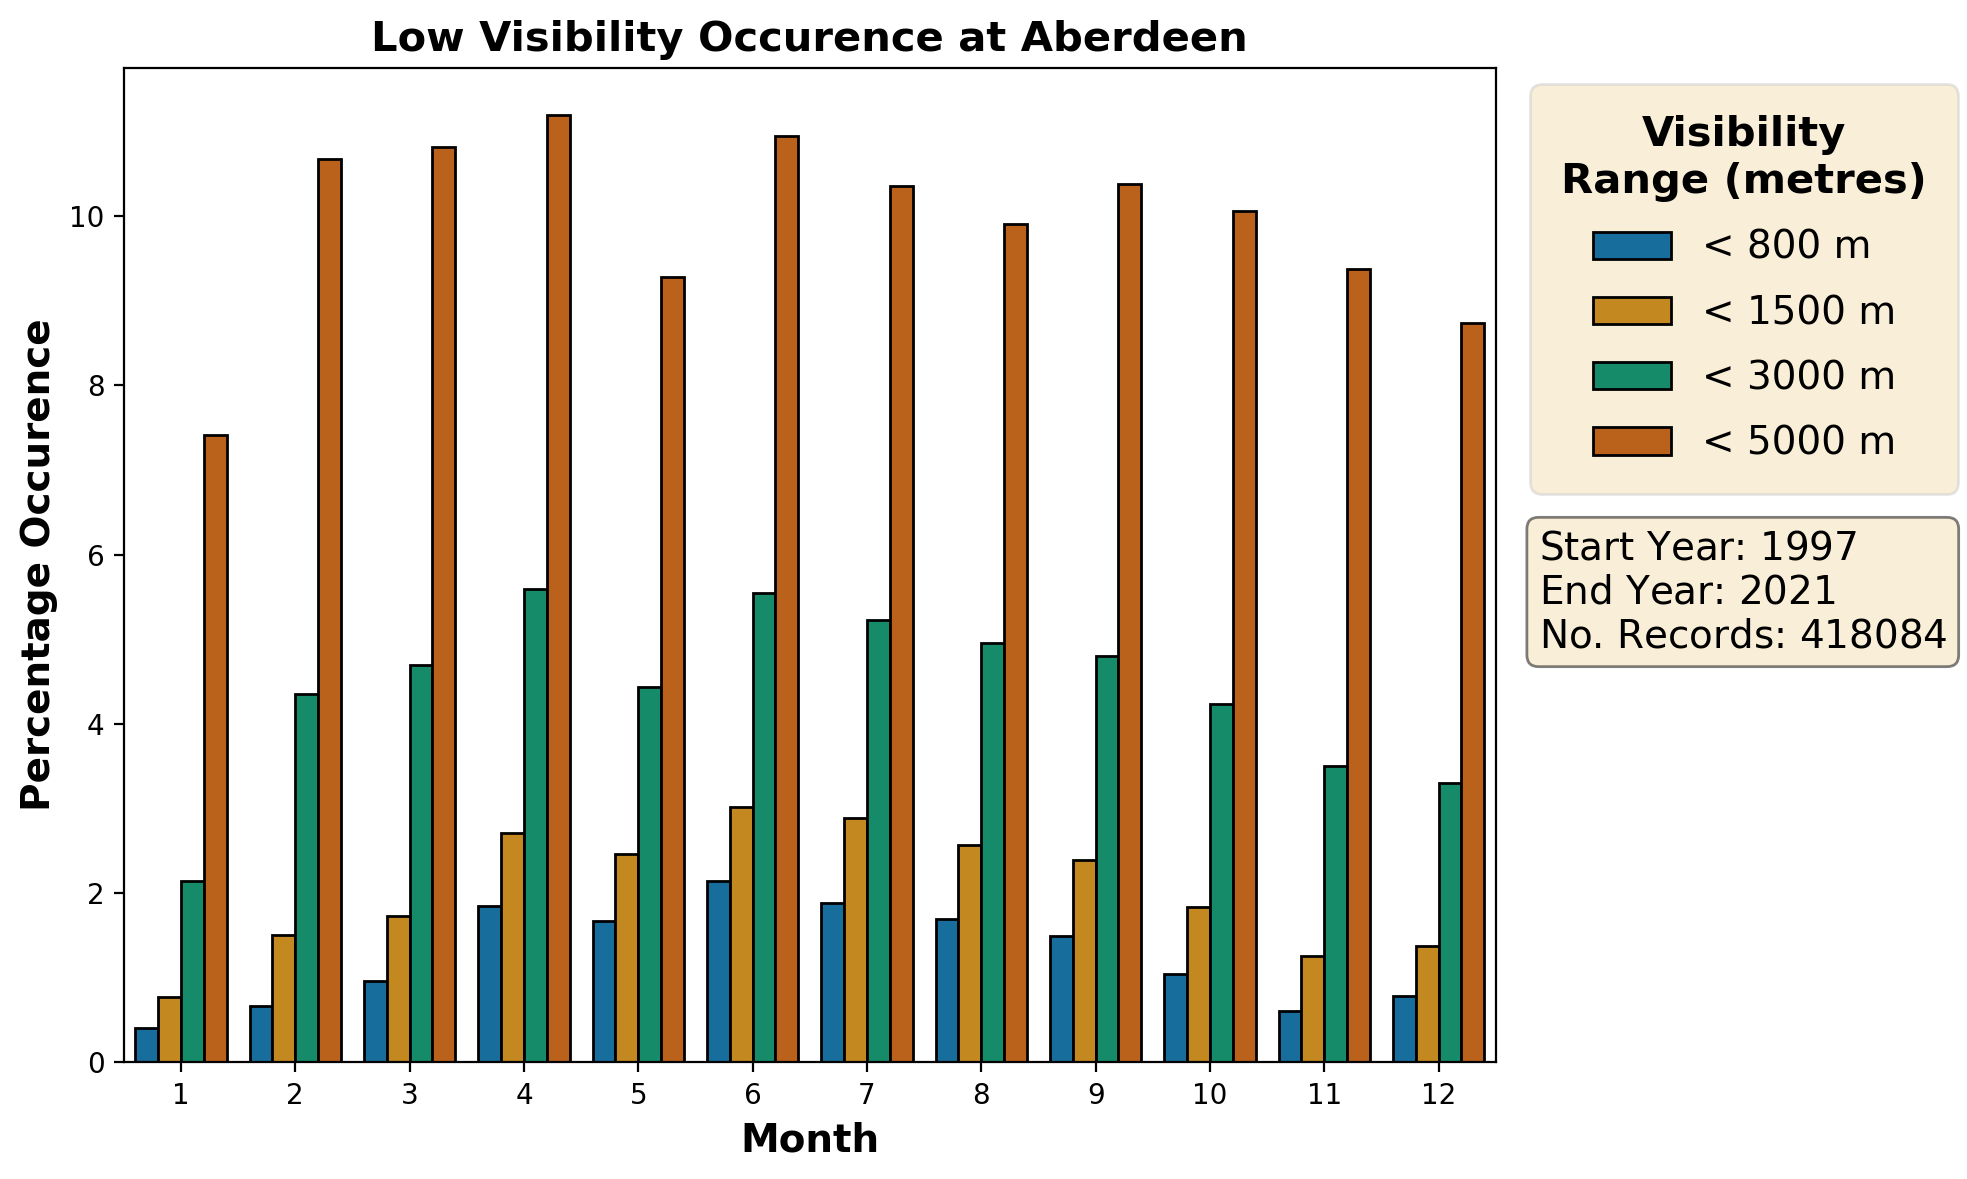
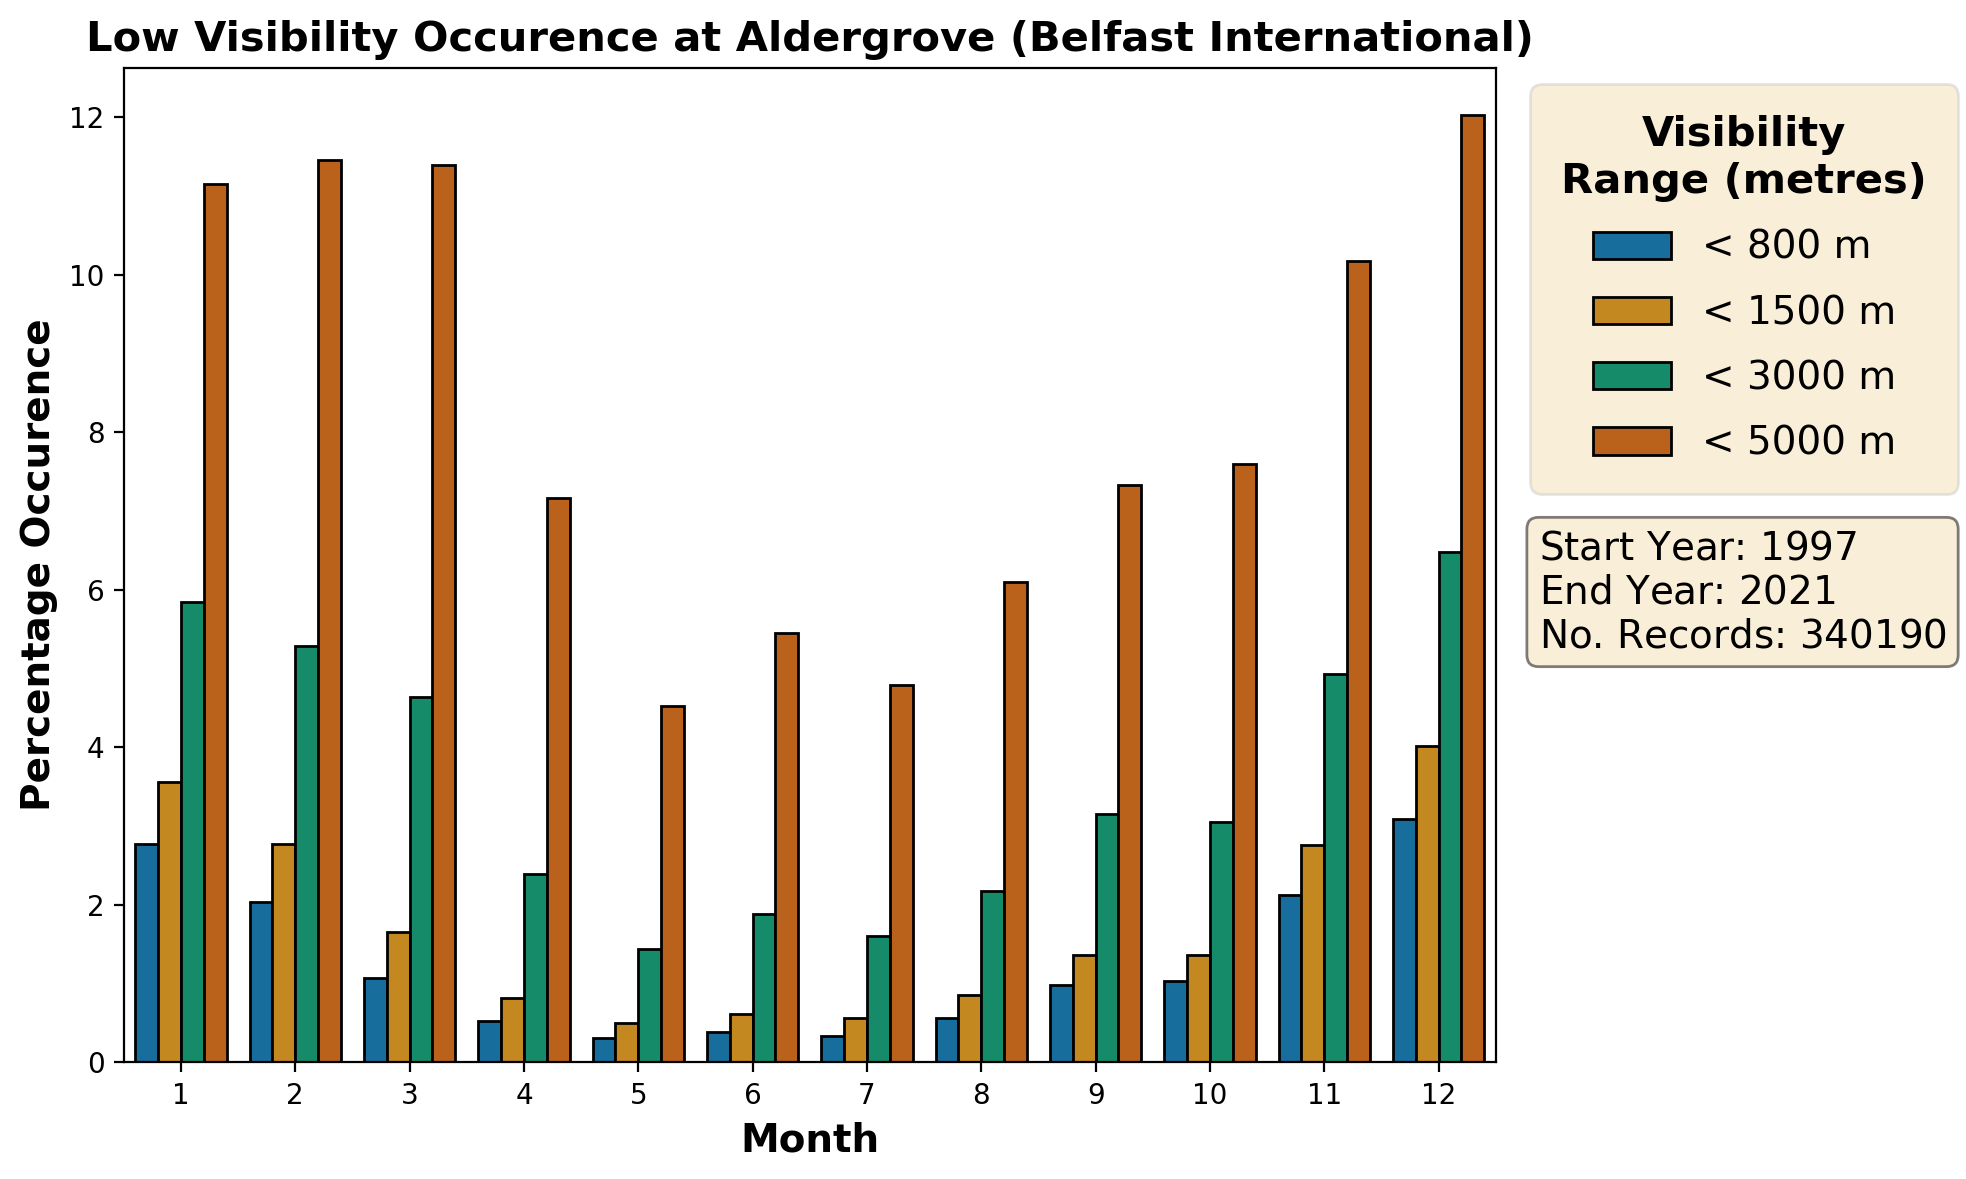
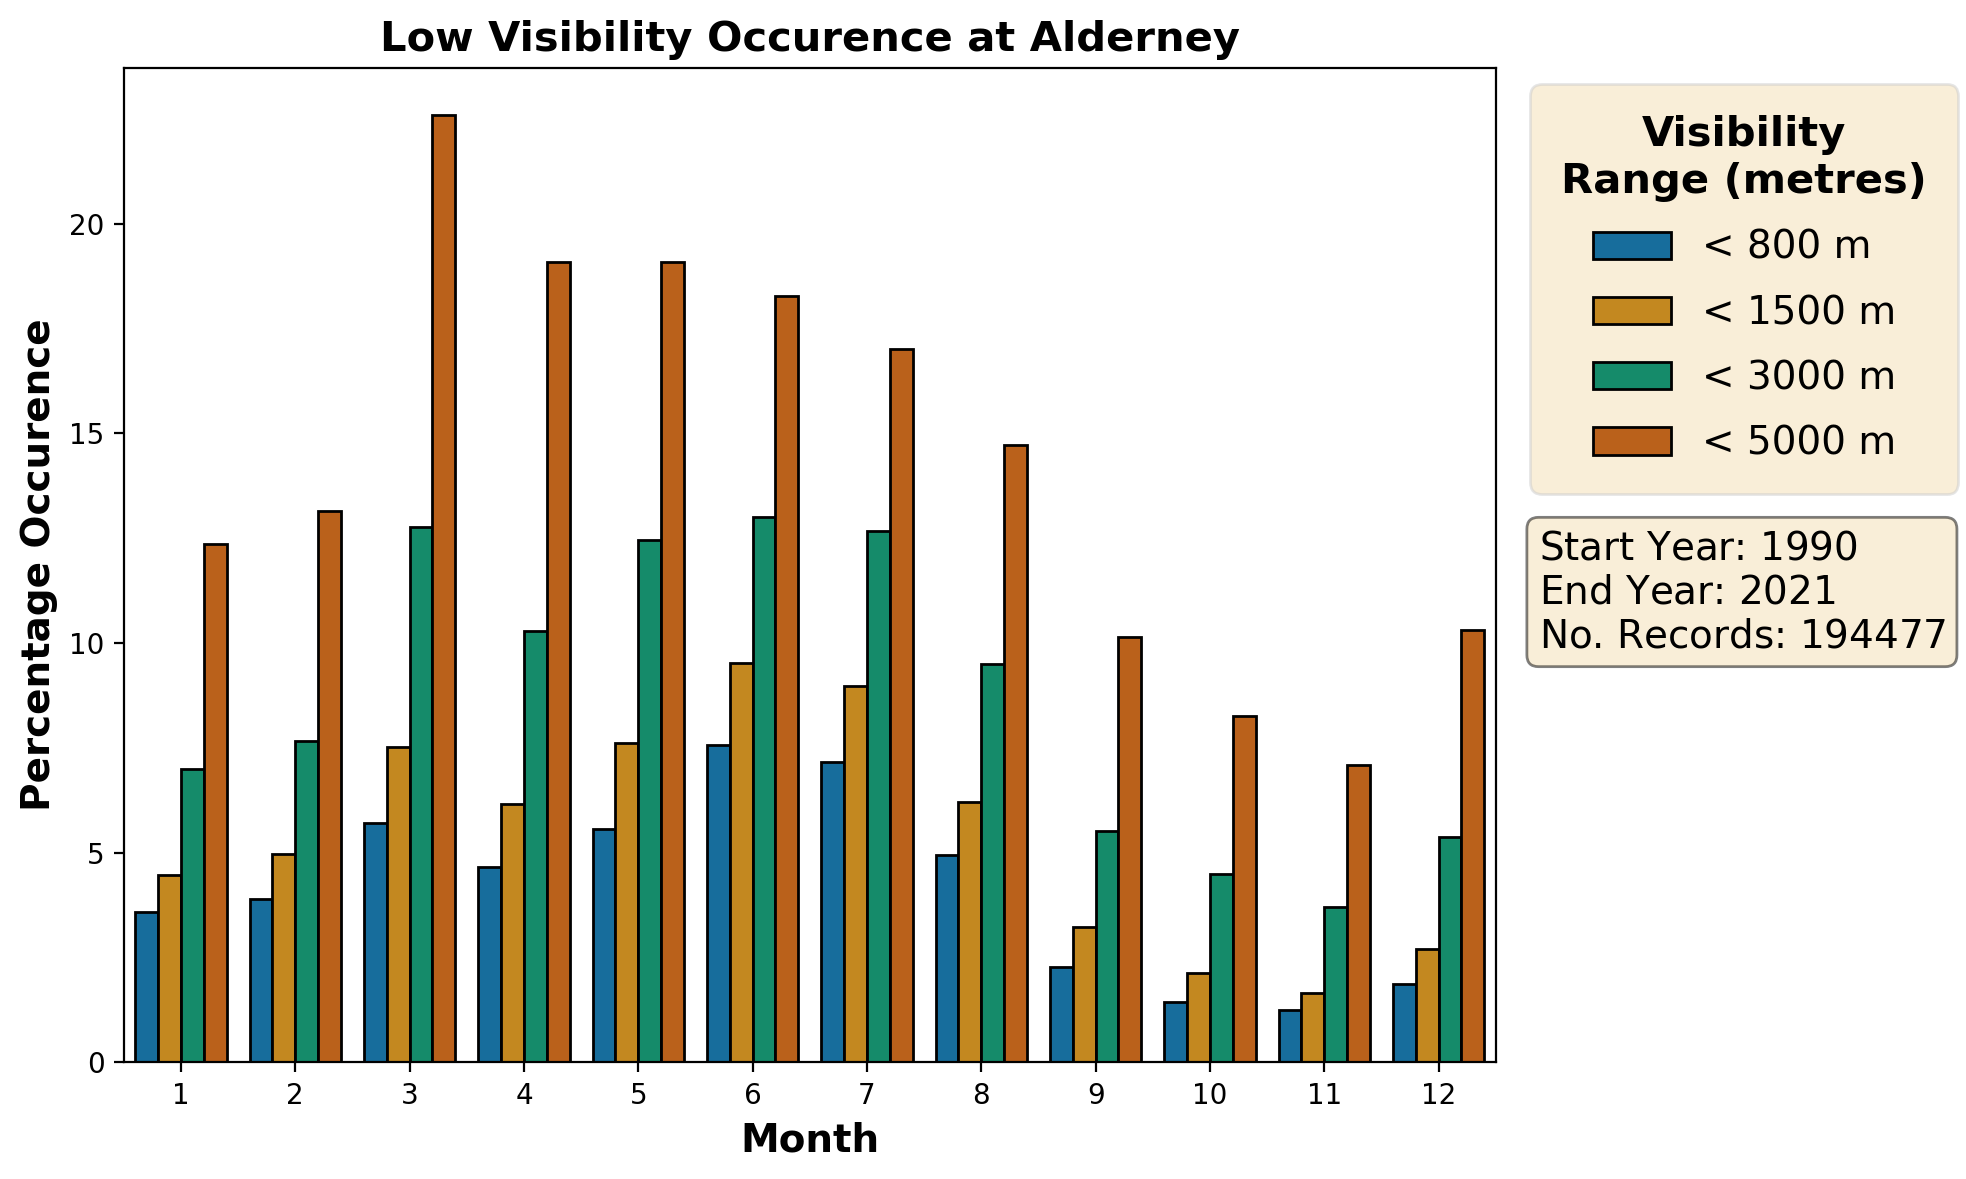
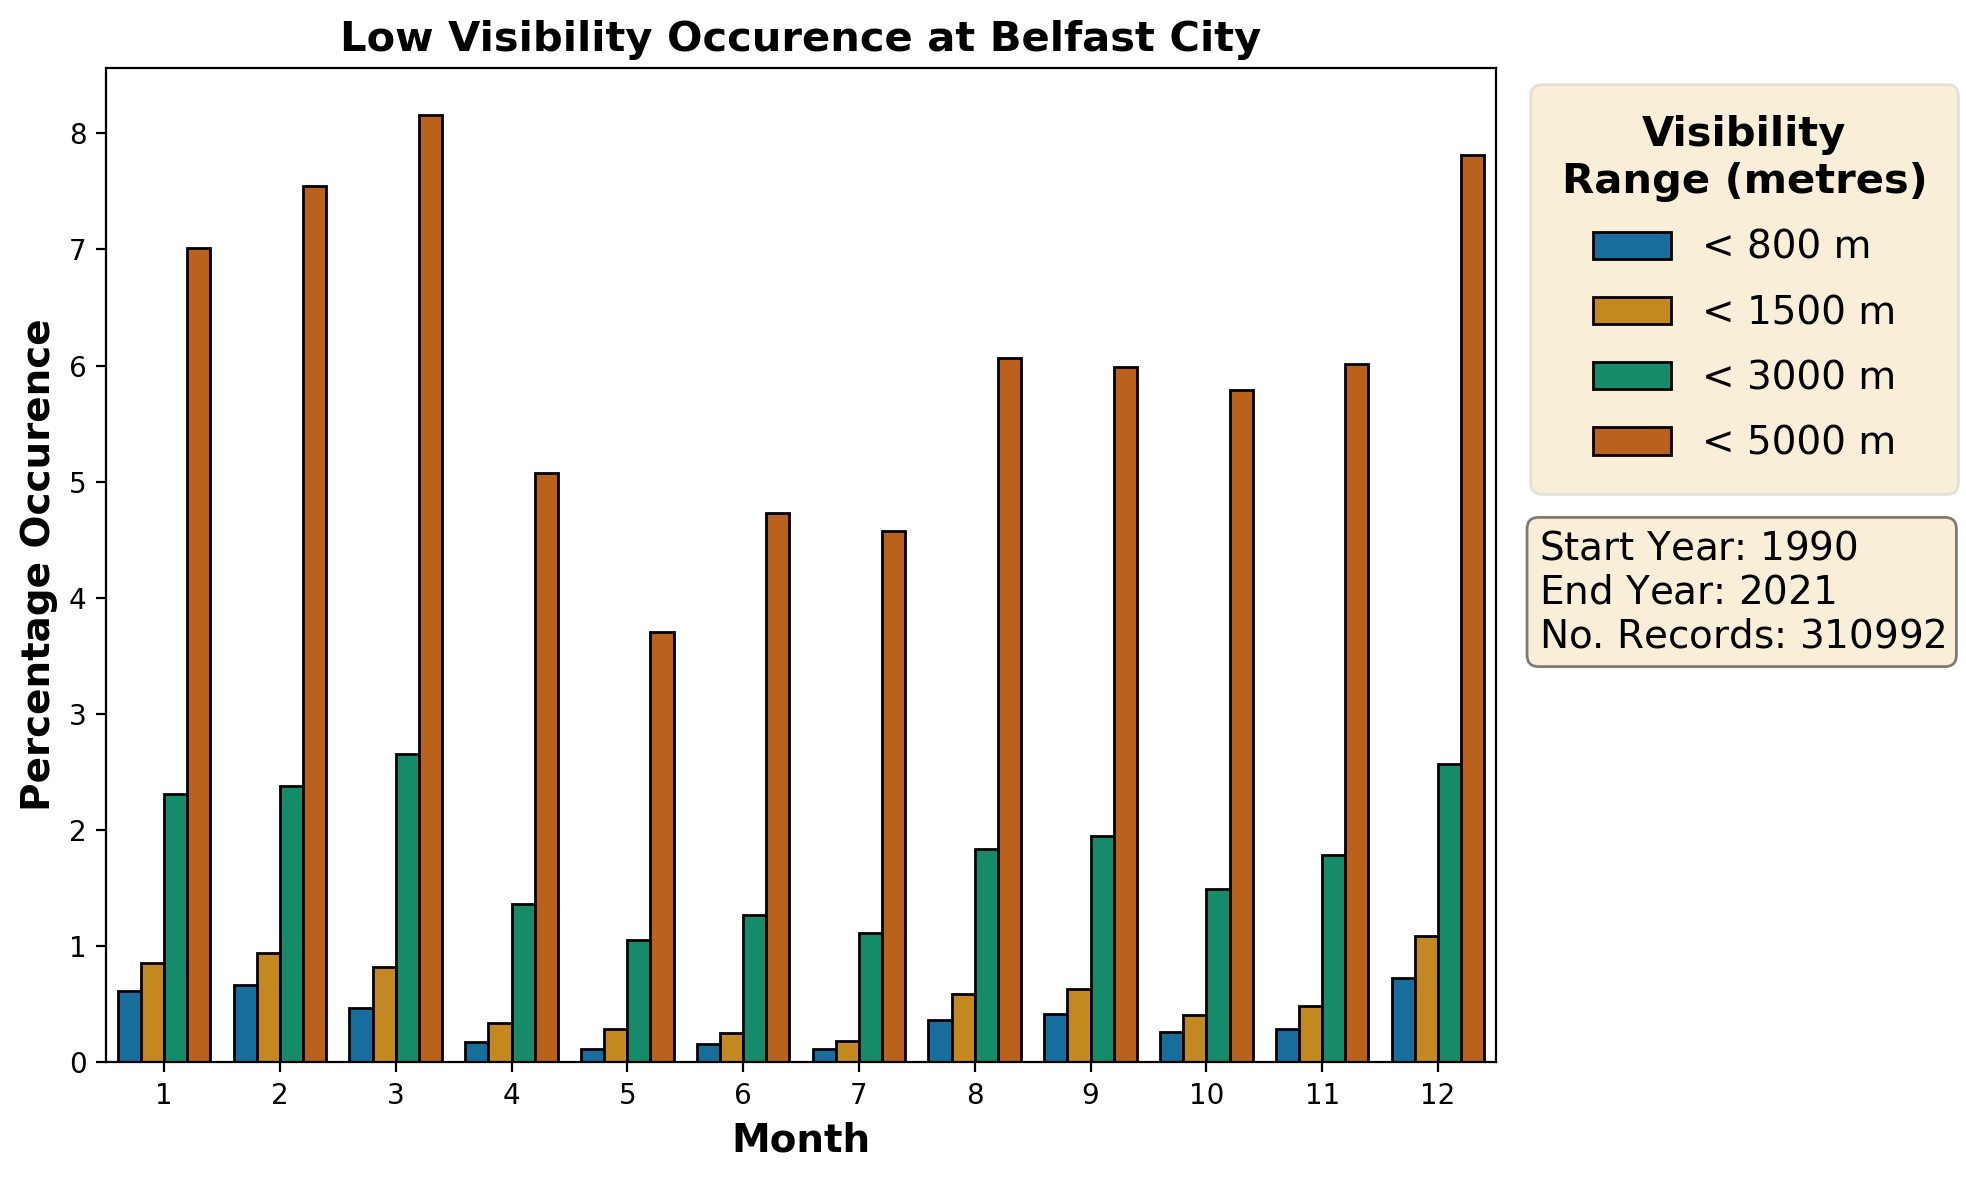
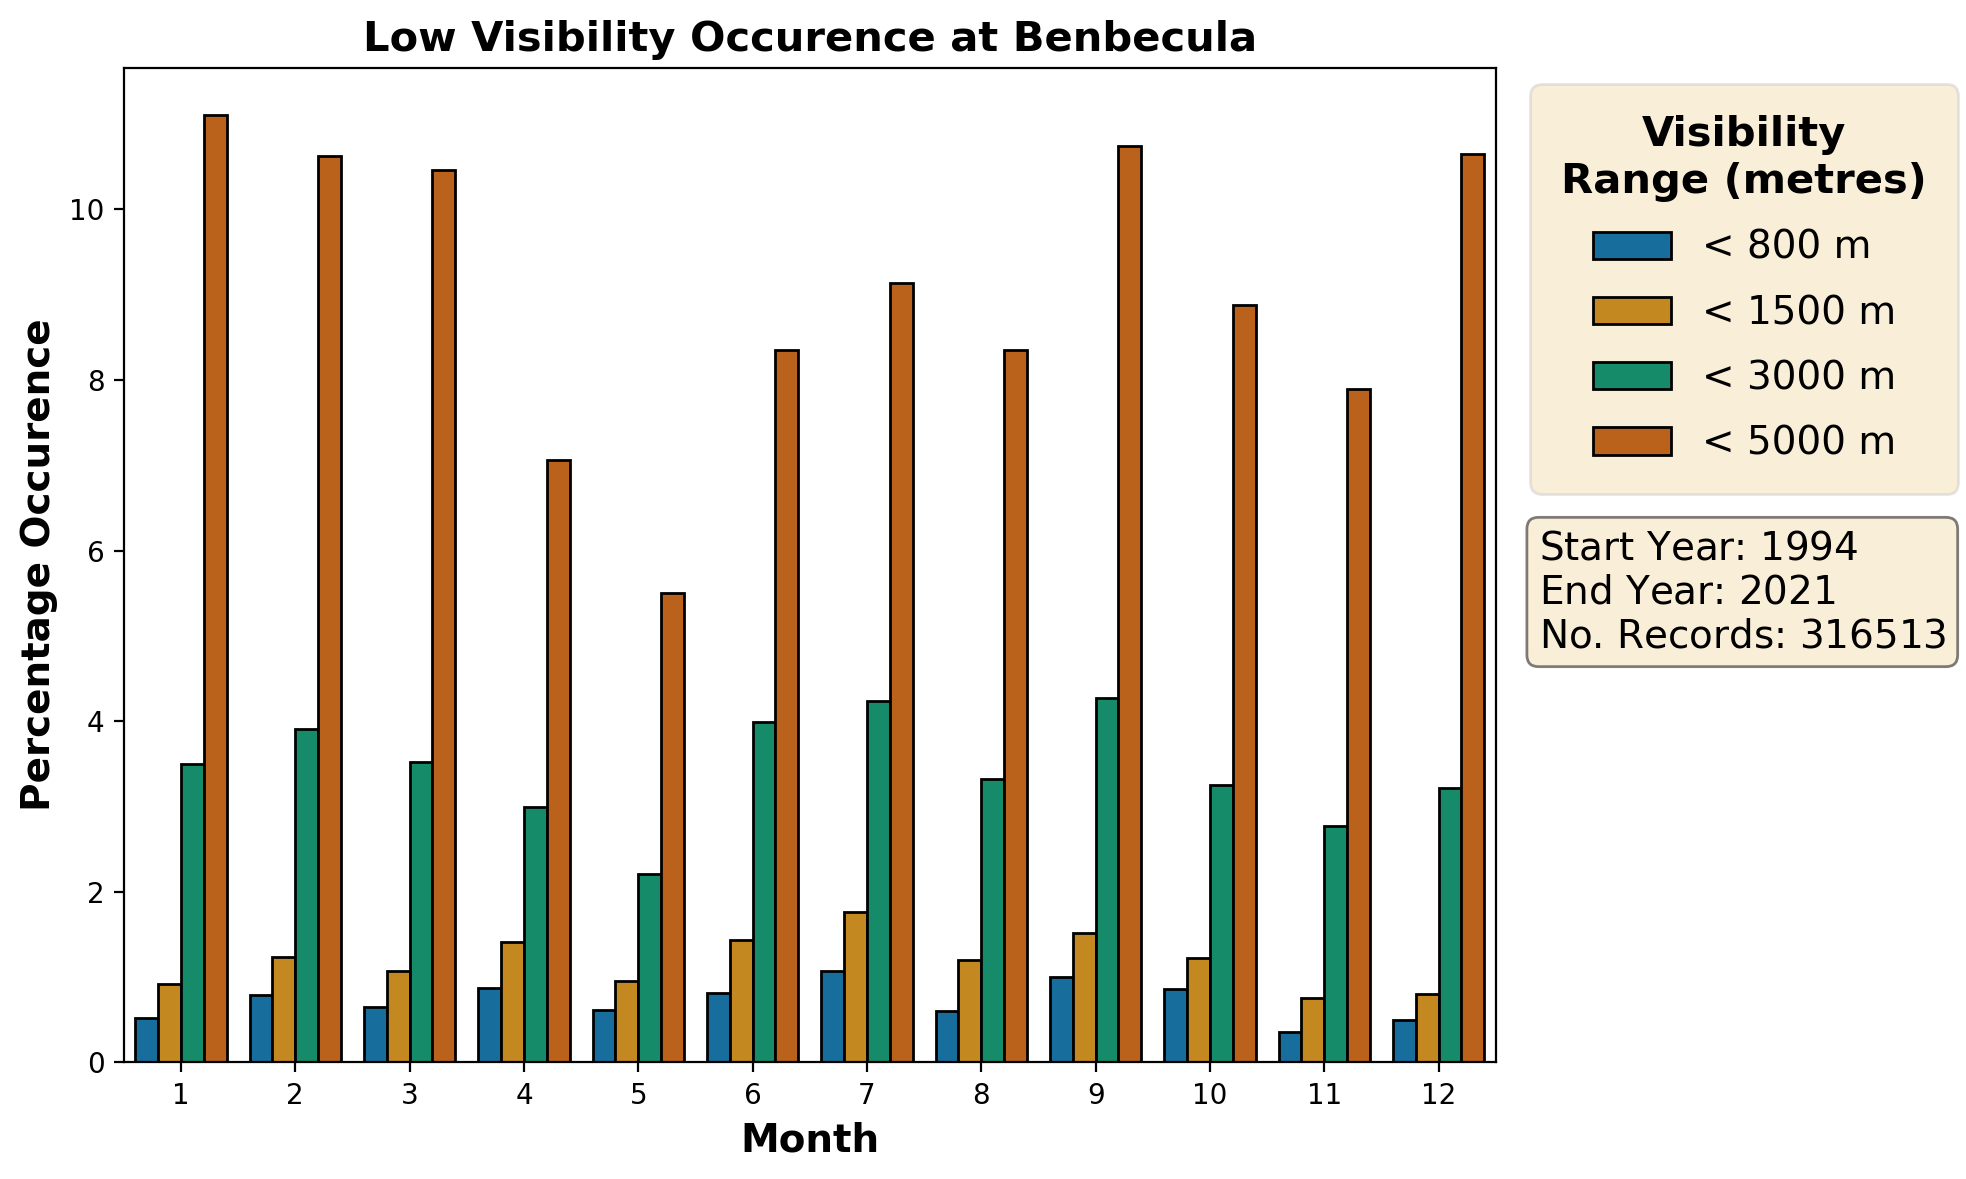
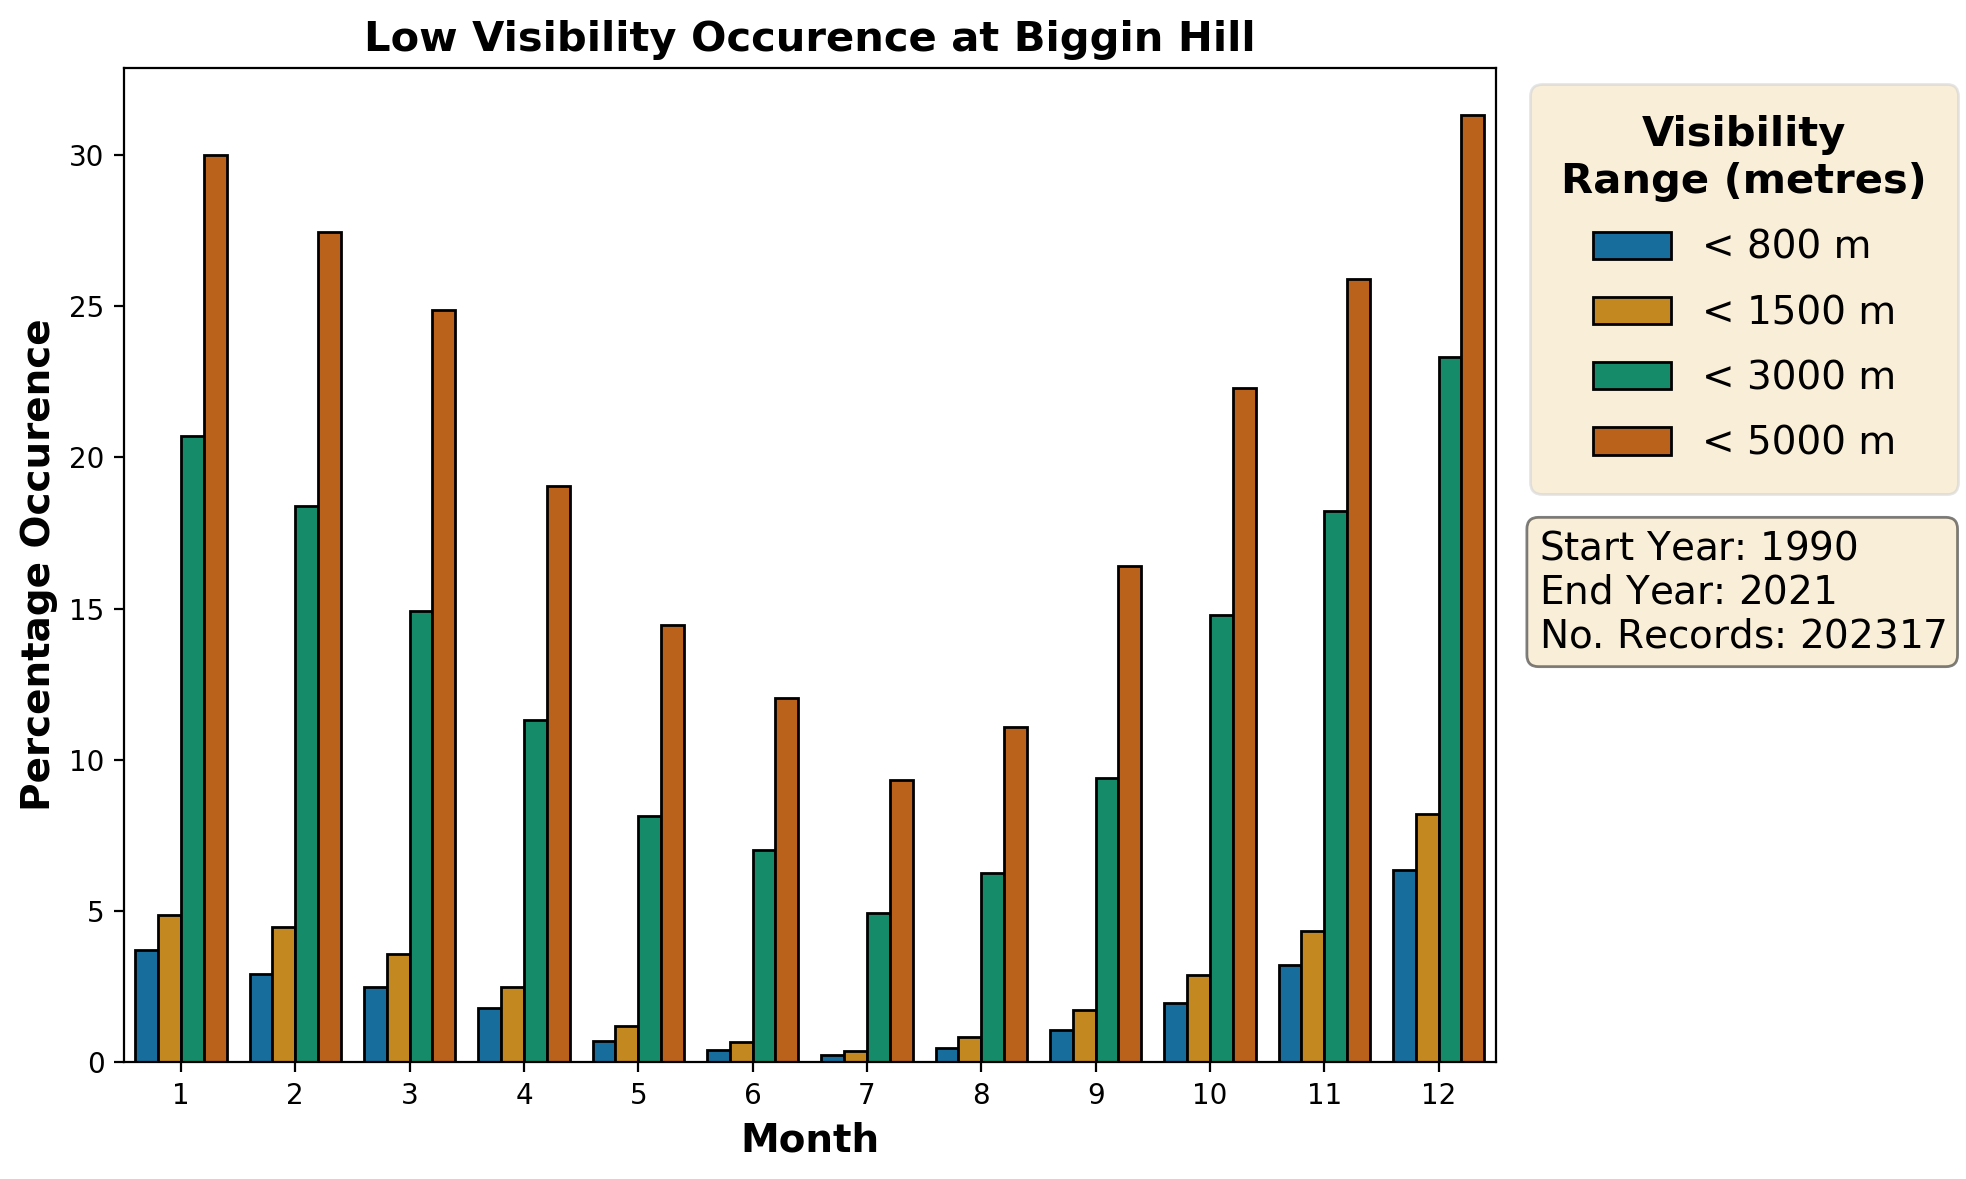
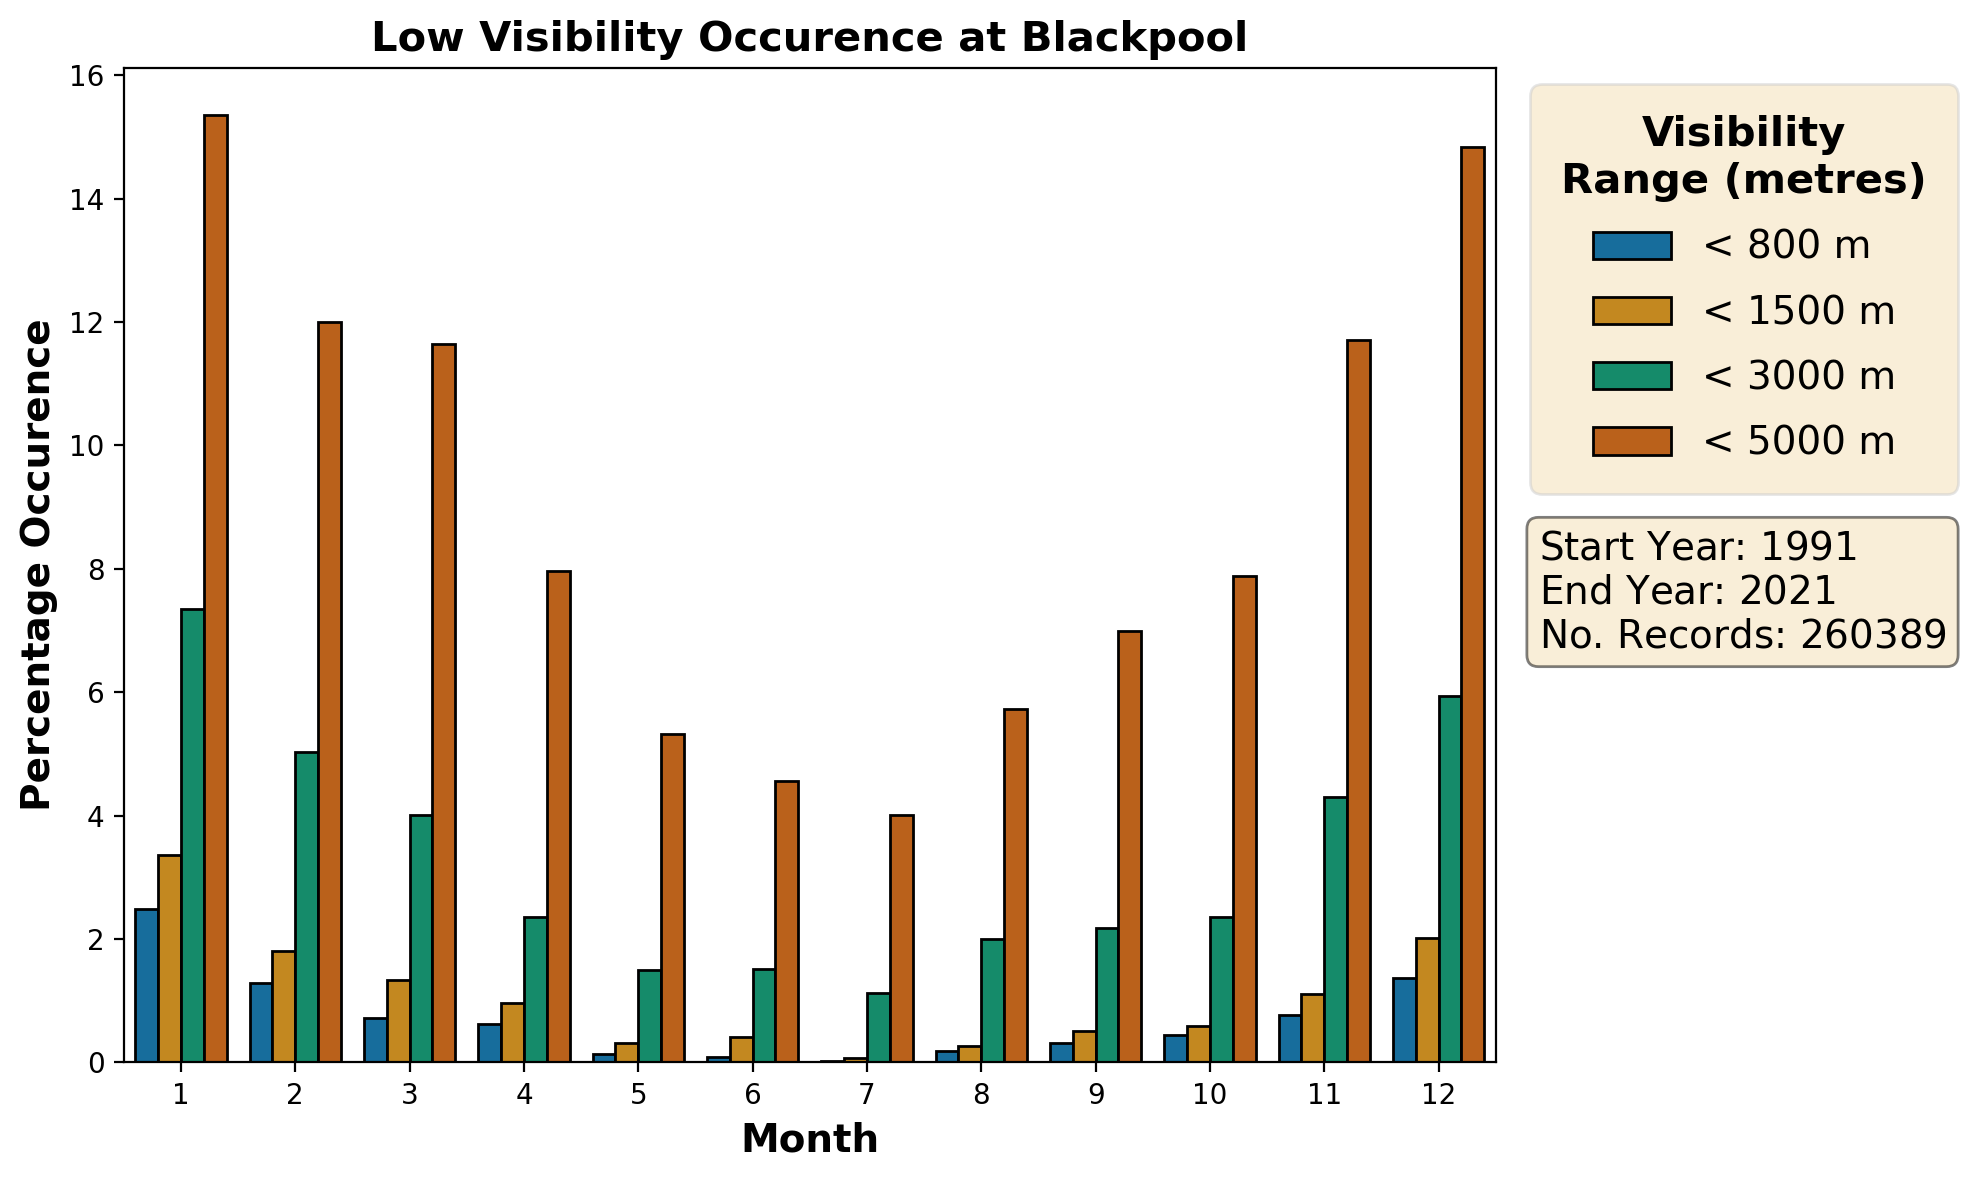
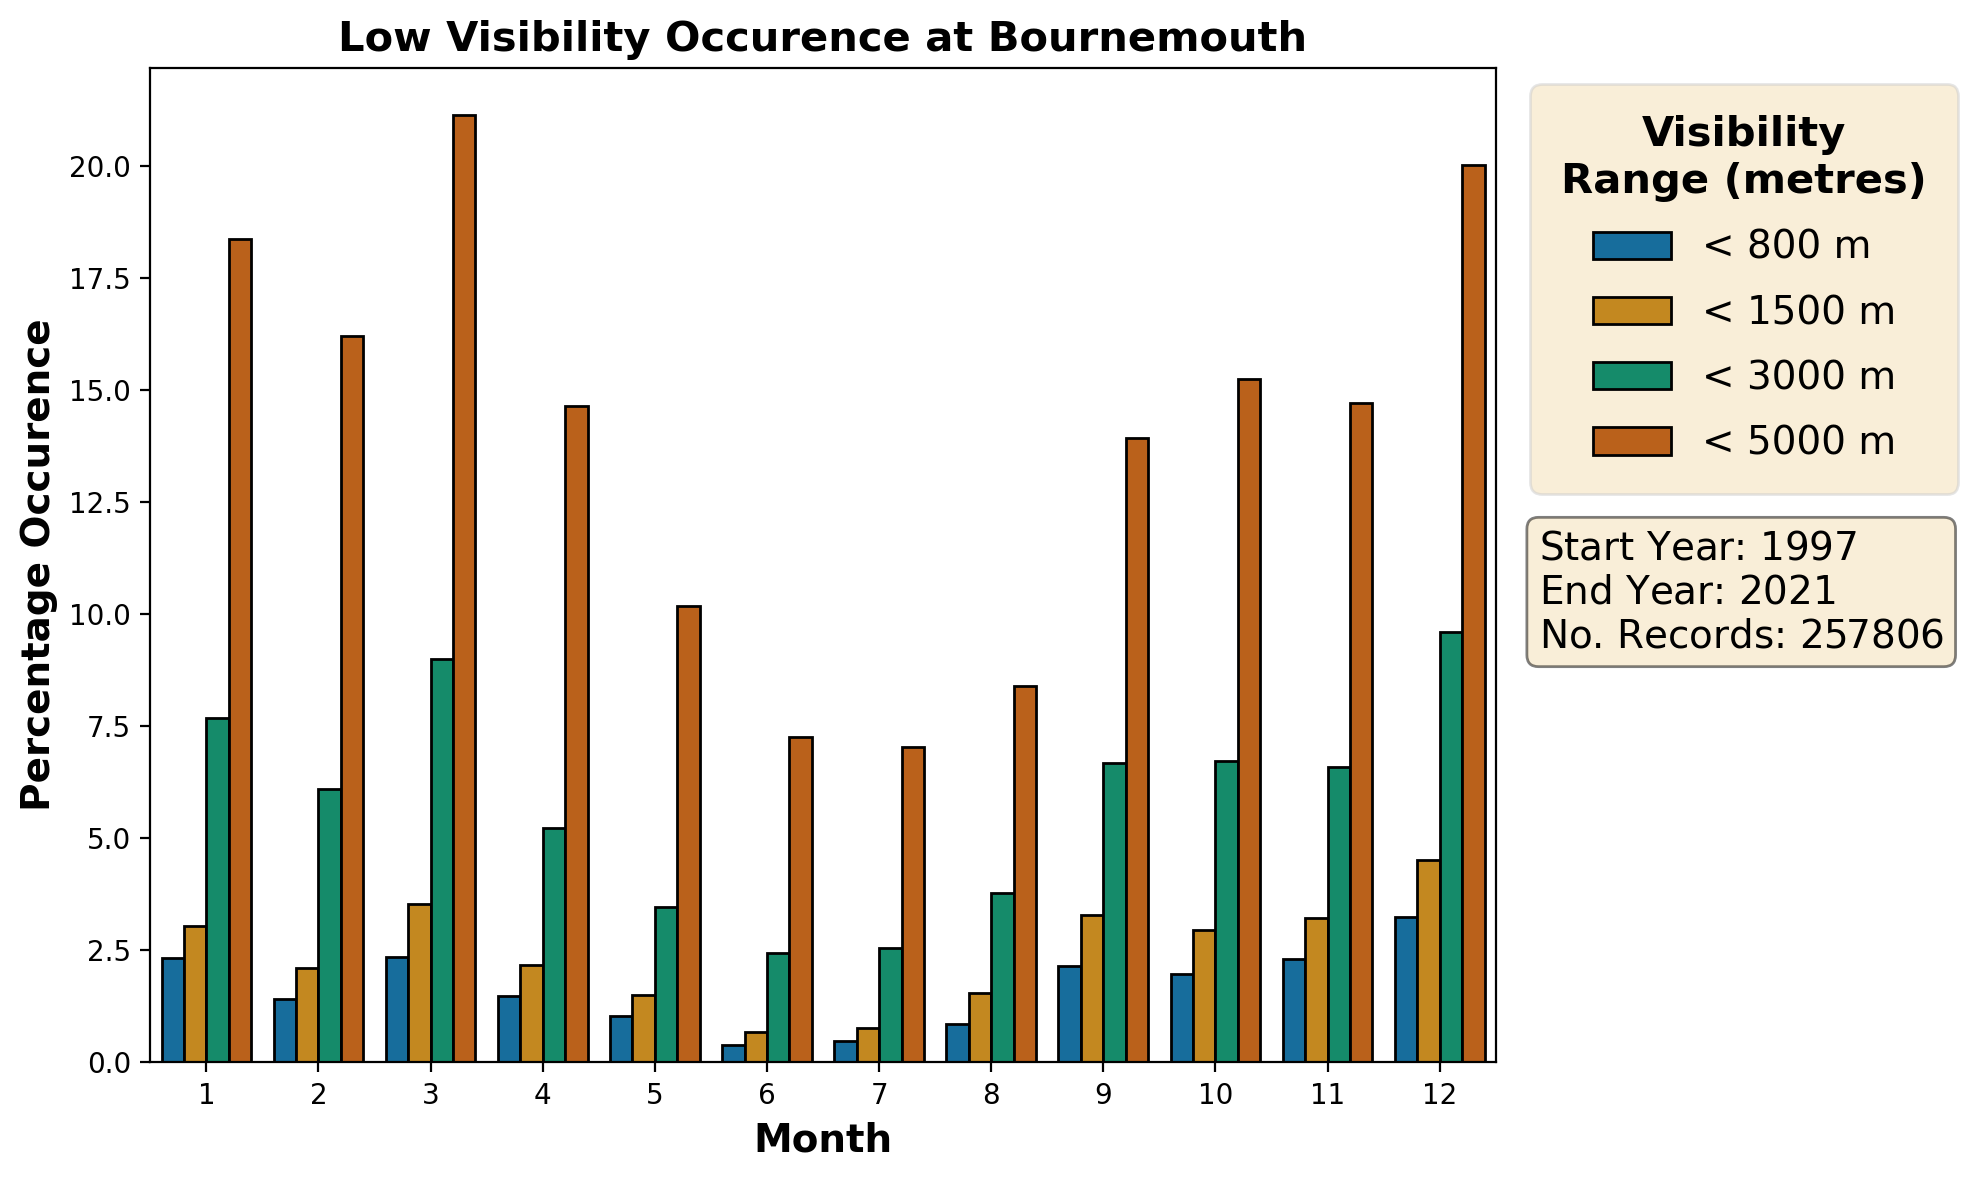
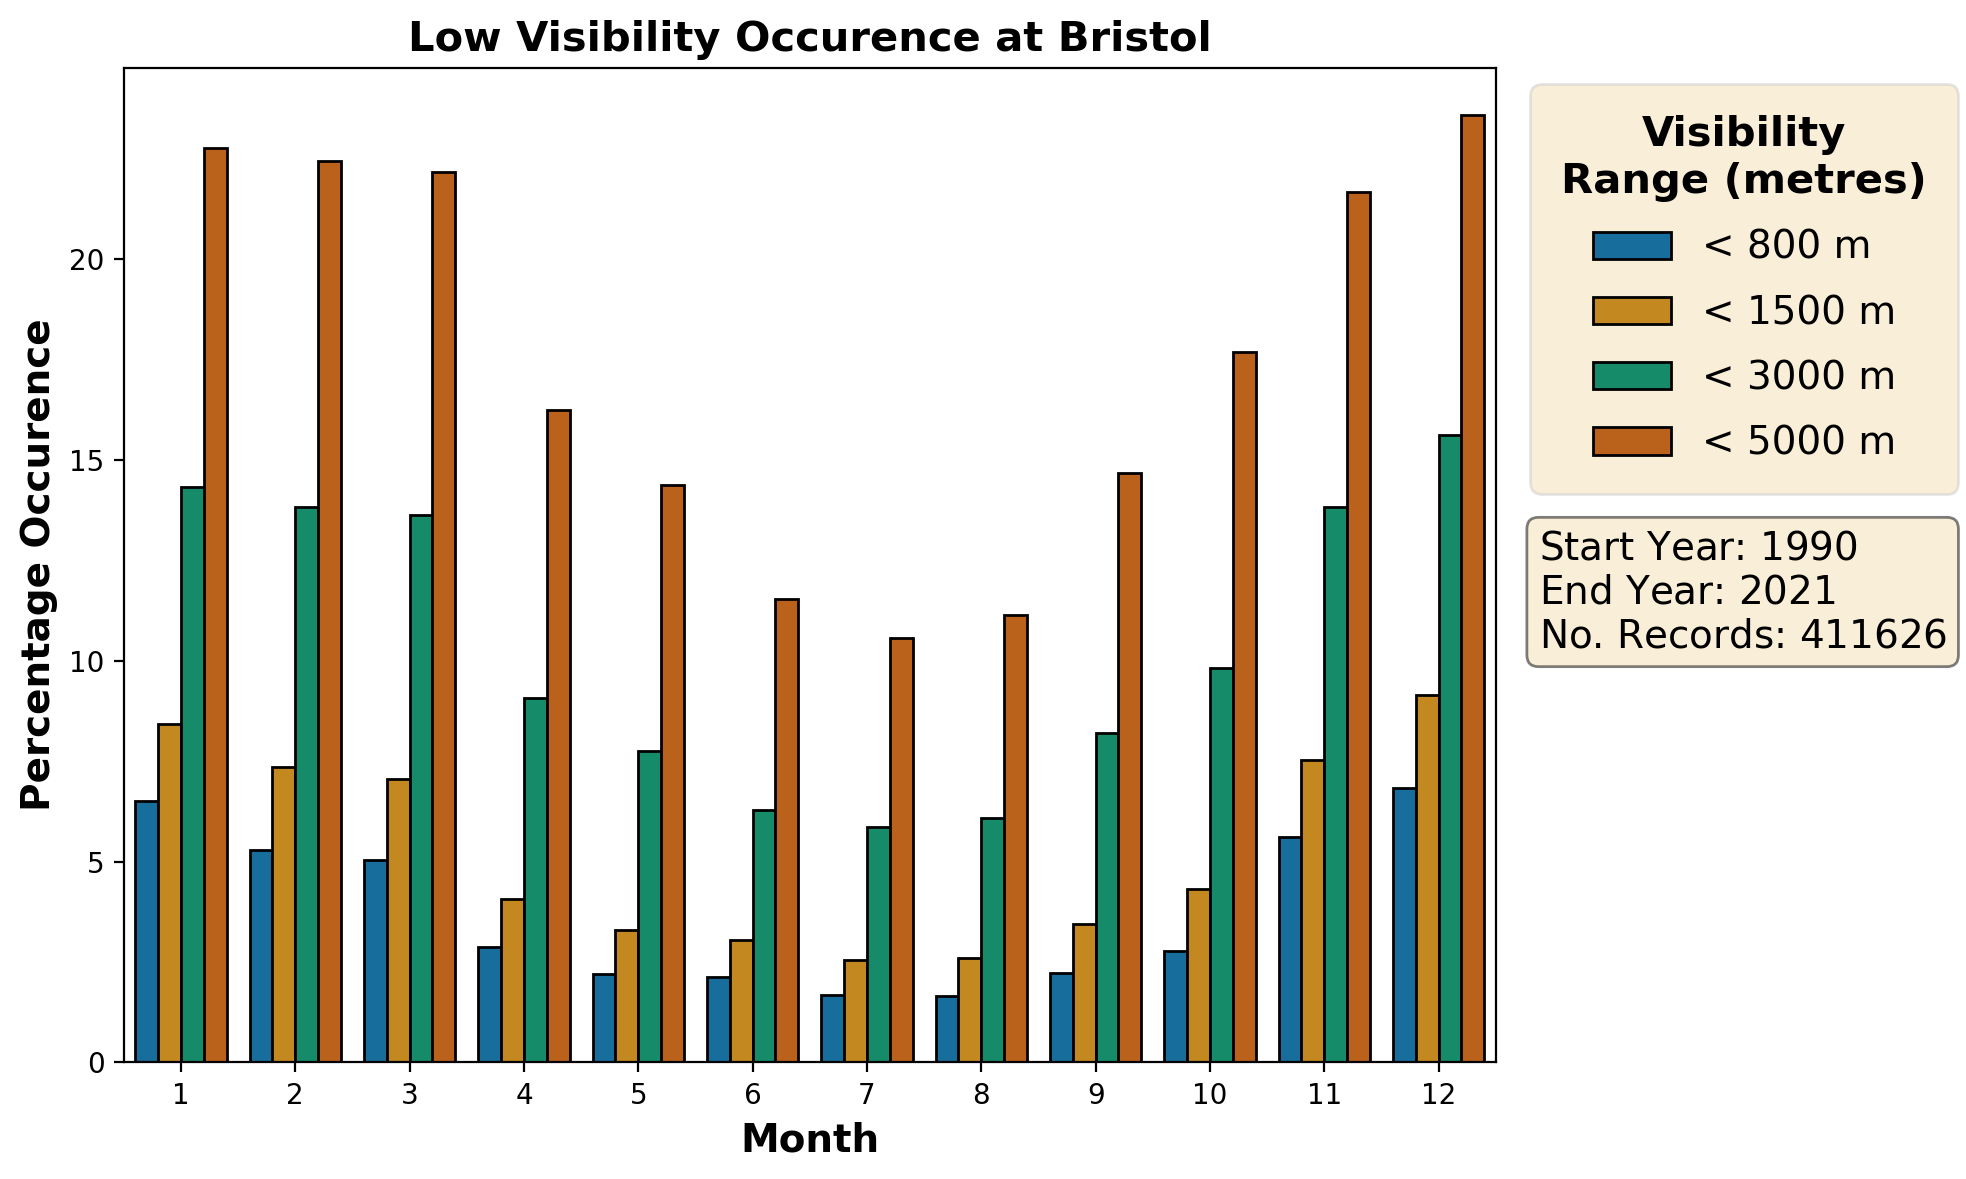
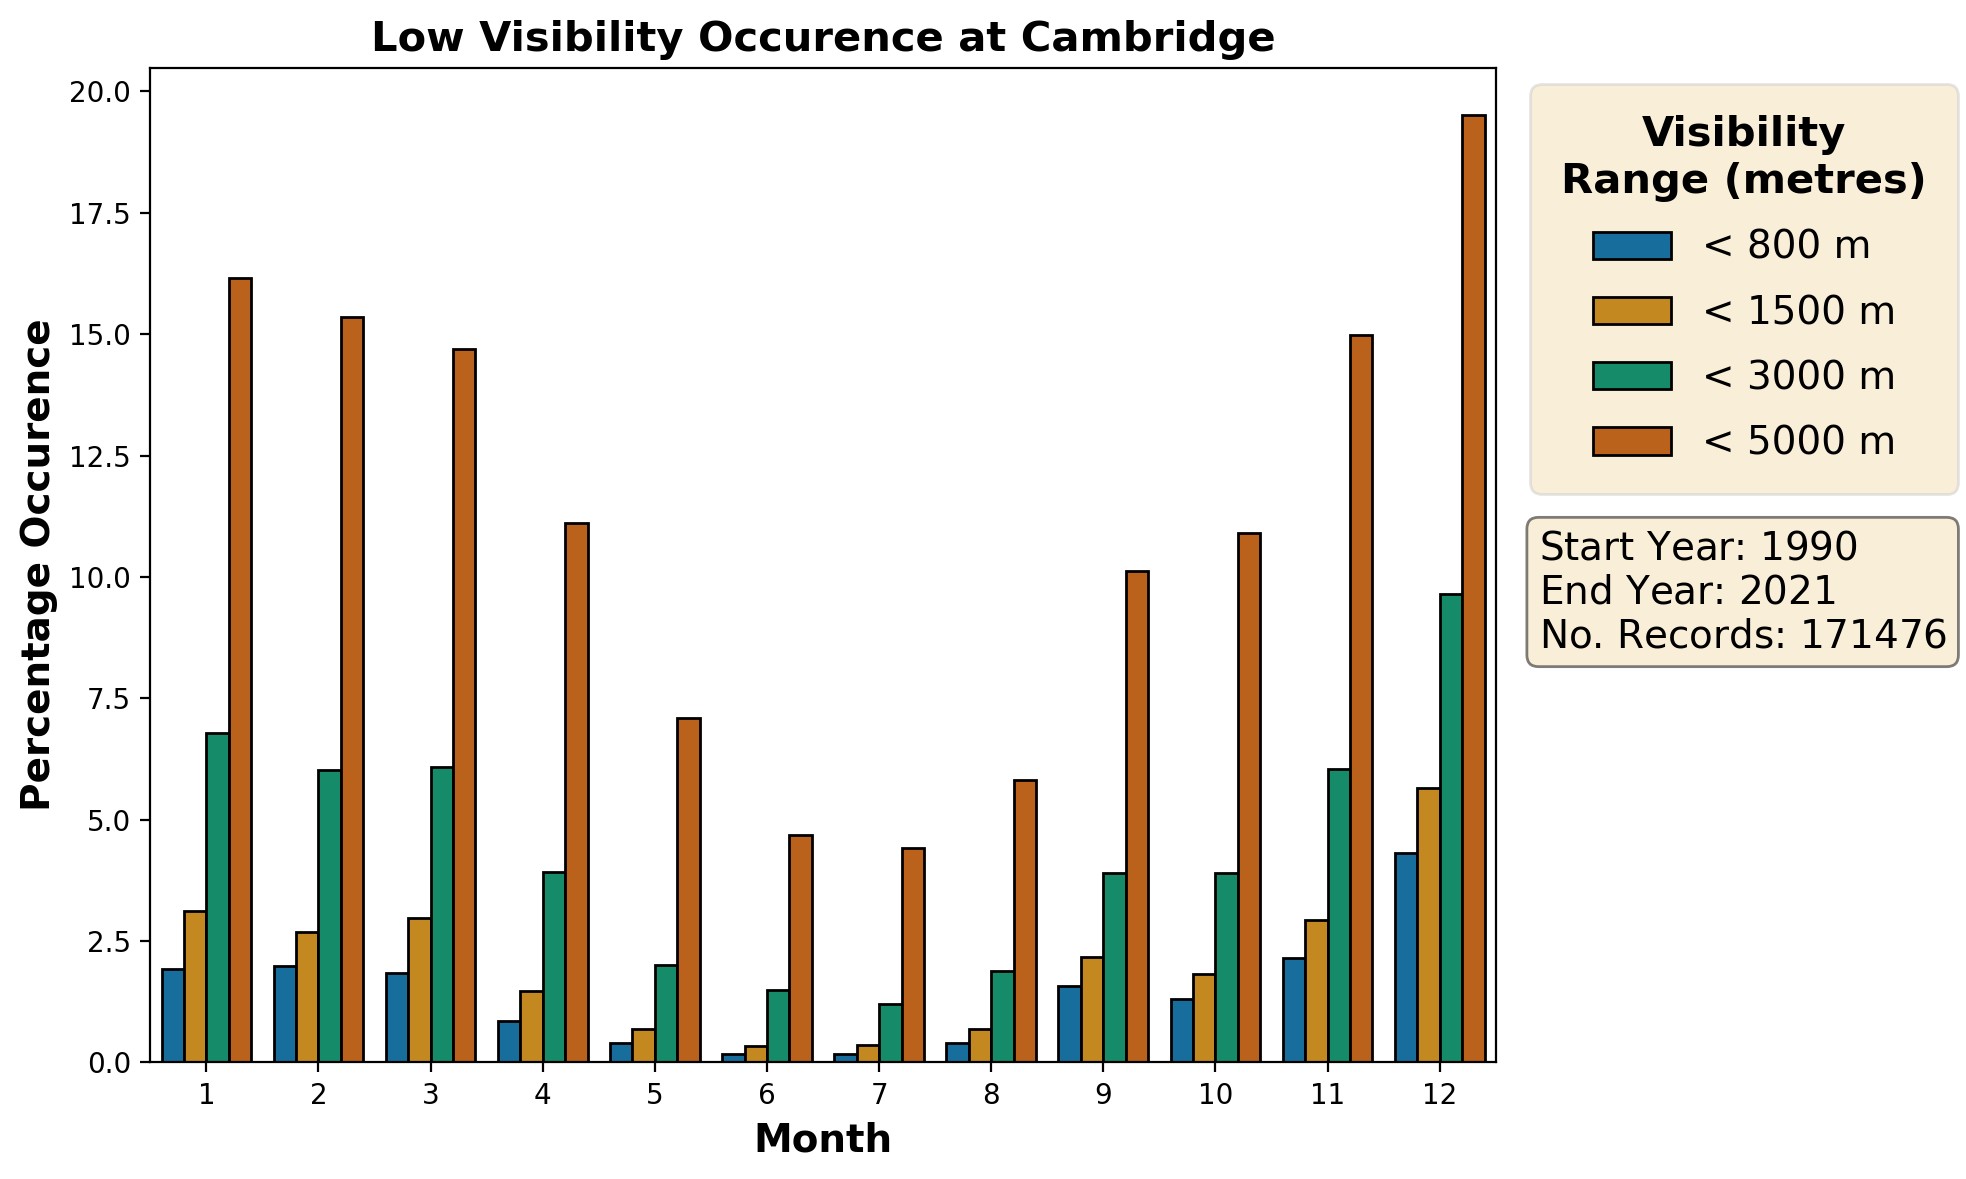
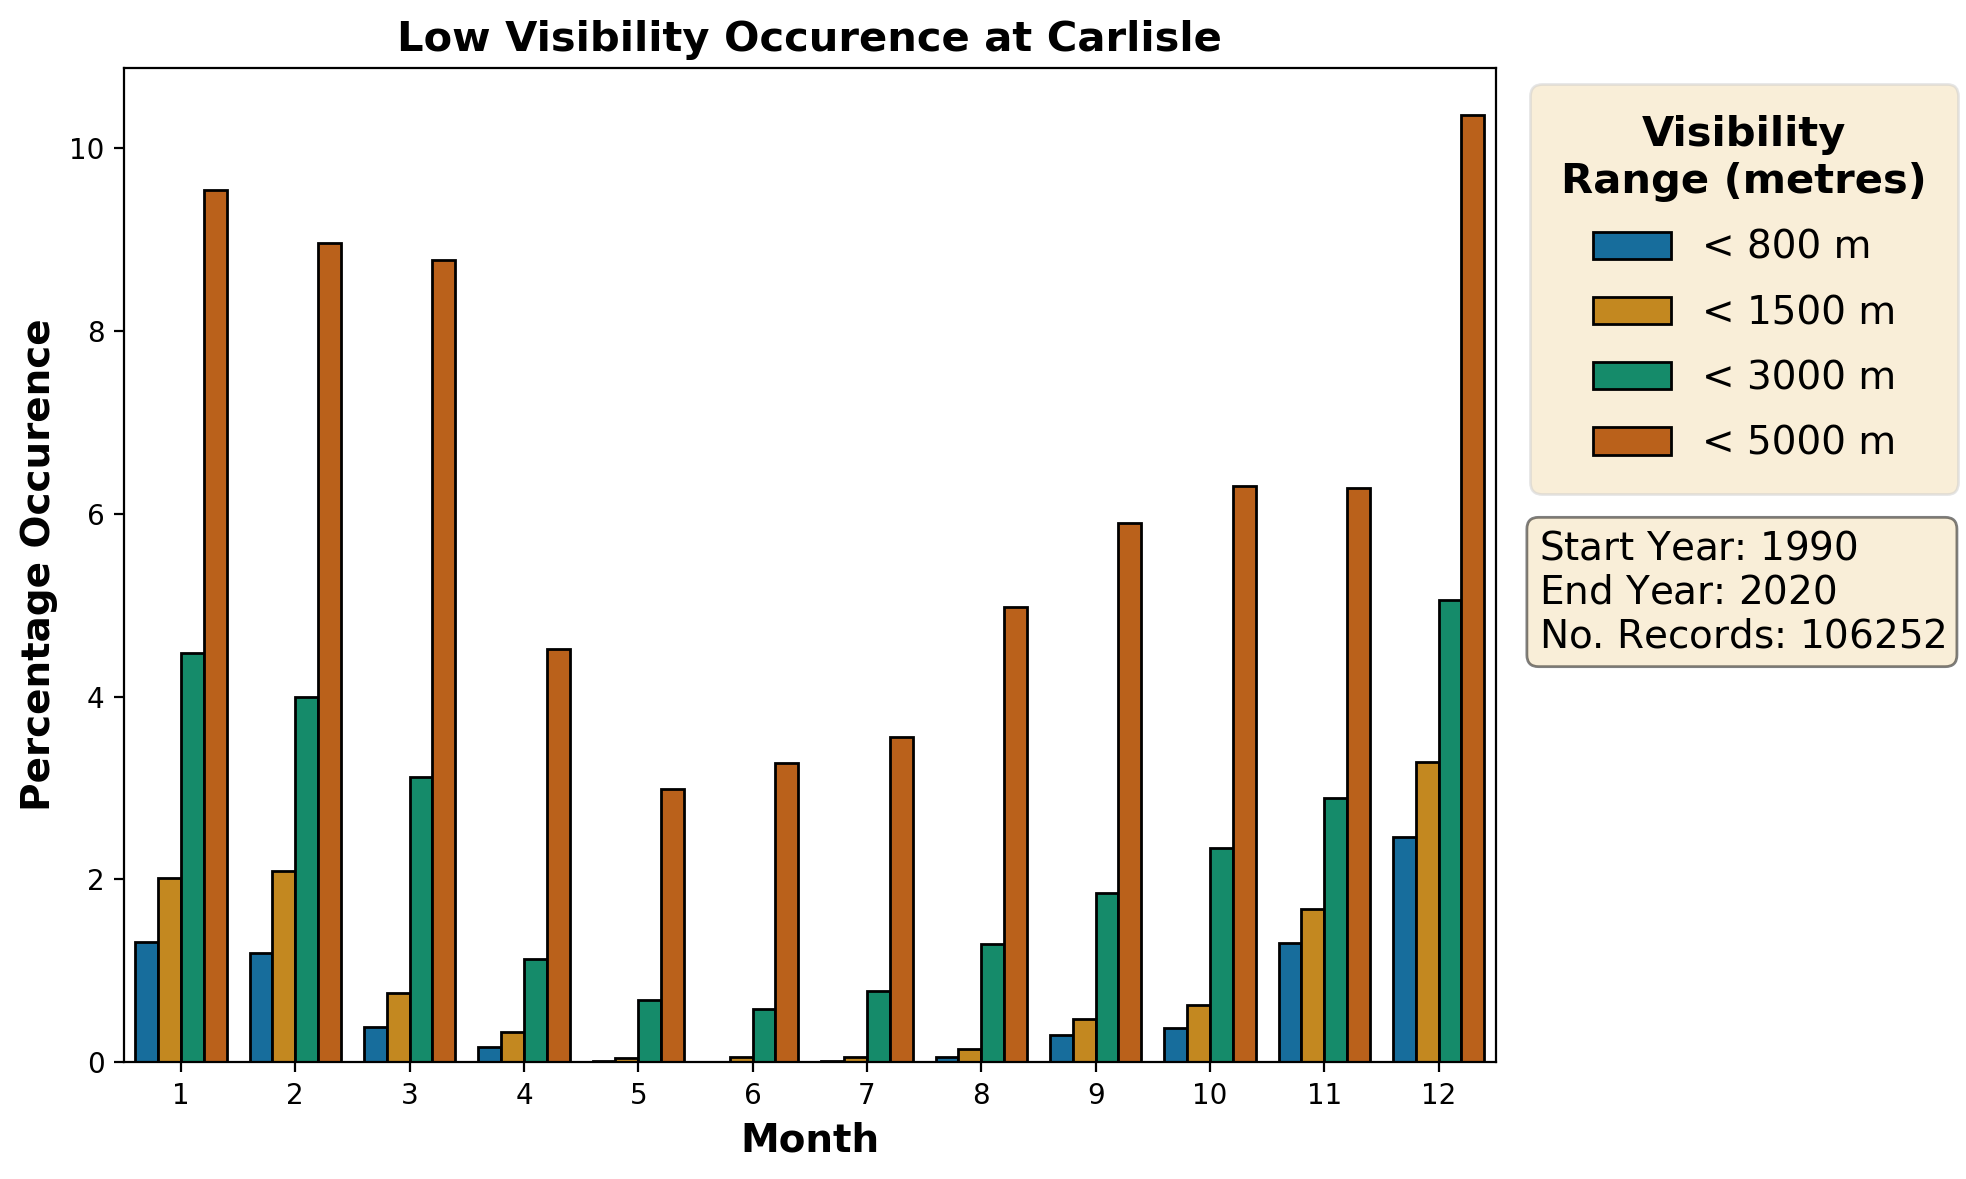
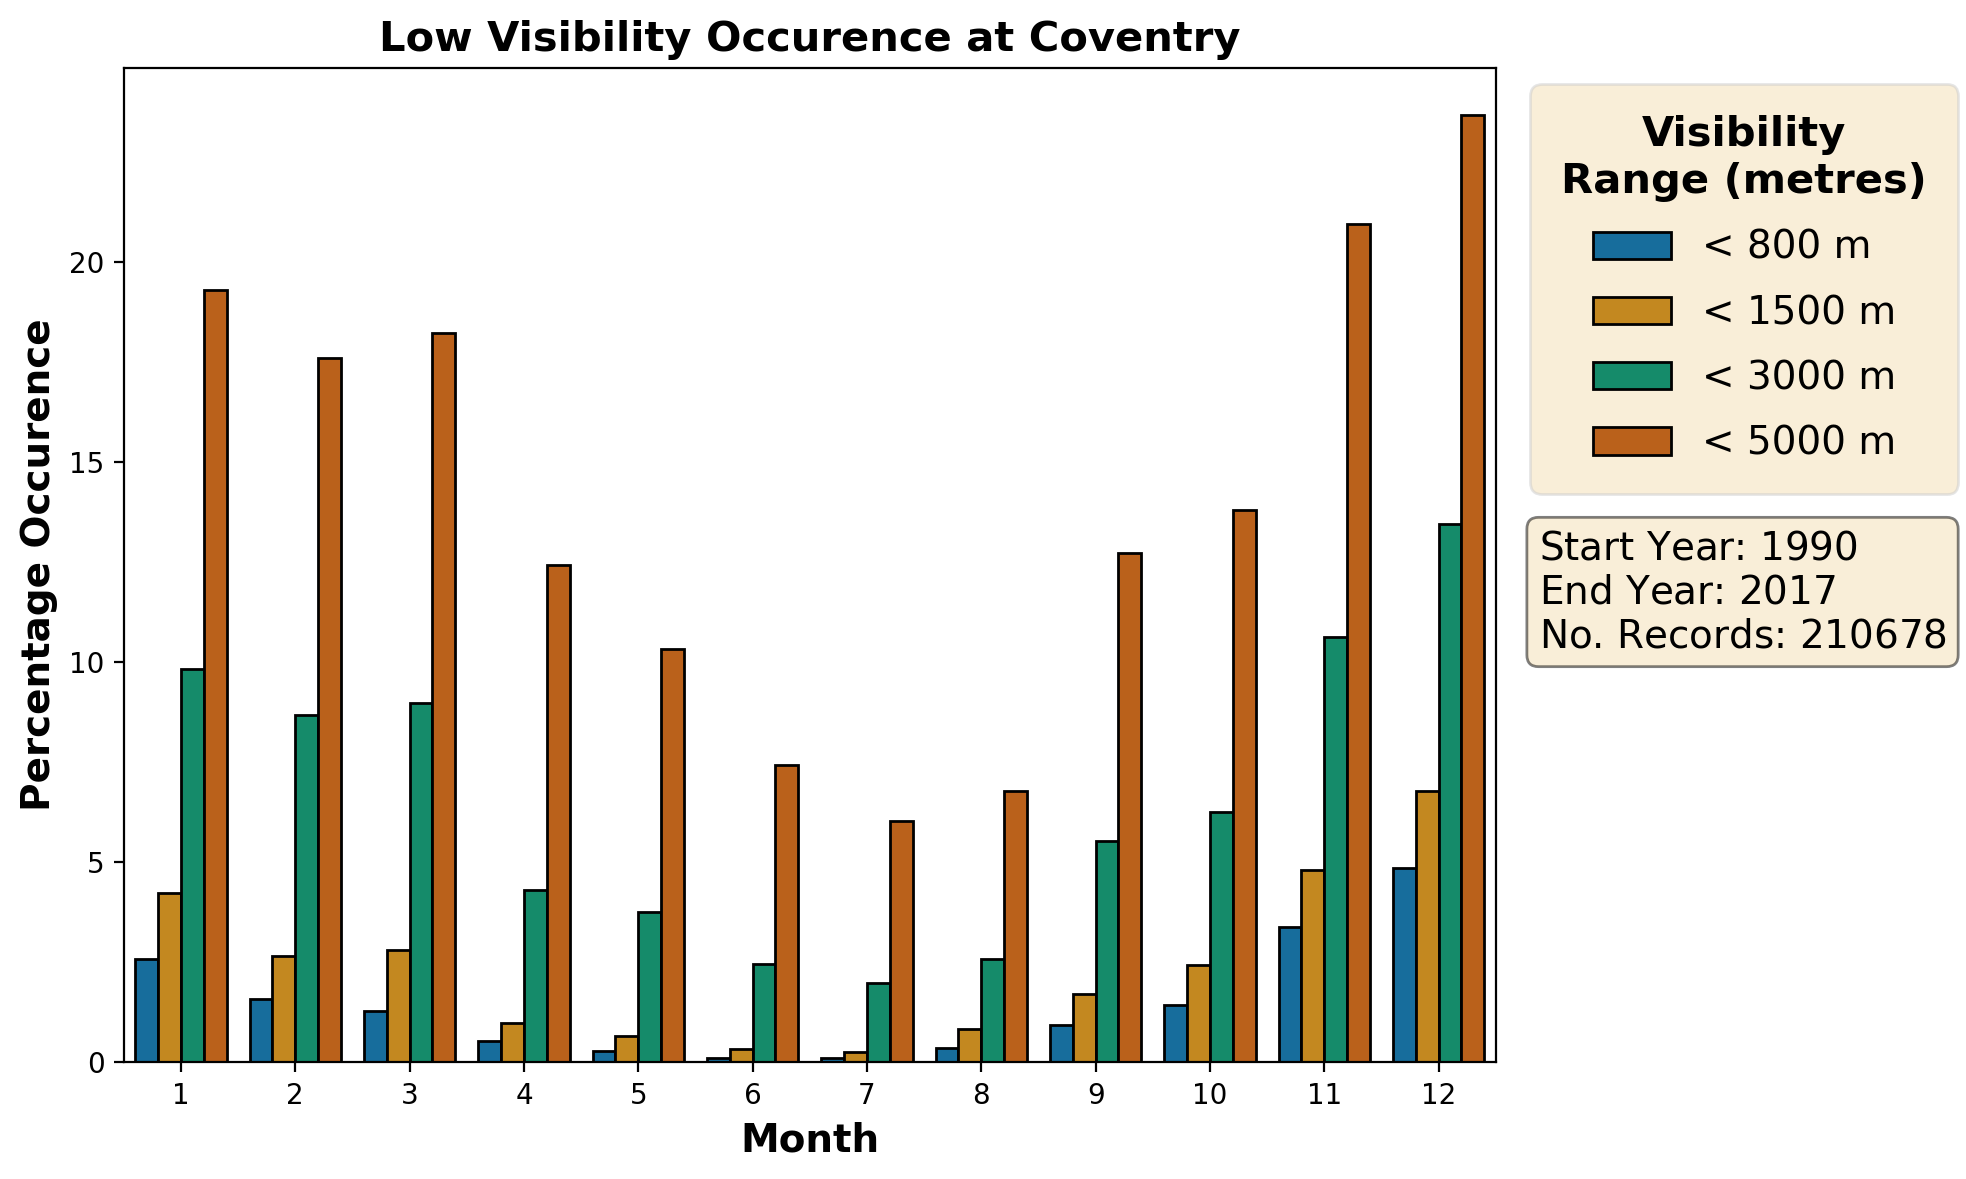
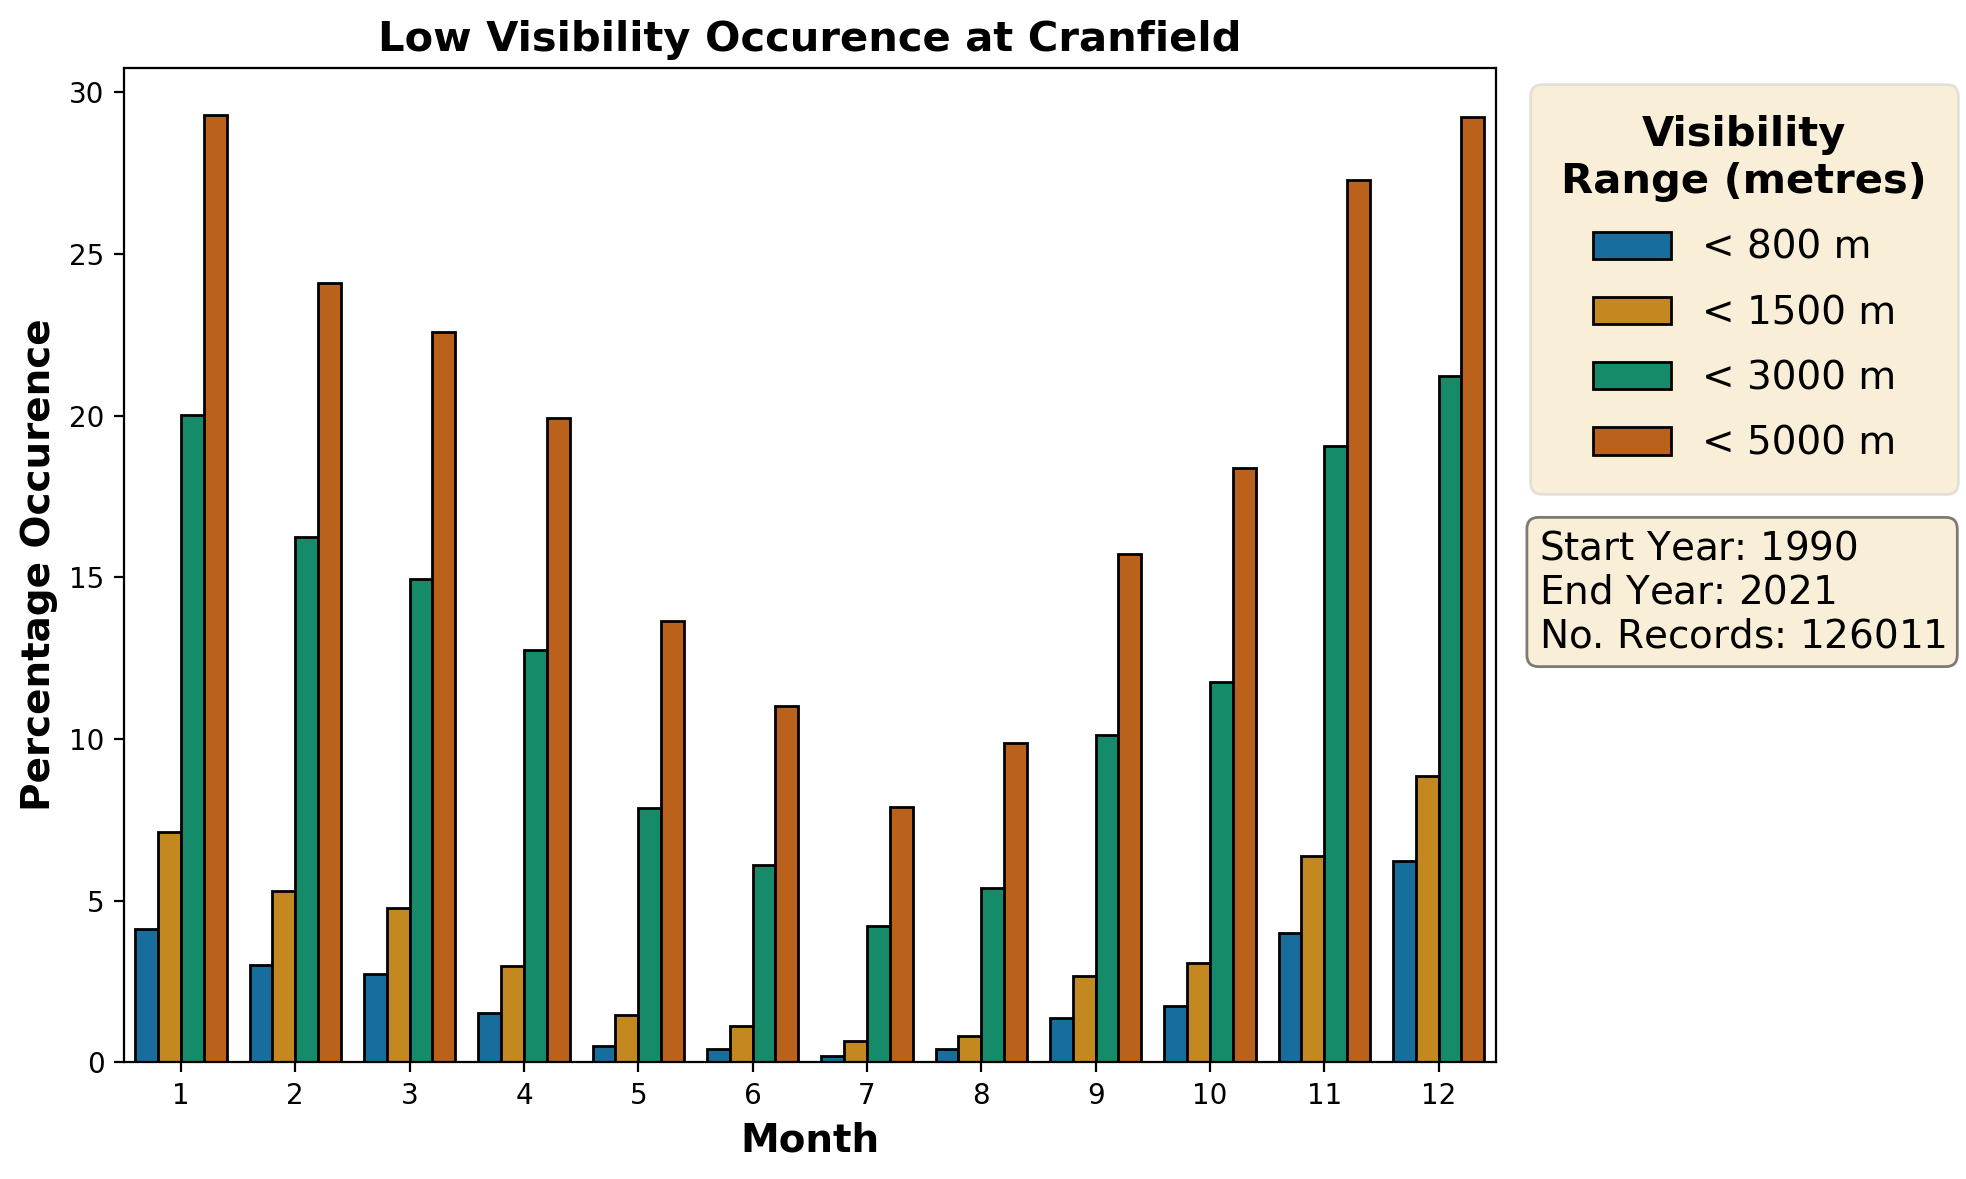
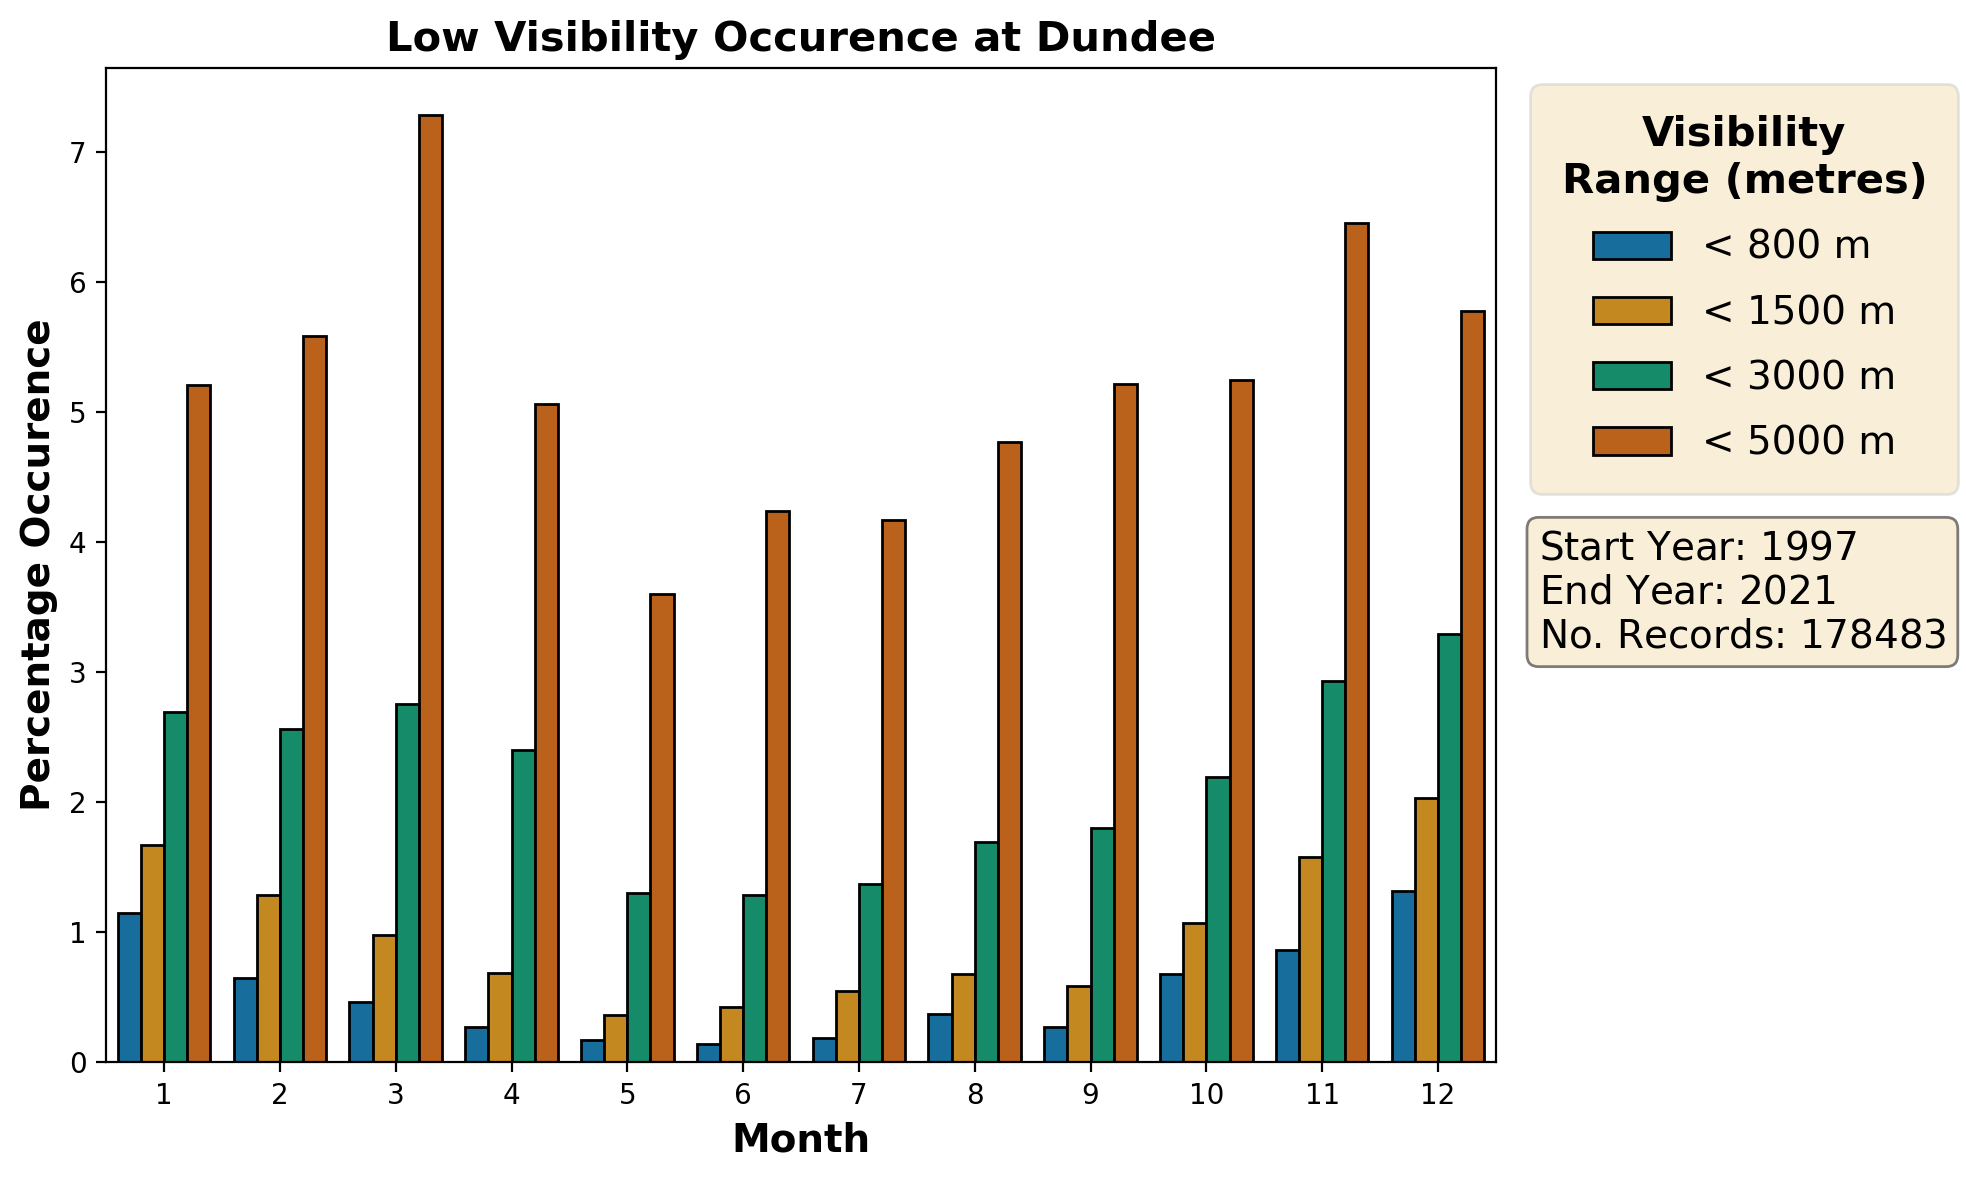
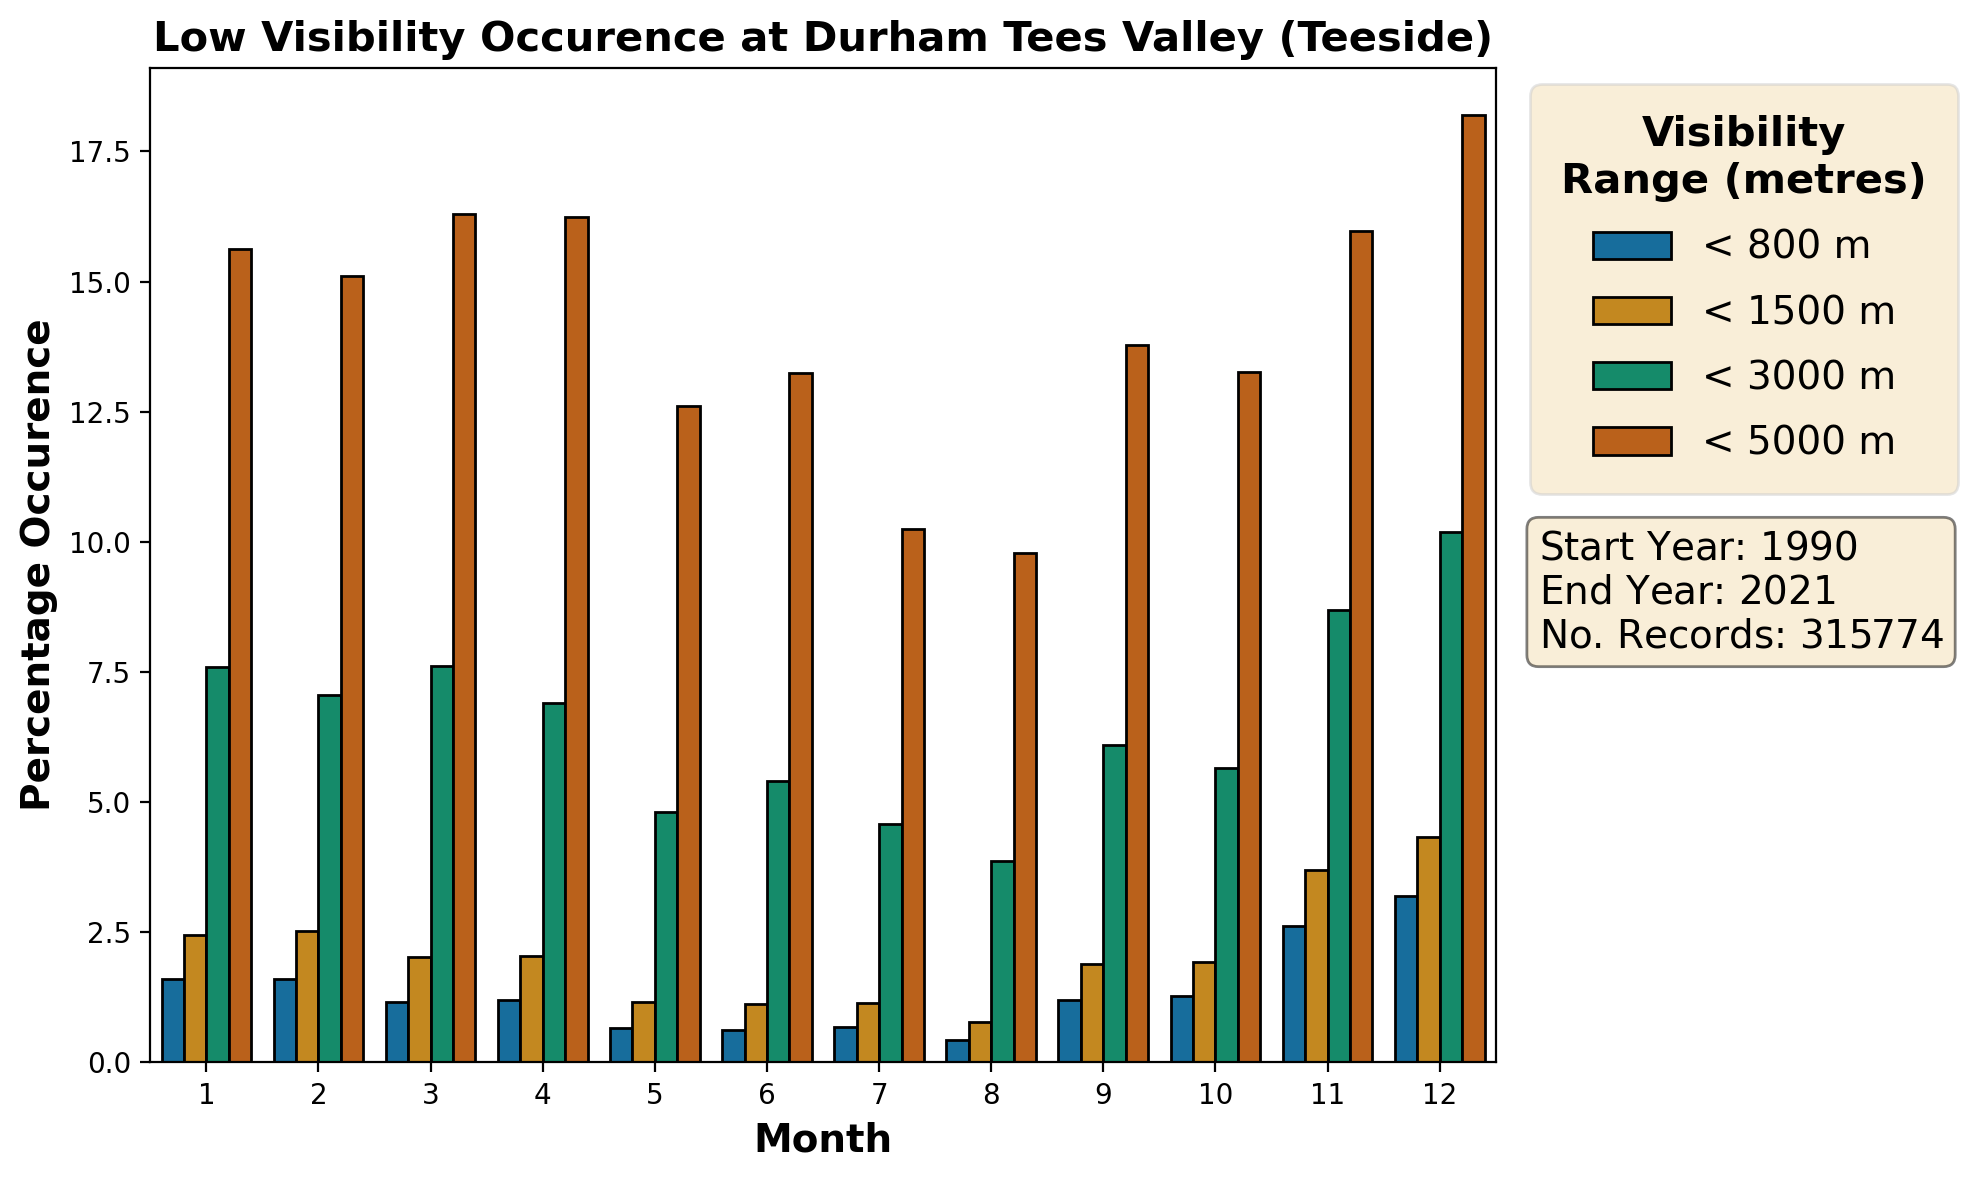
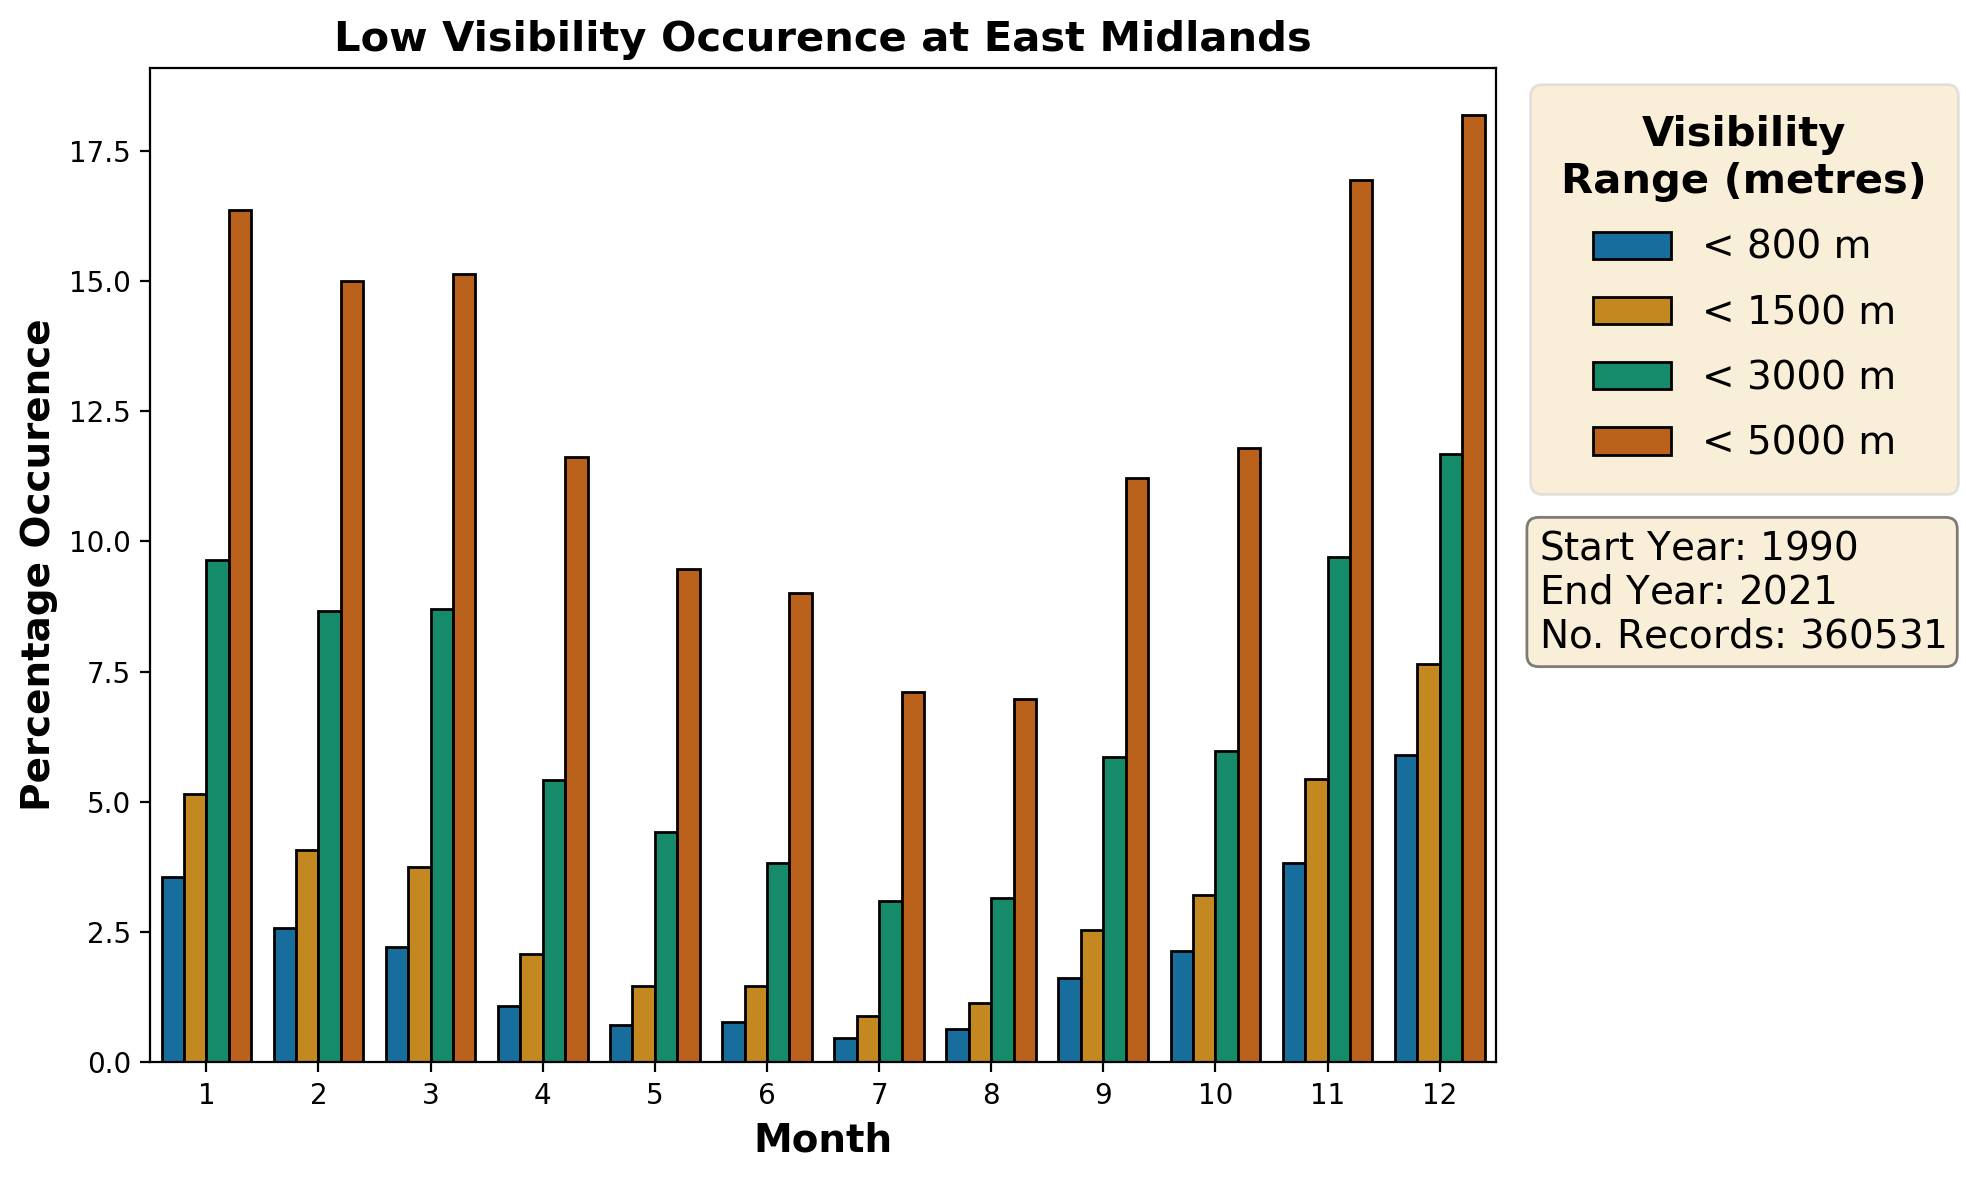
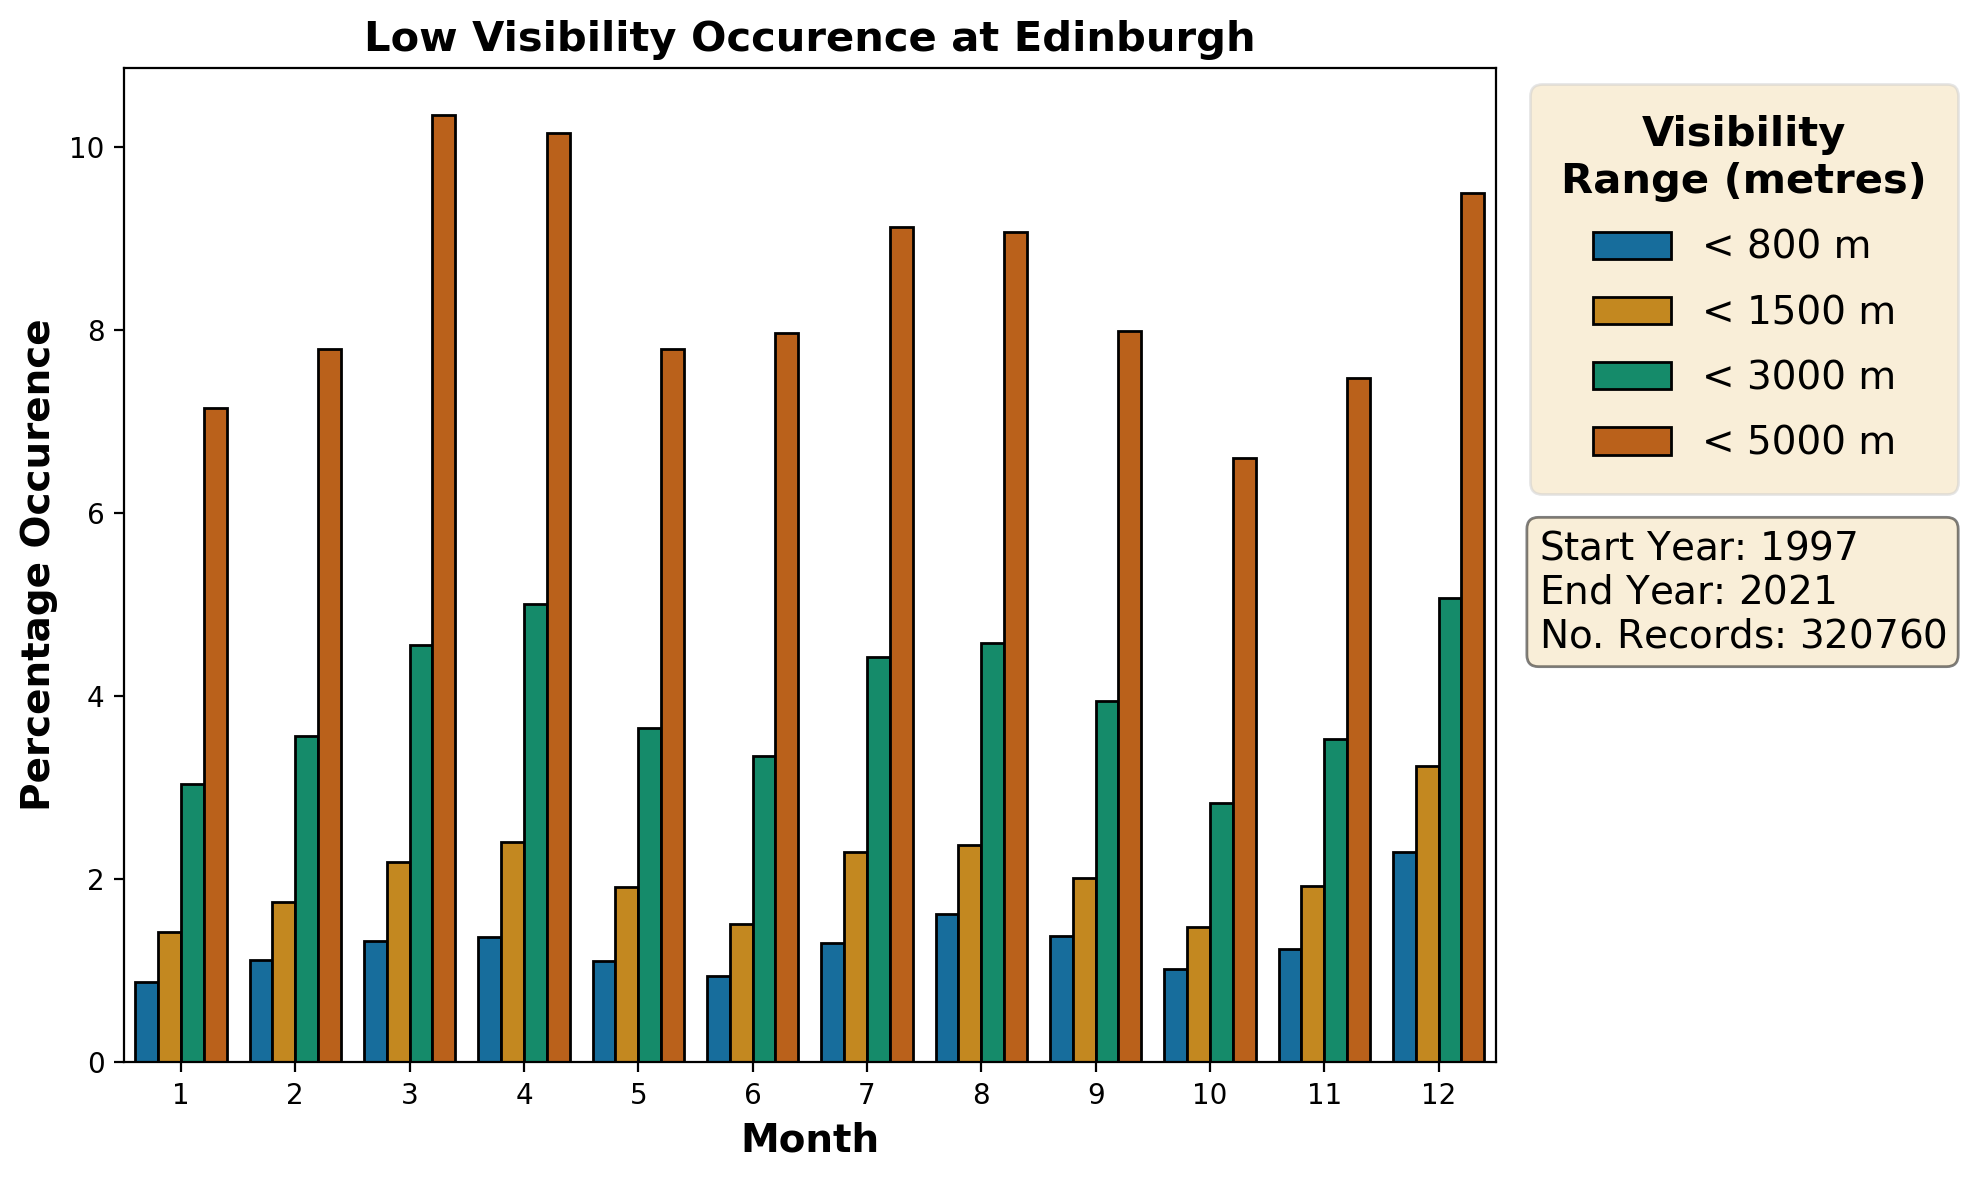
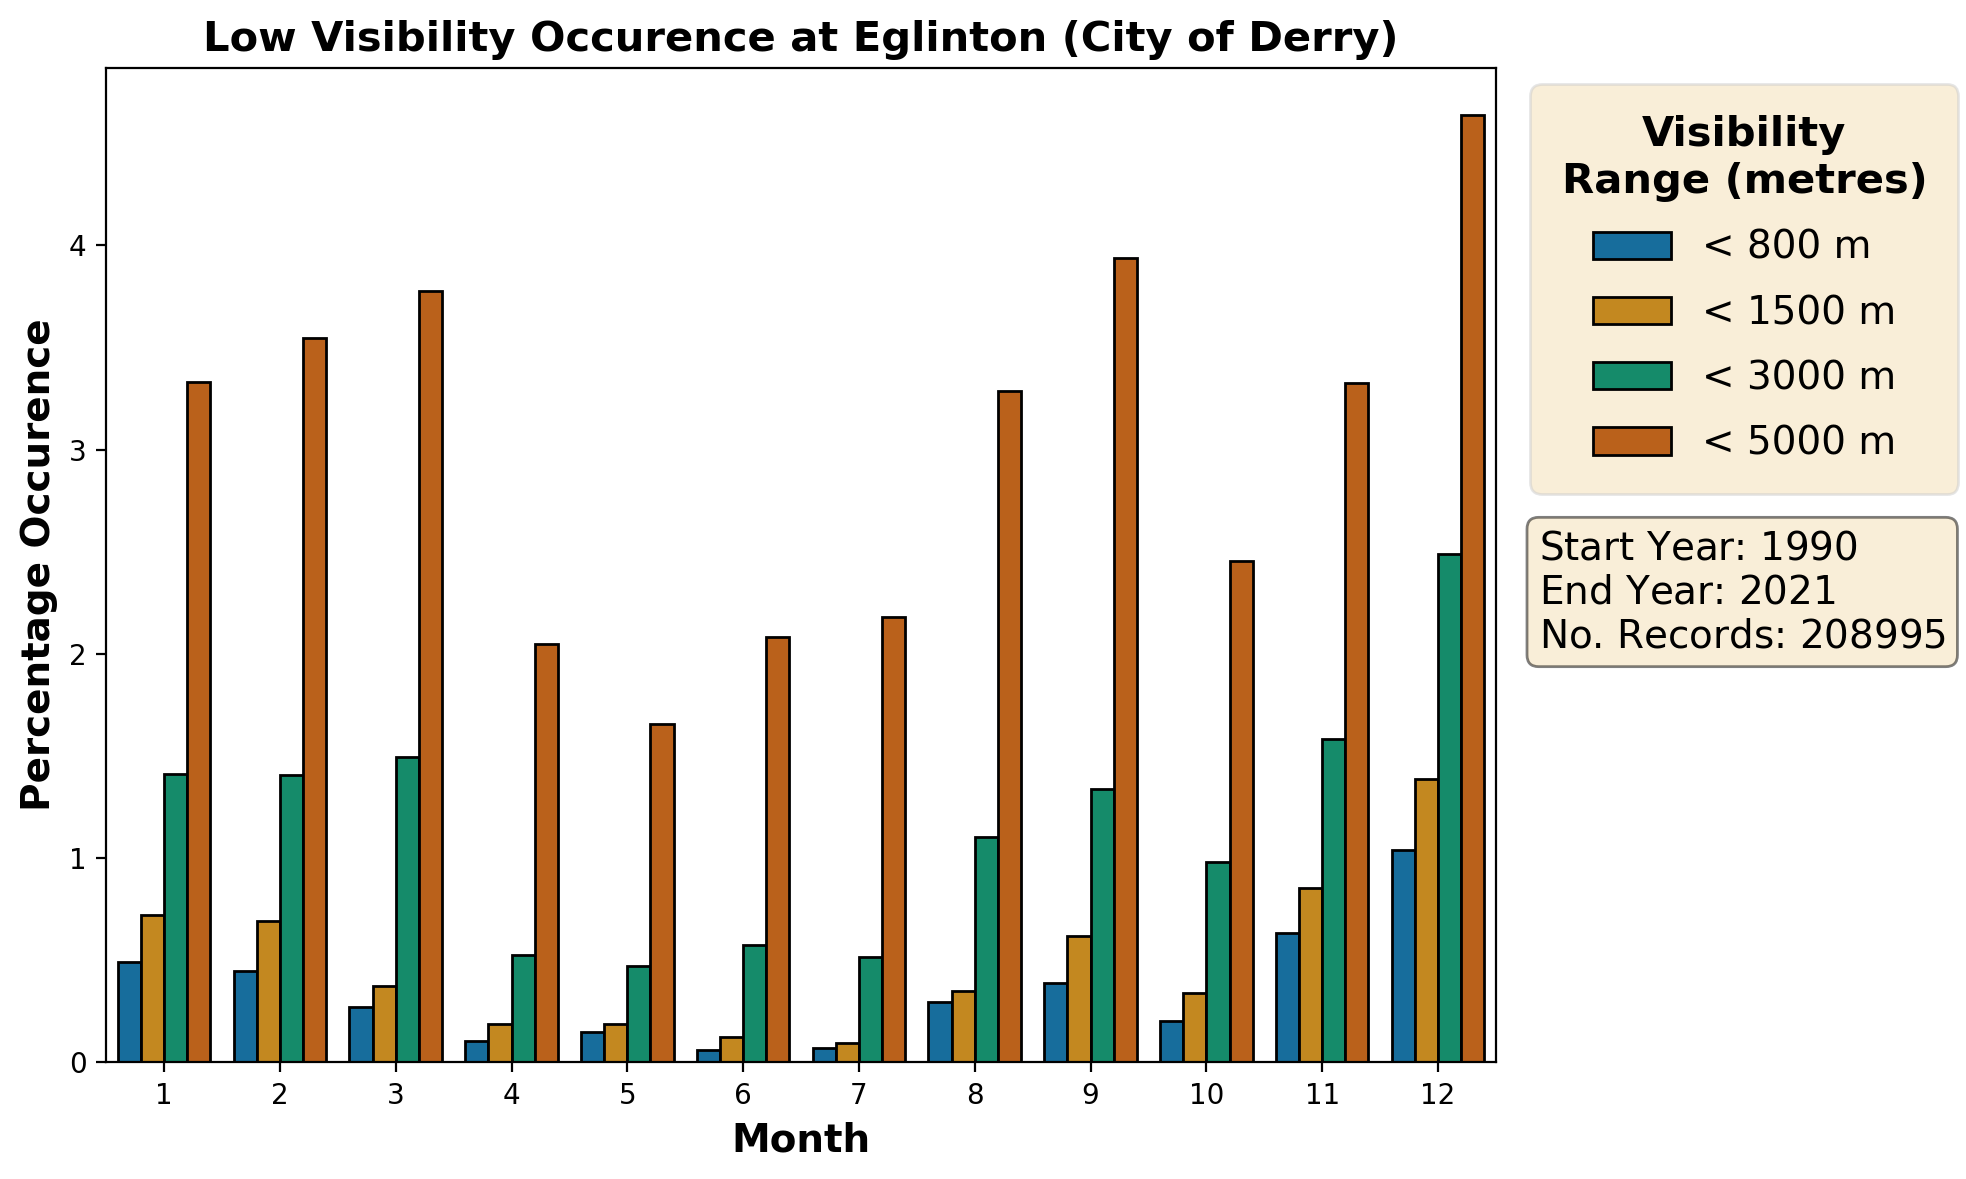
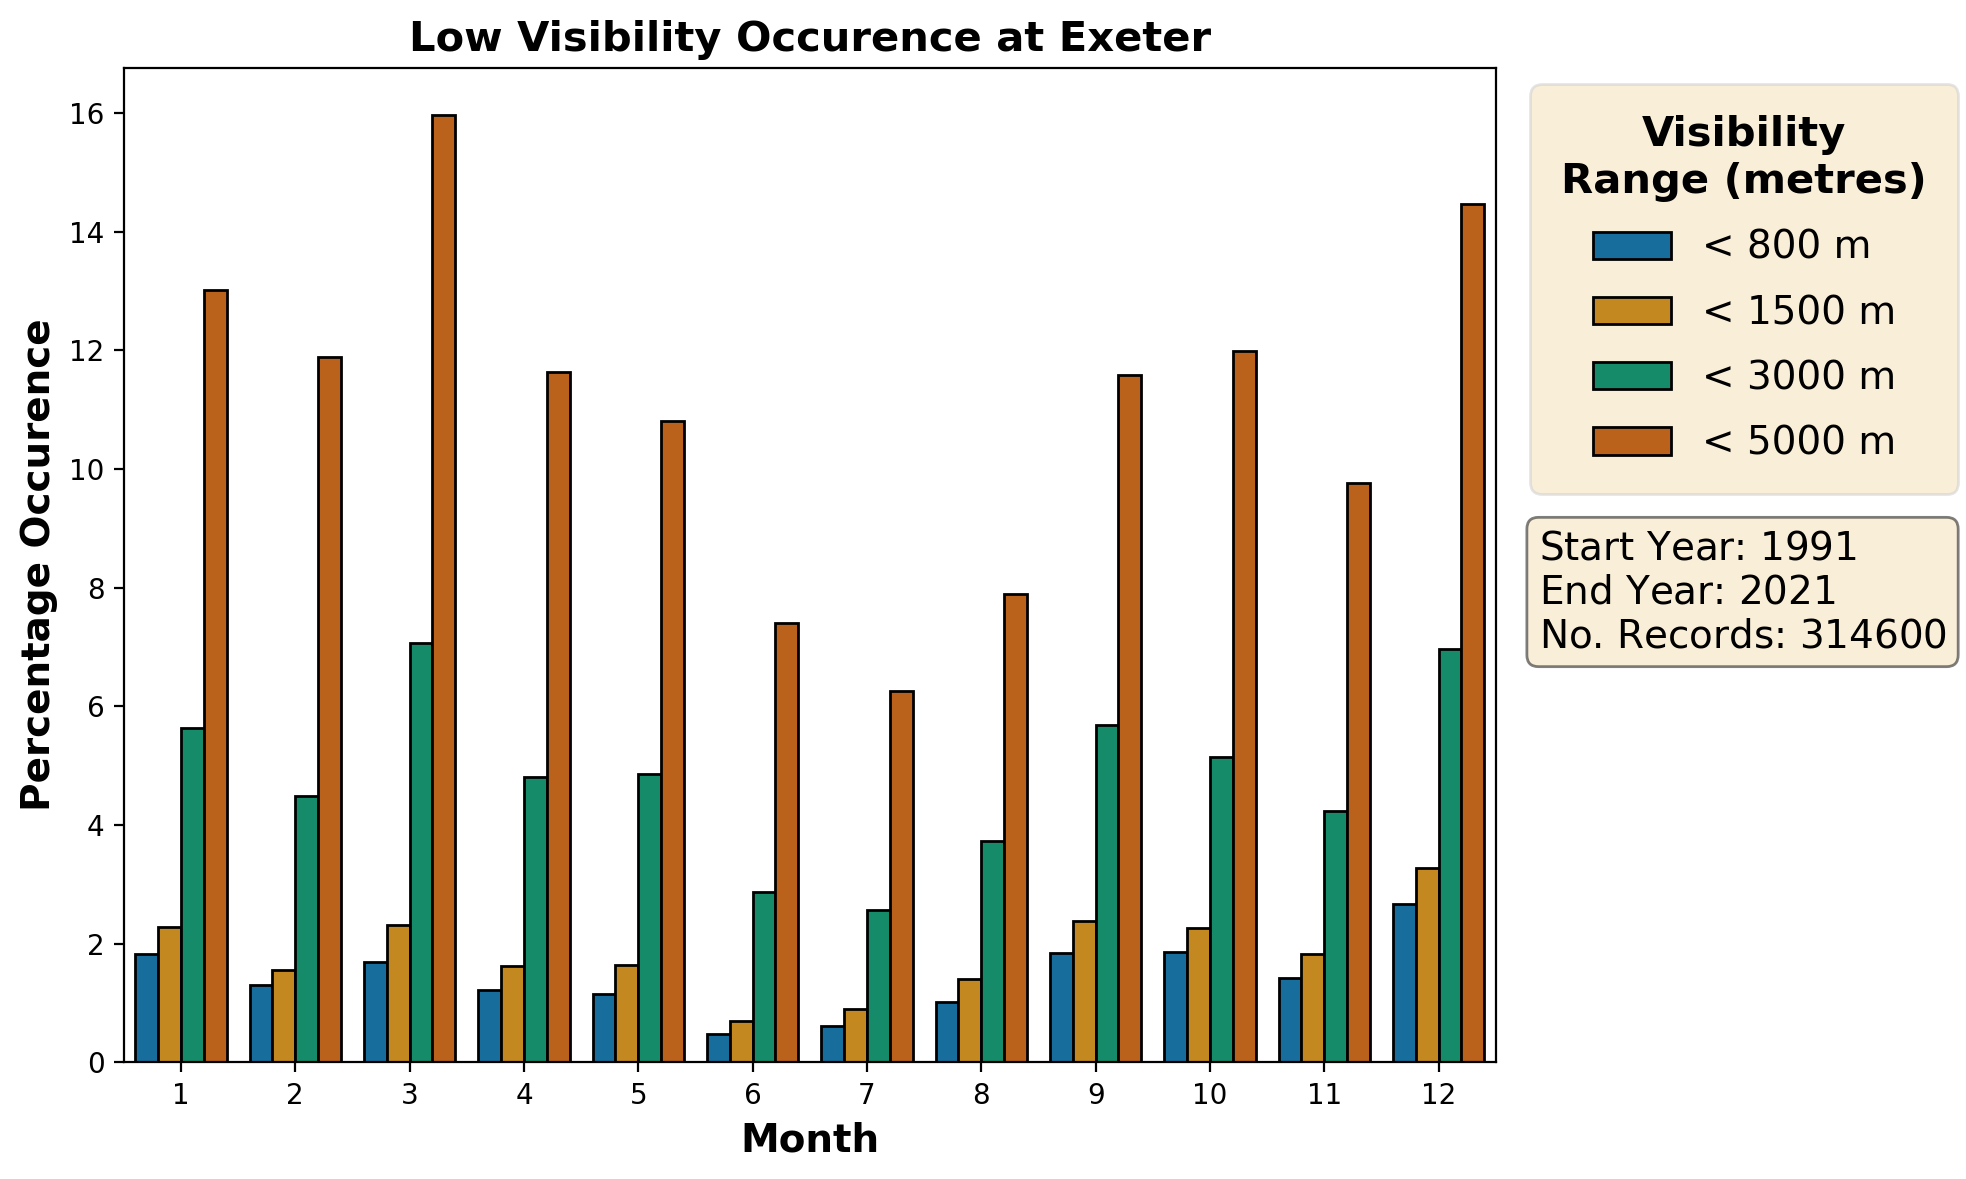
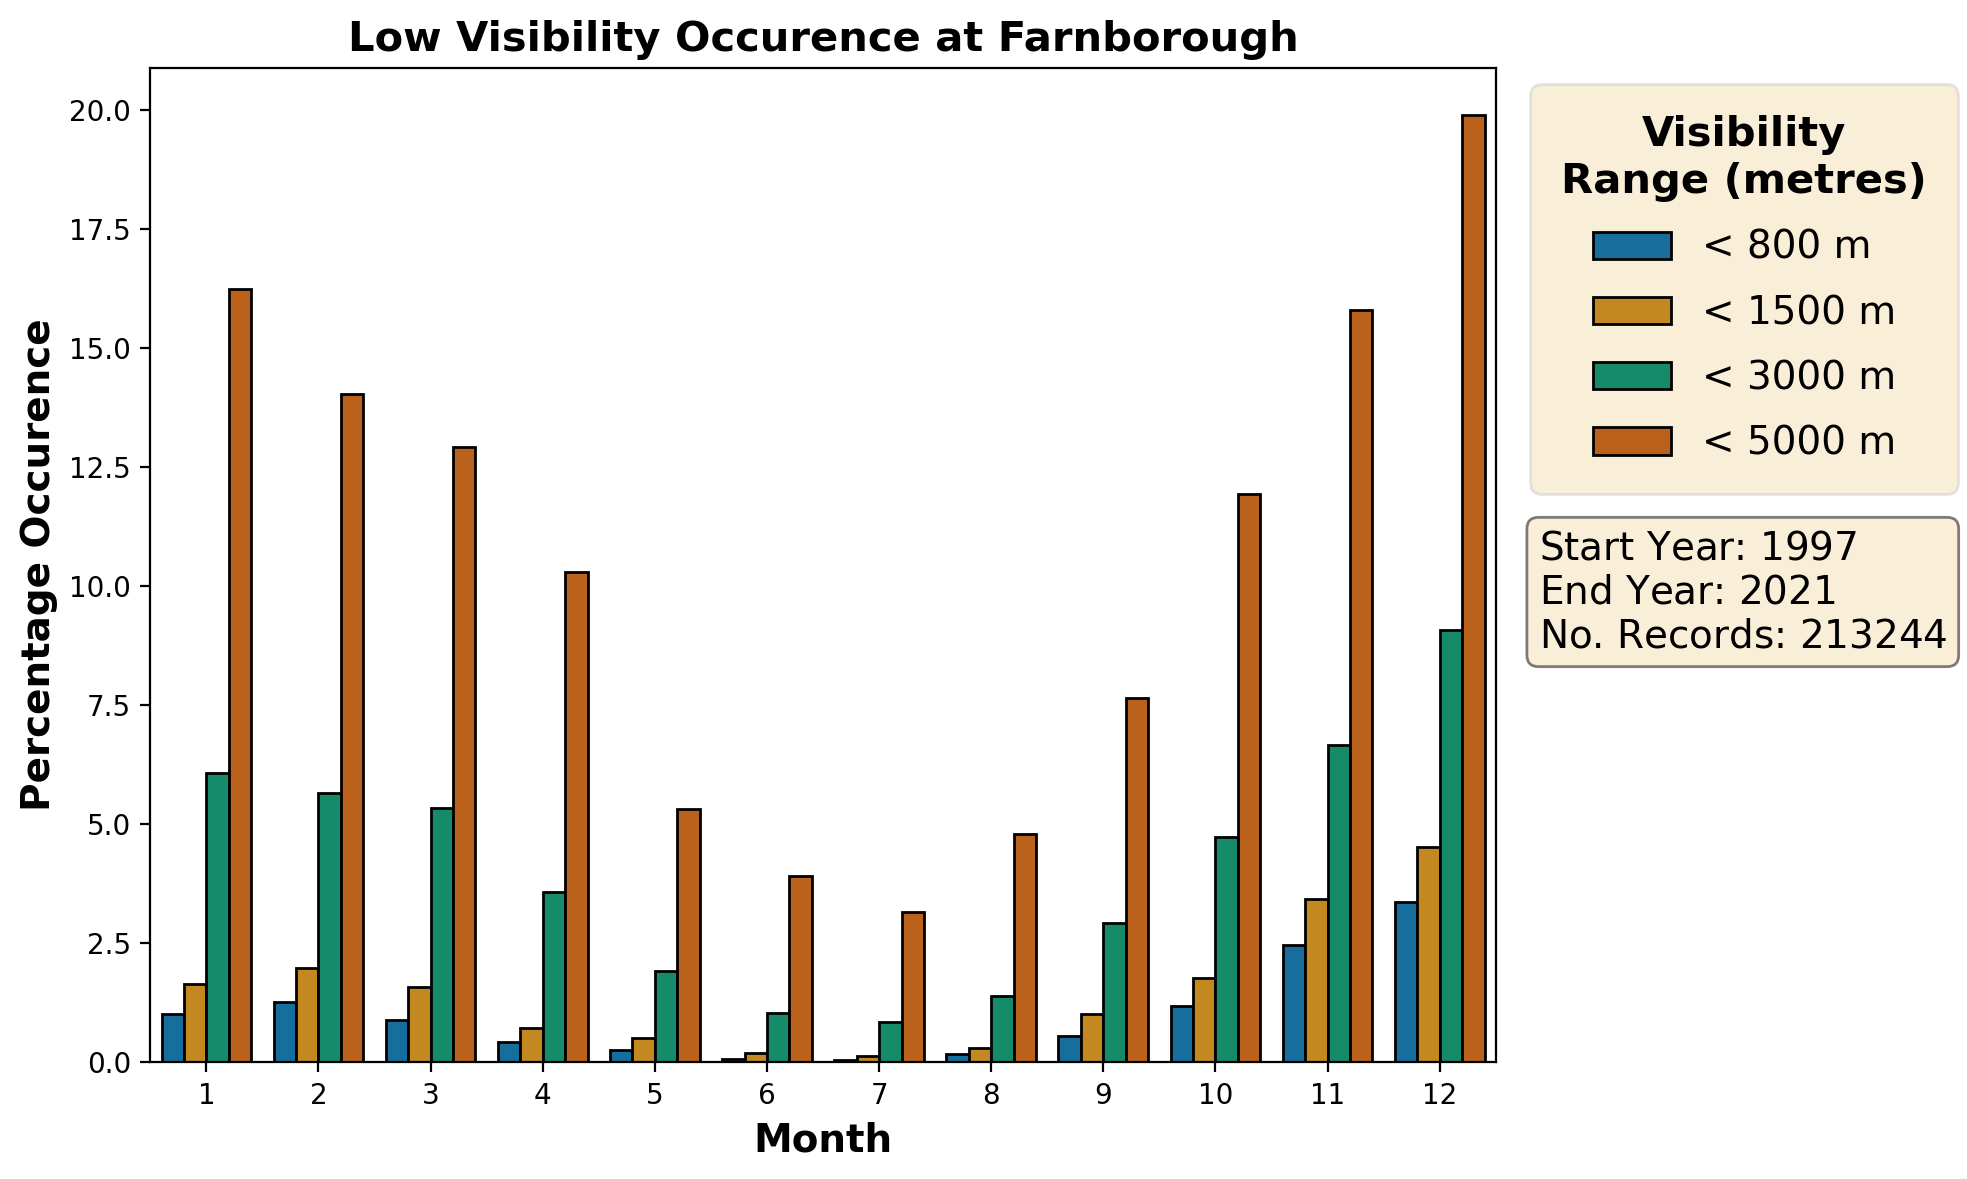
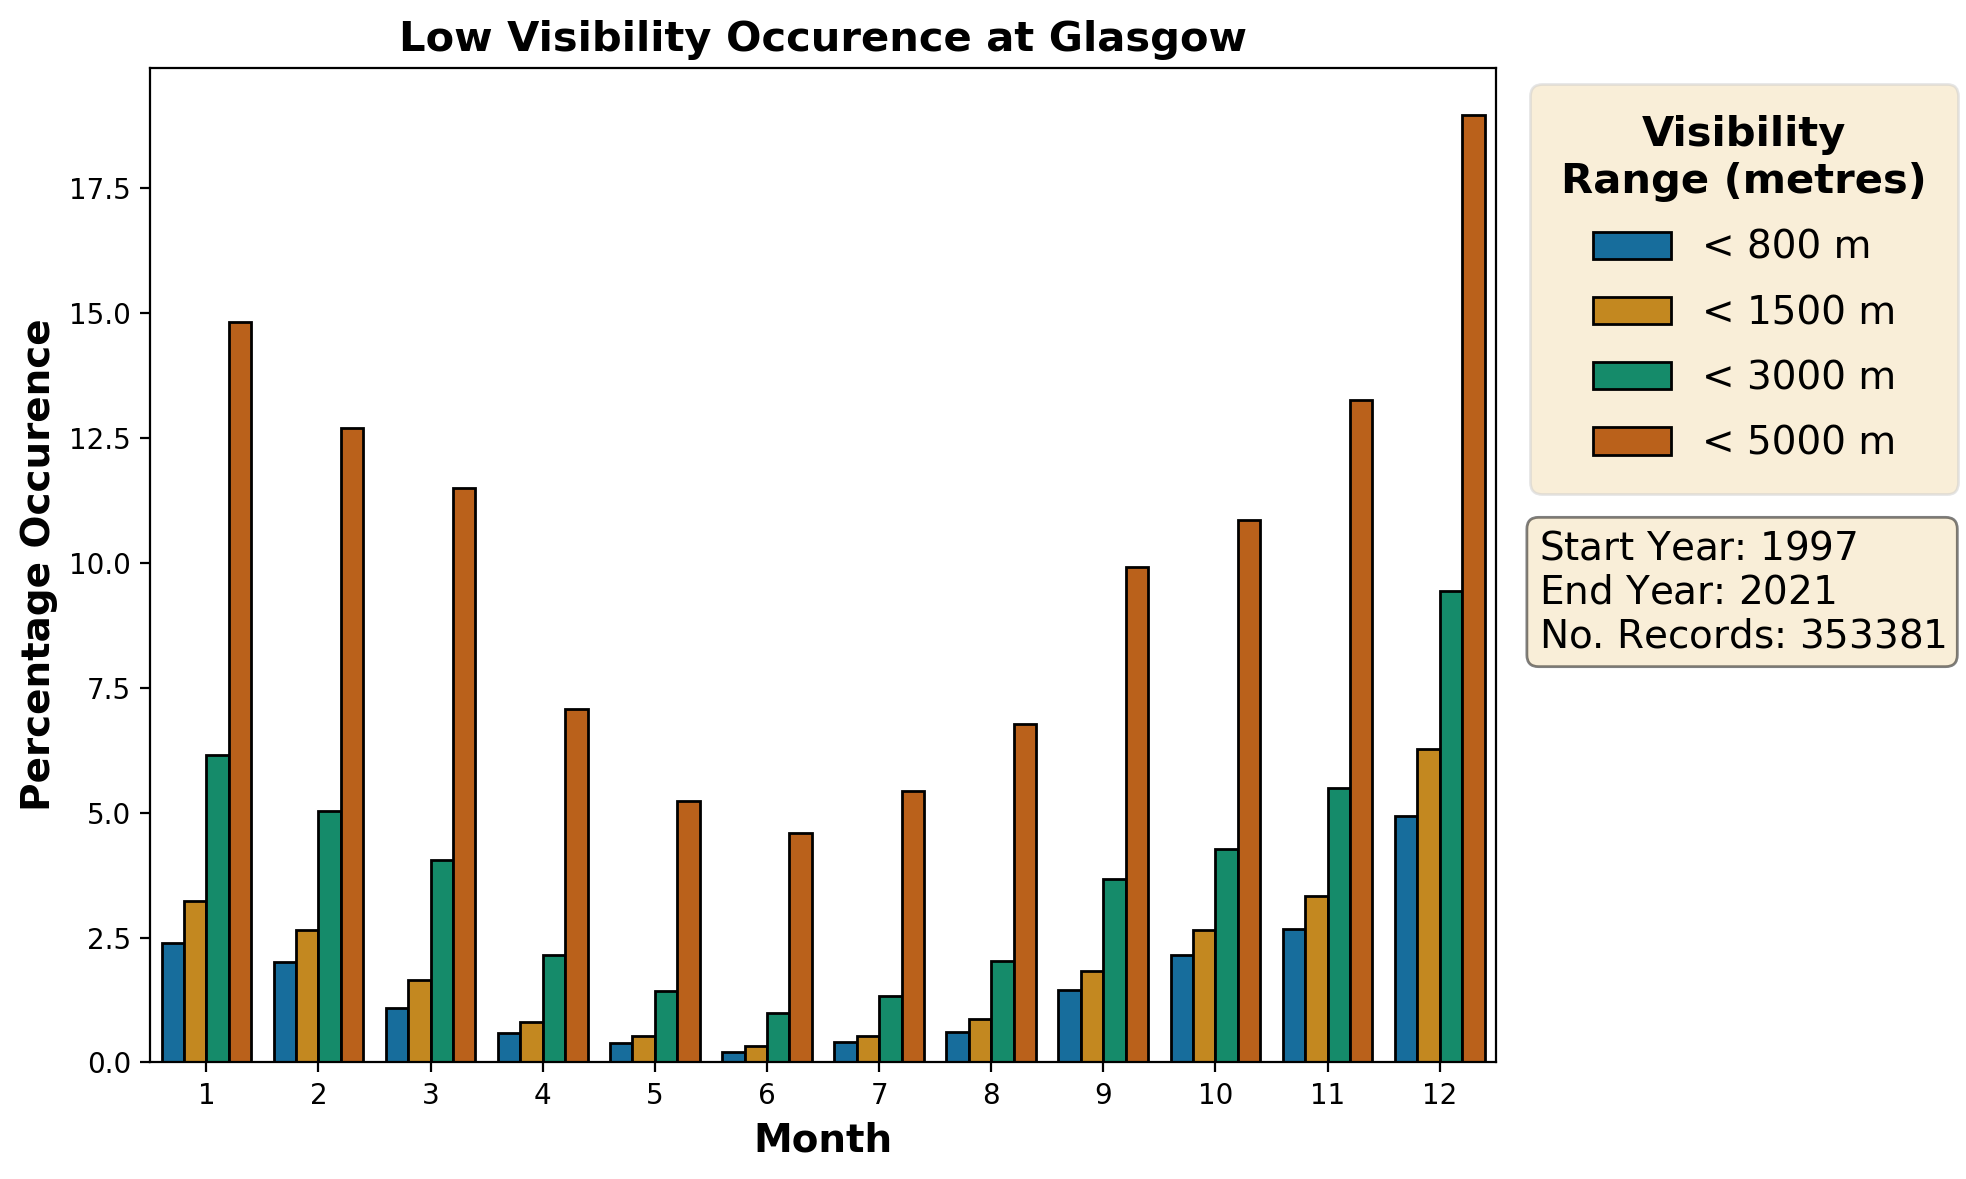
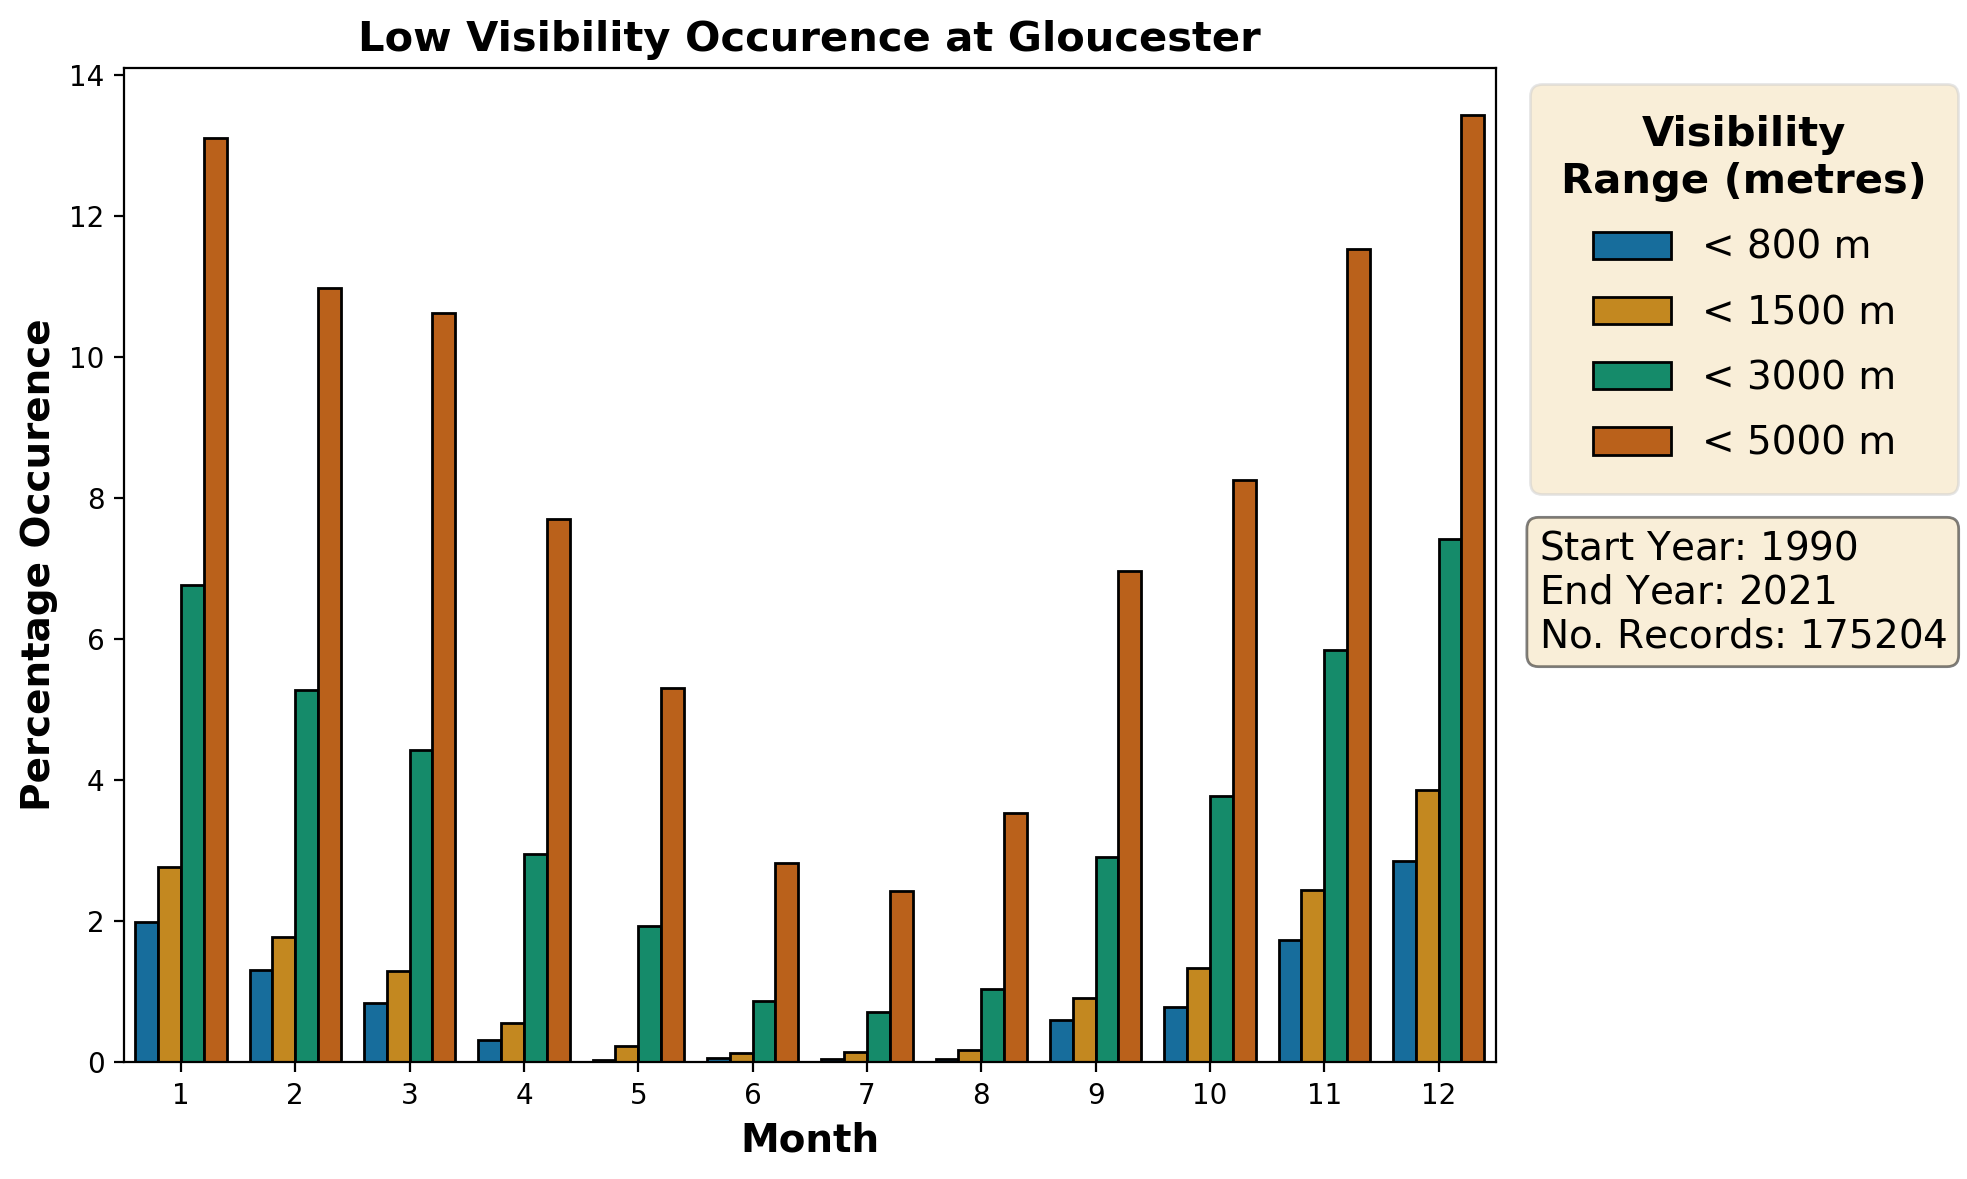
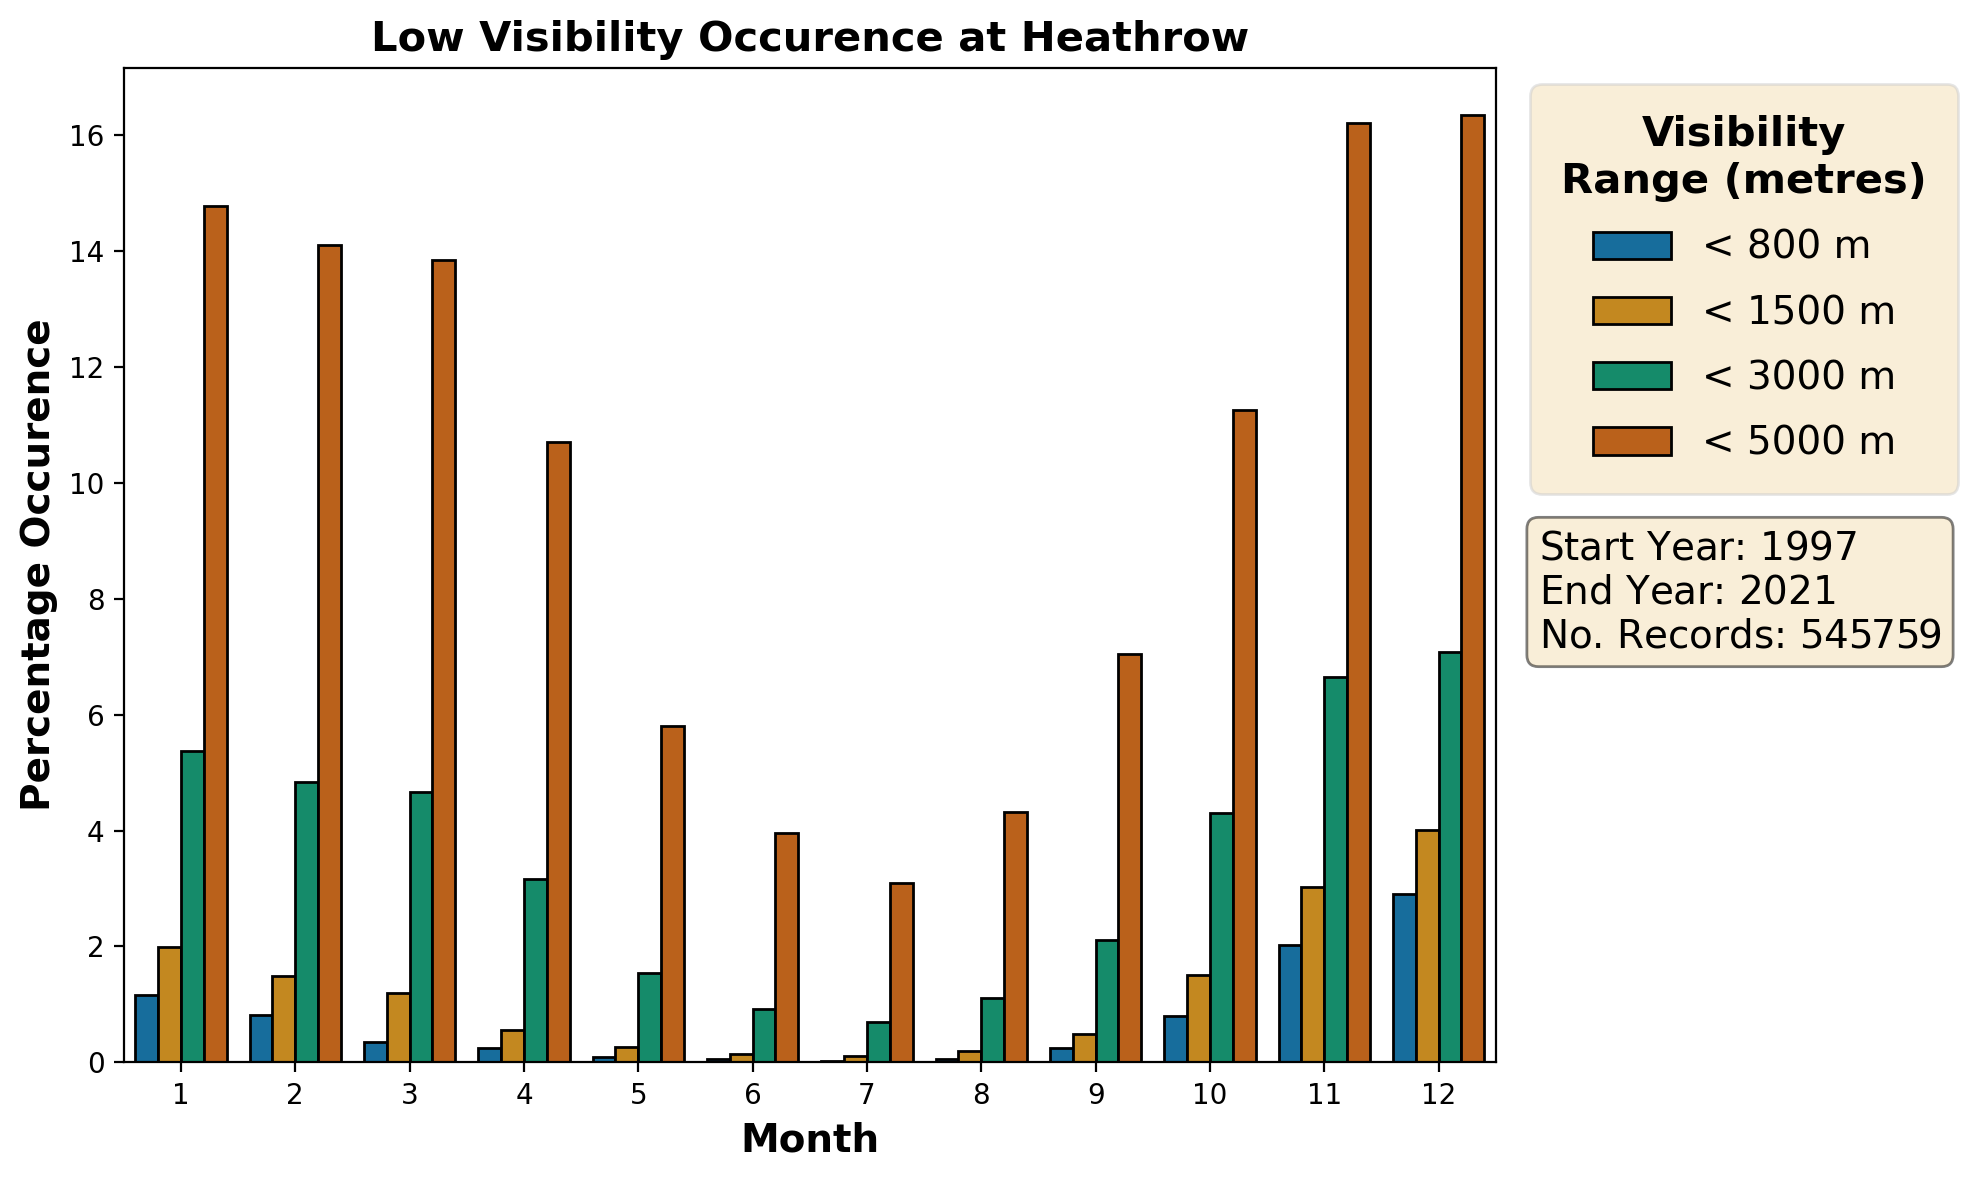
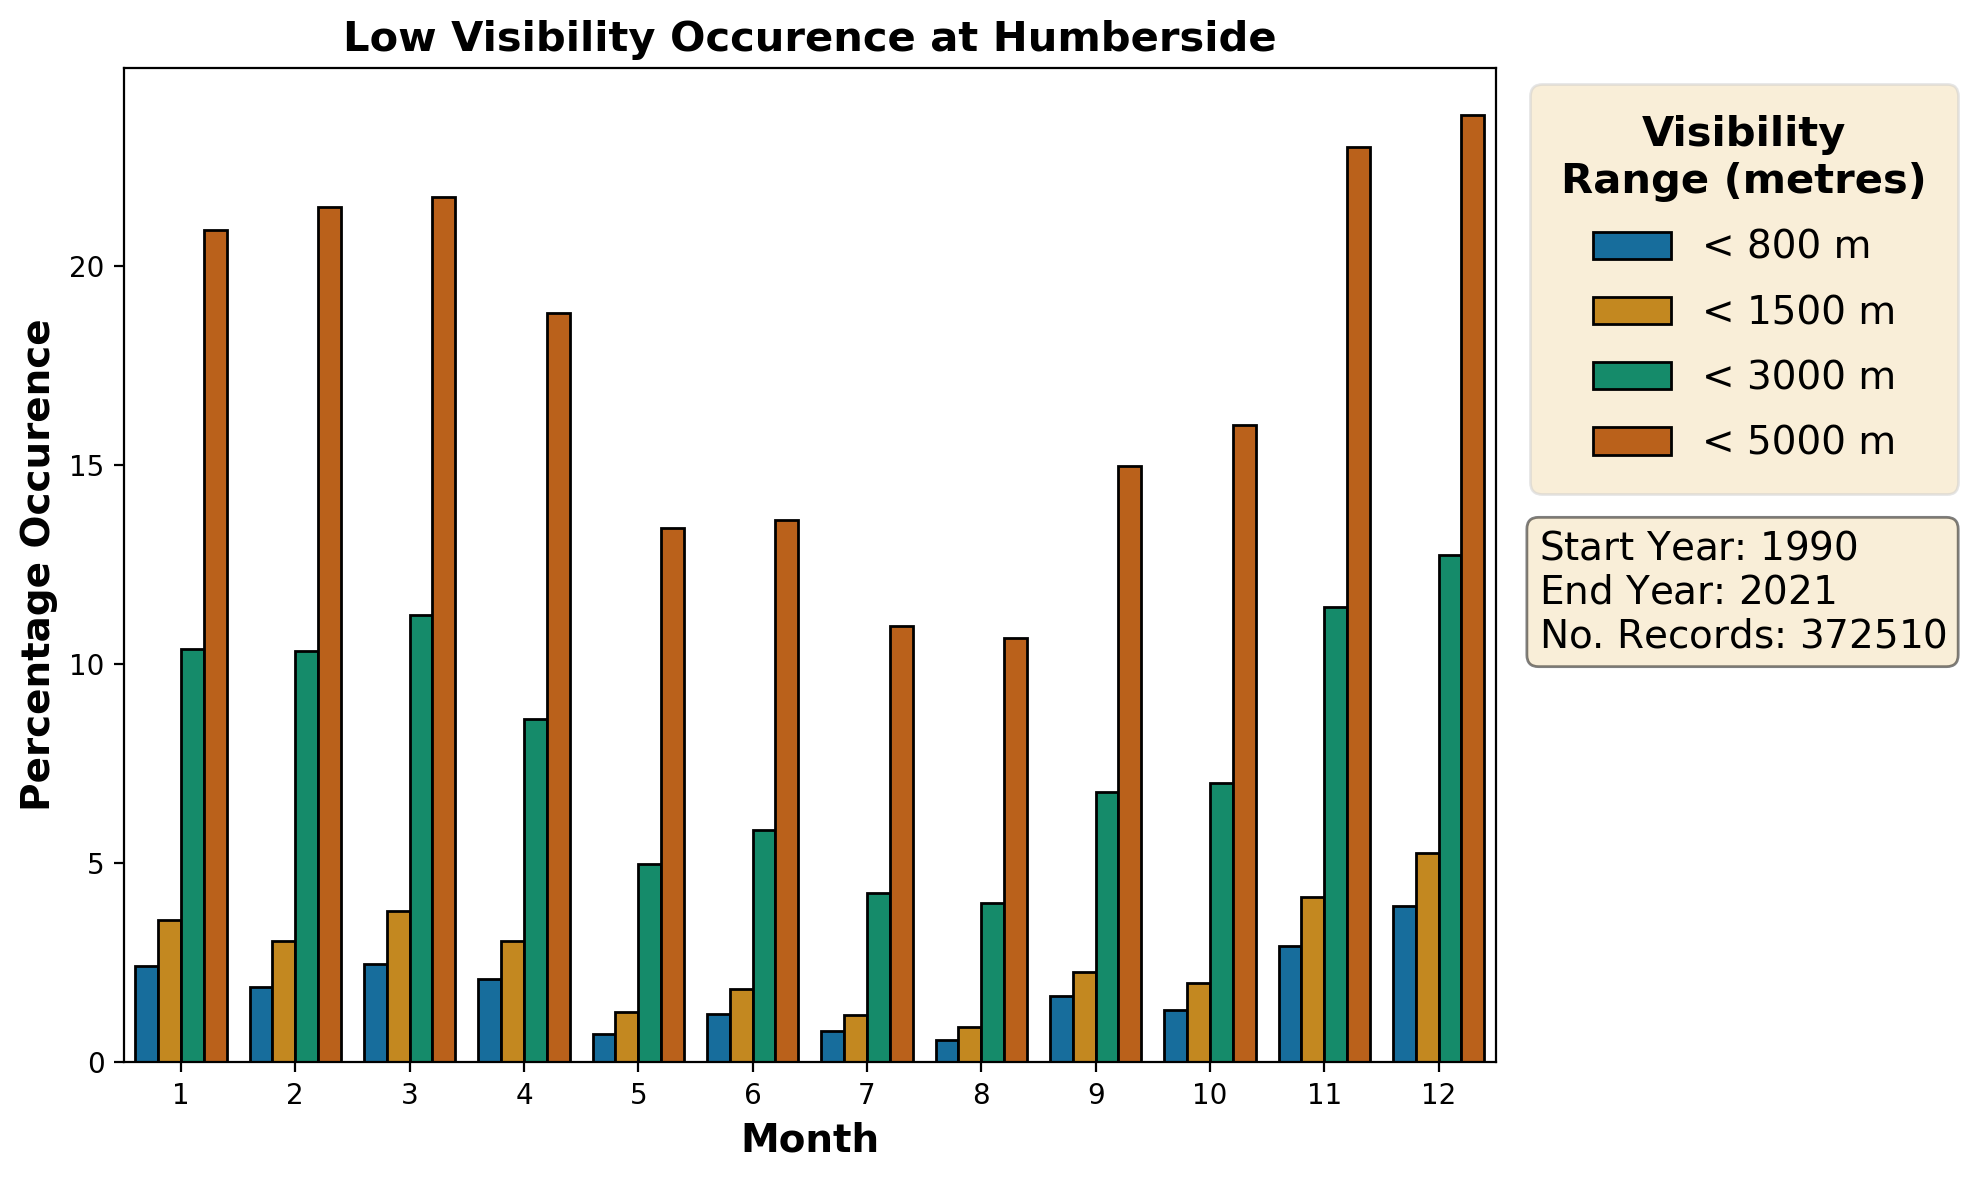
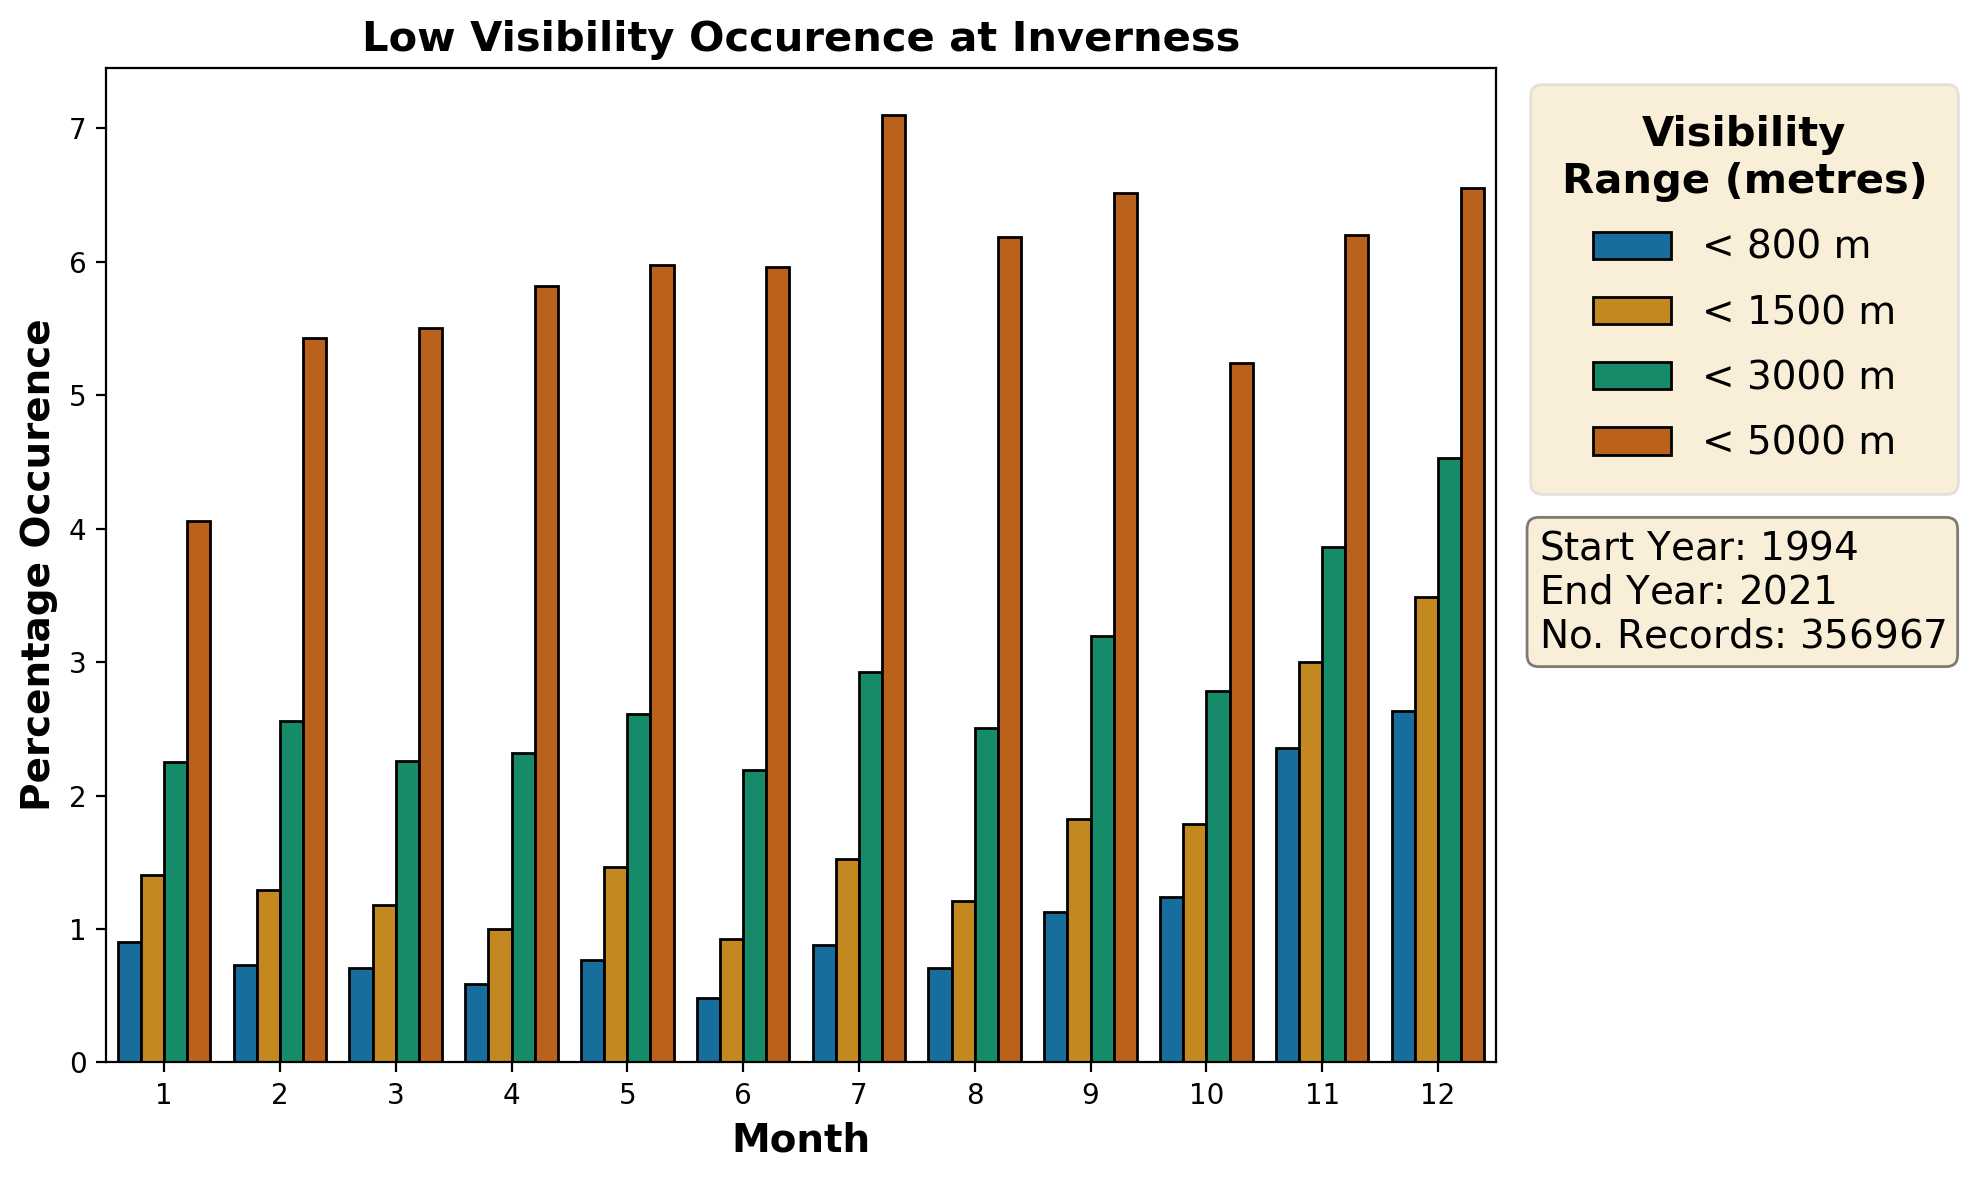
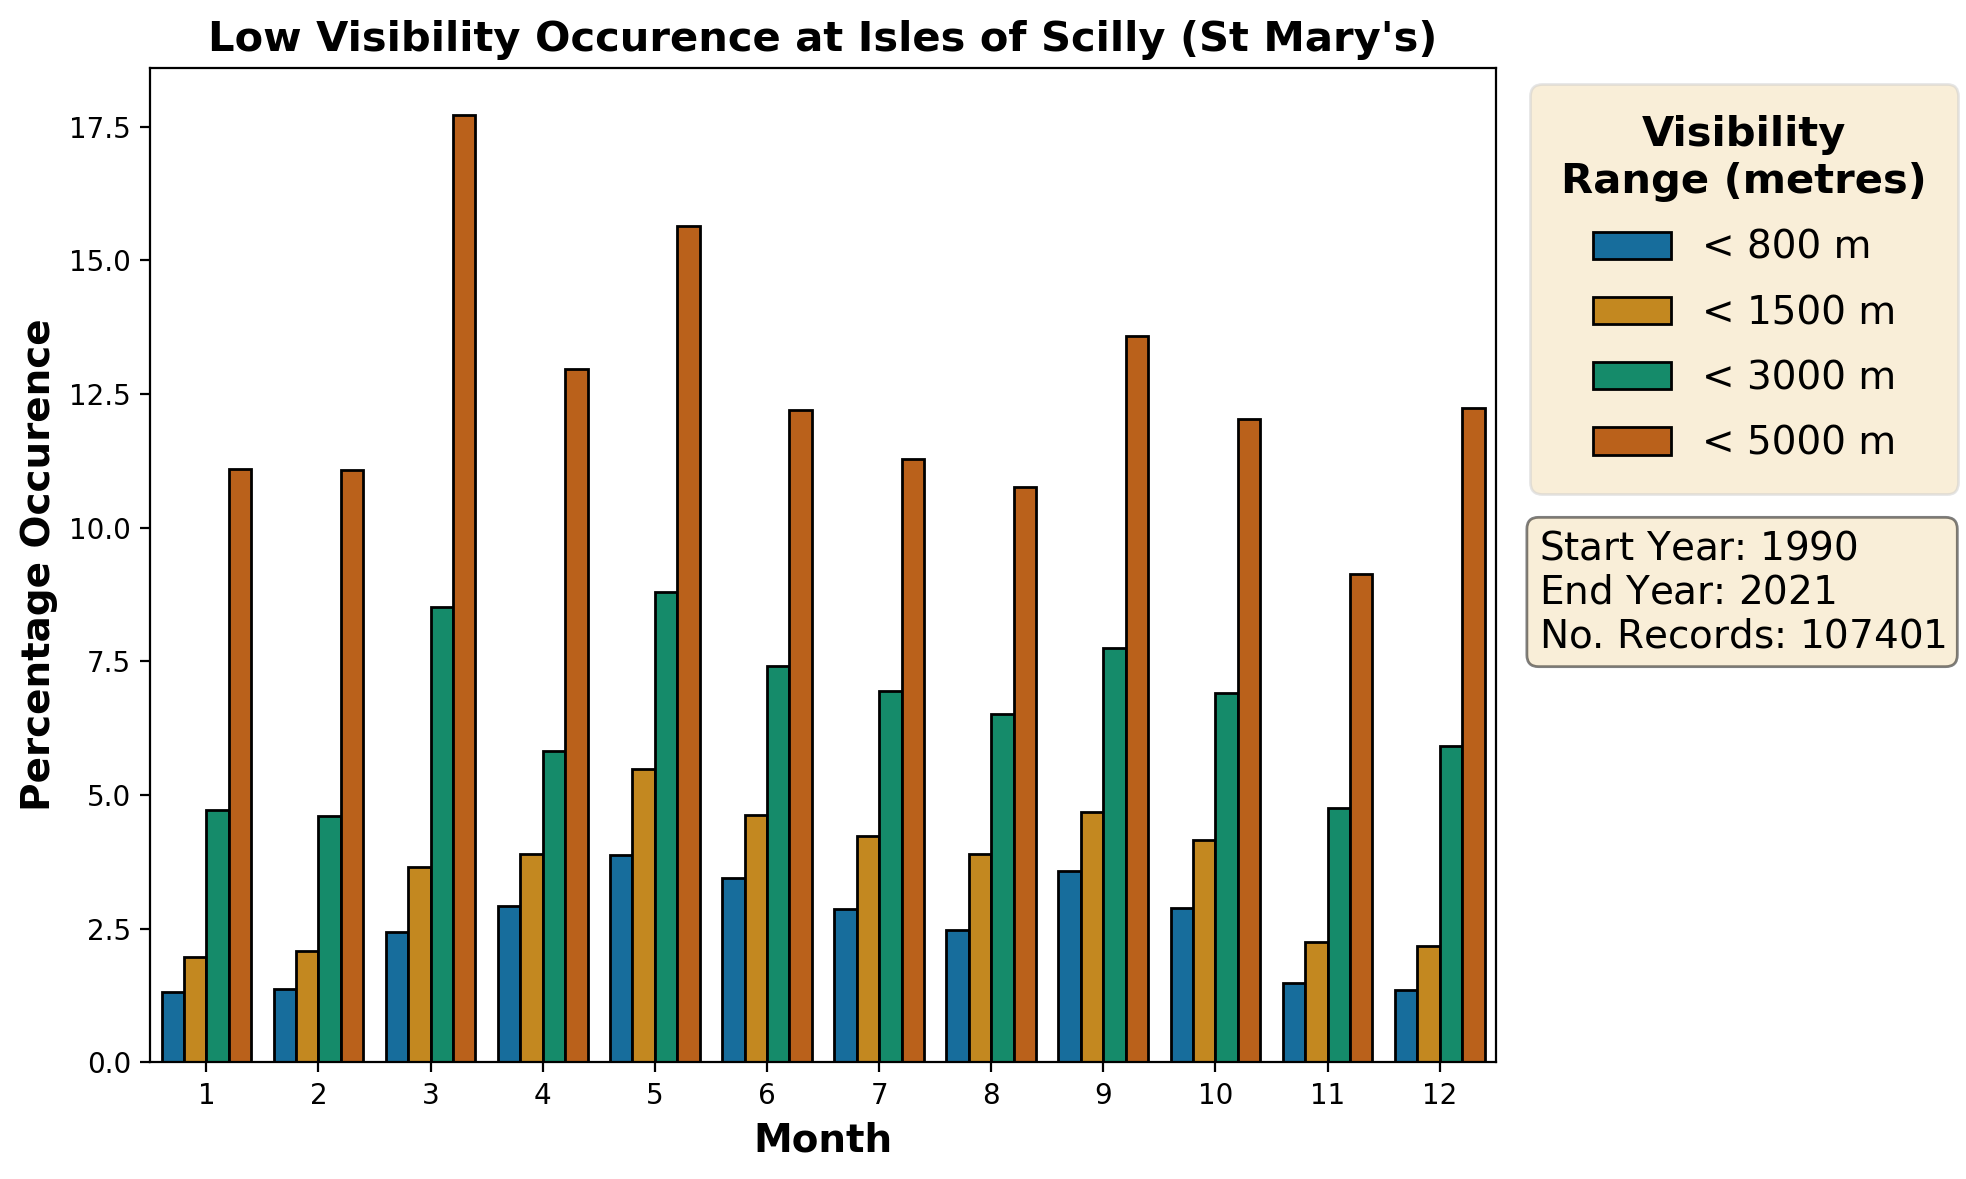
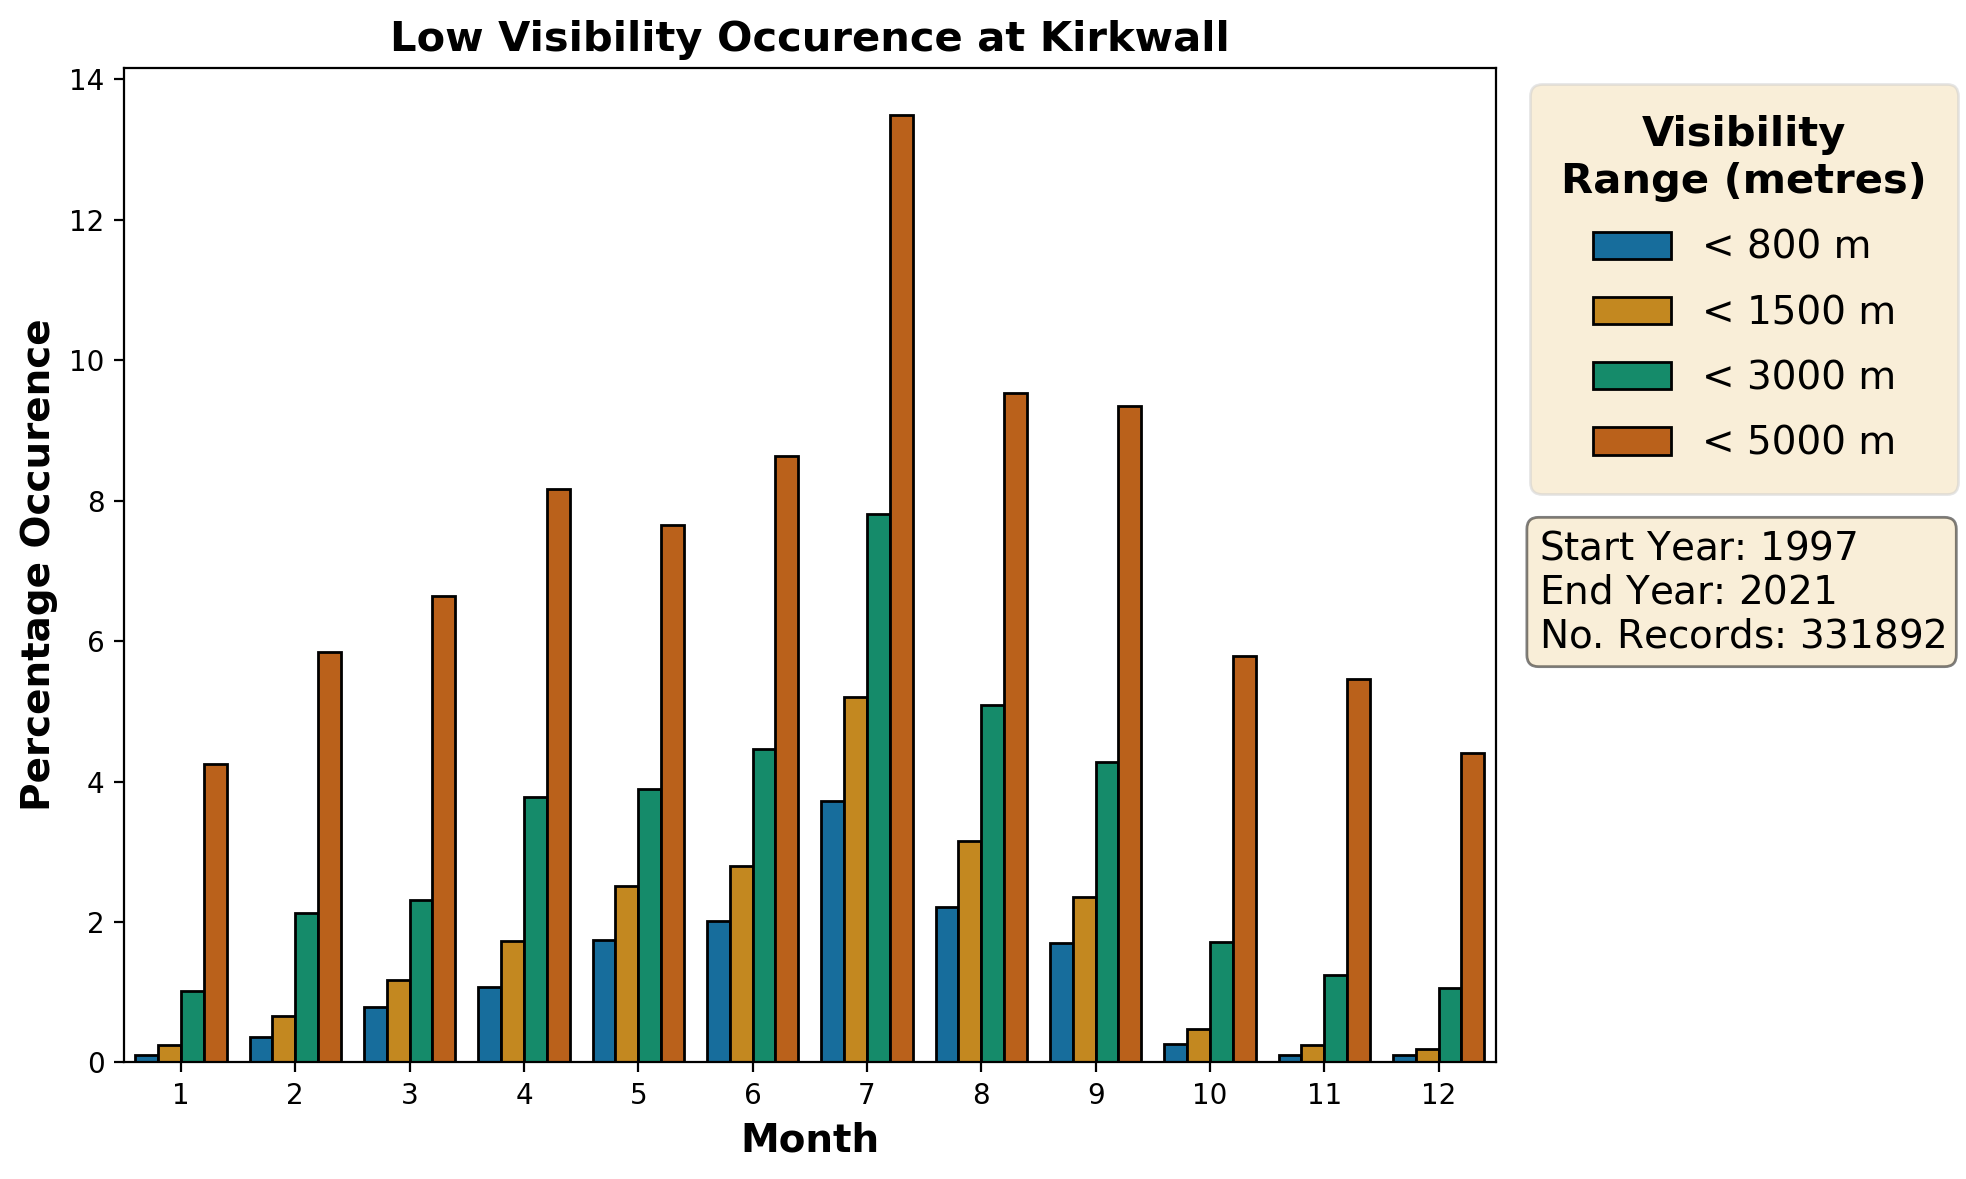
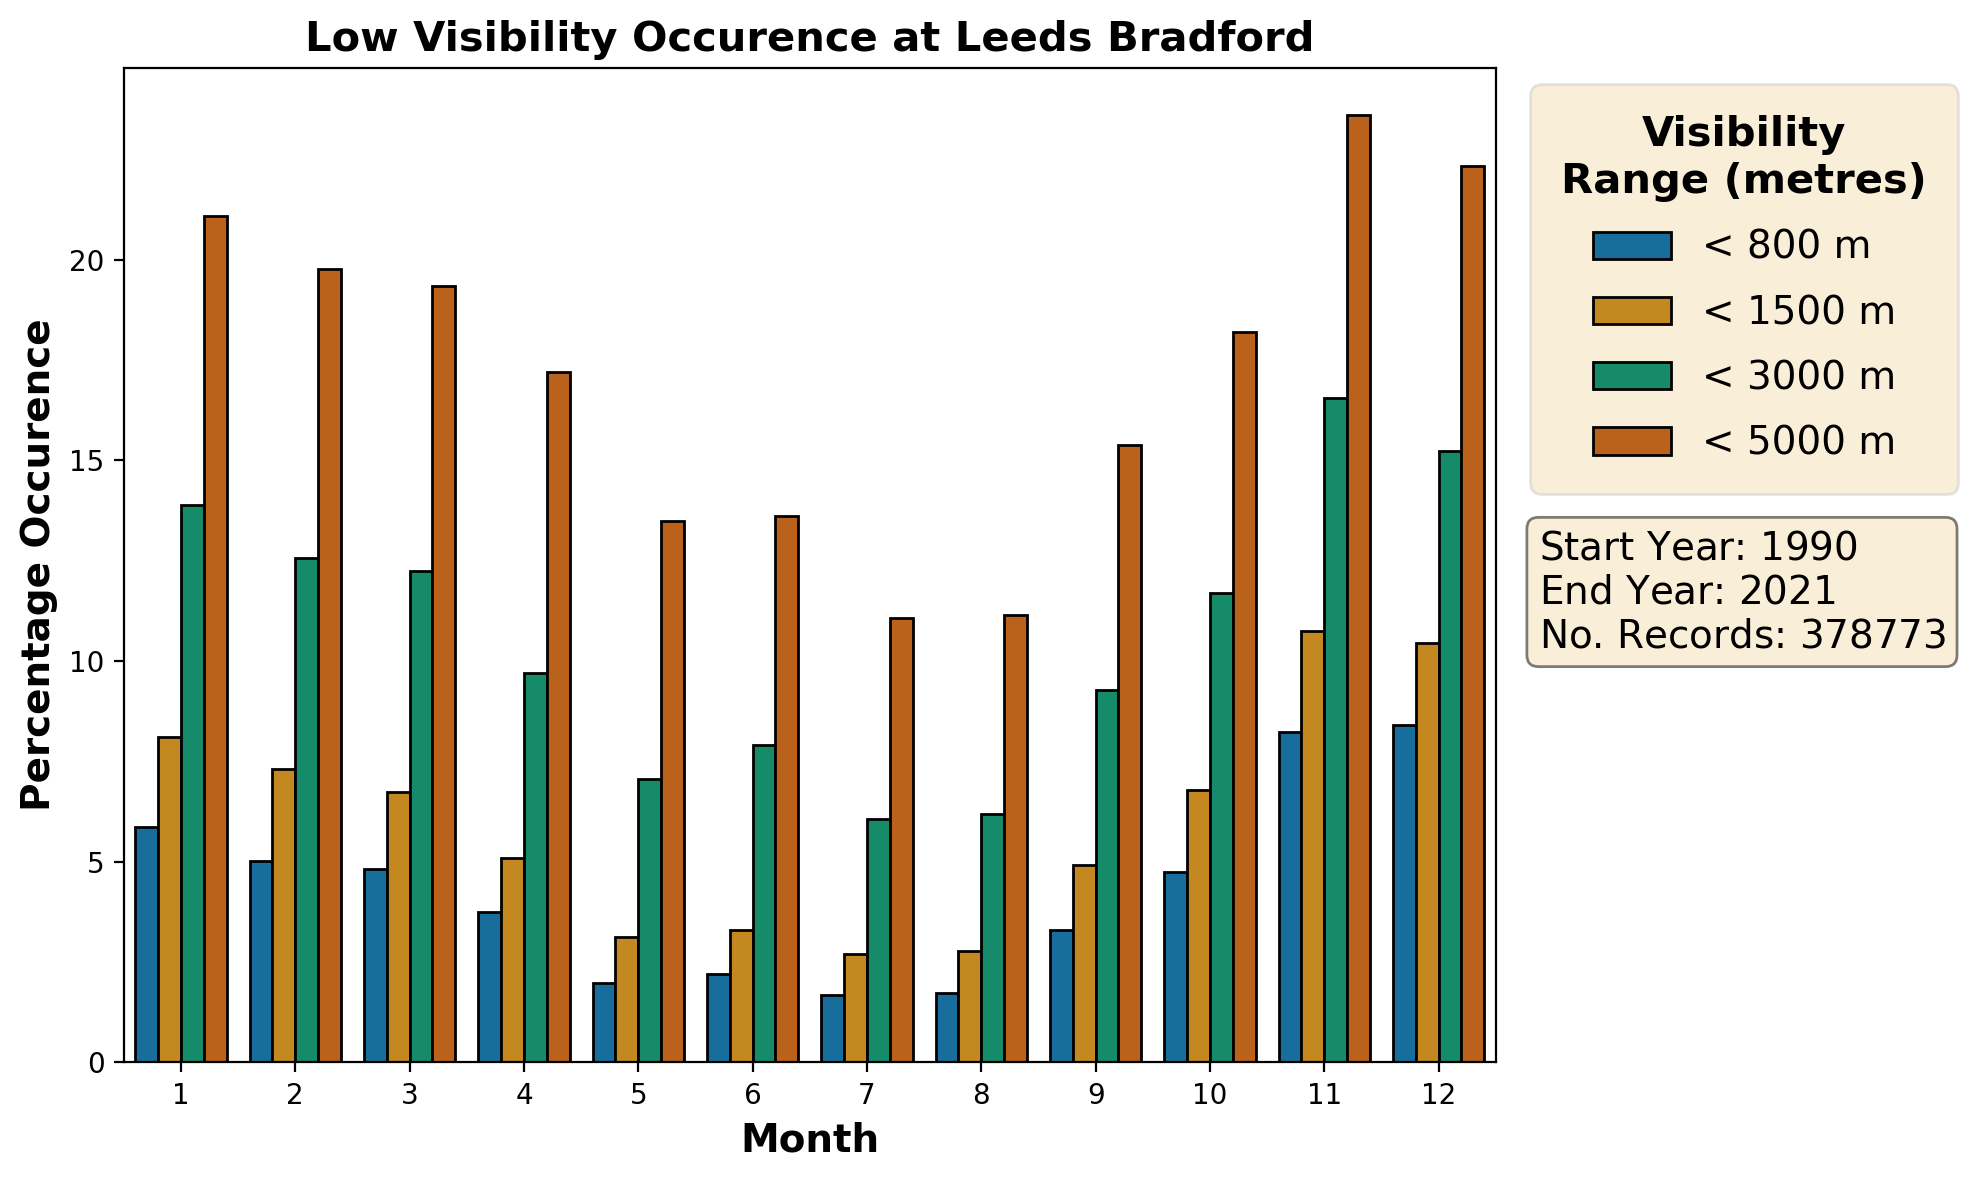
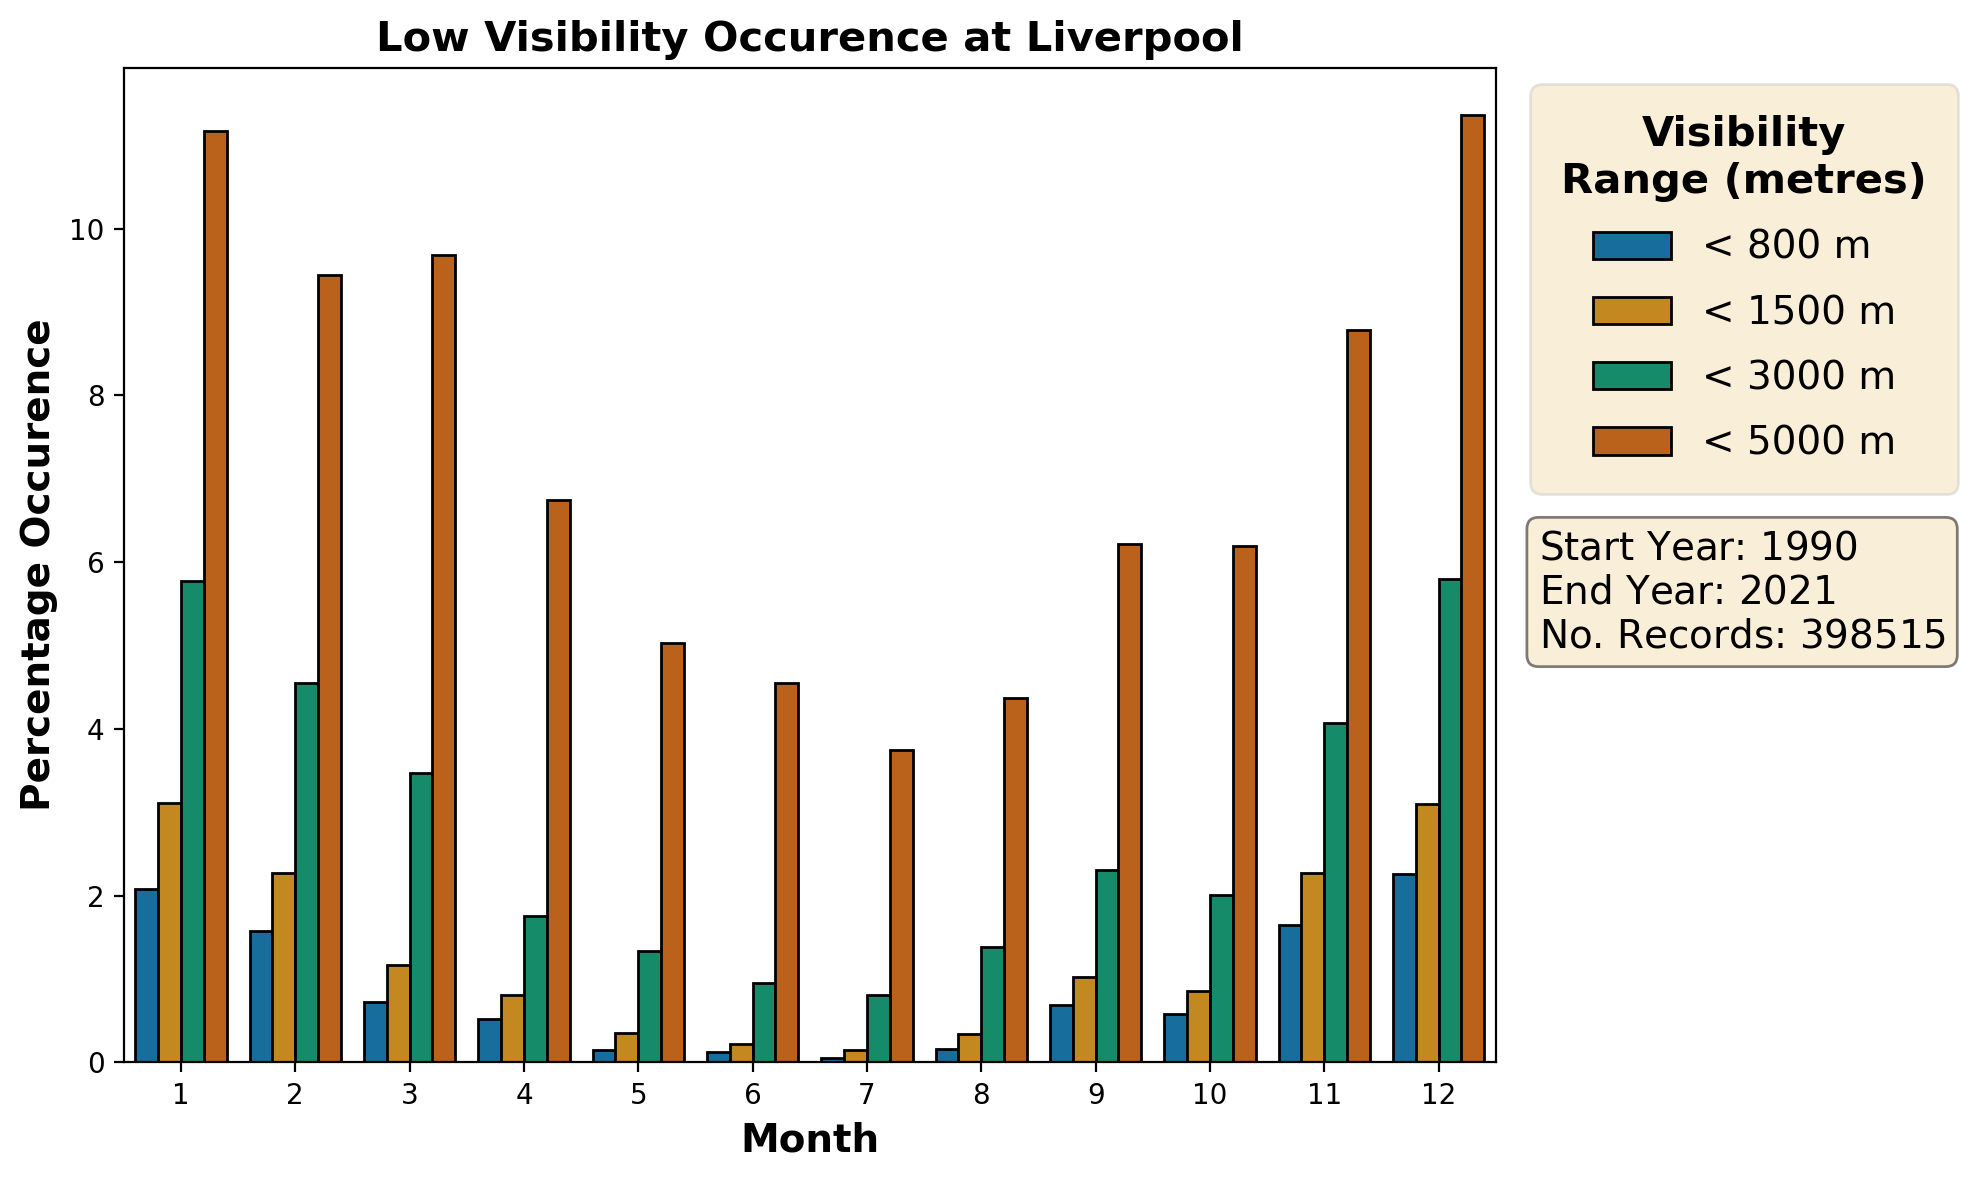
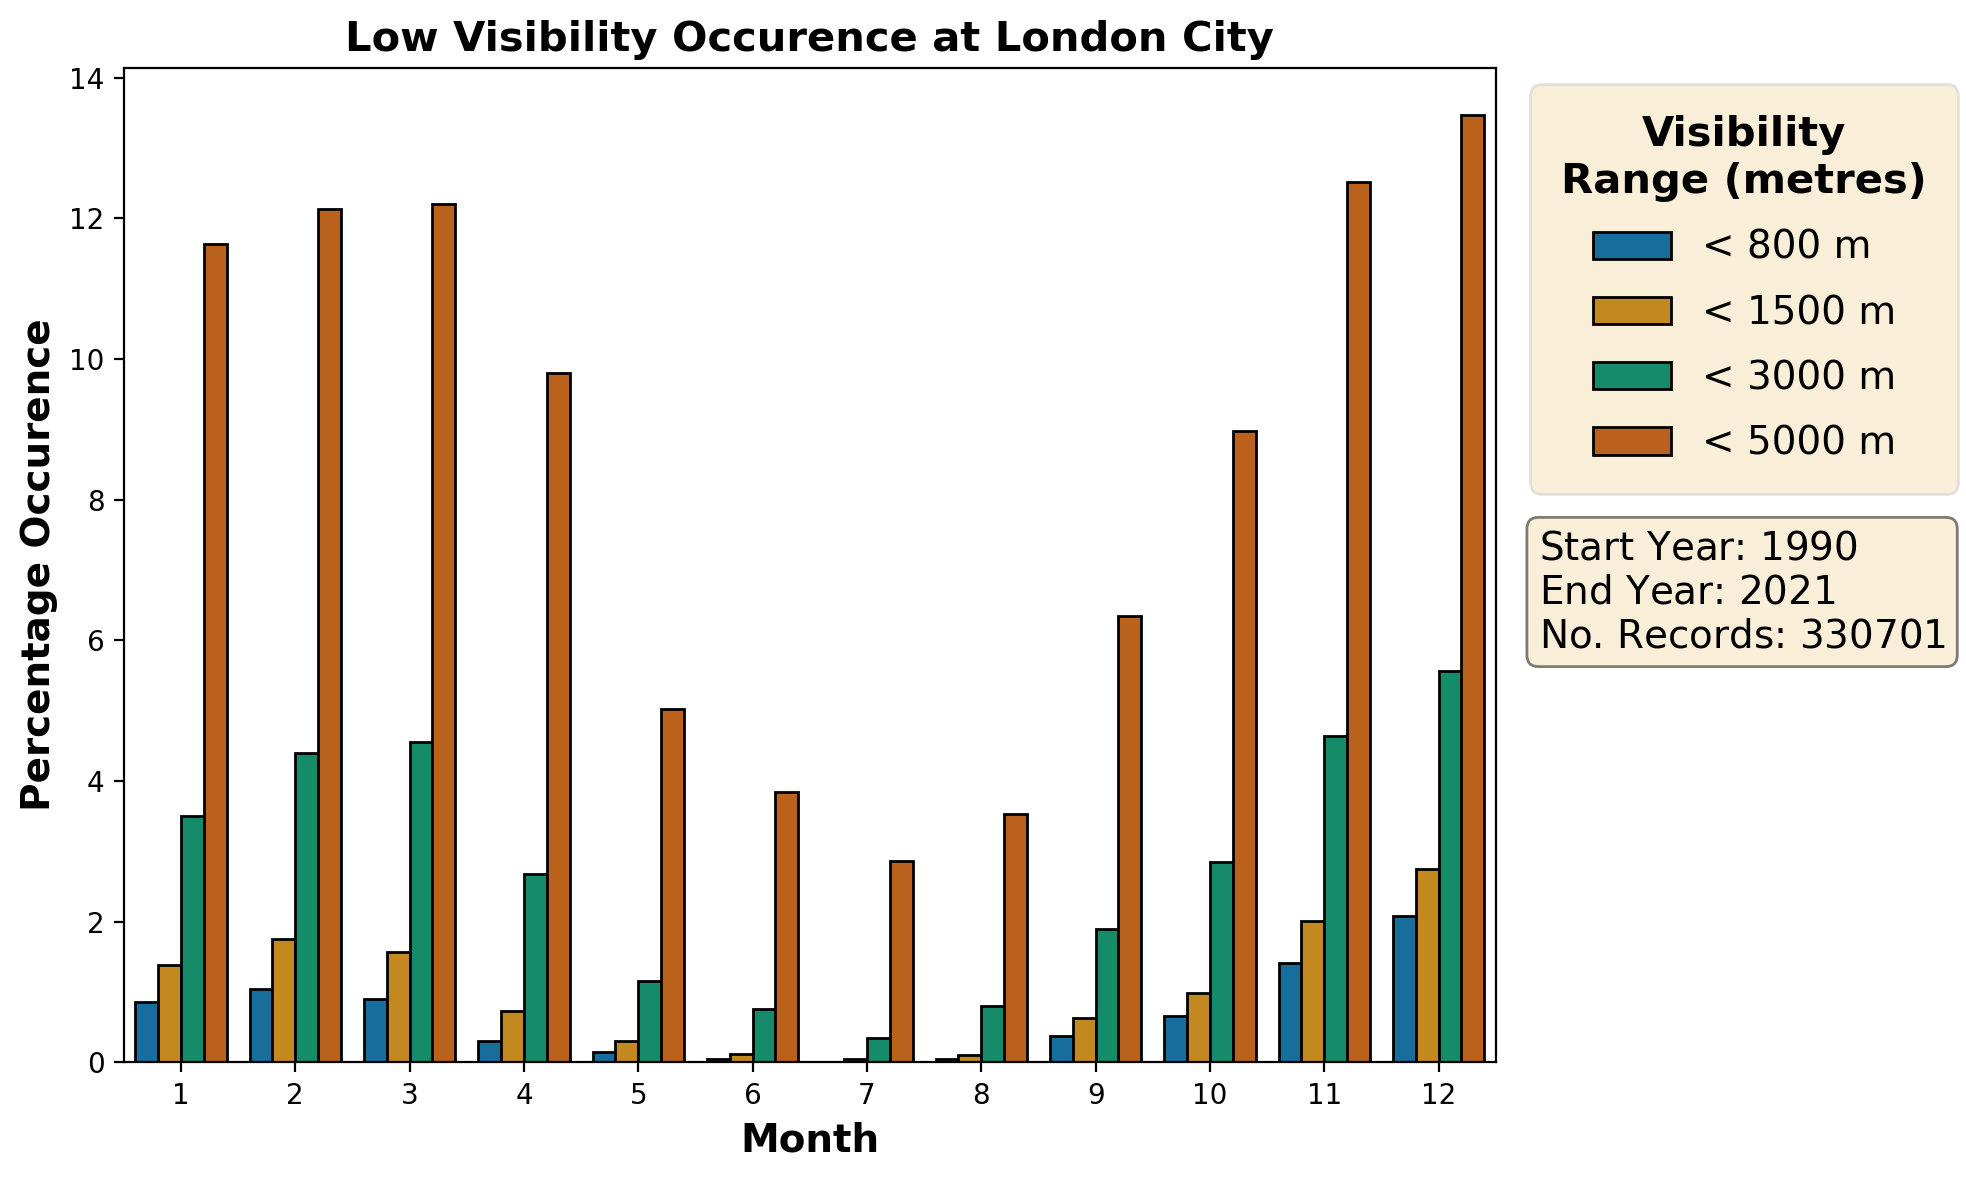
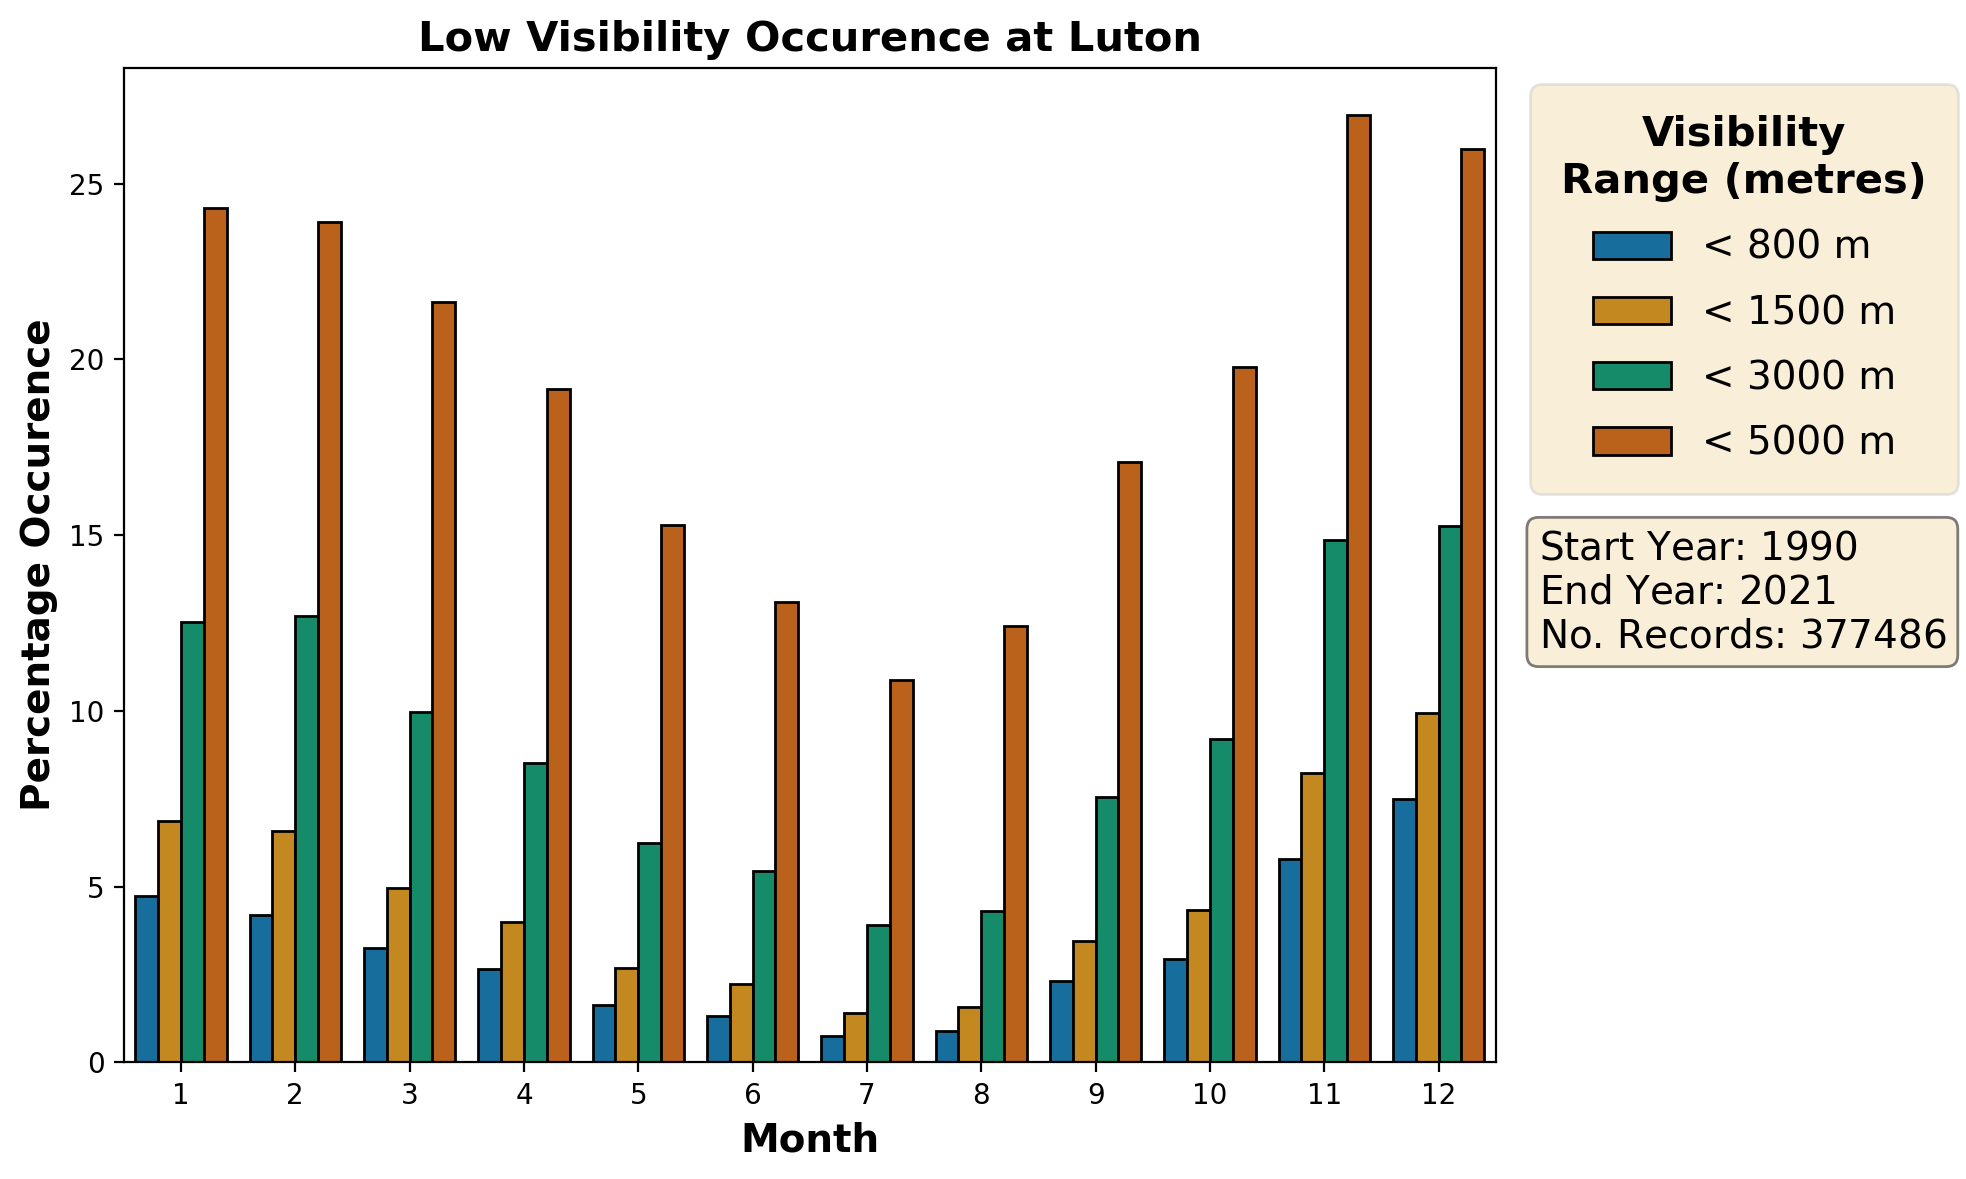
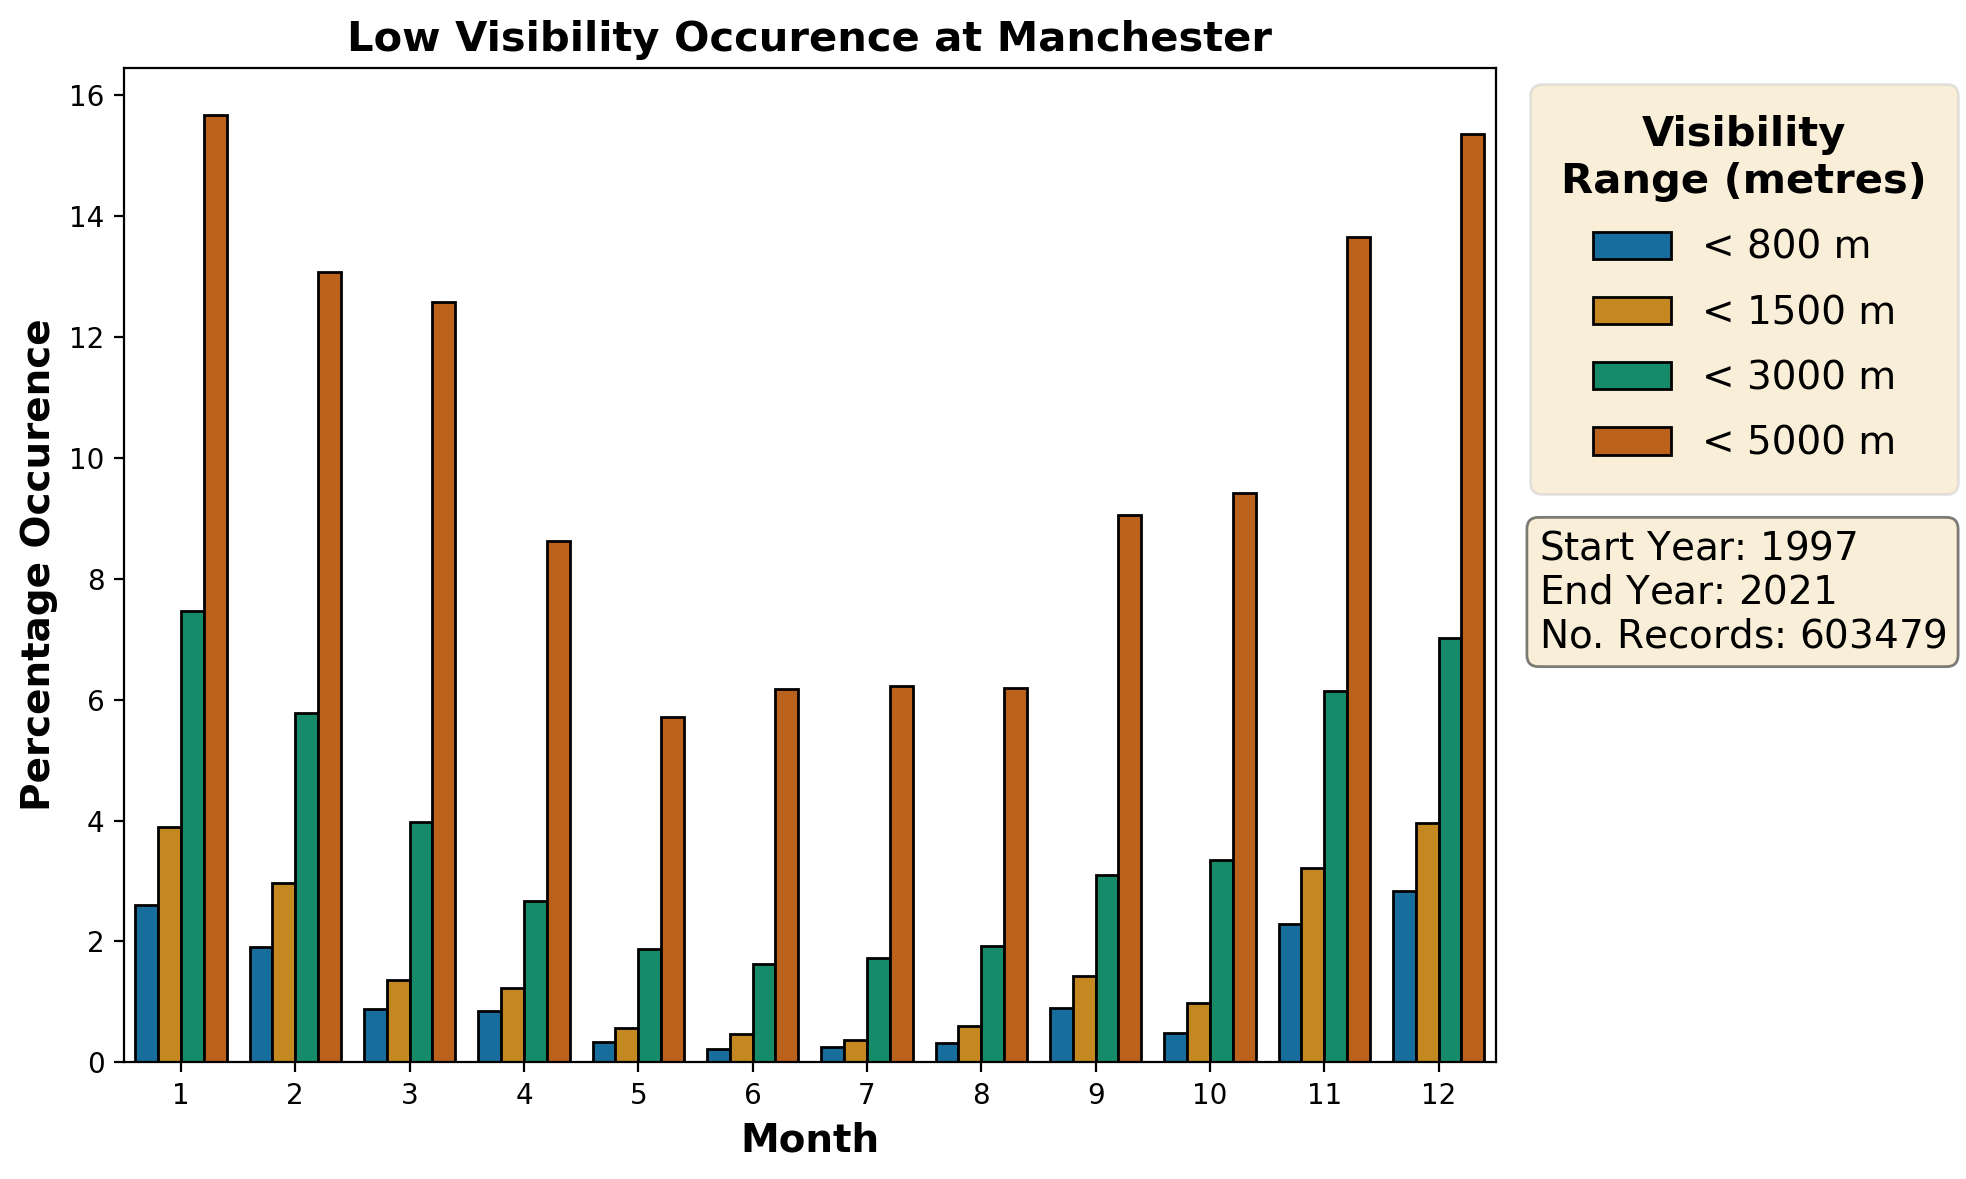
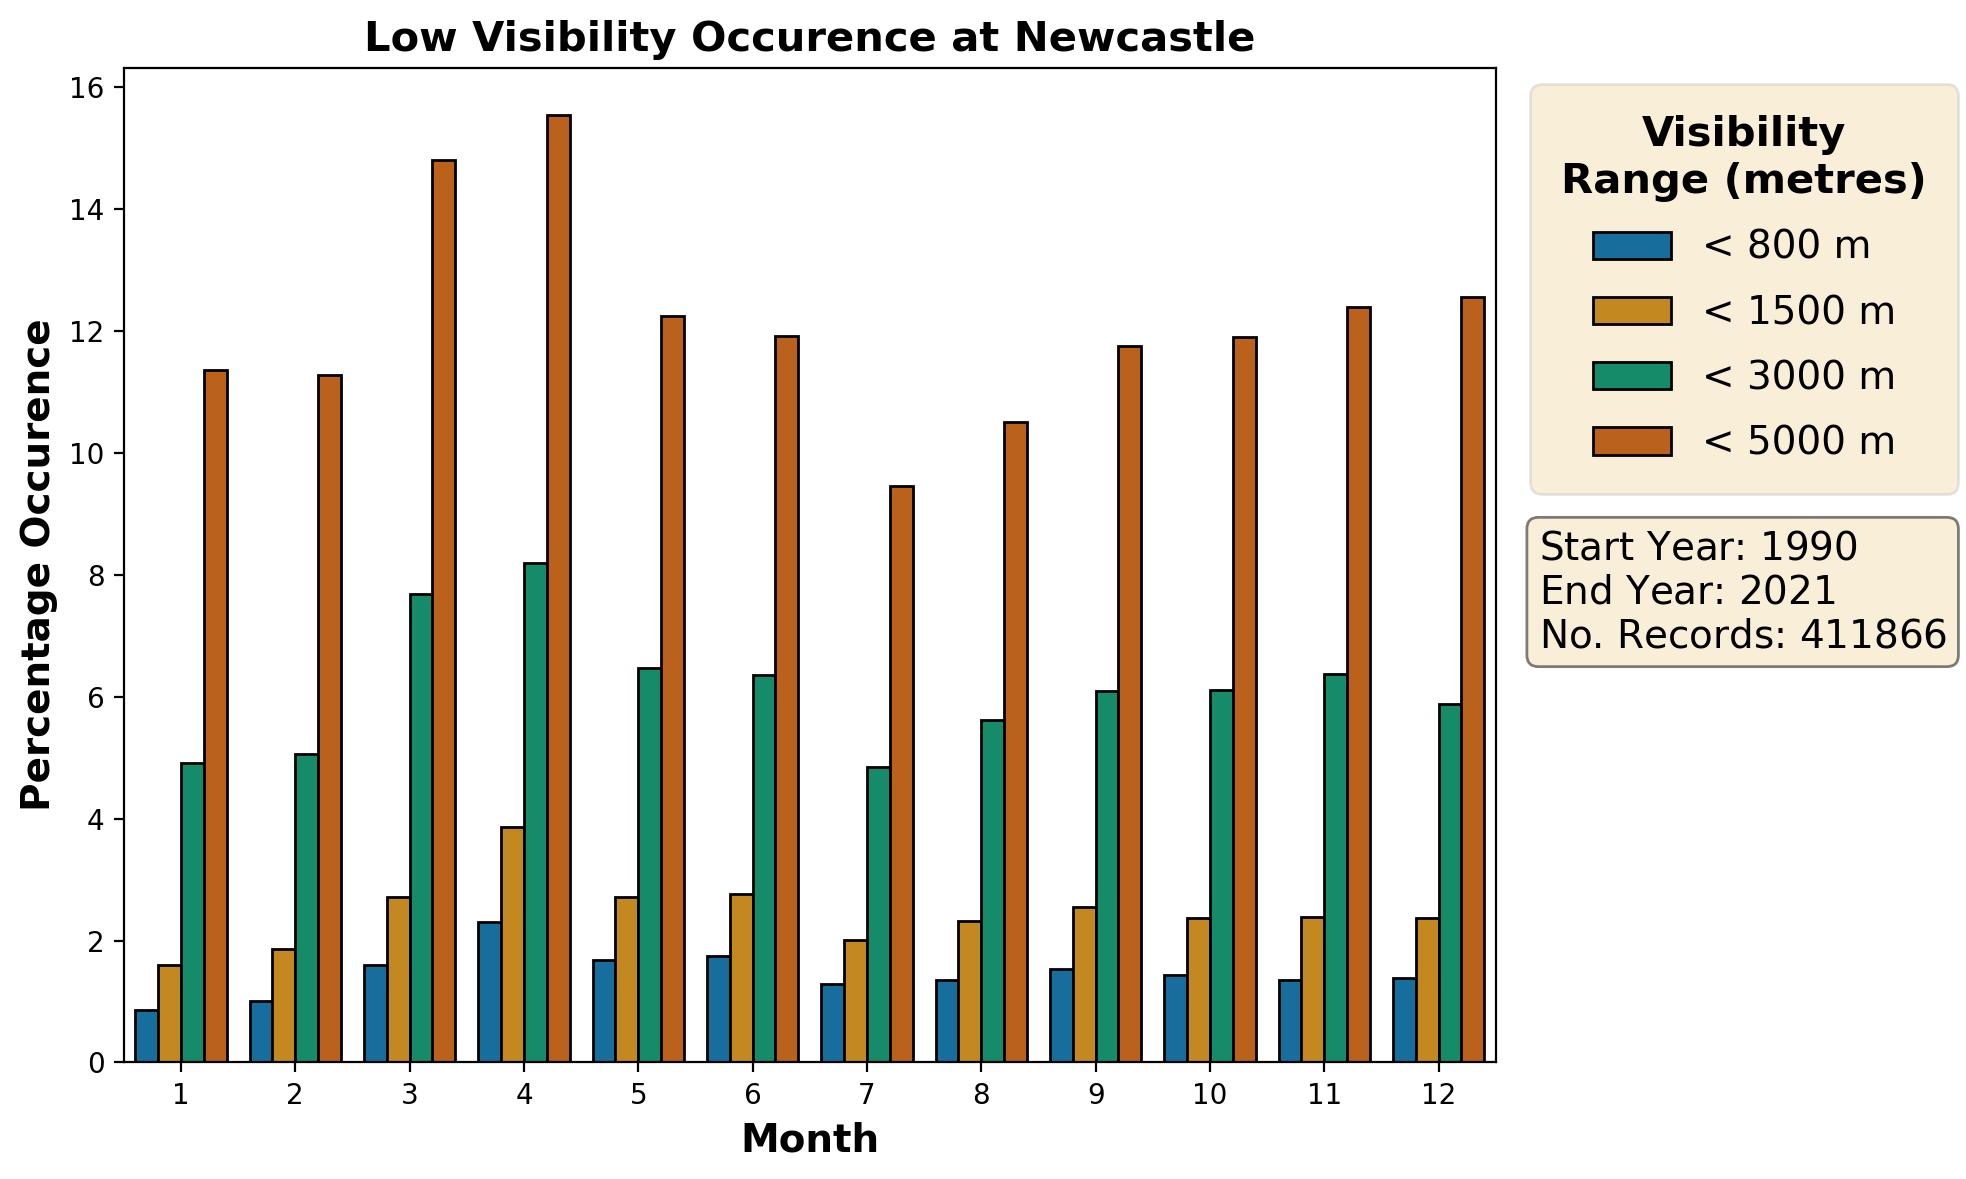
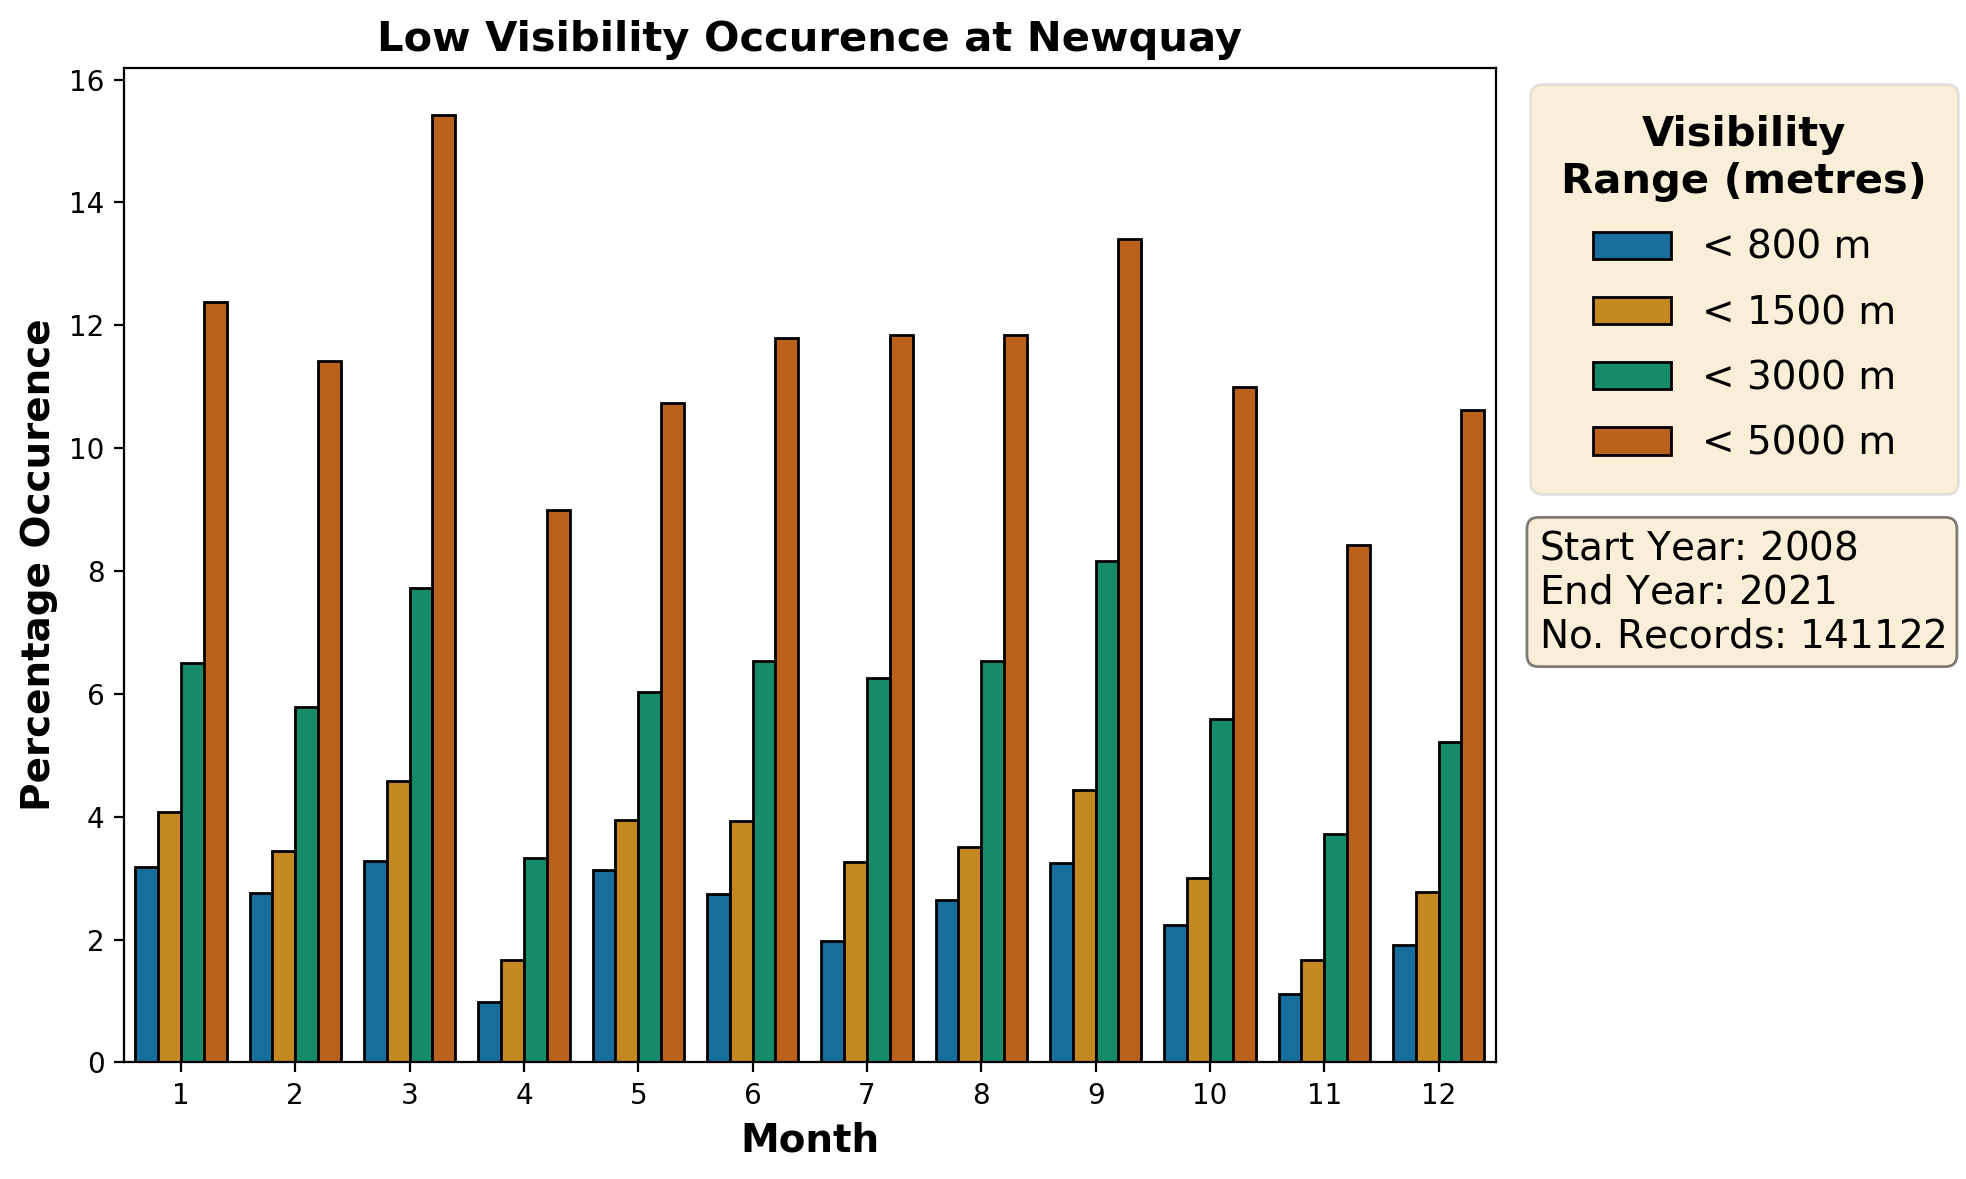
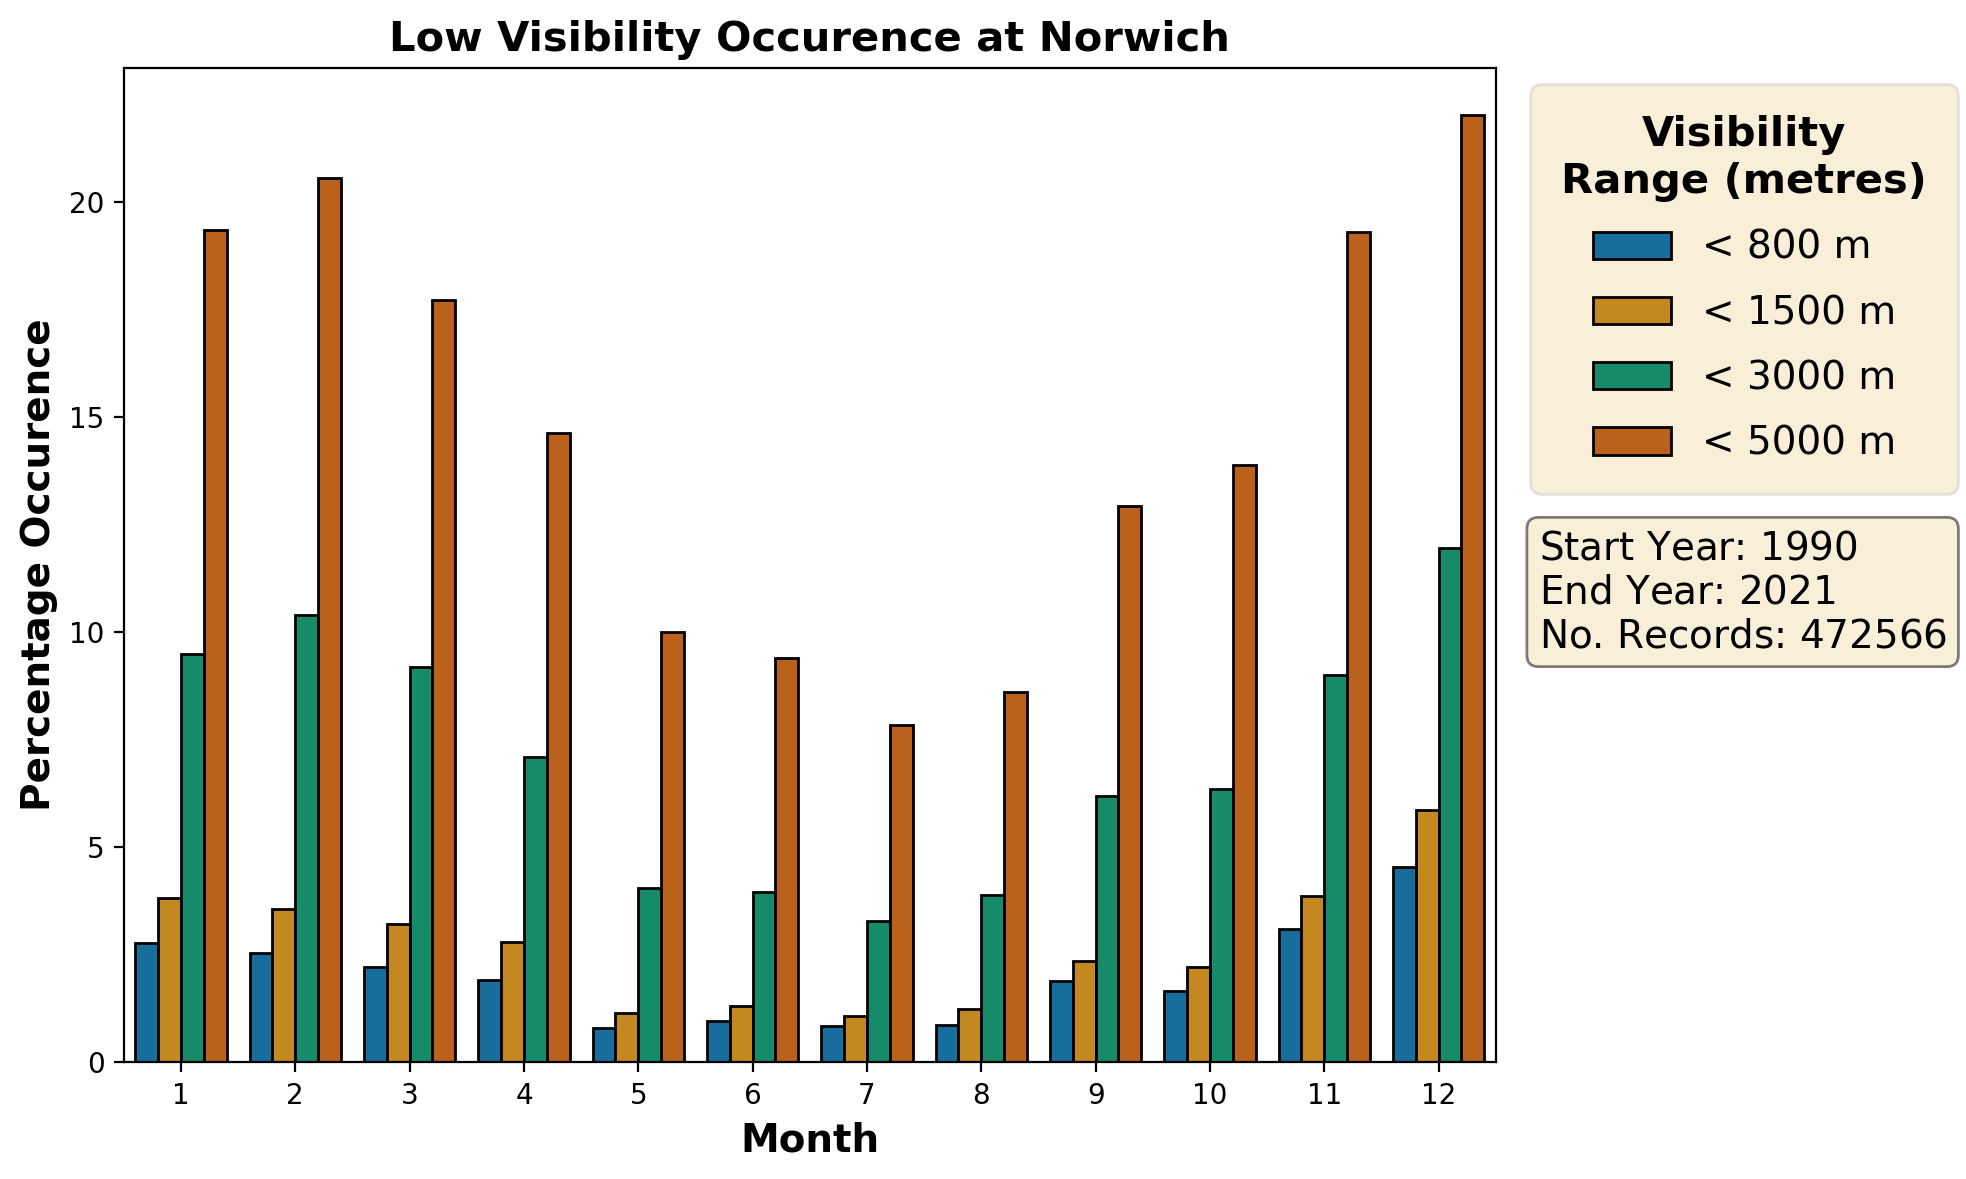
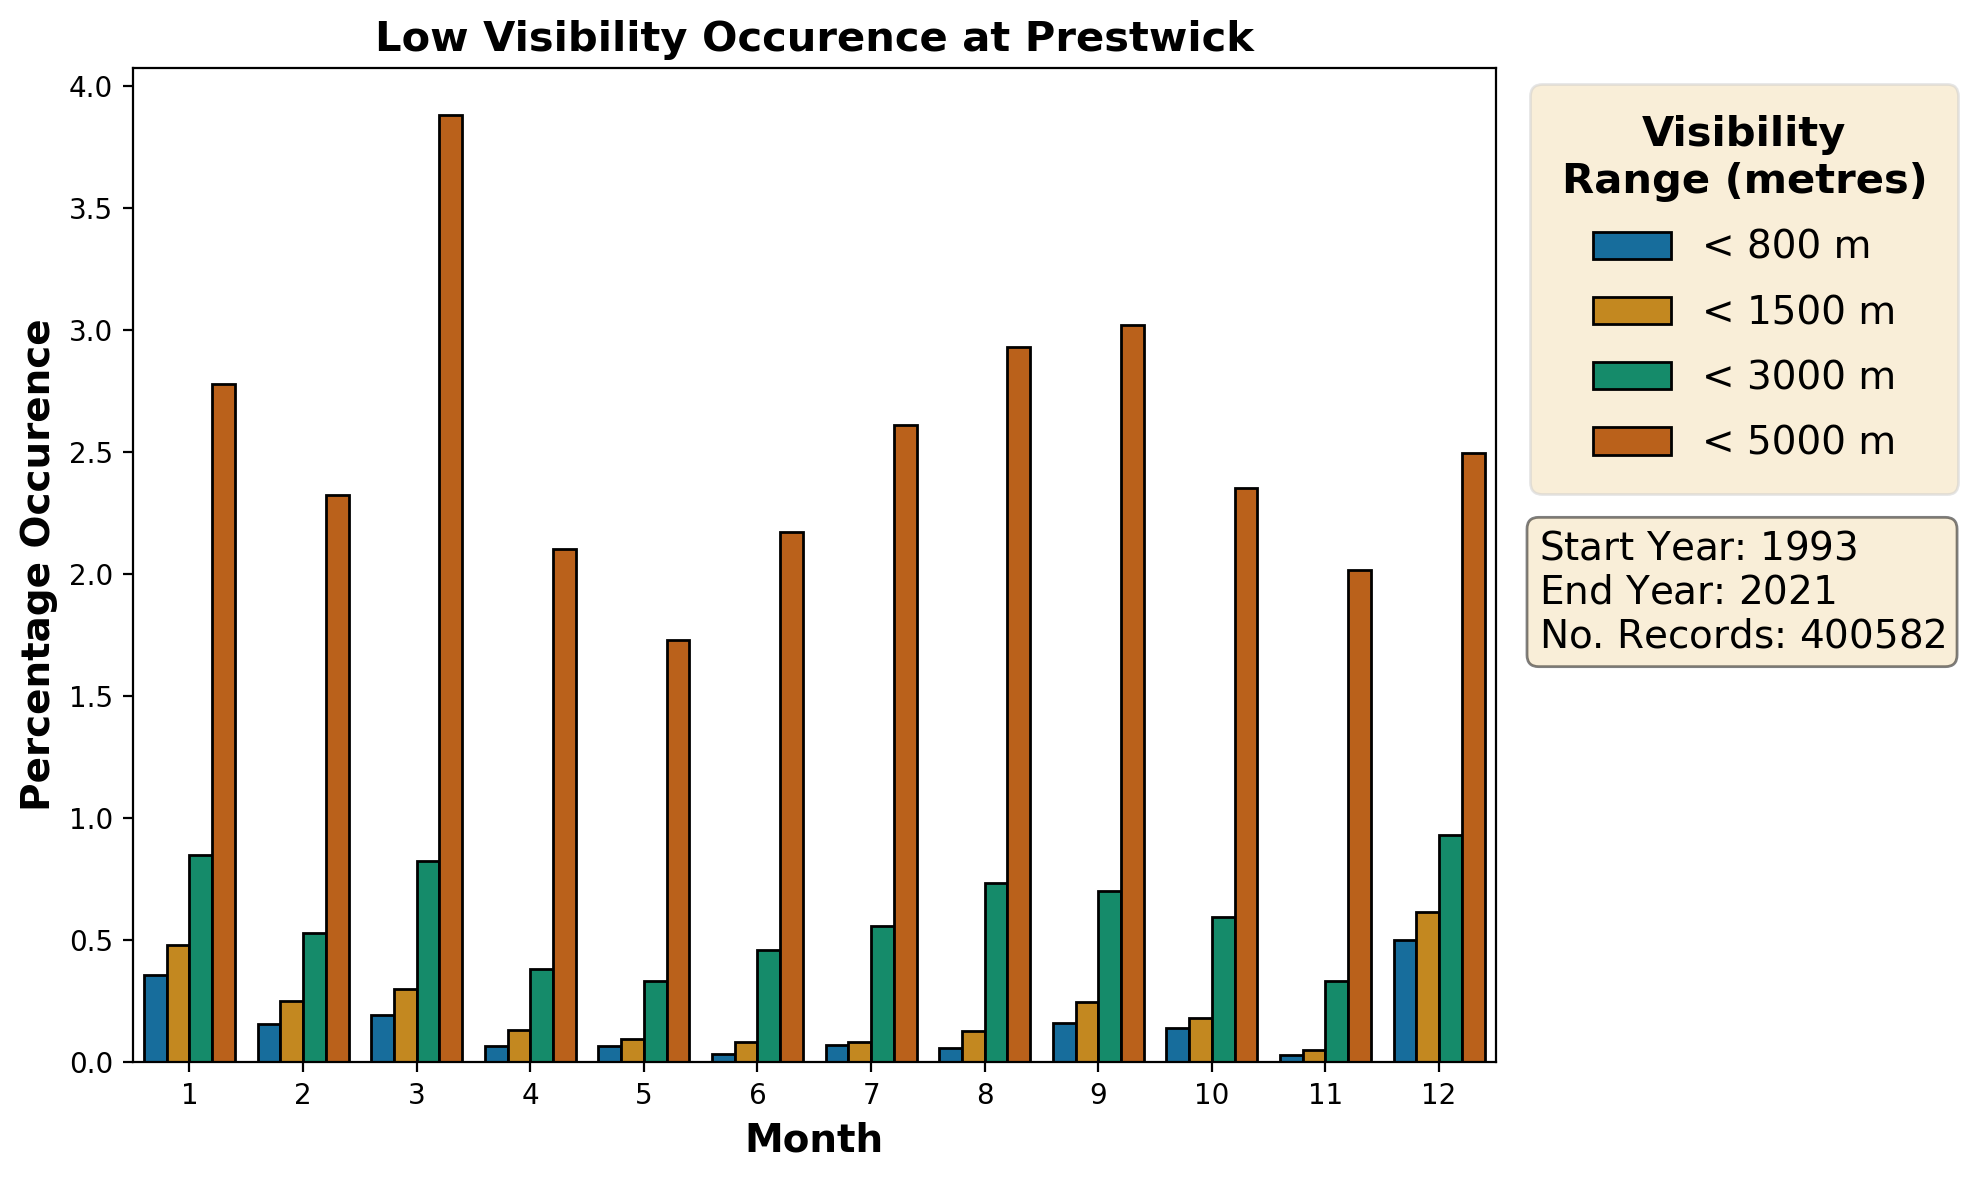
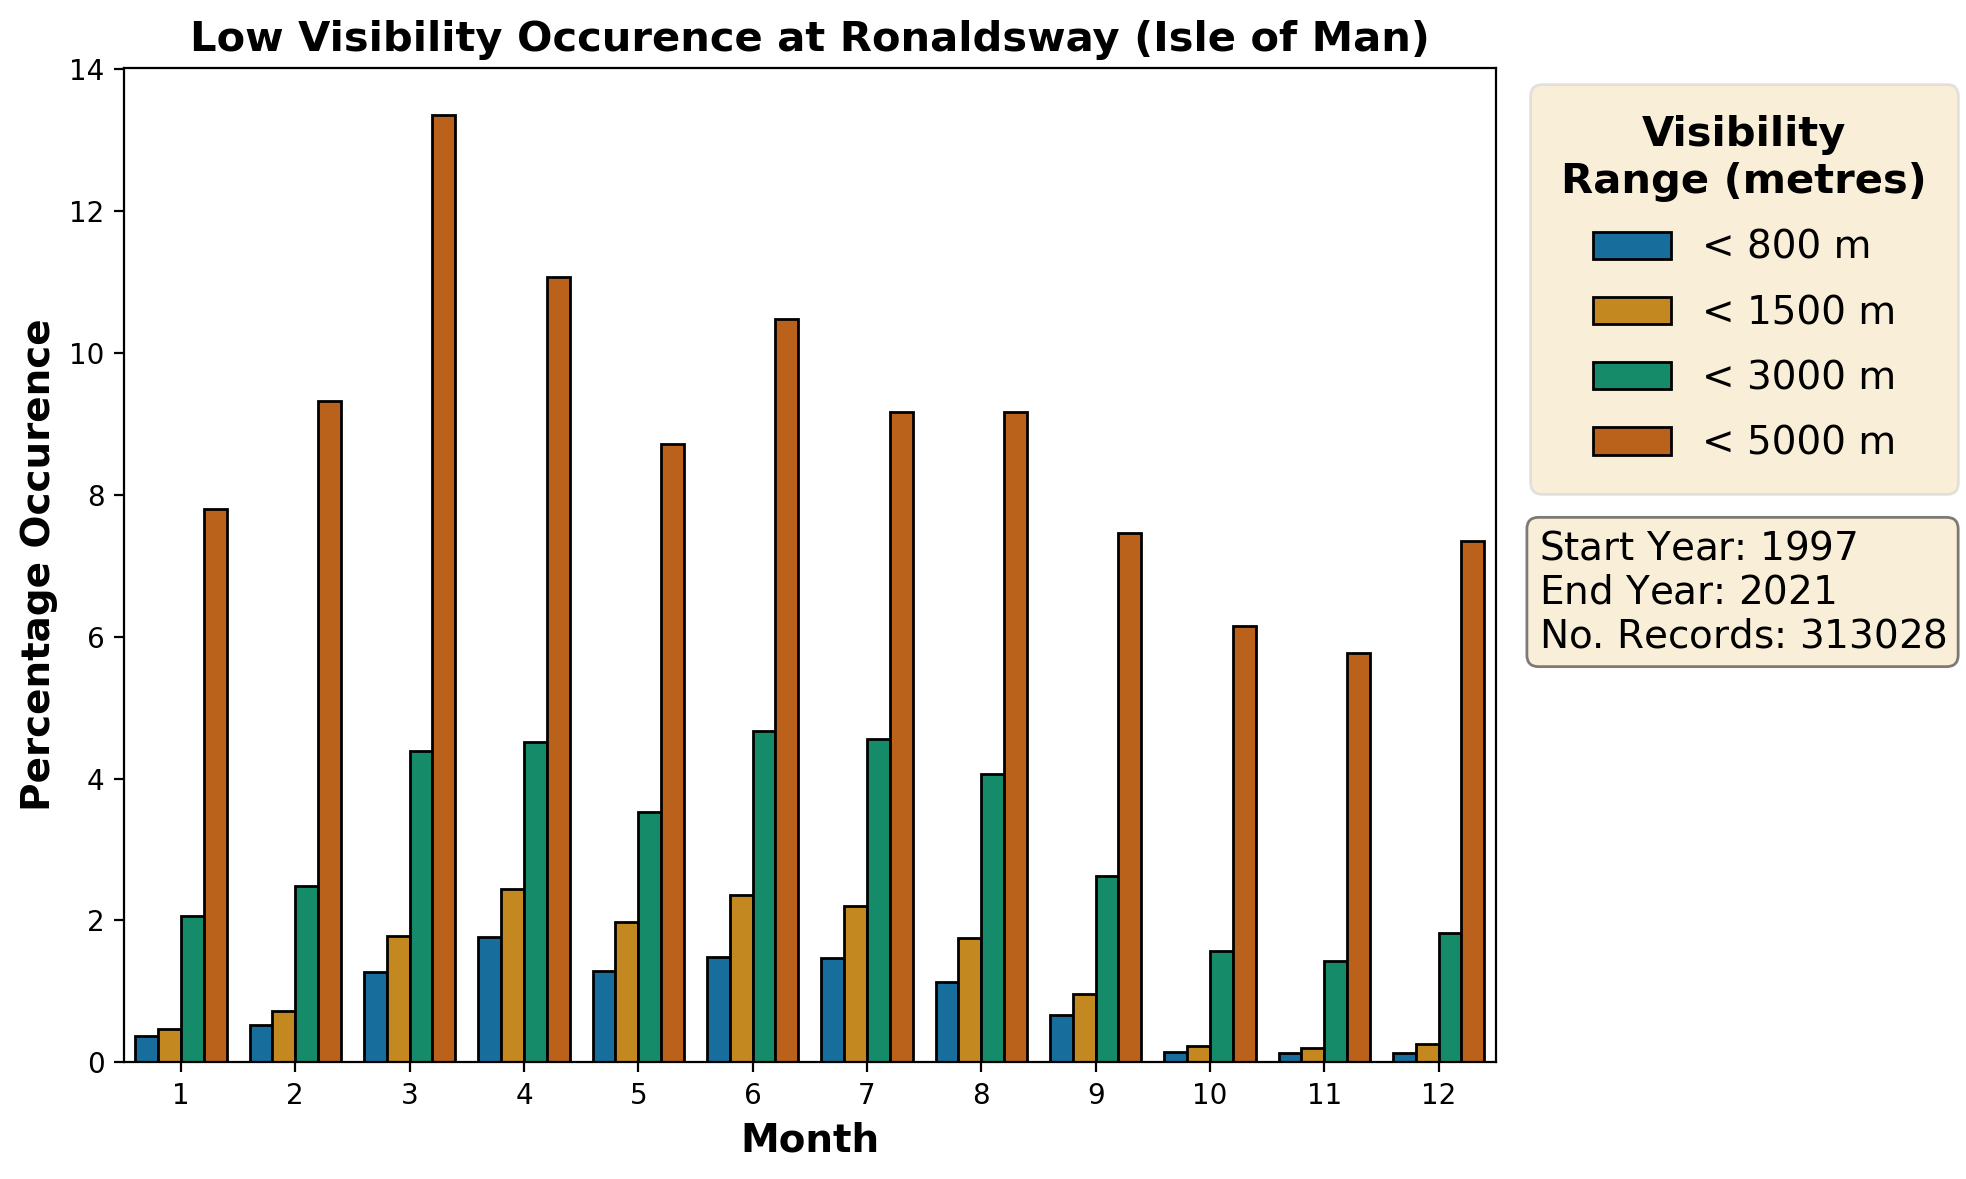
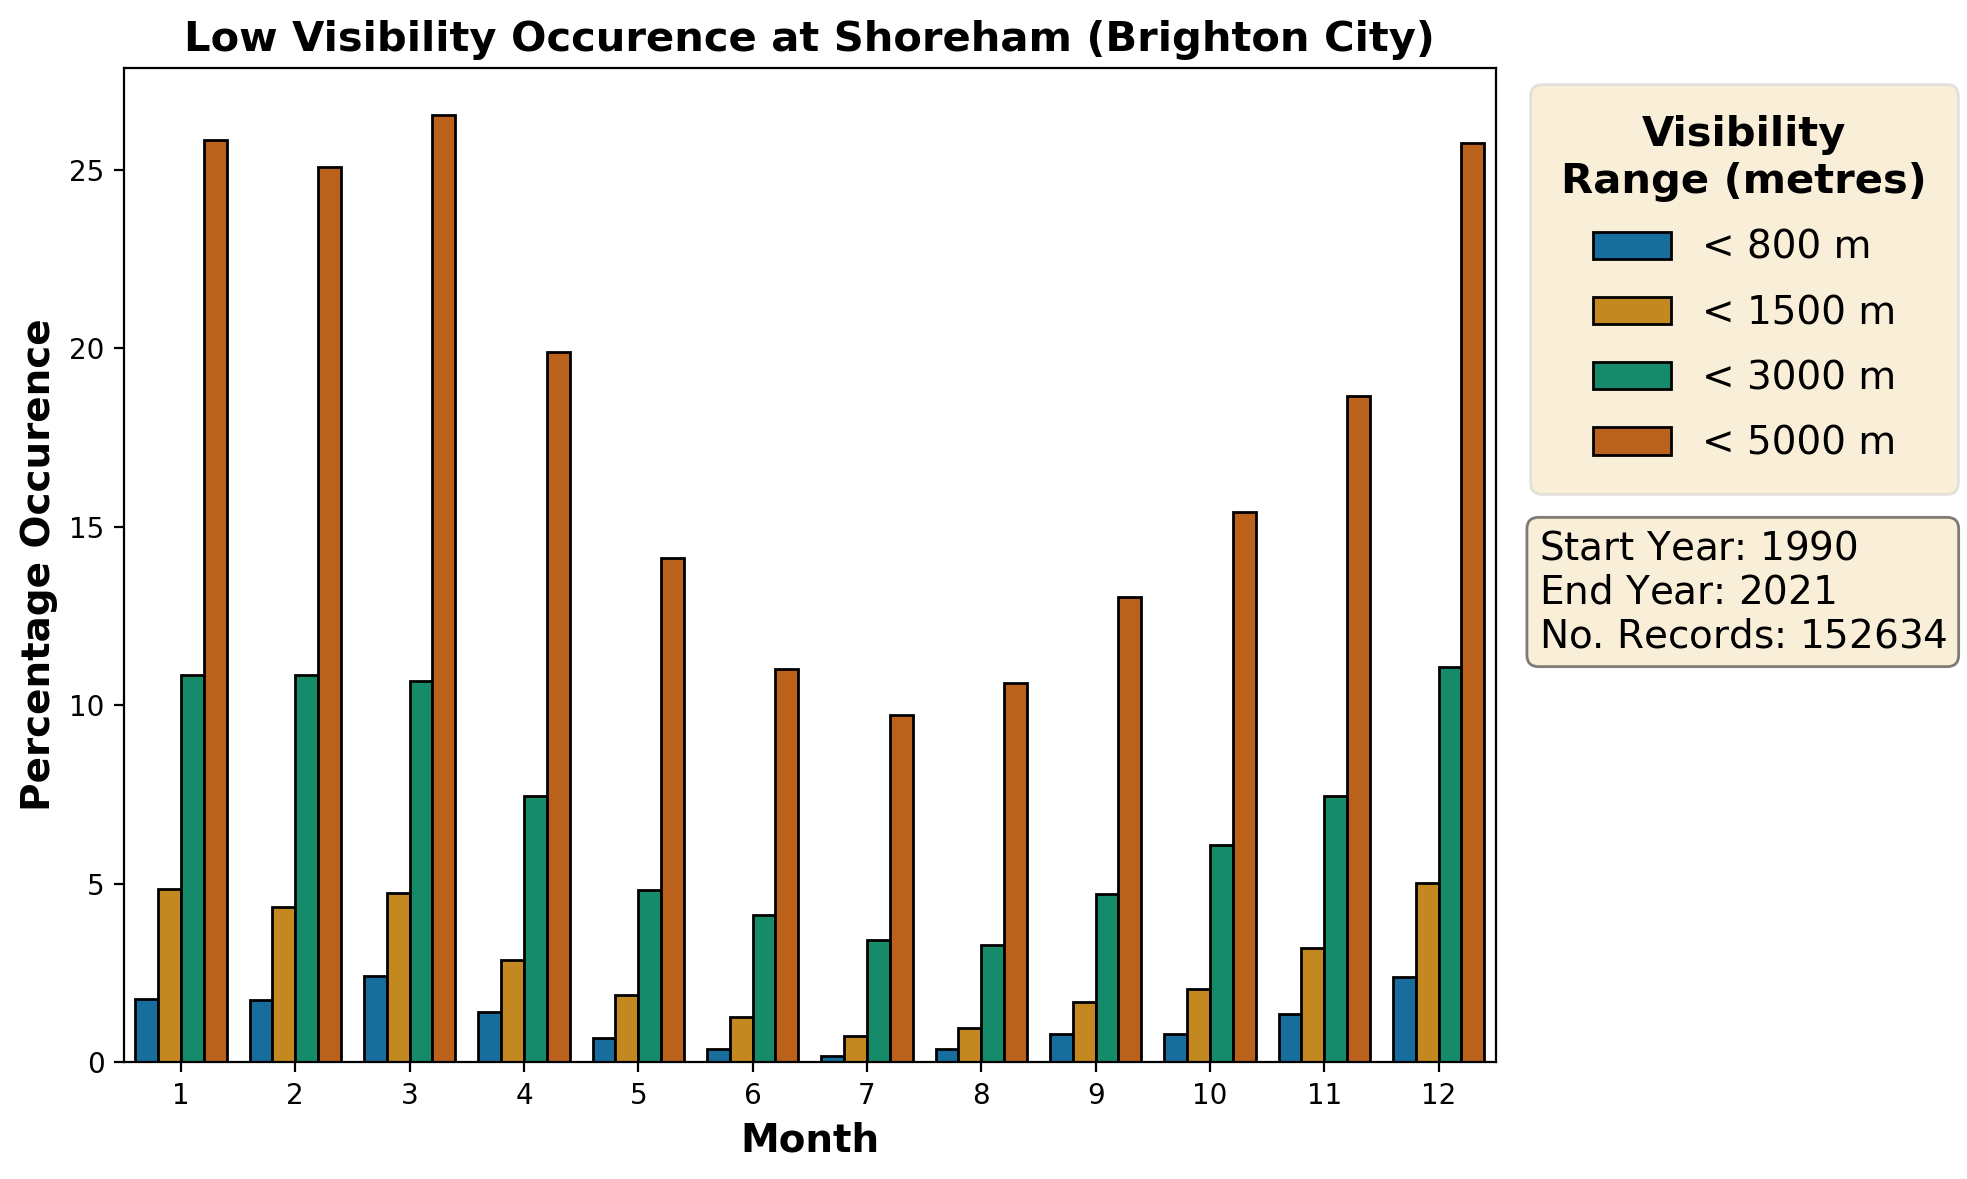
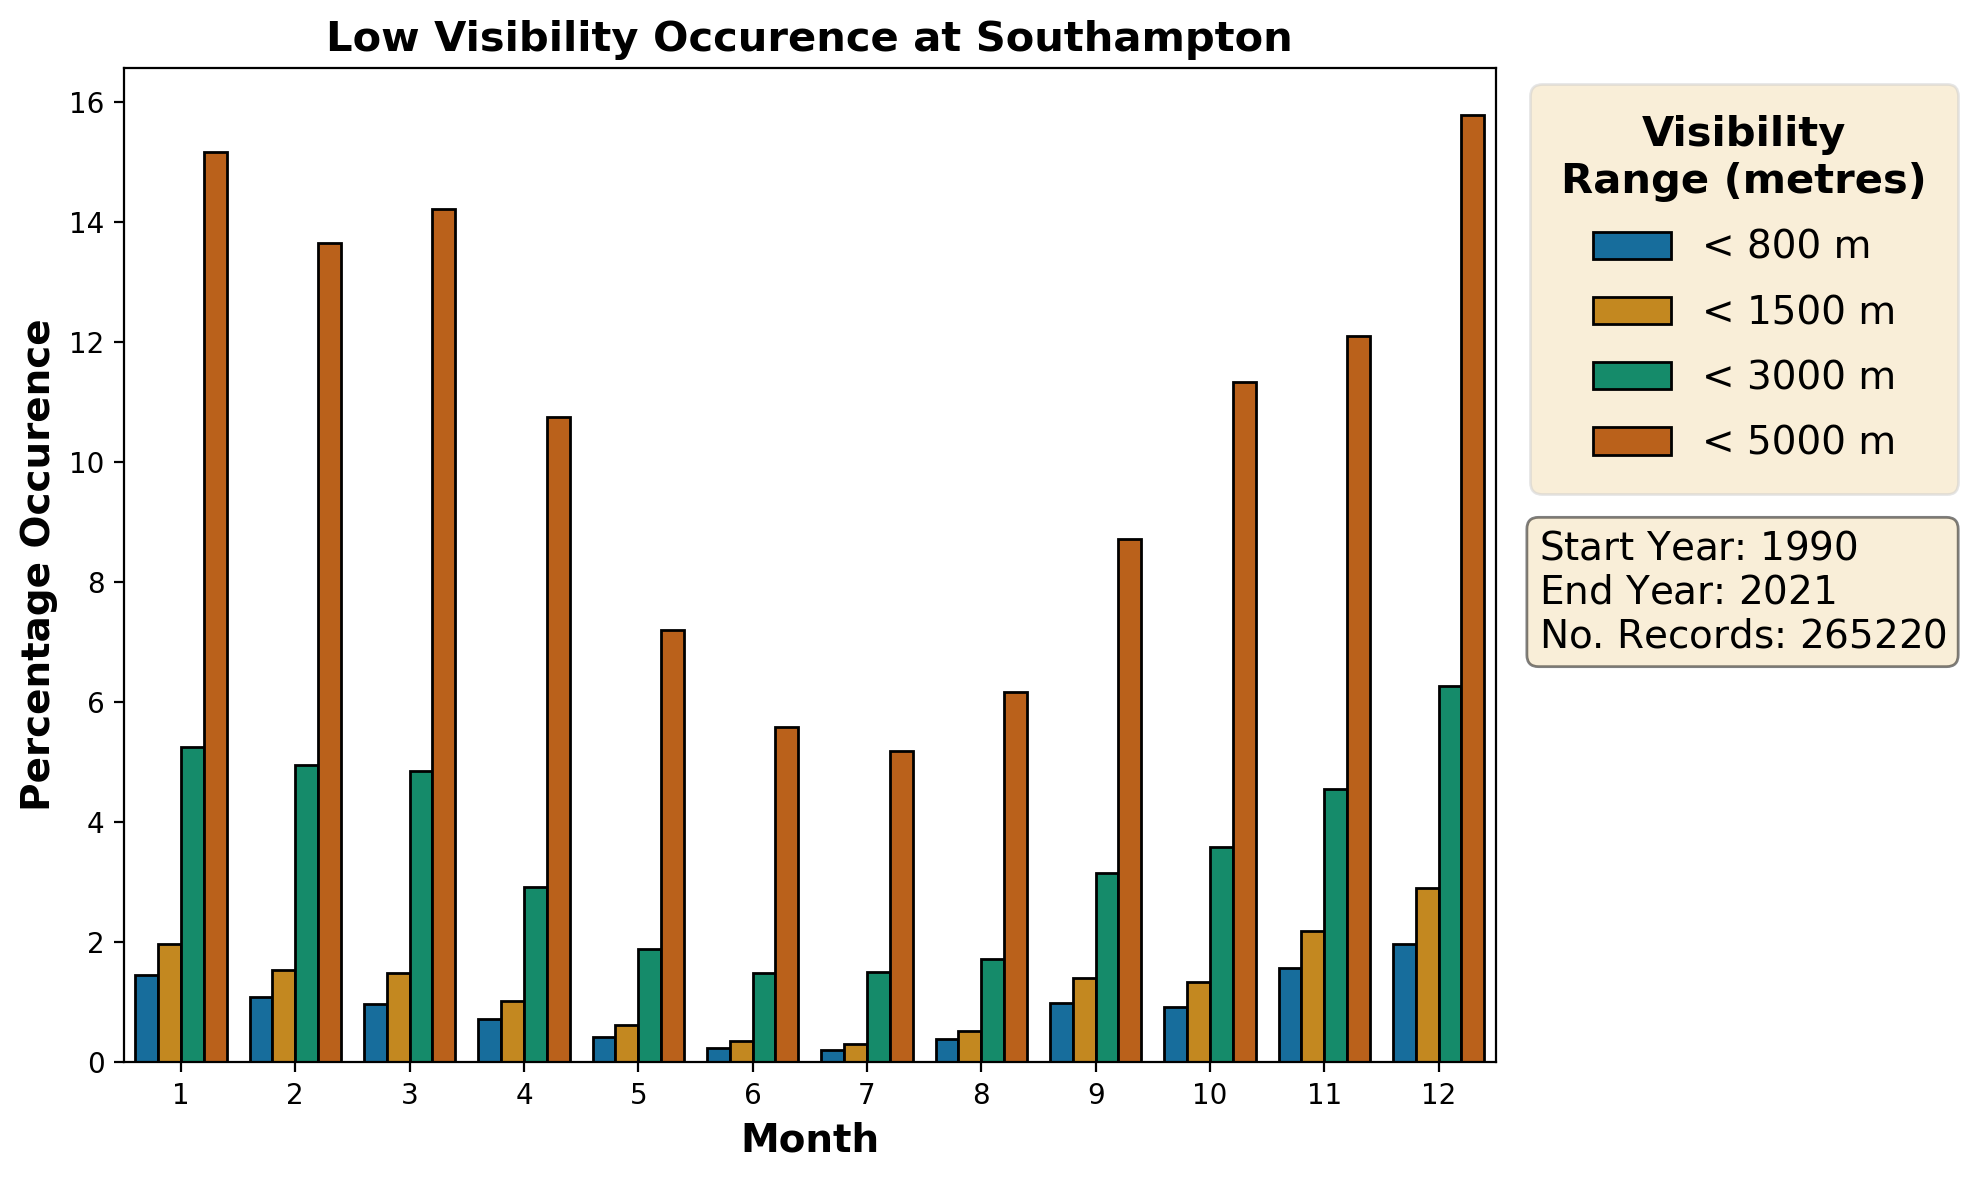
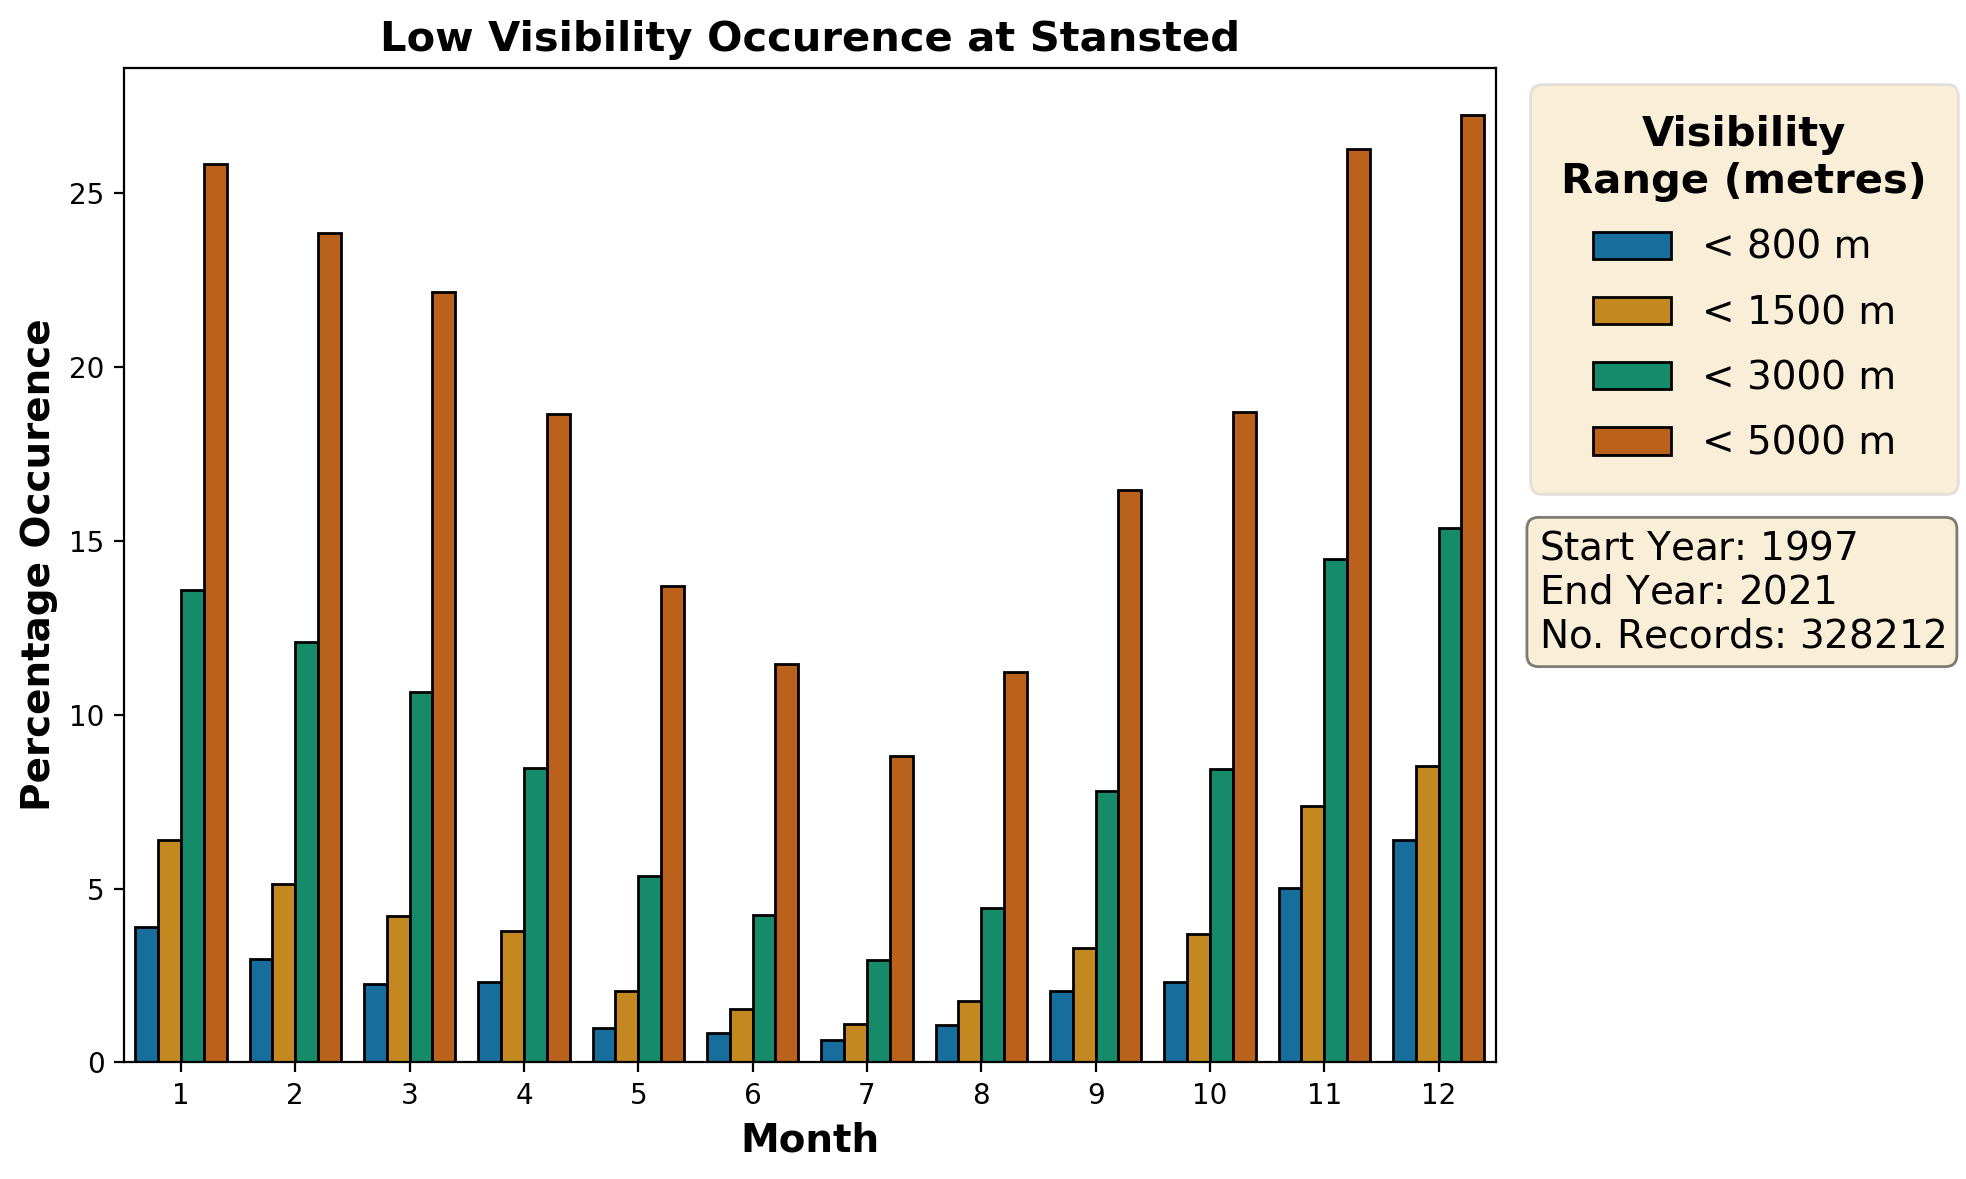
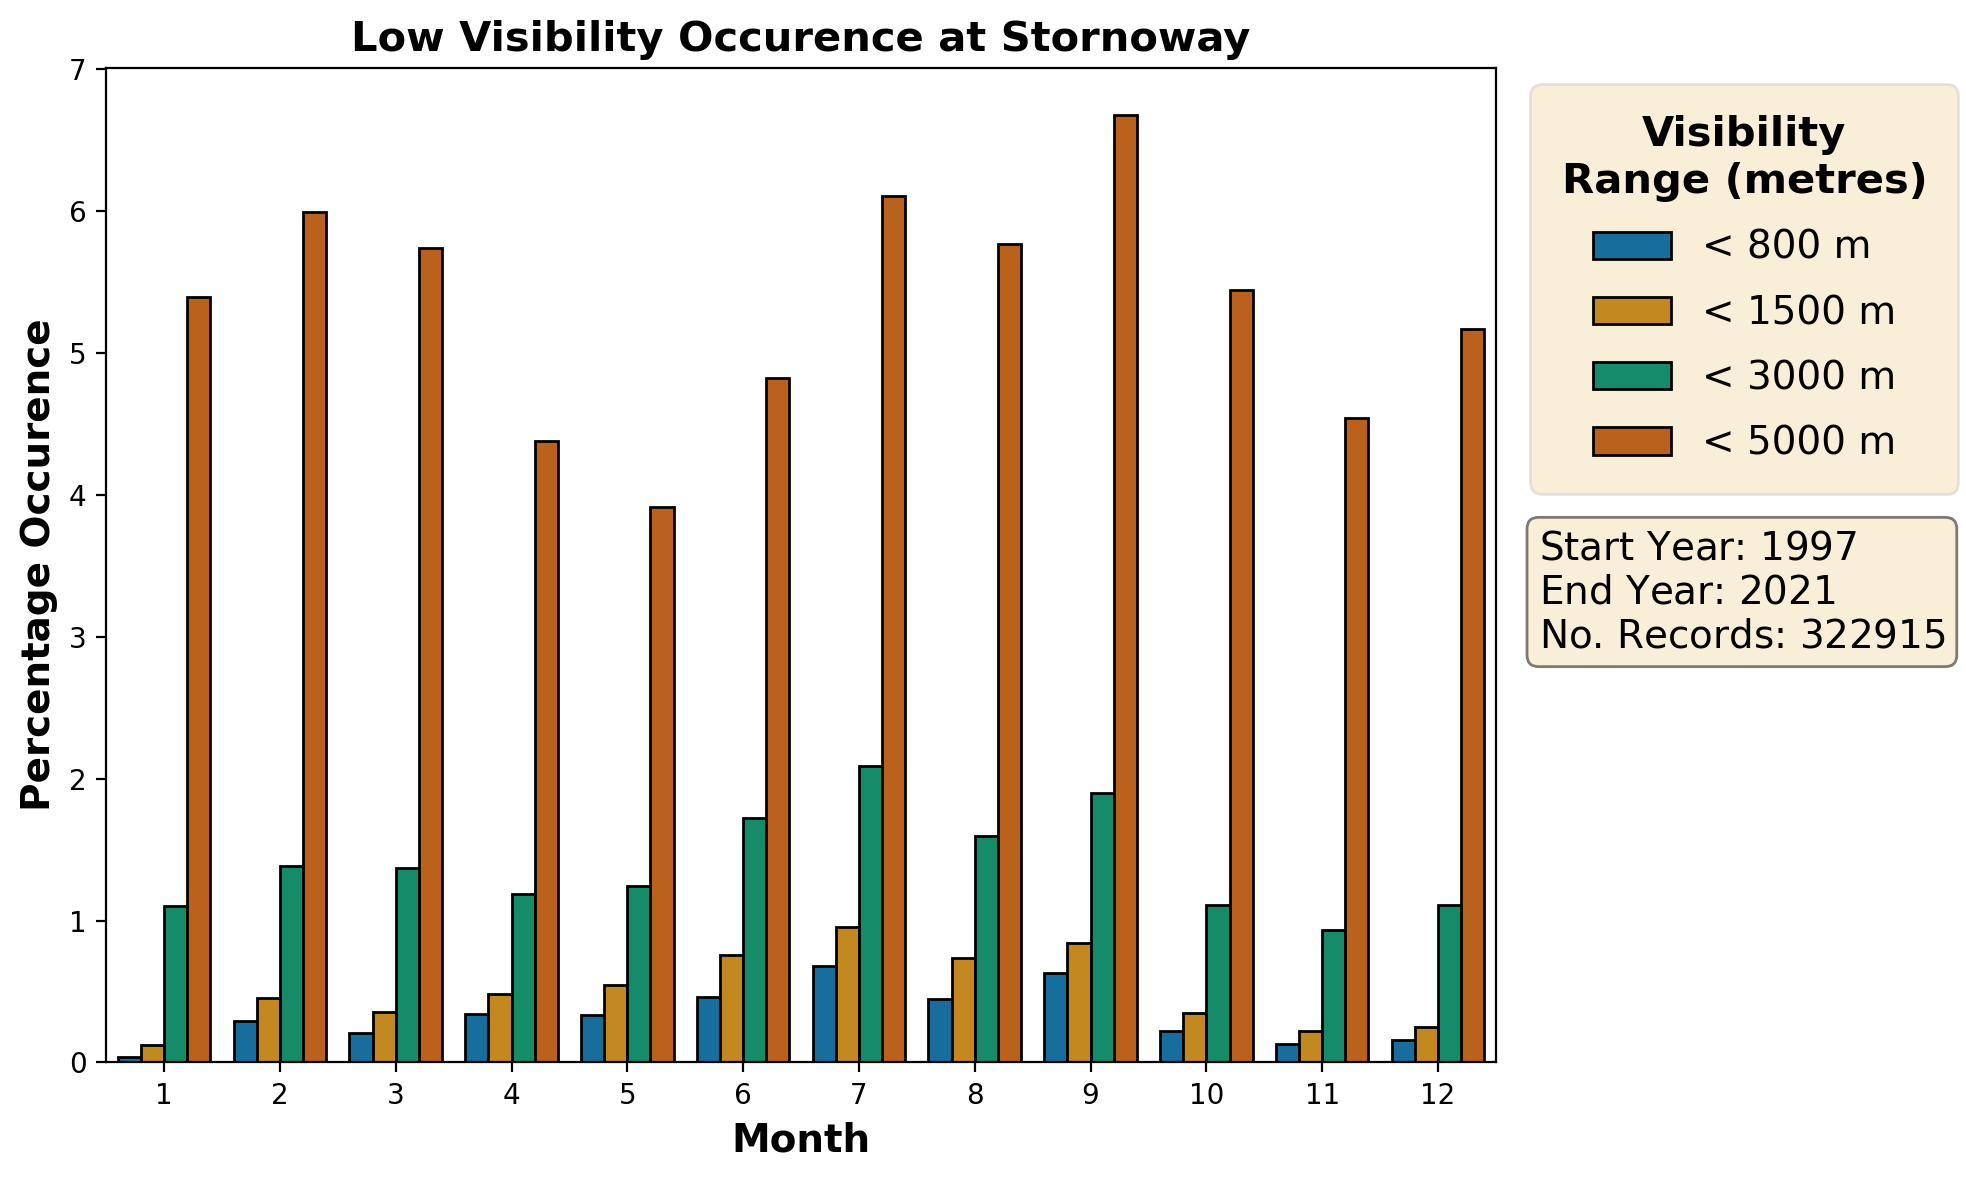
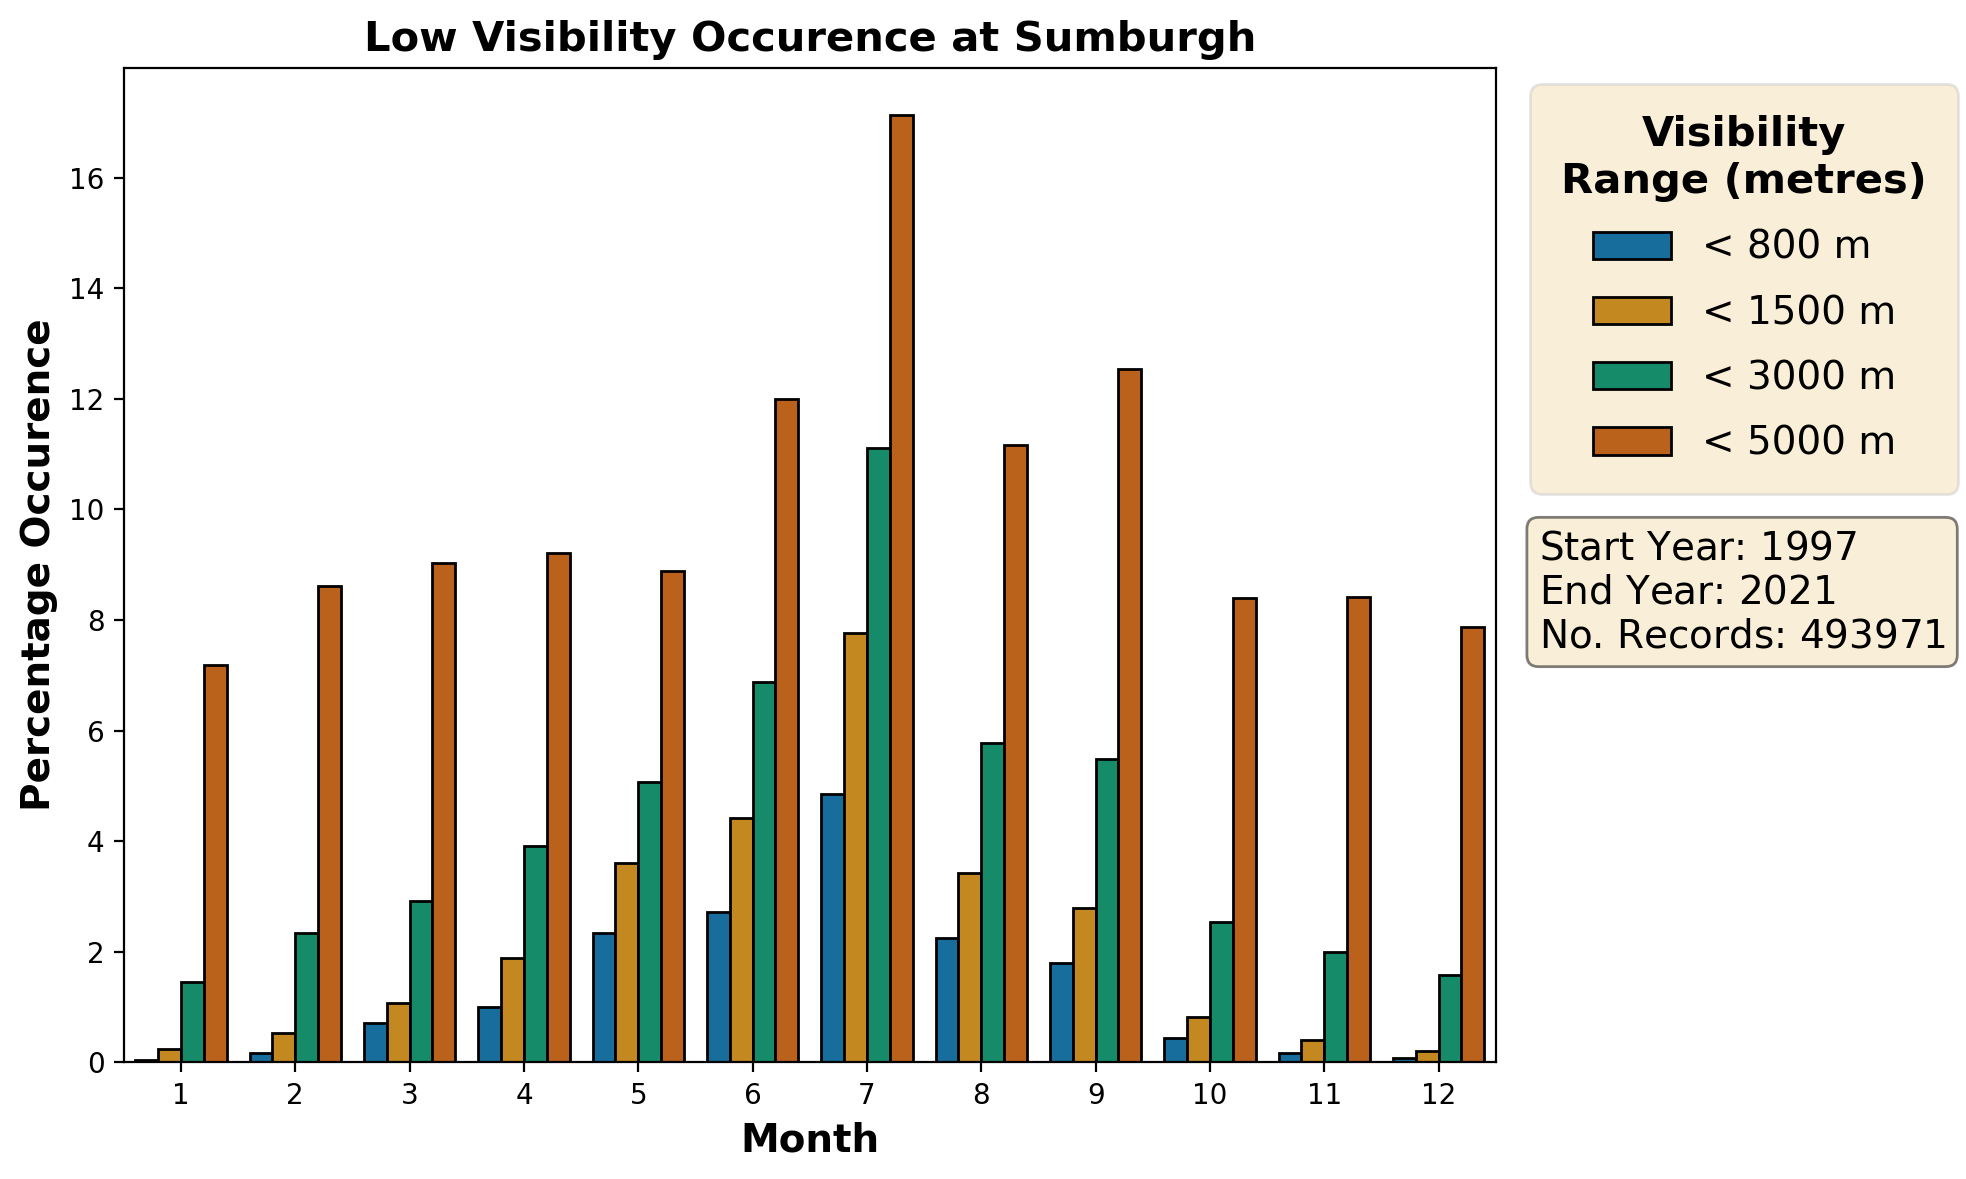
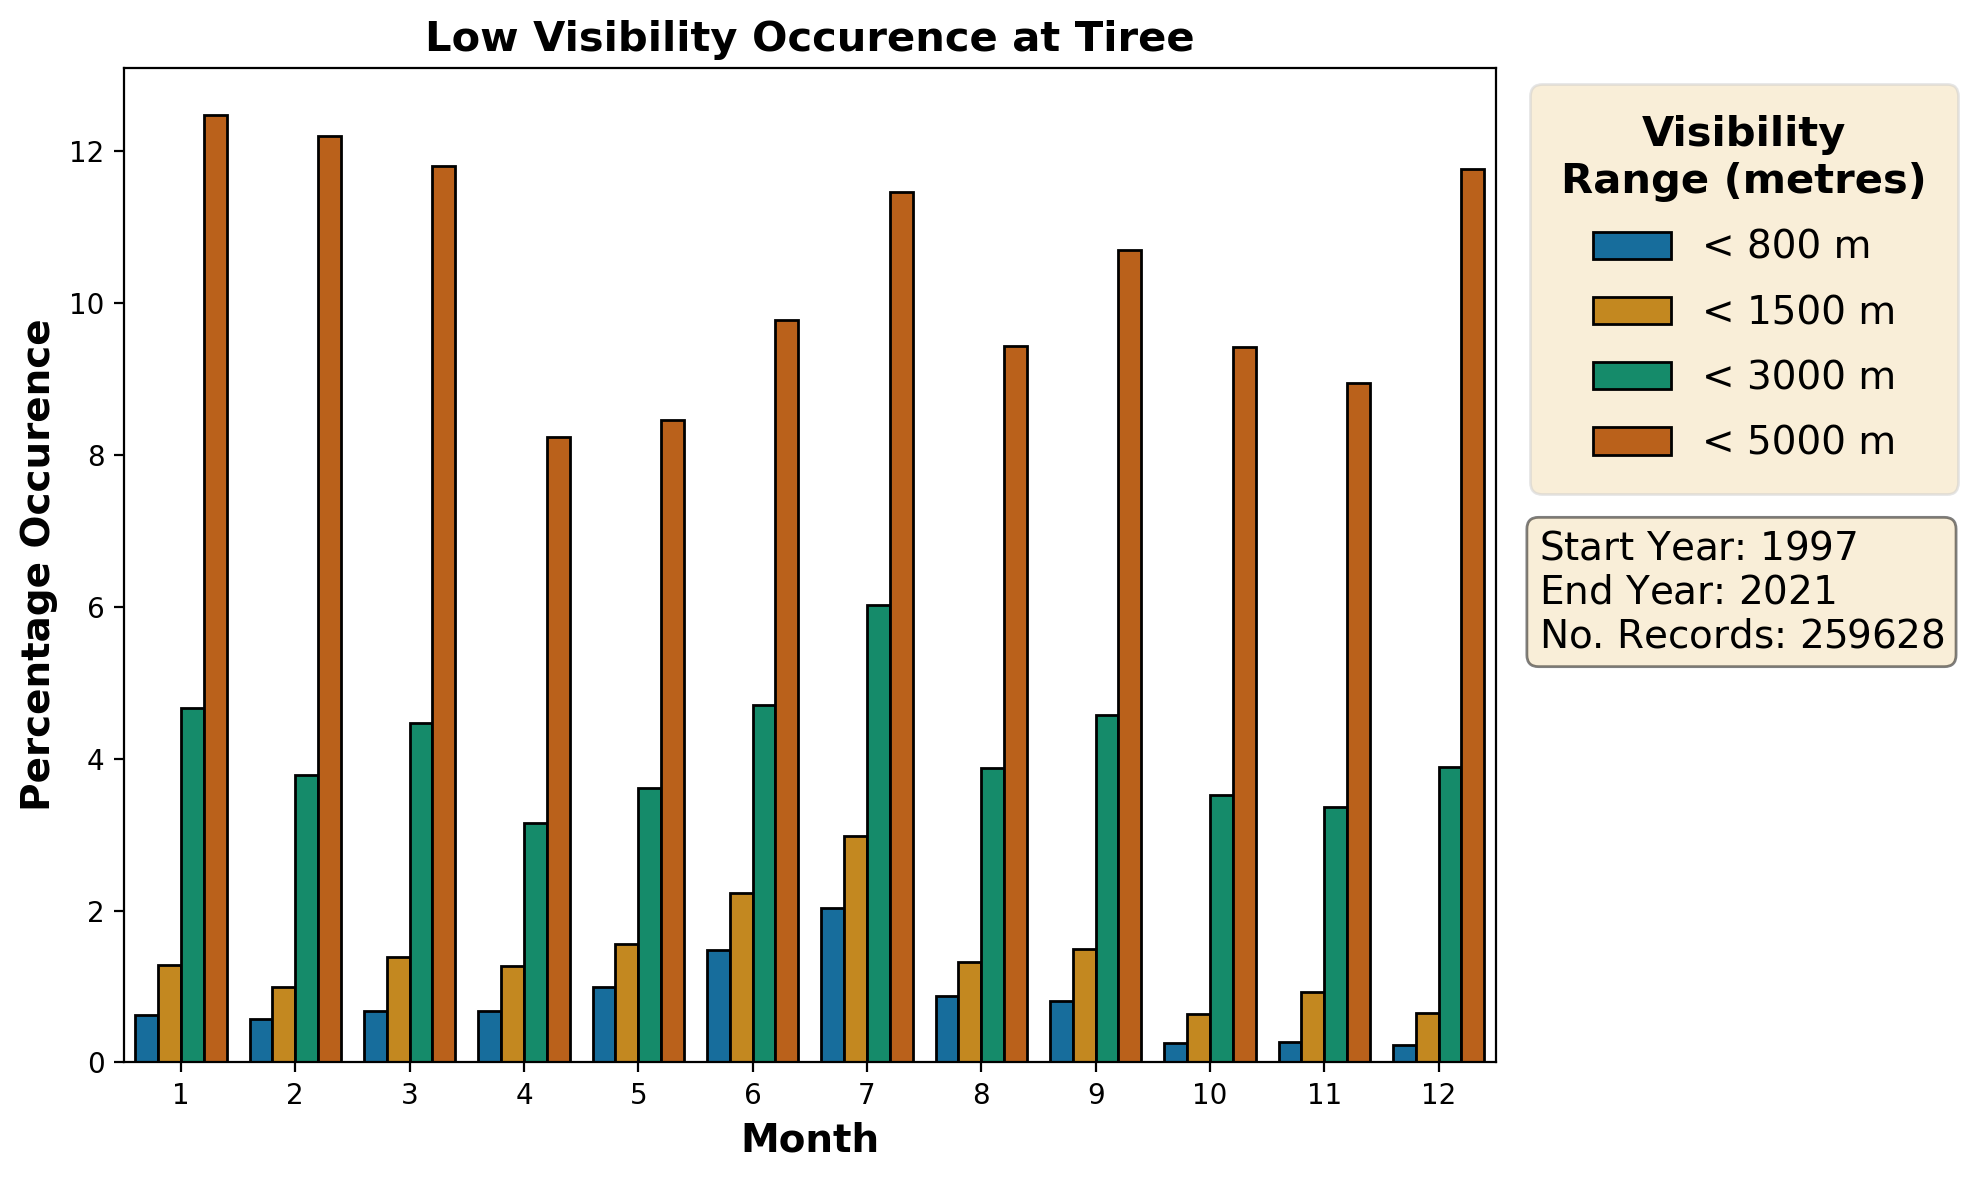
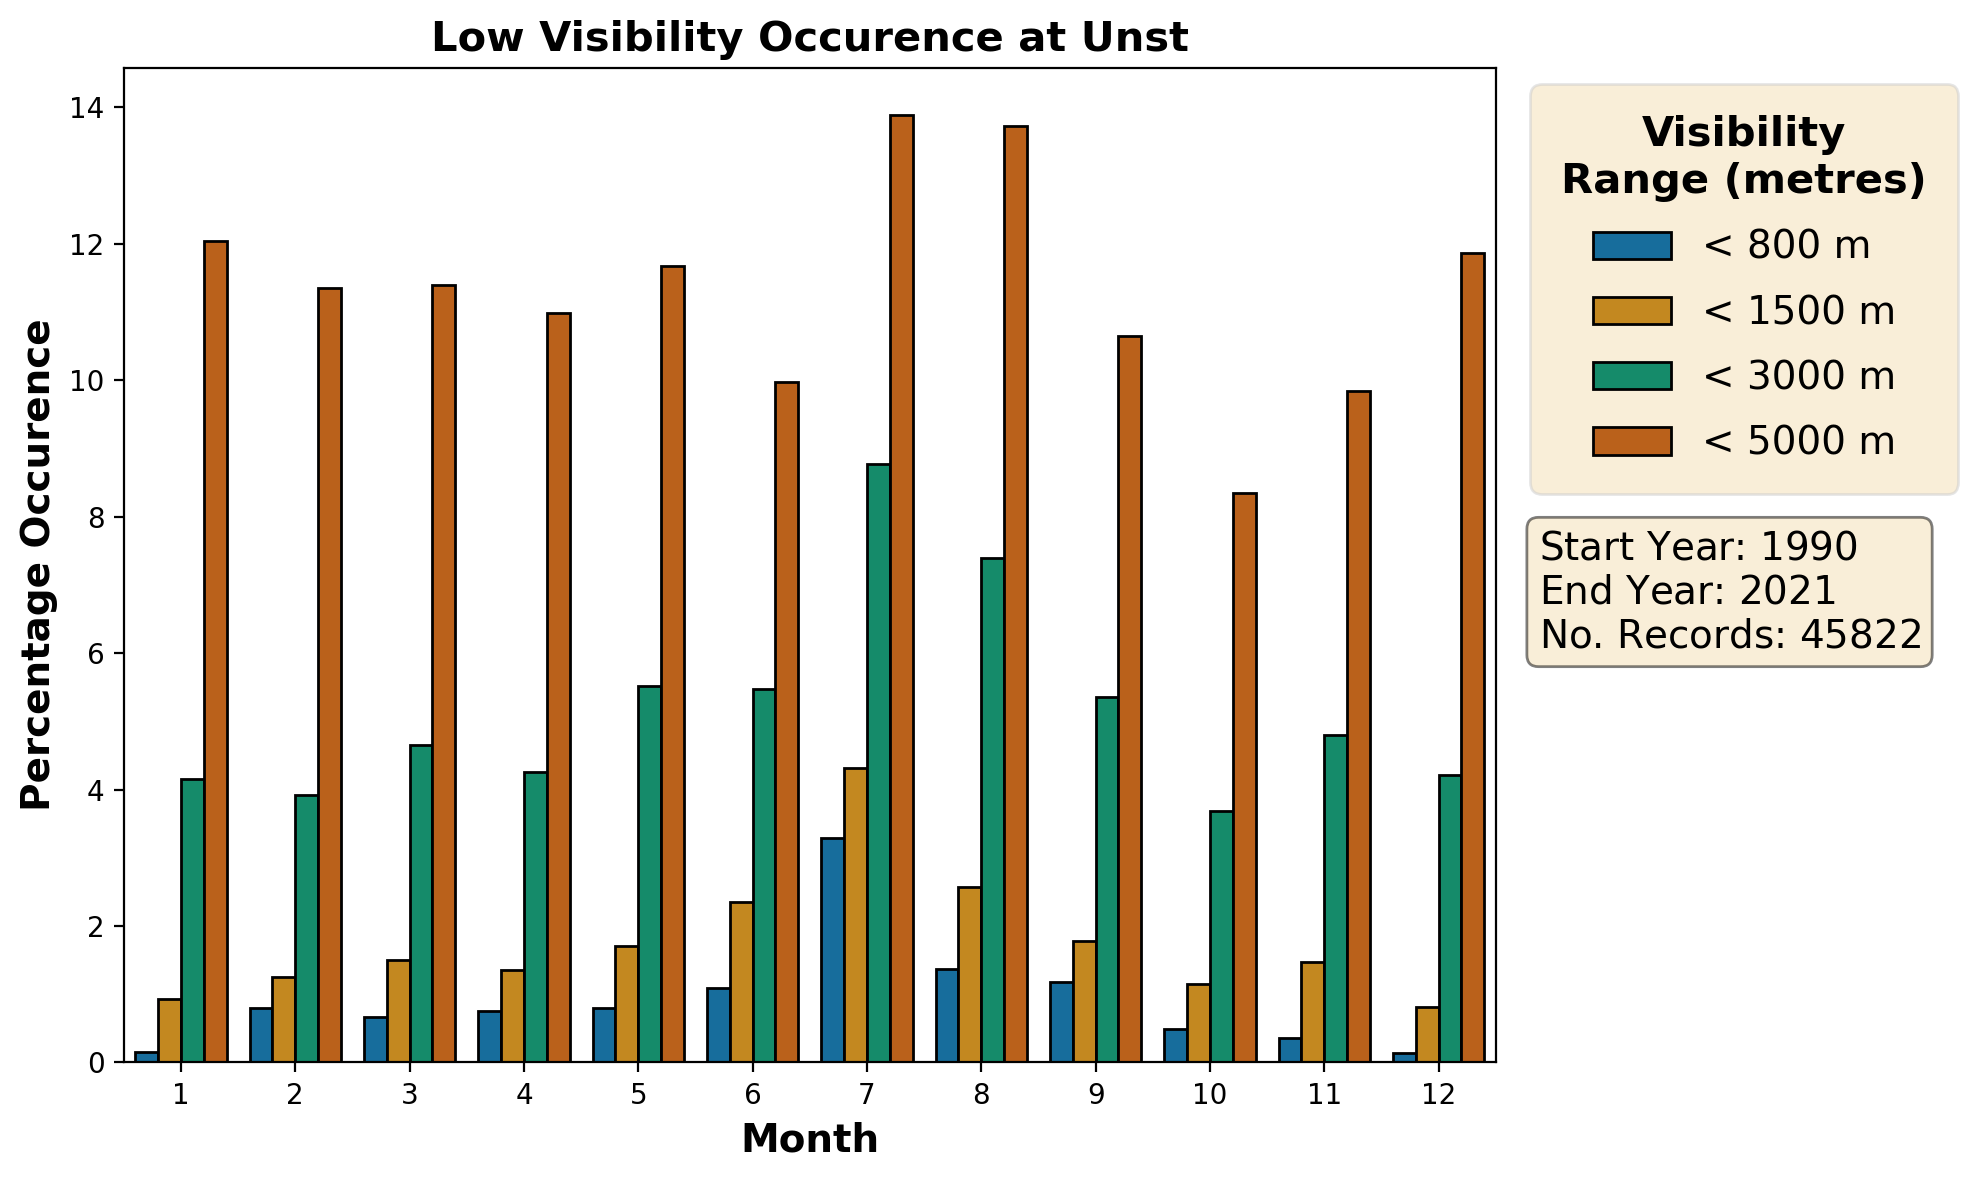
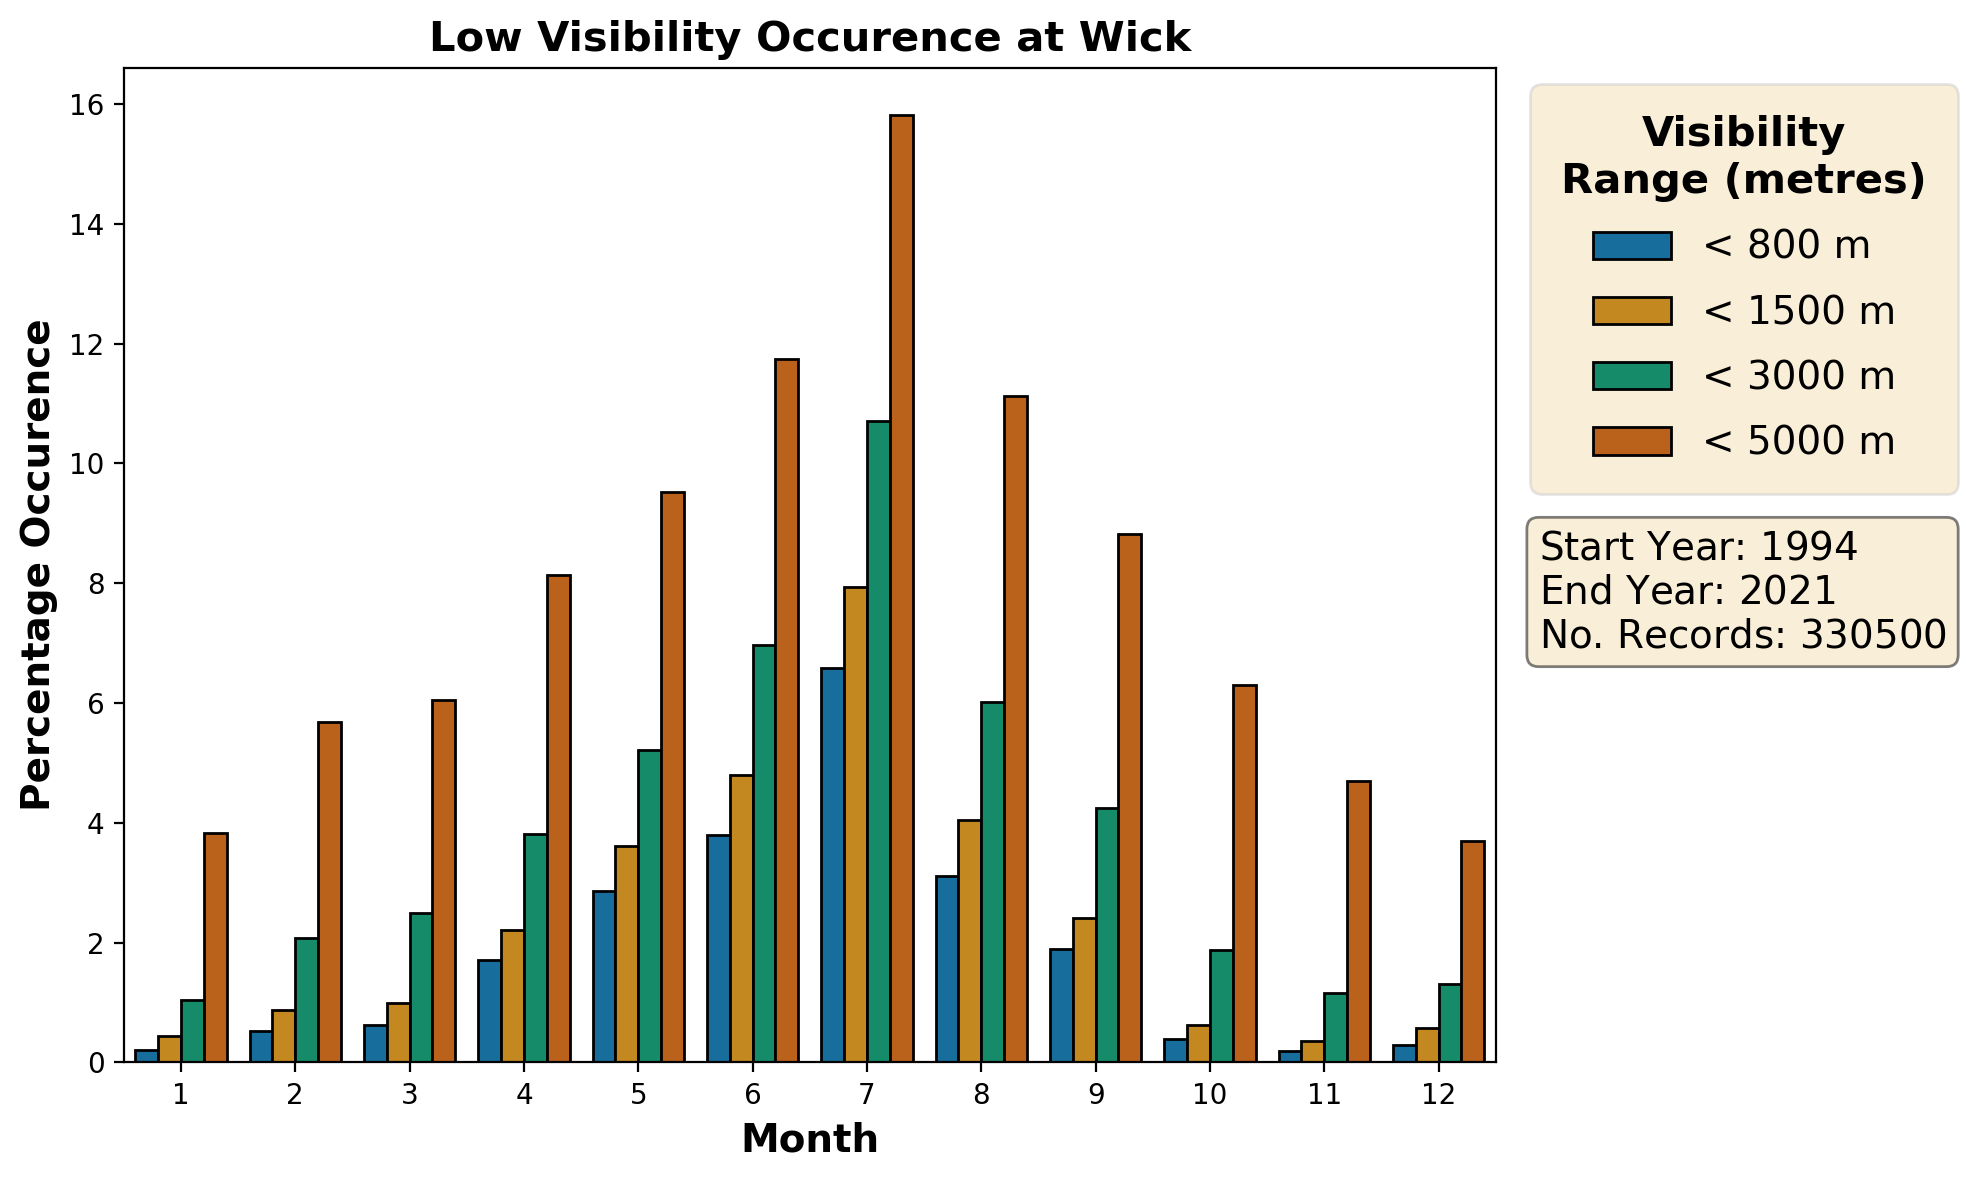
Visibility Percentage
This plot shows the percentage of total observations per month where minimum reported visibility fell below certain thresholds.
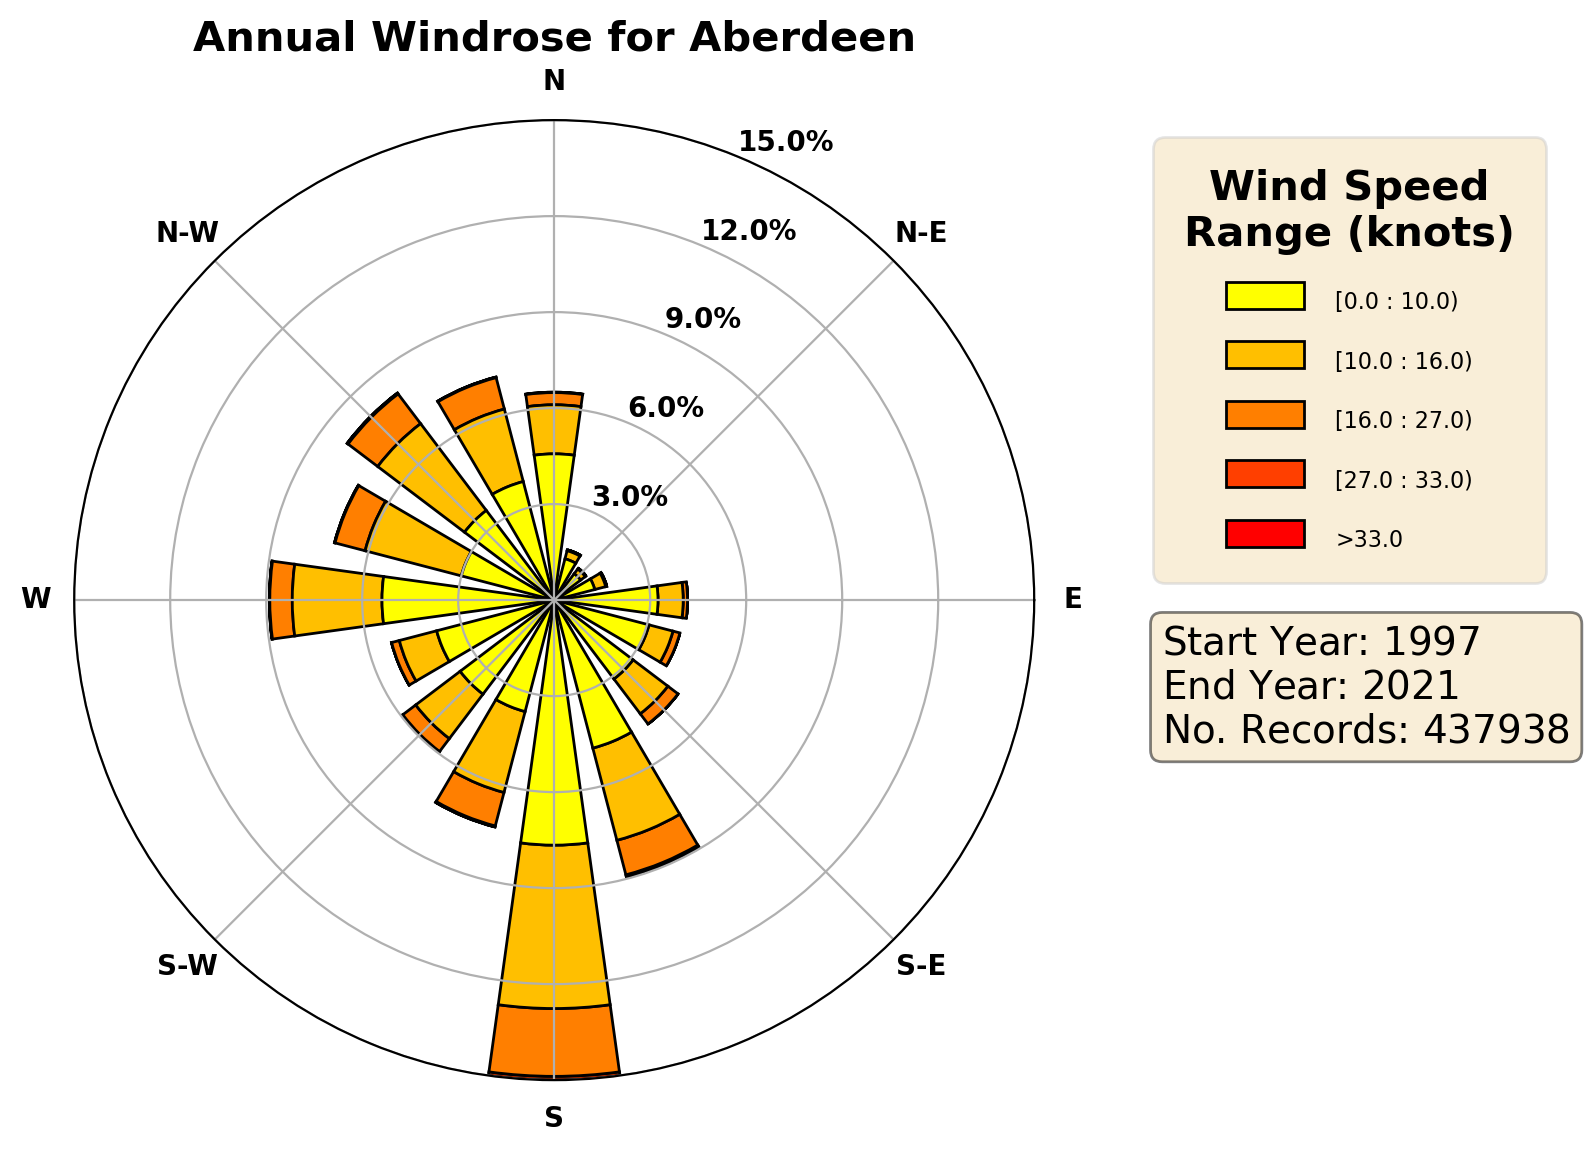
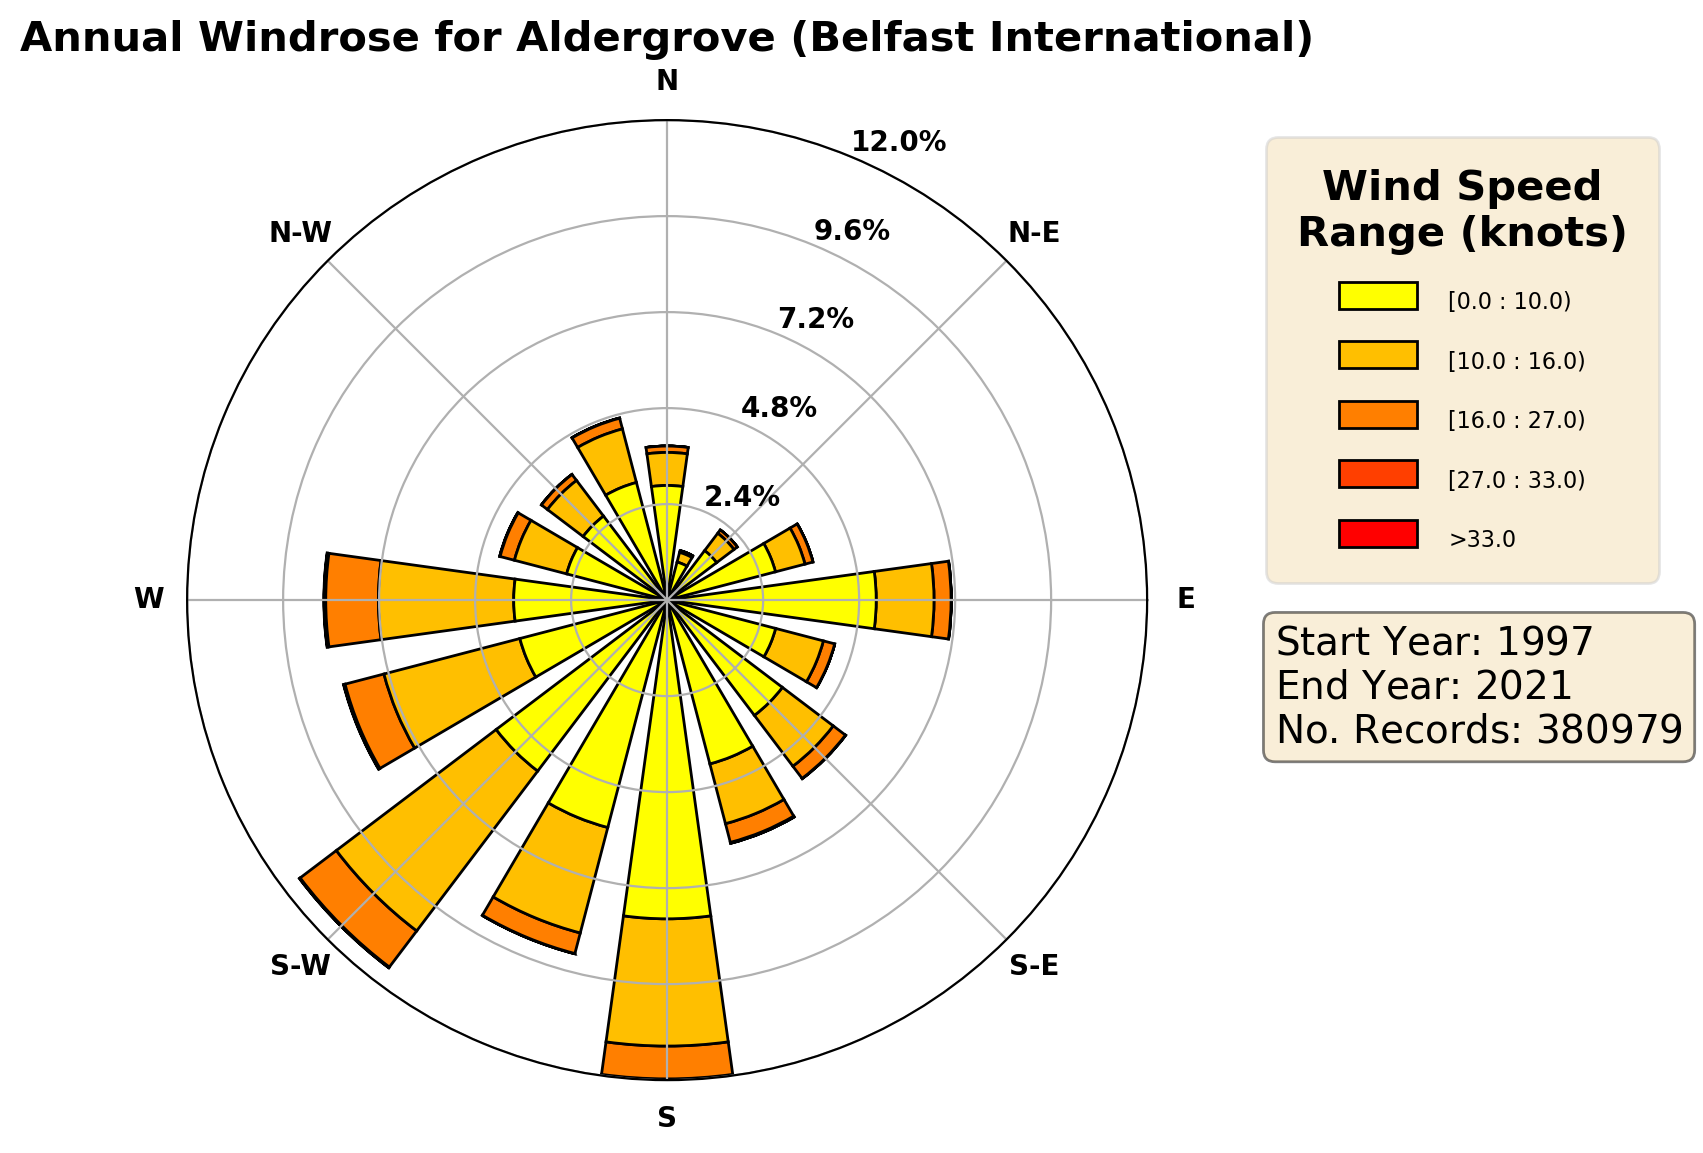
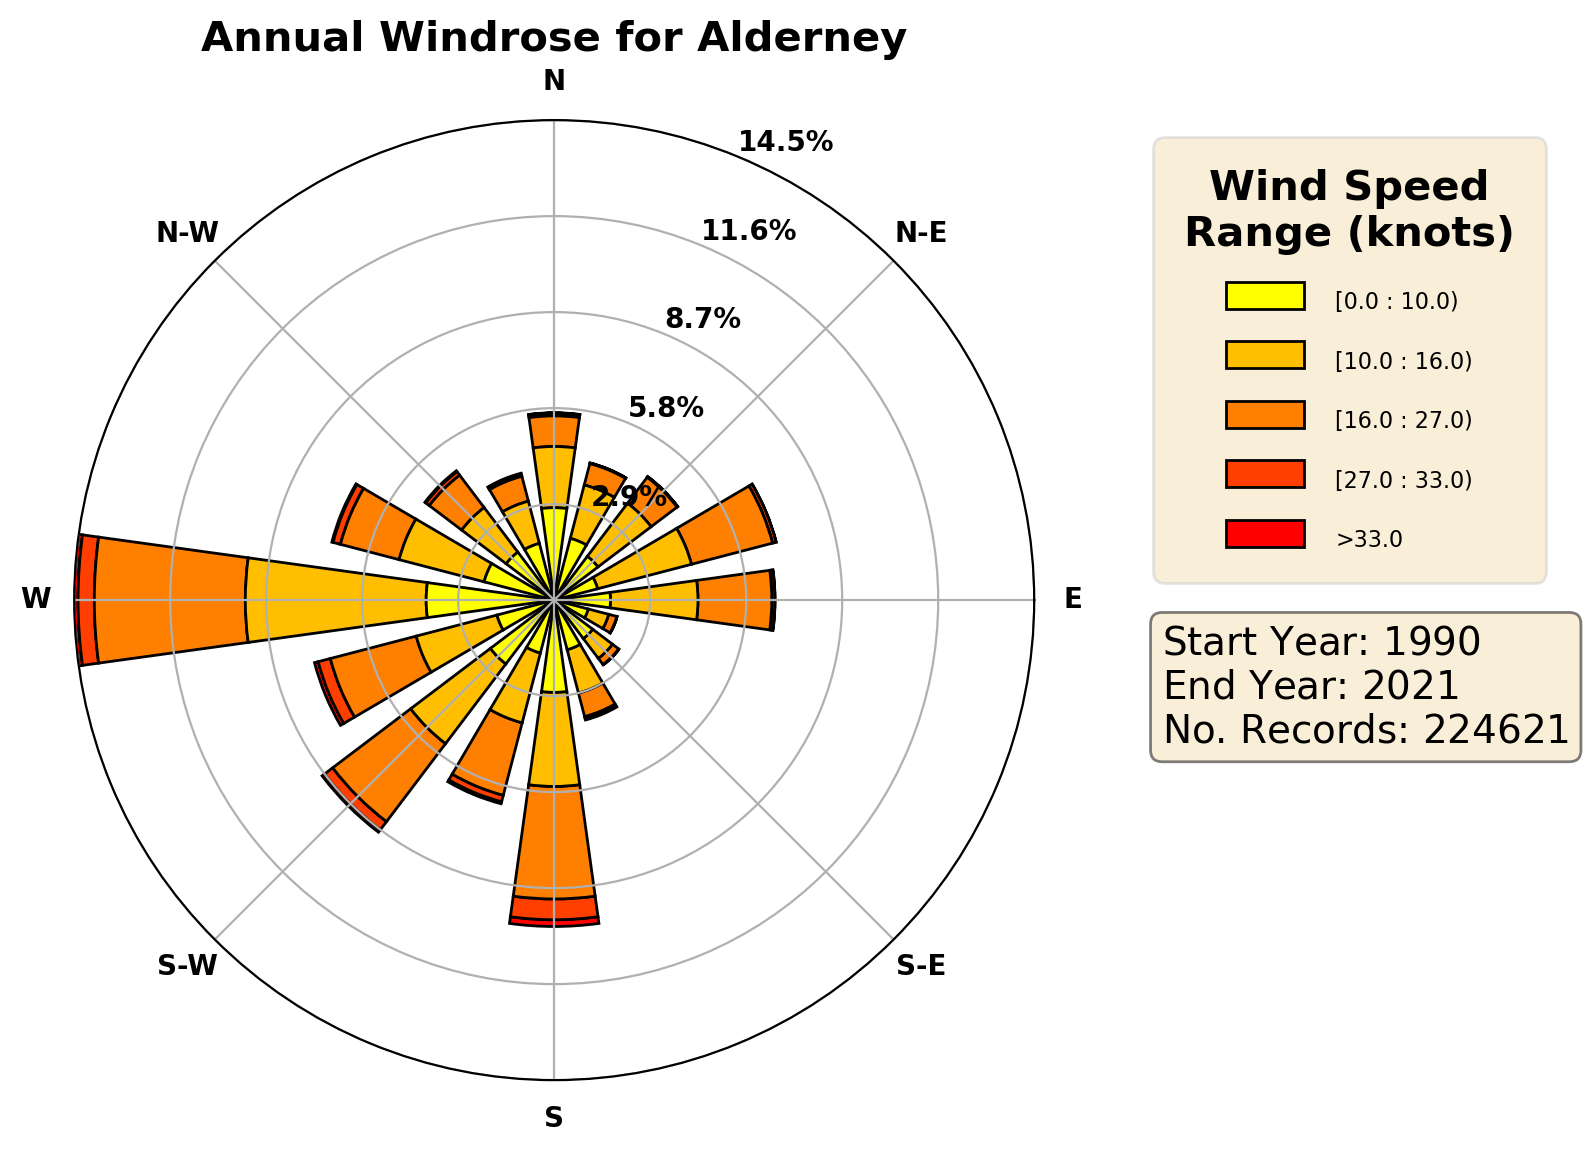
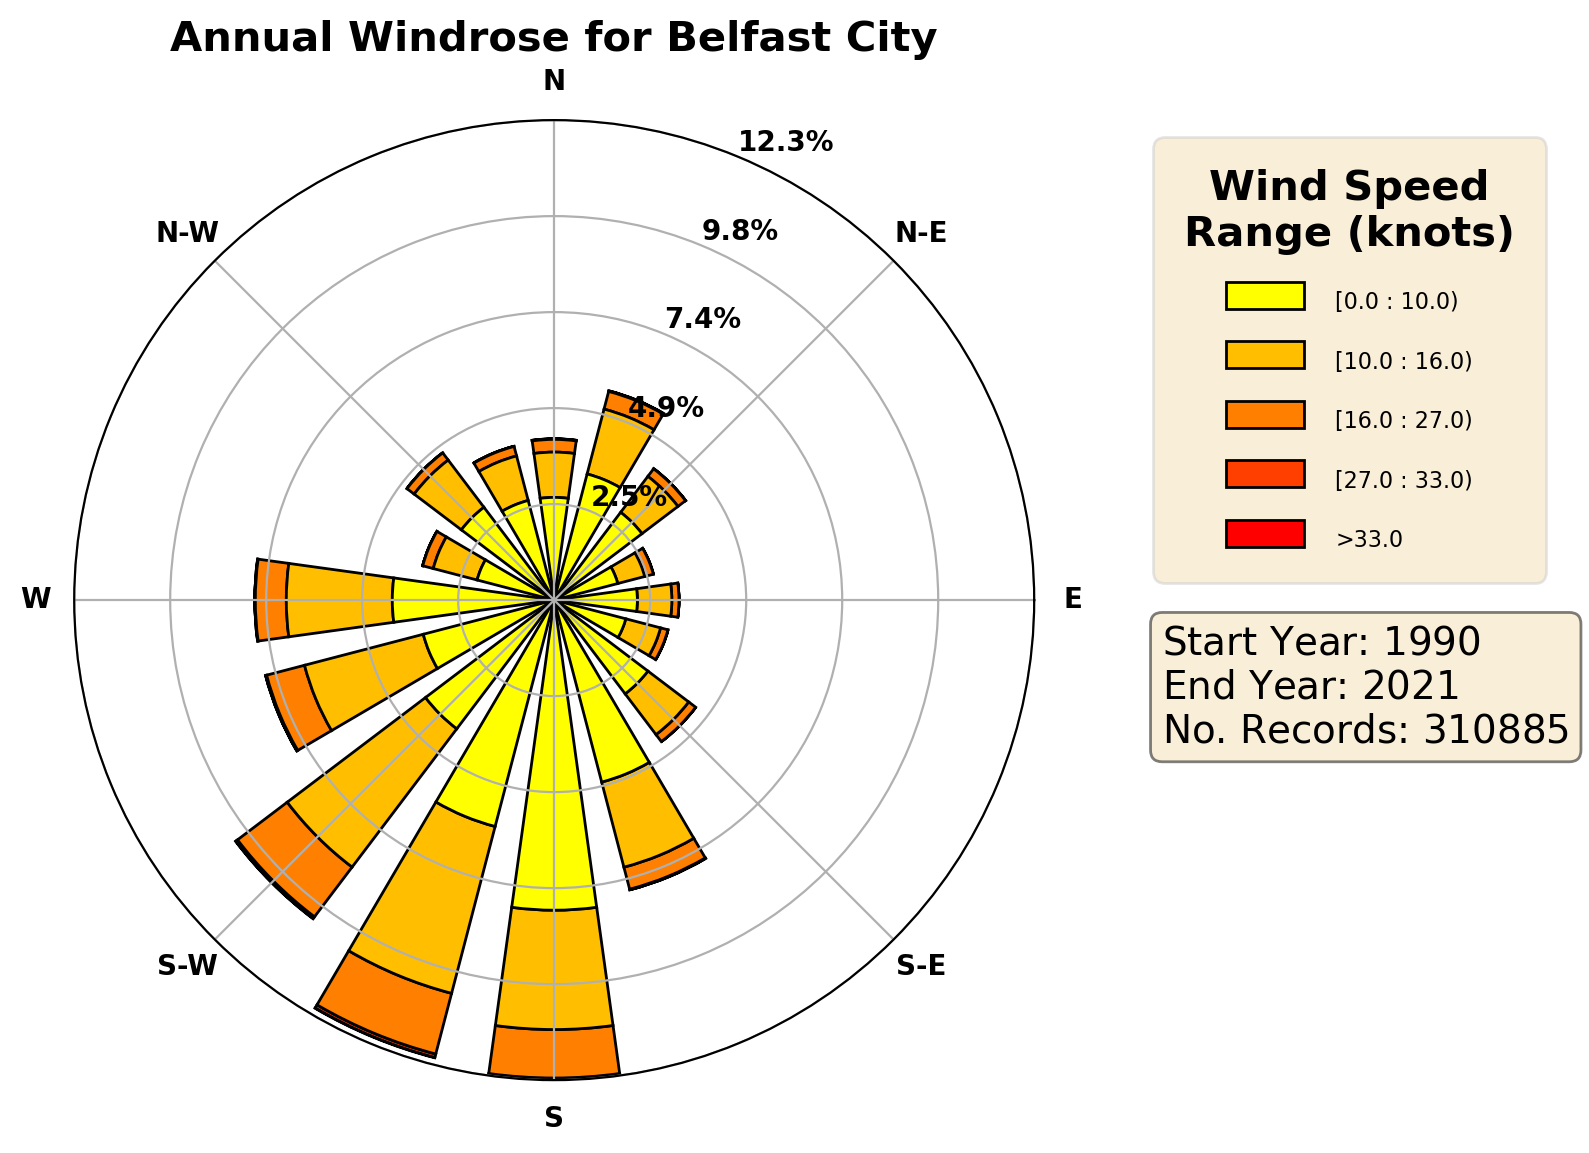
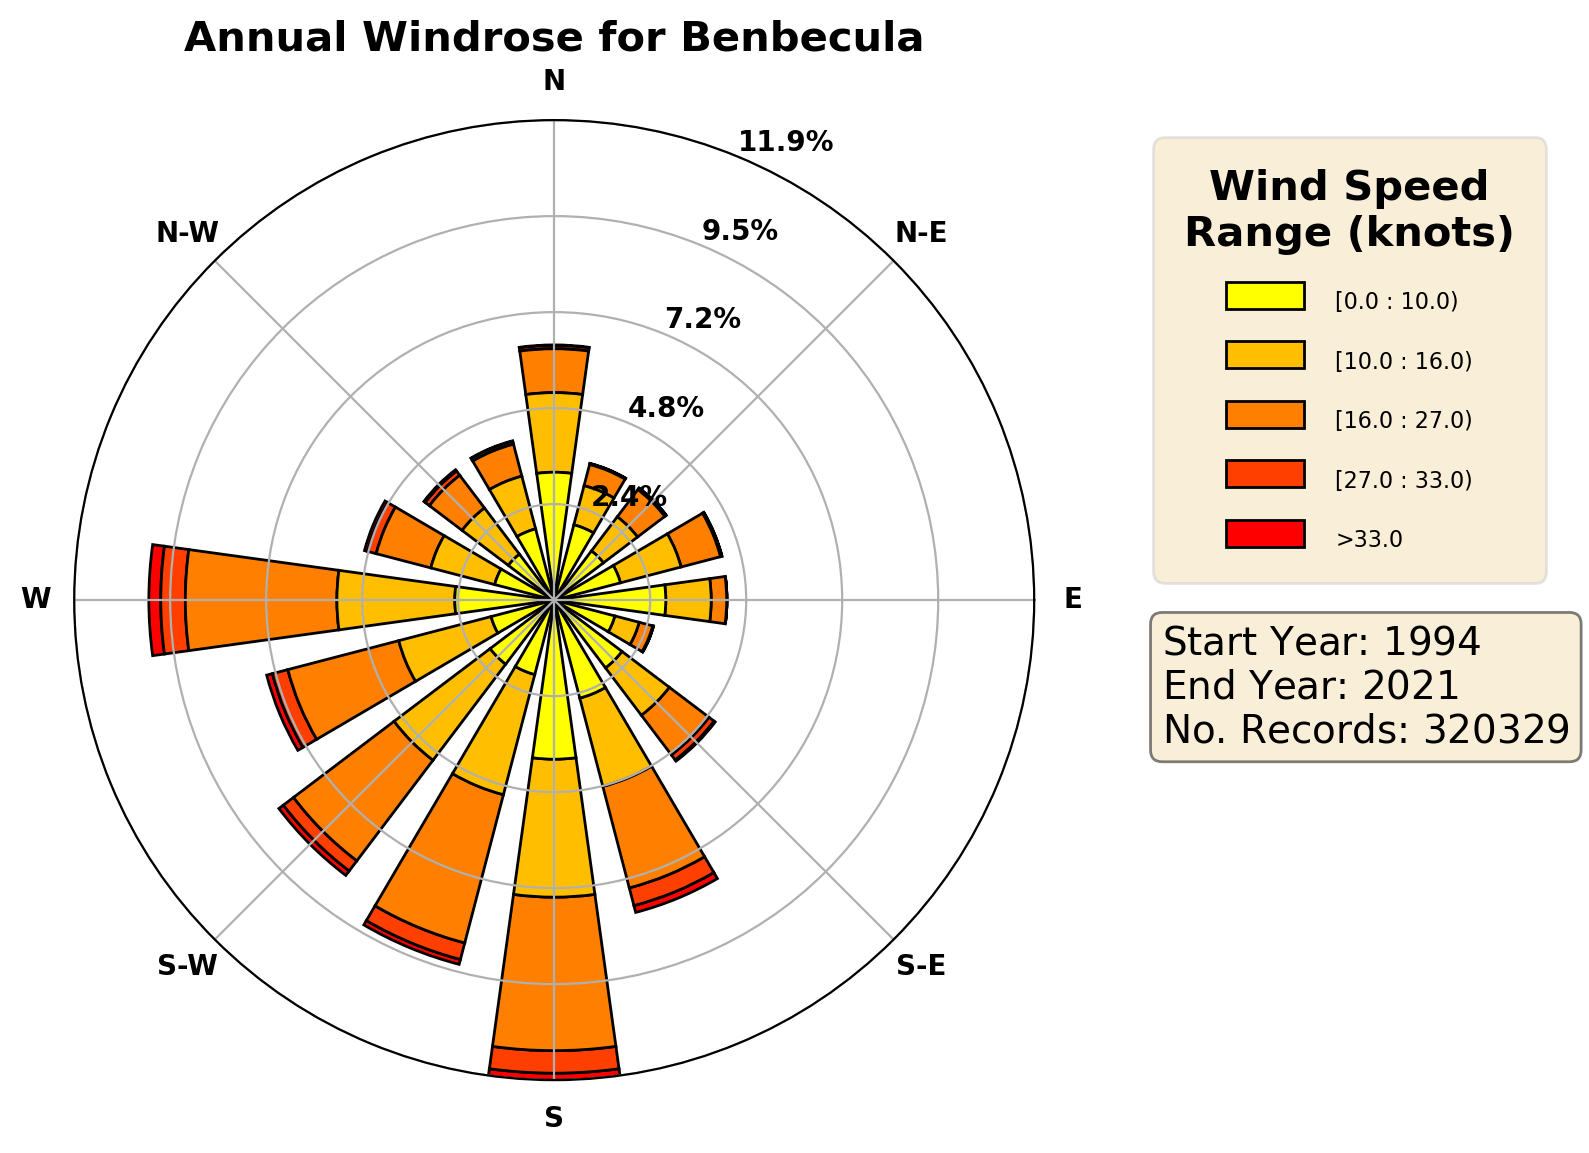
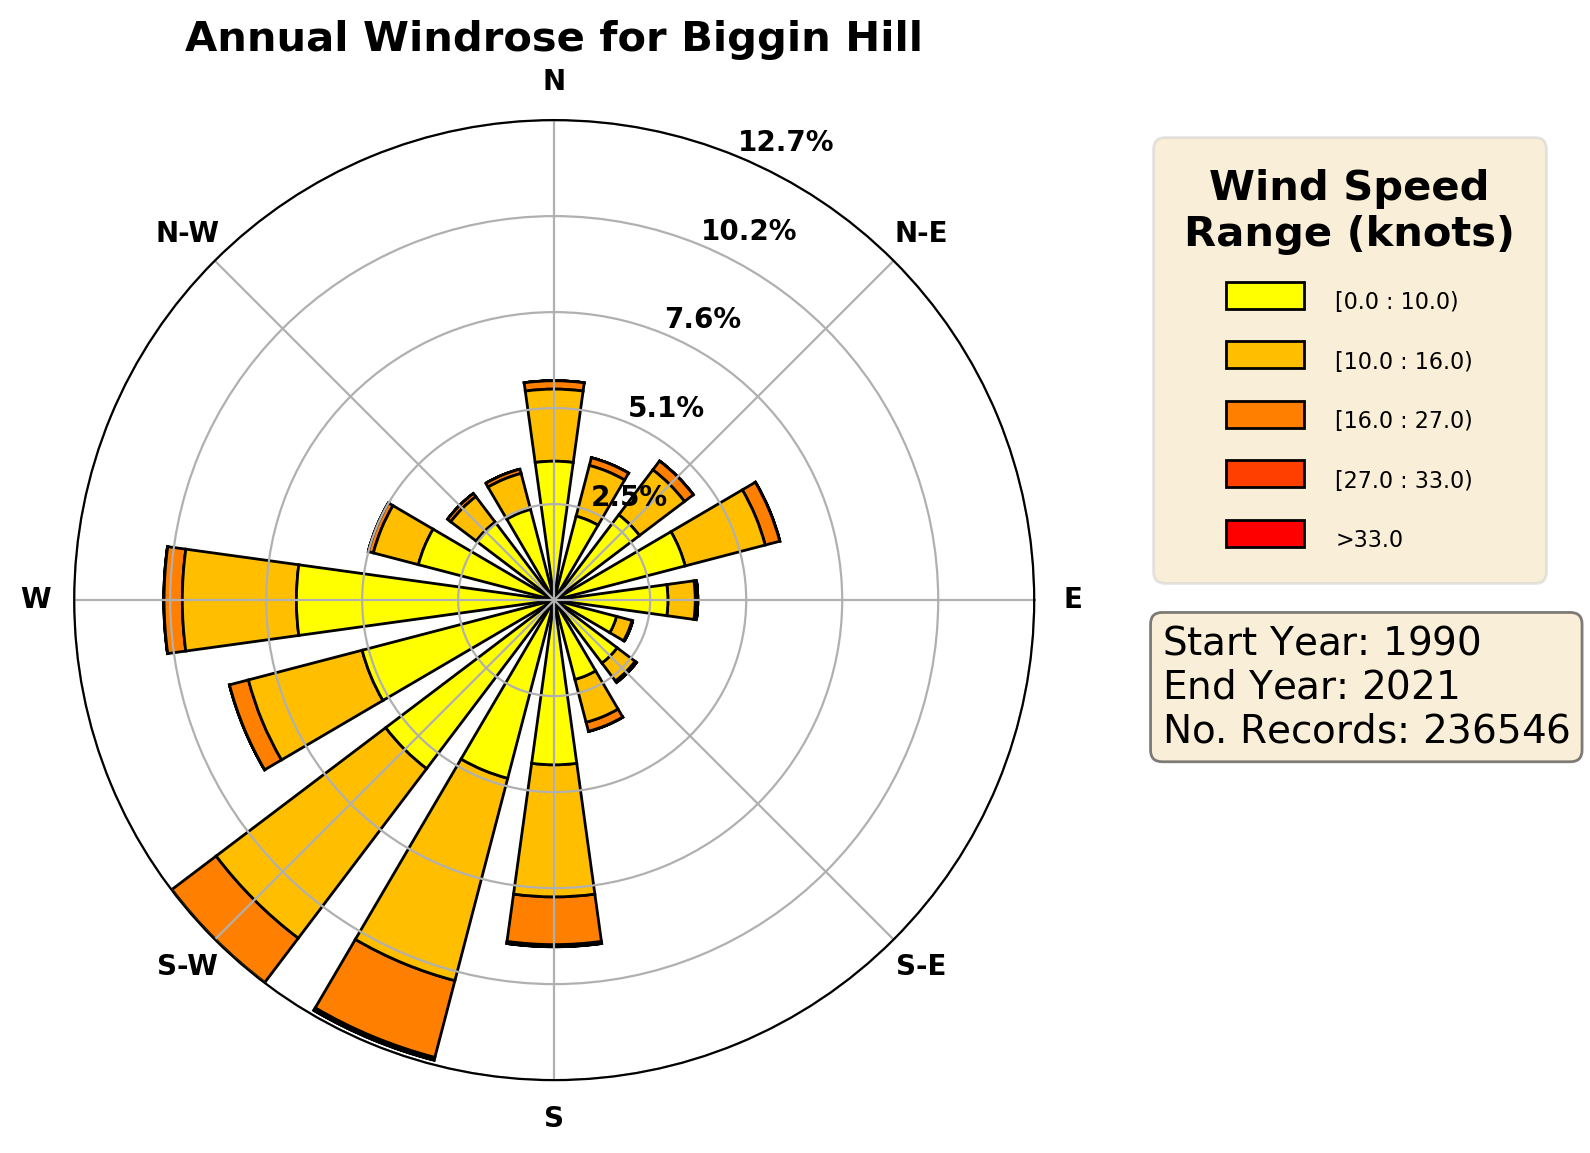
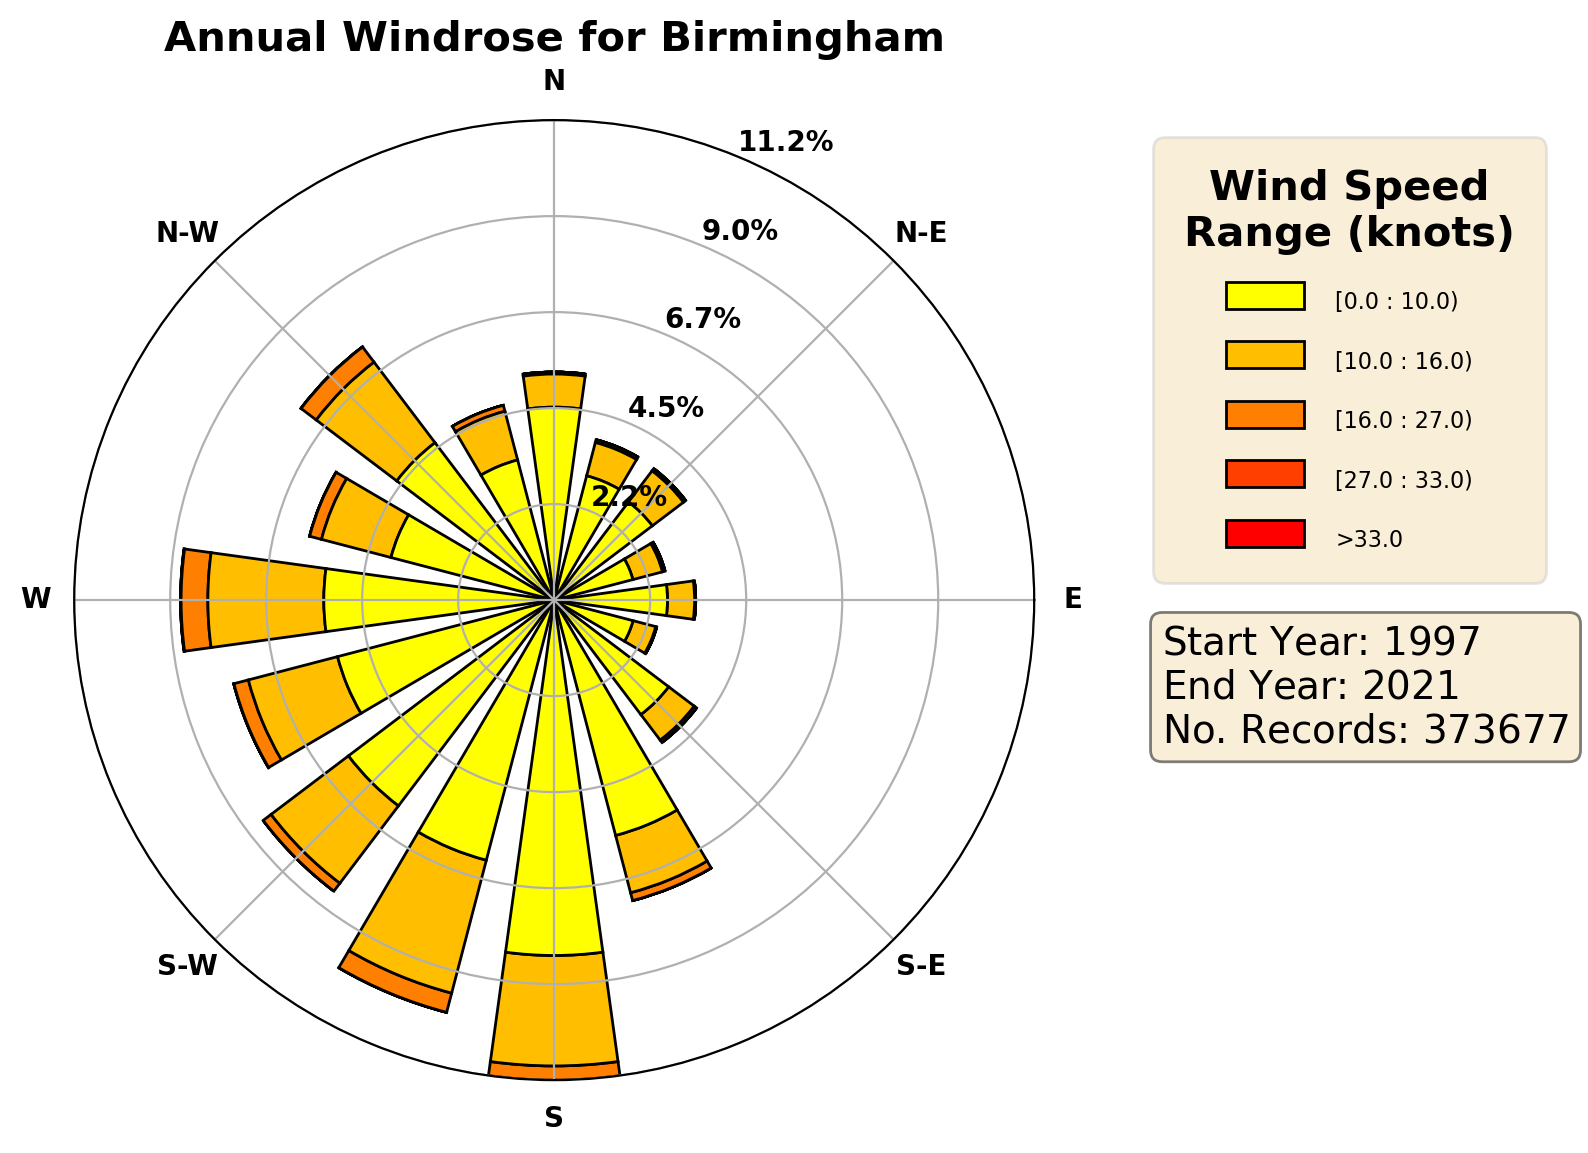
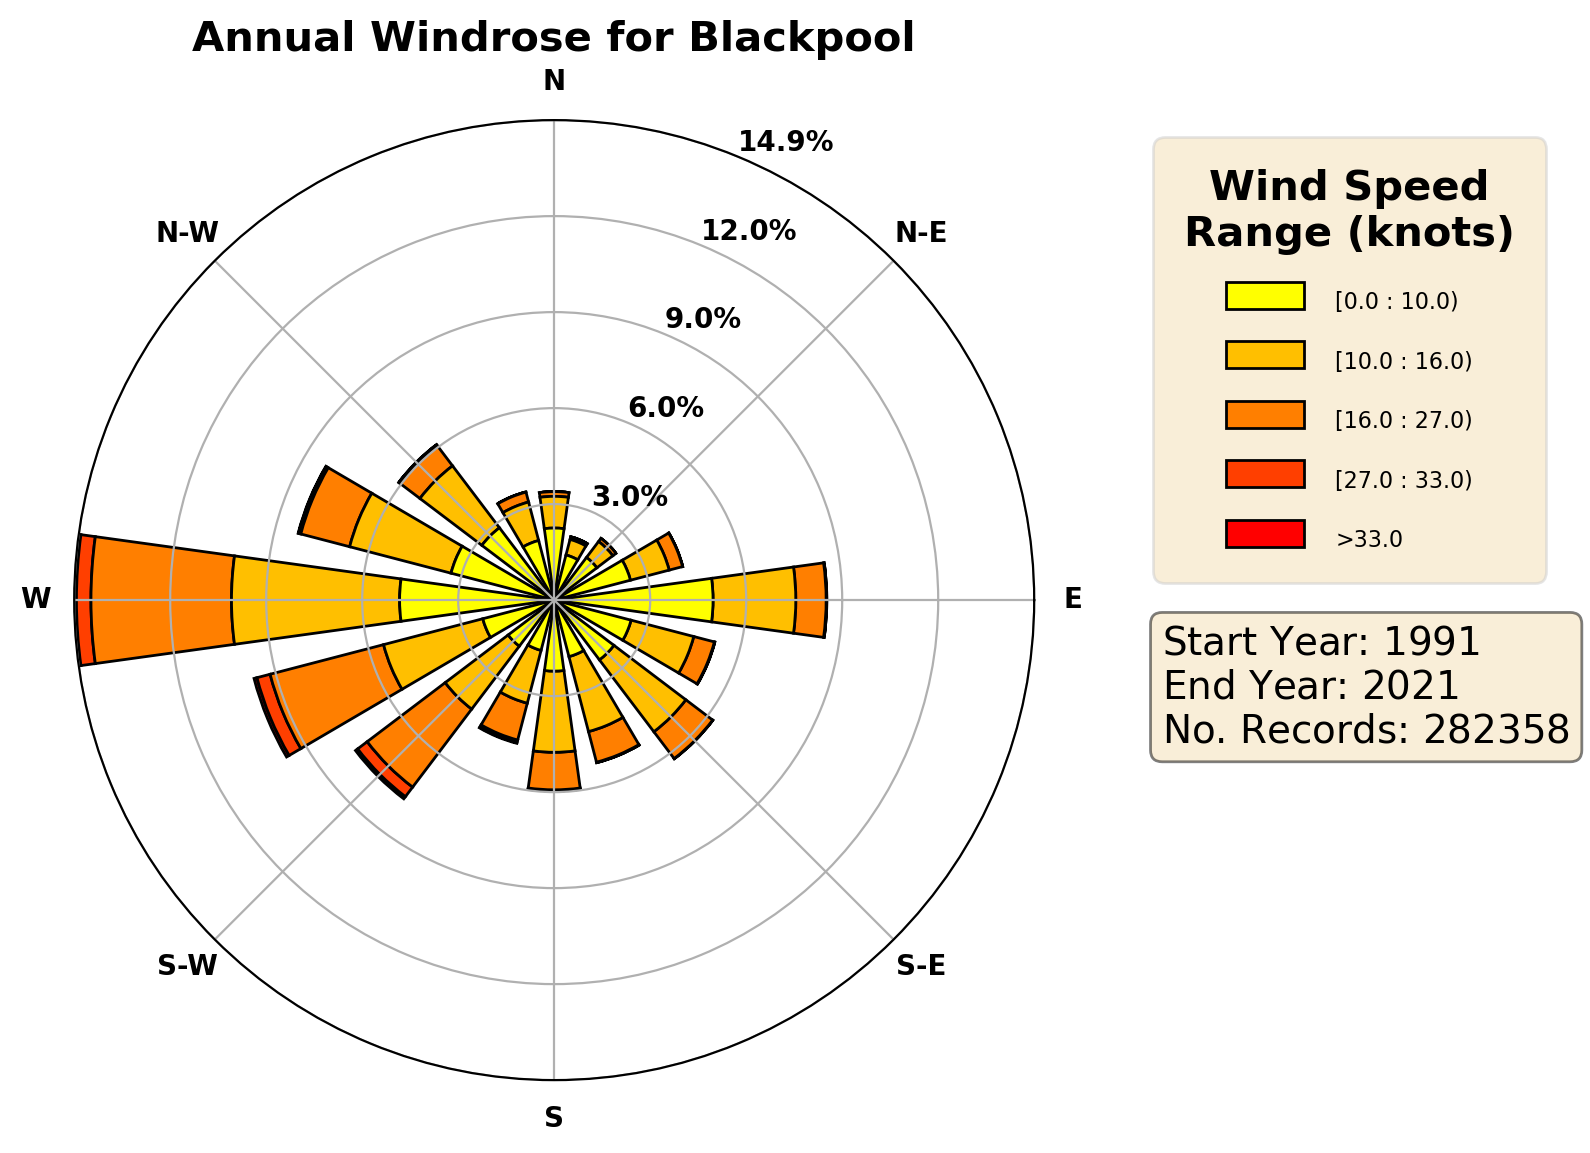
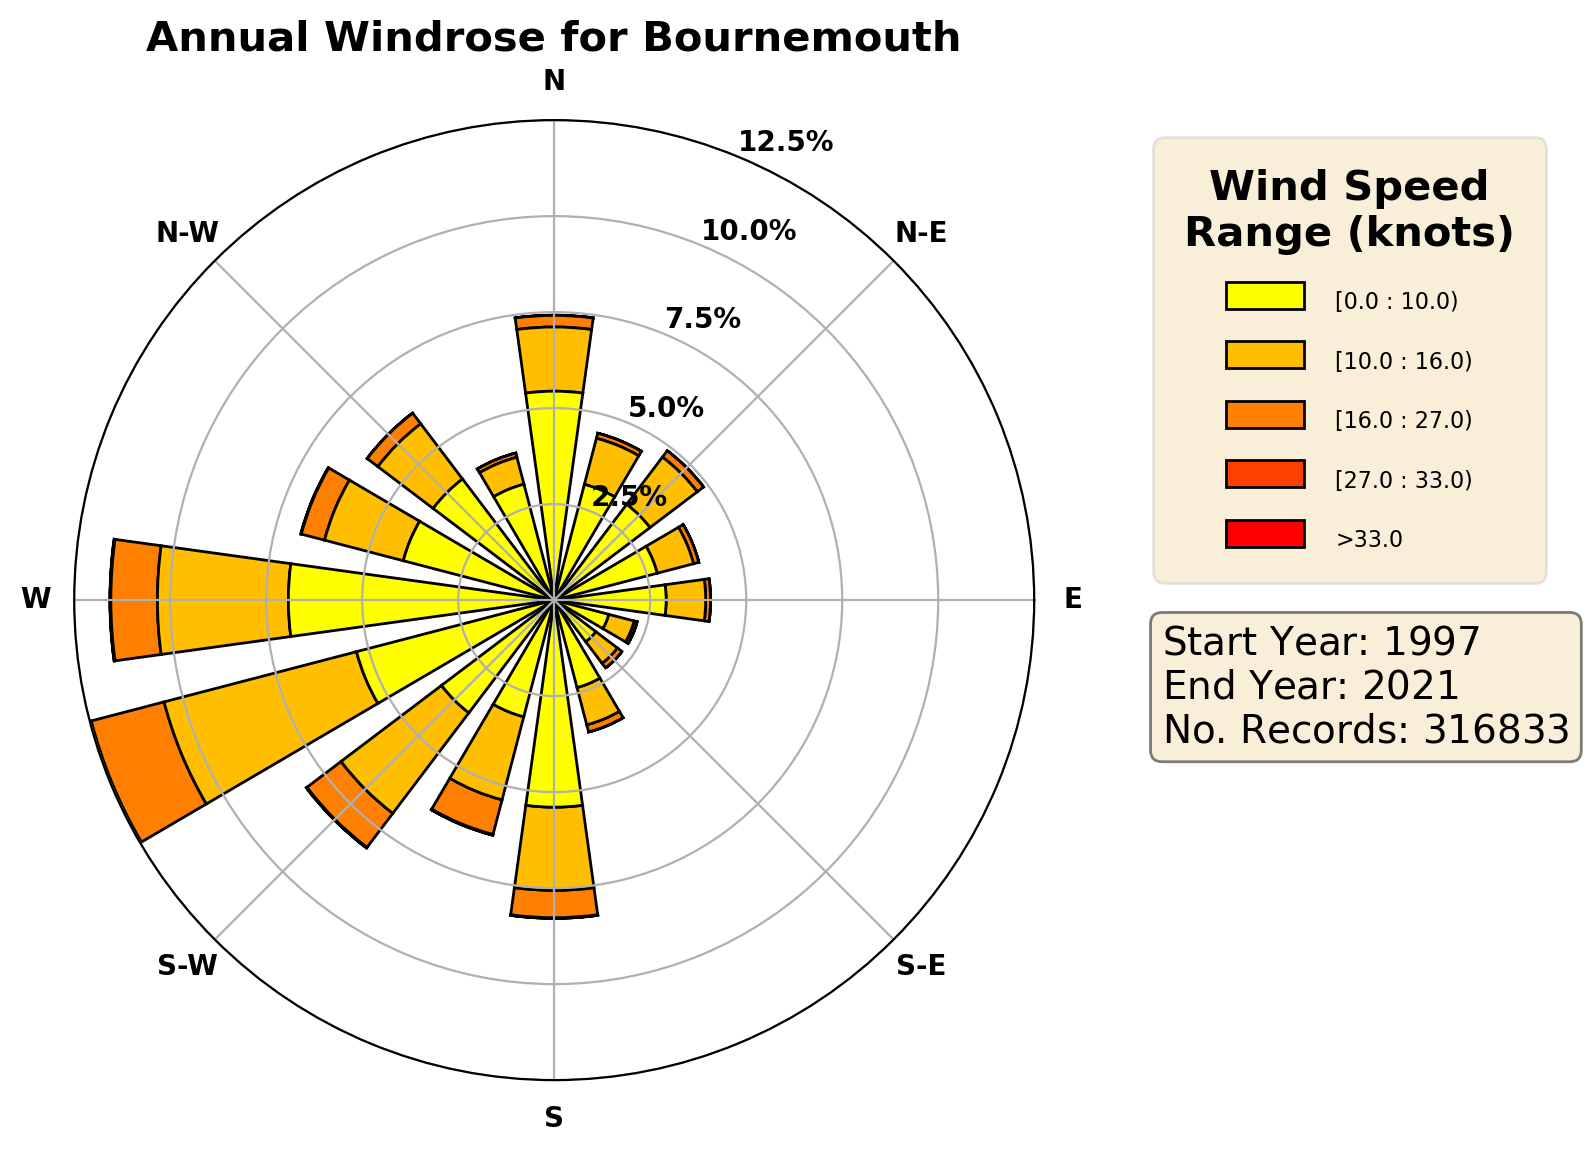
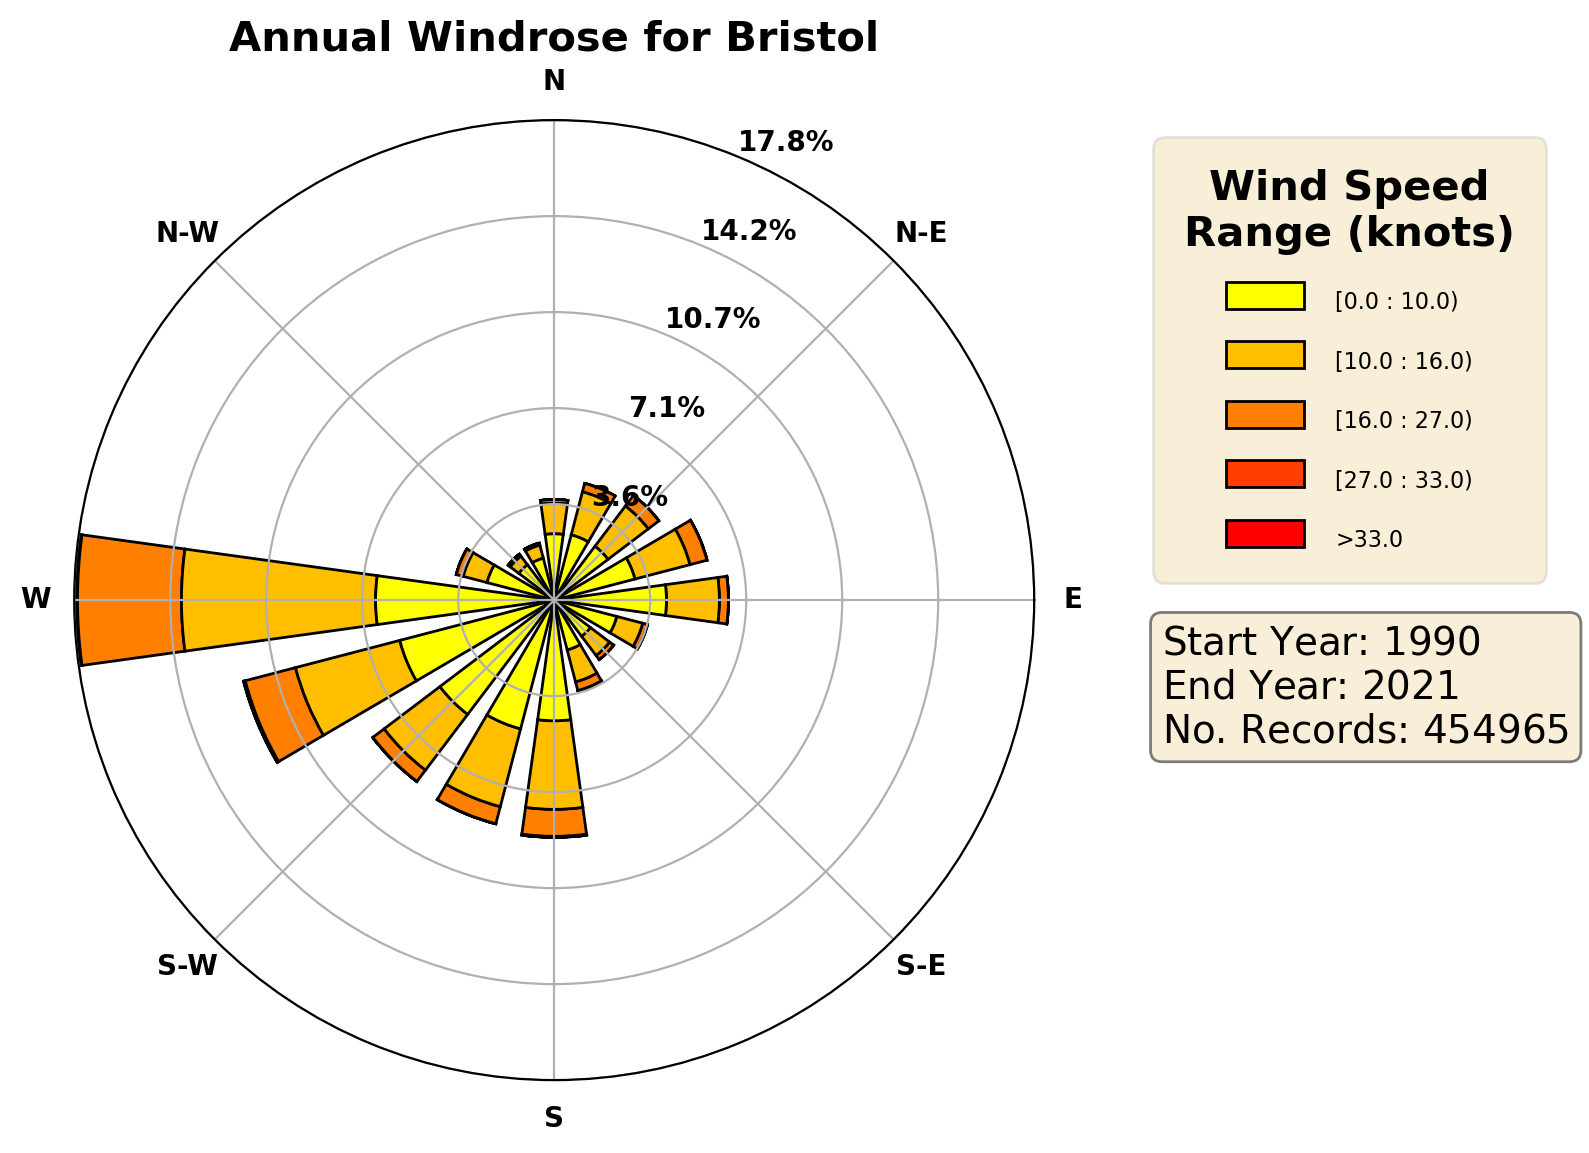
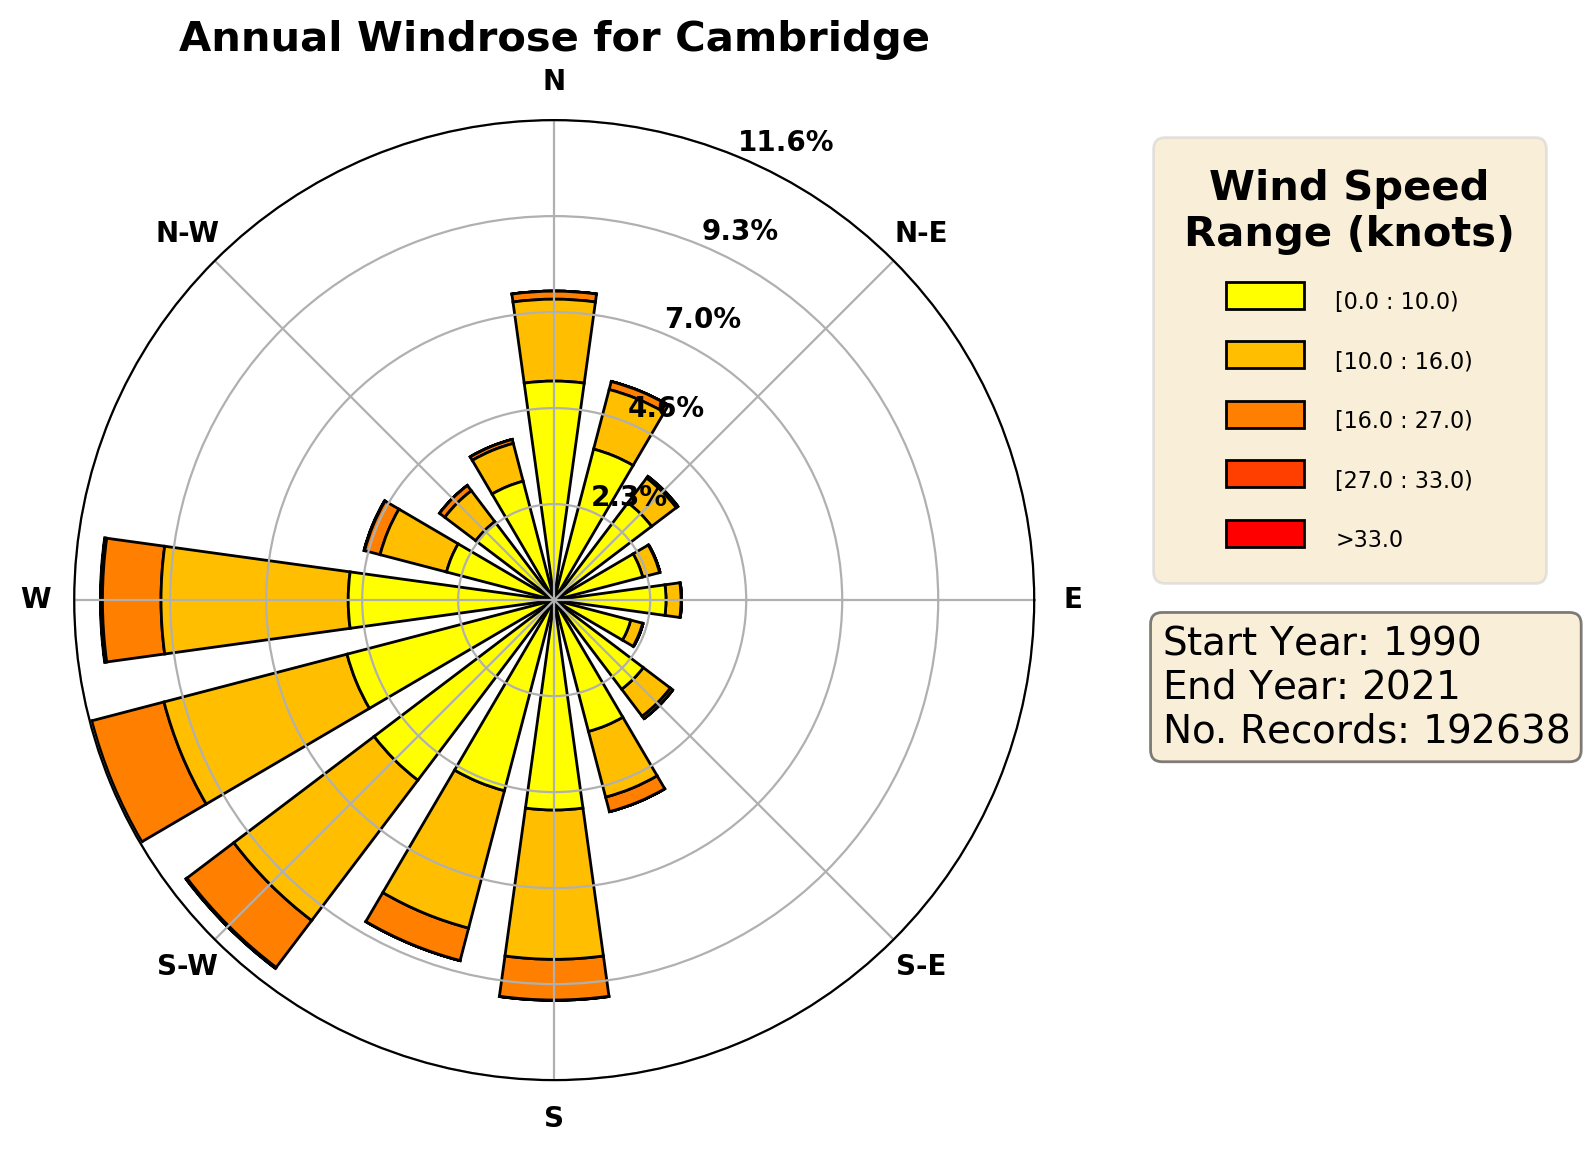
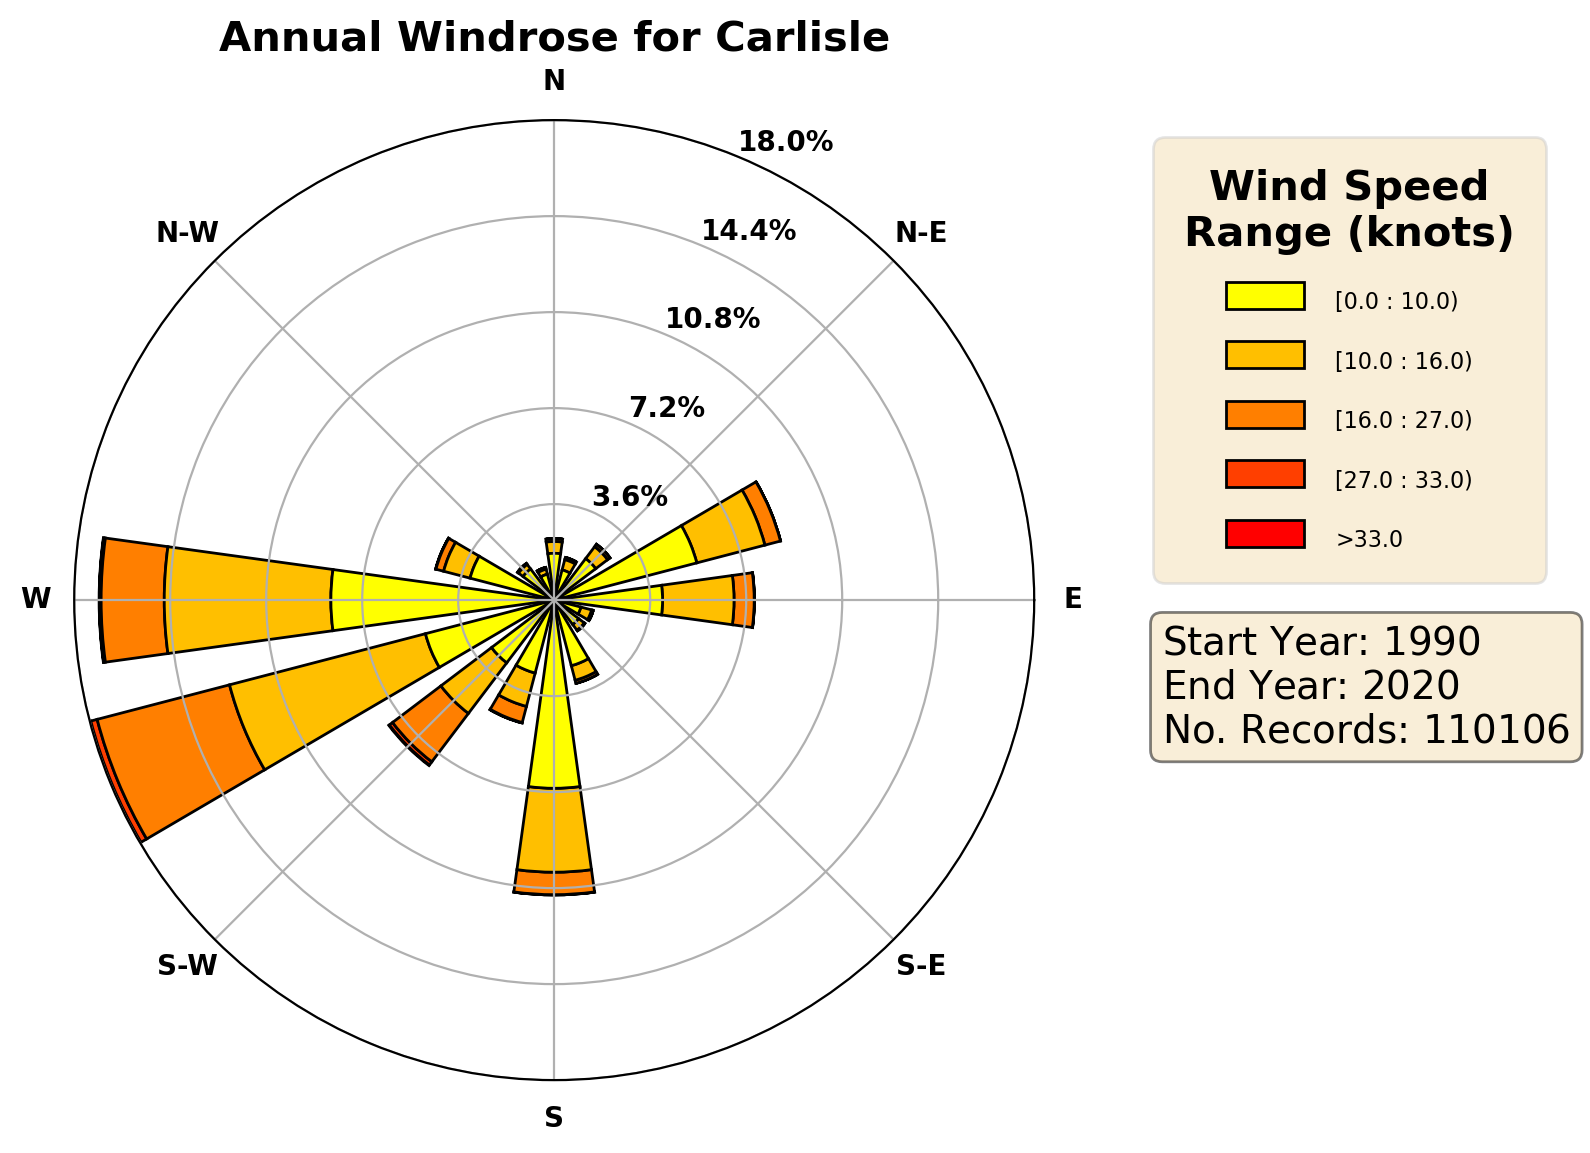
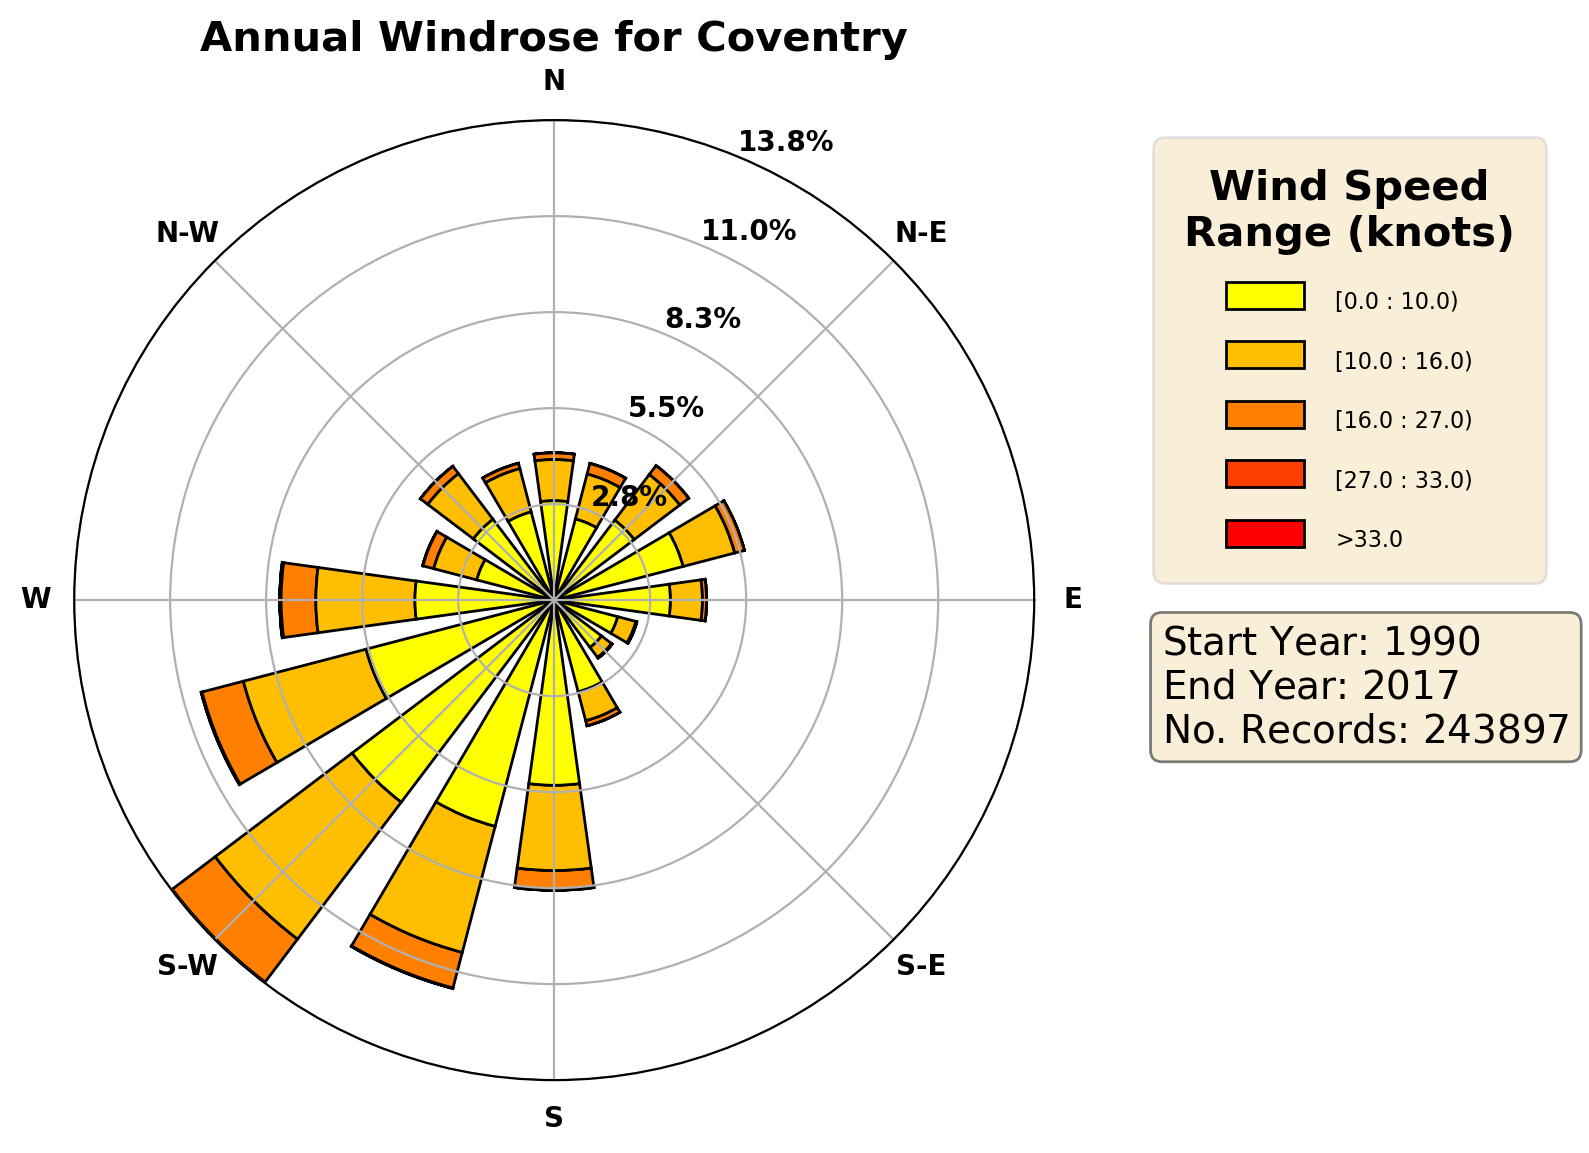
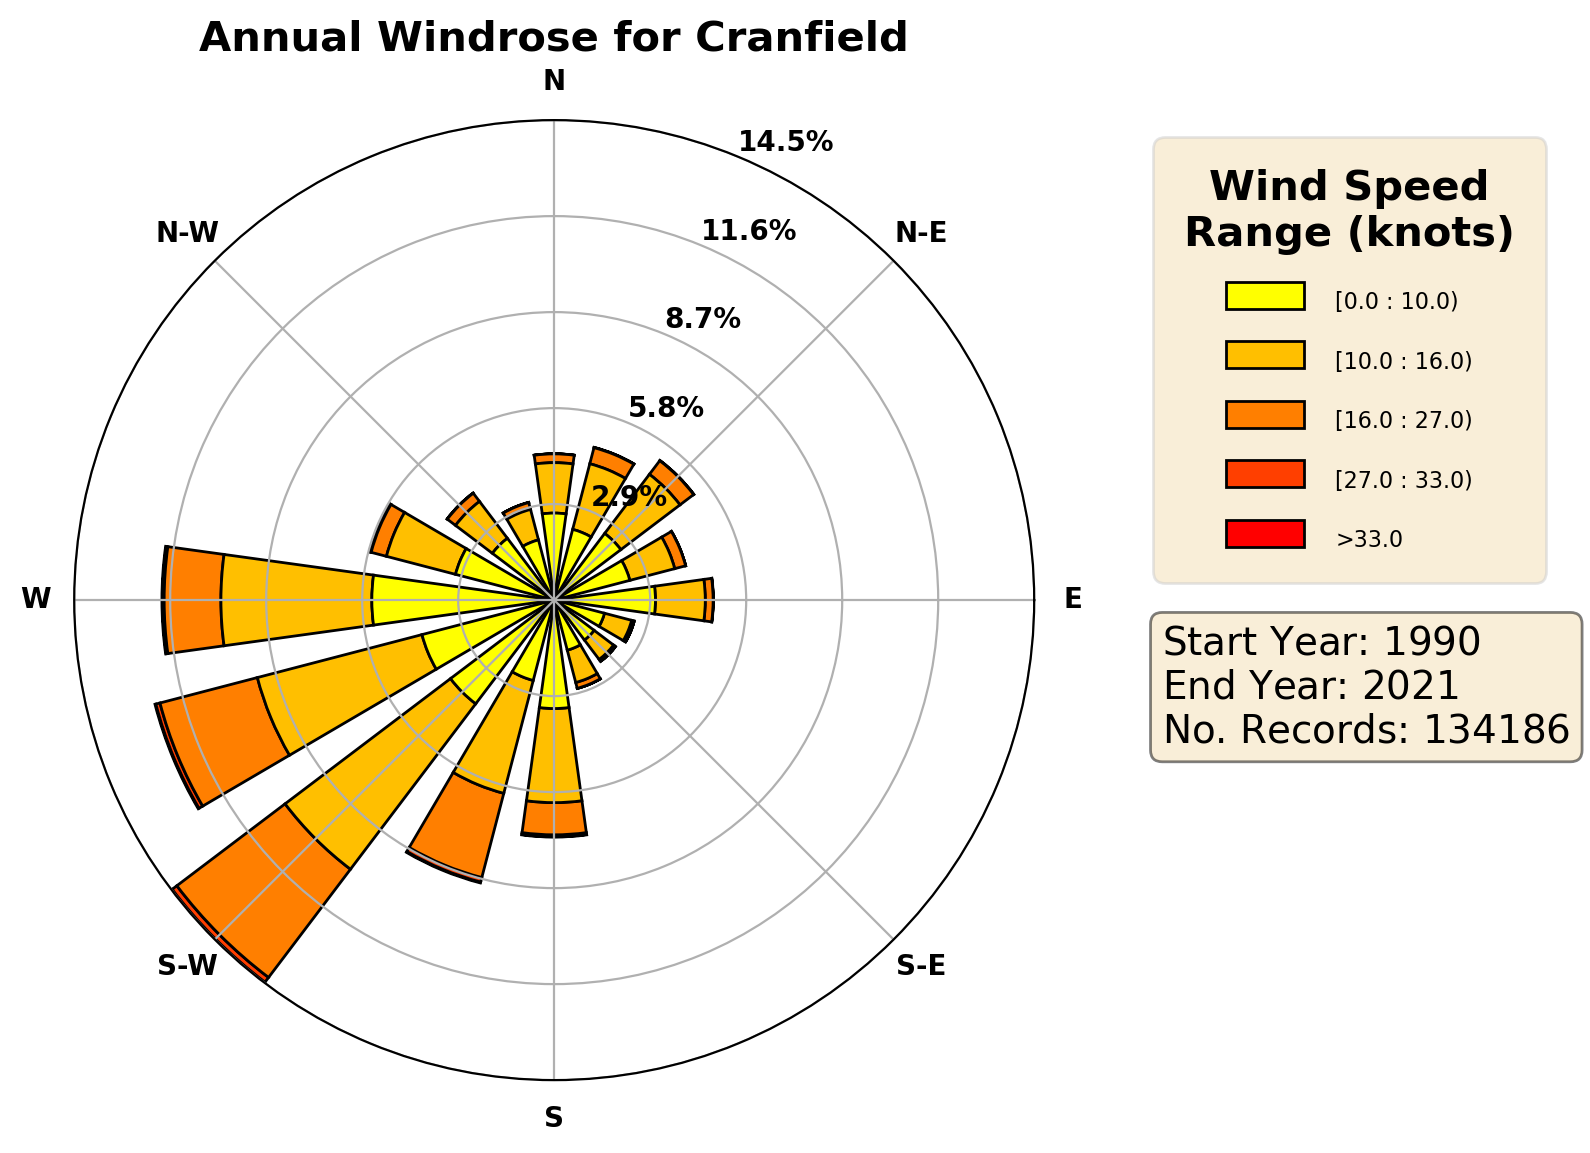
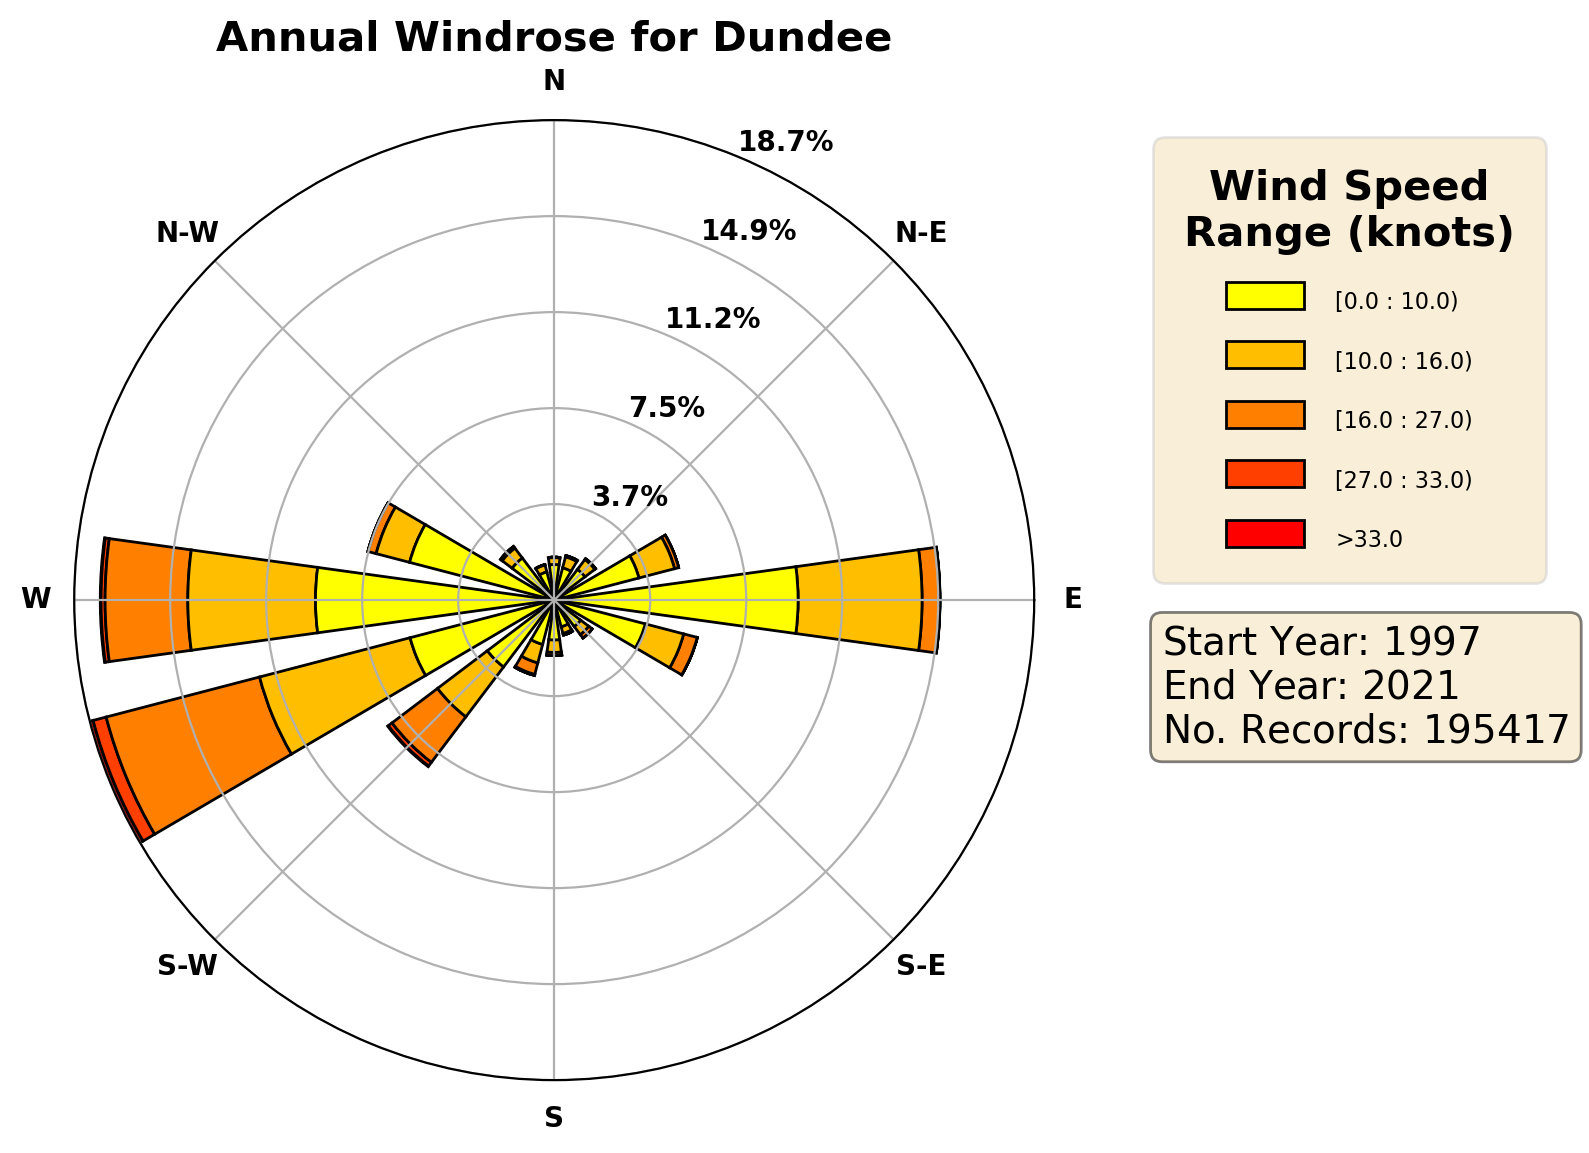
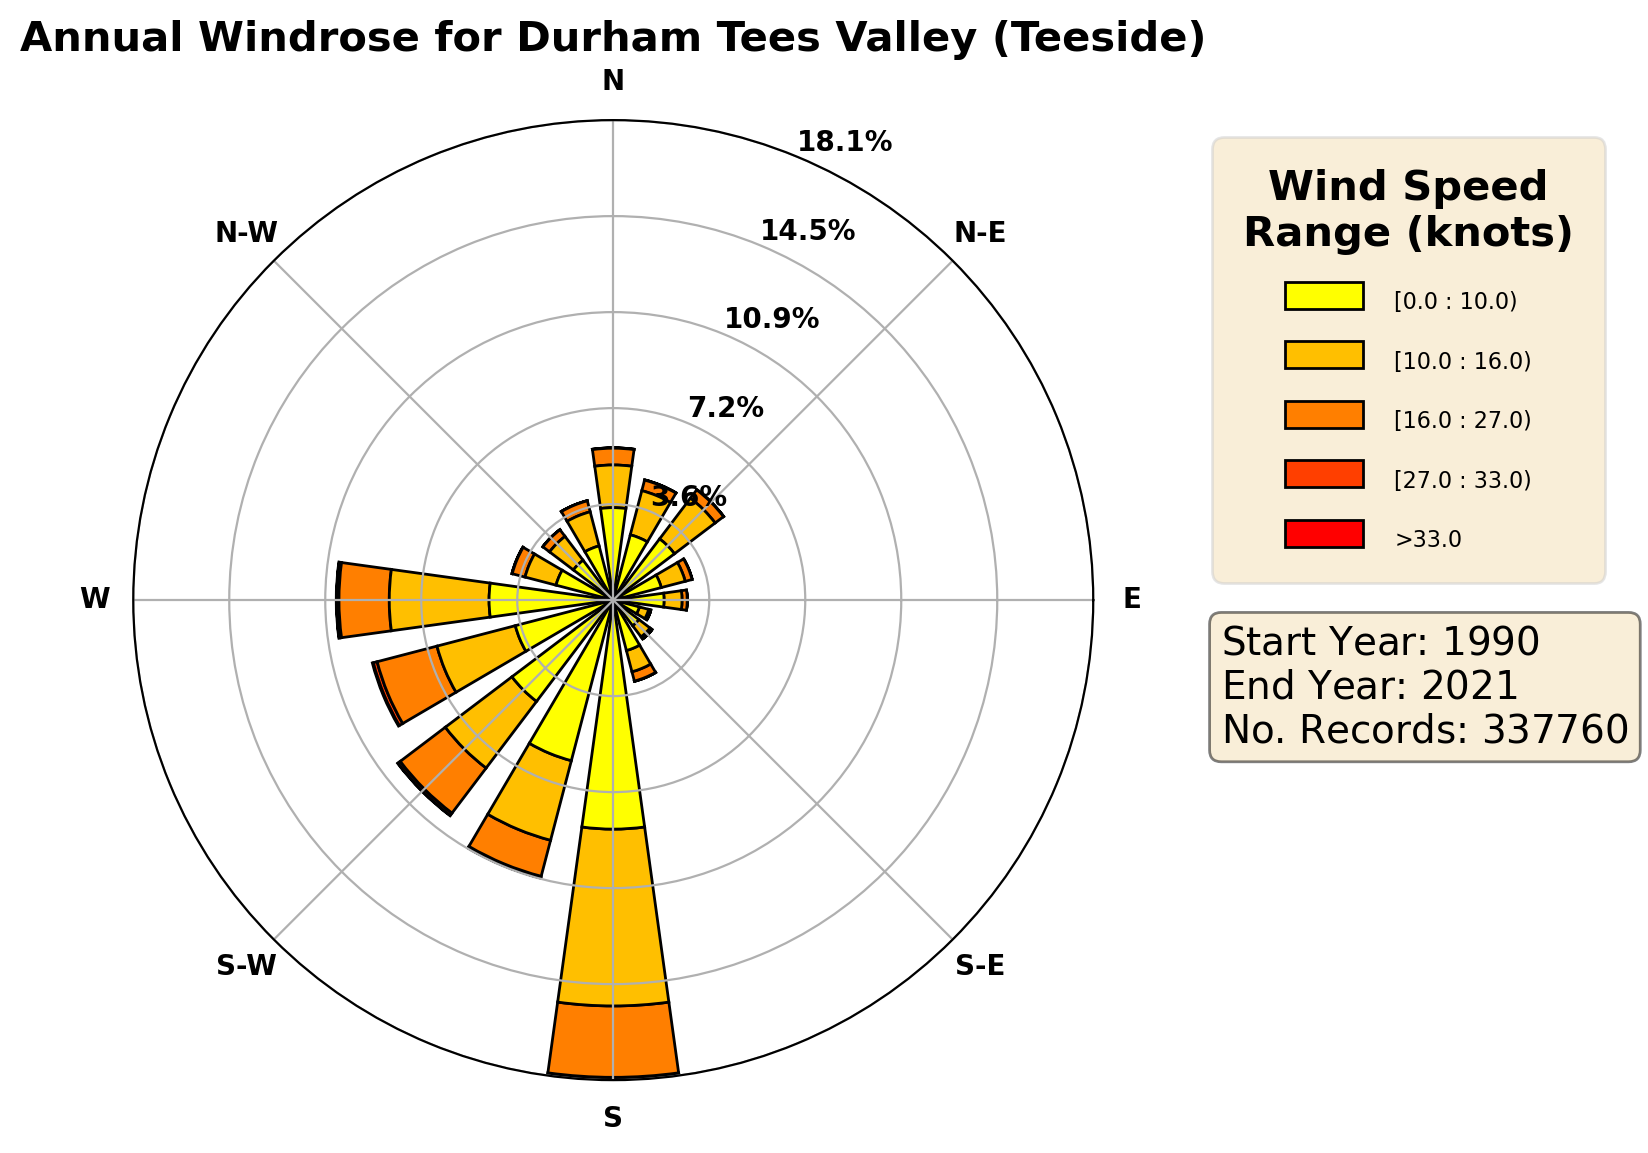
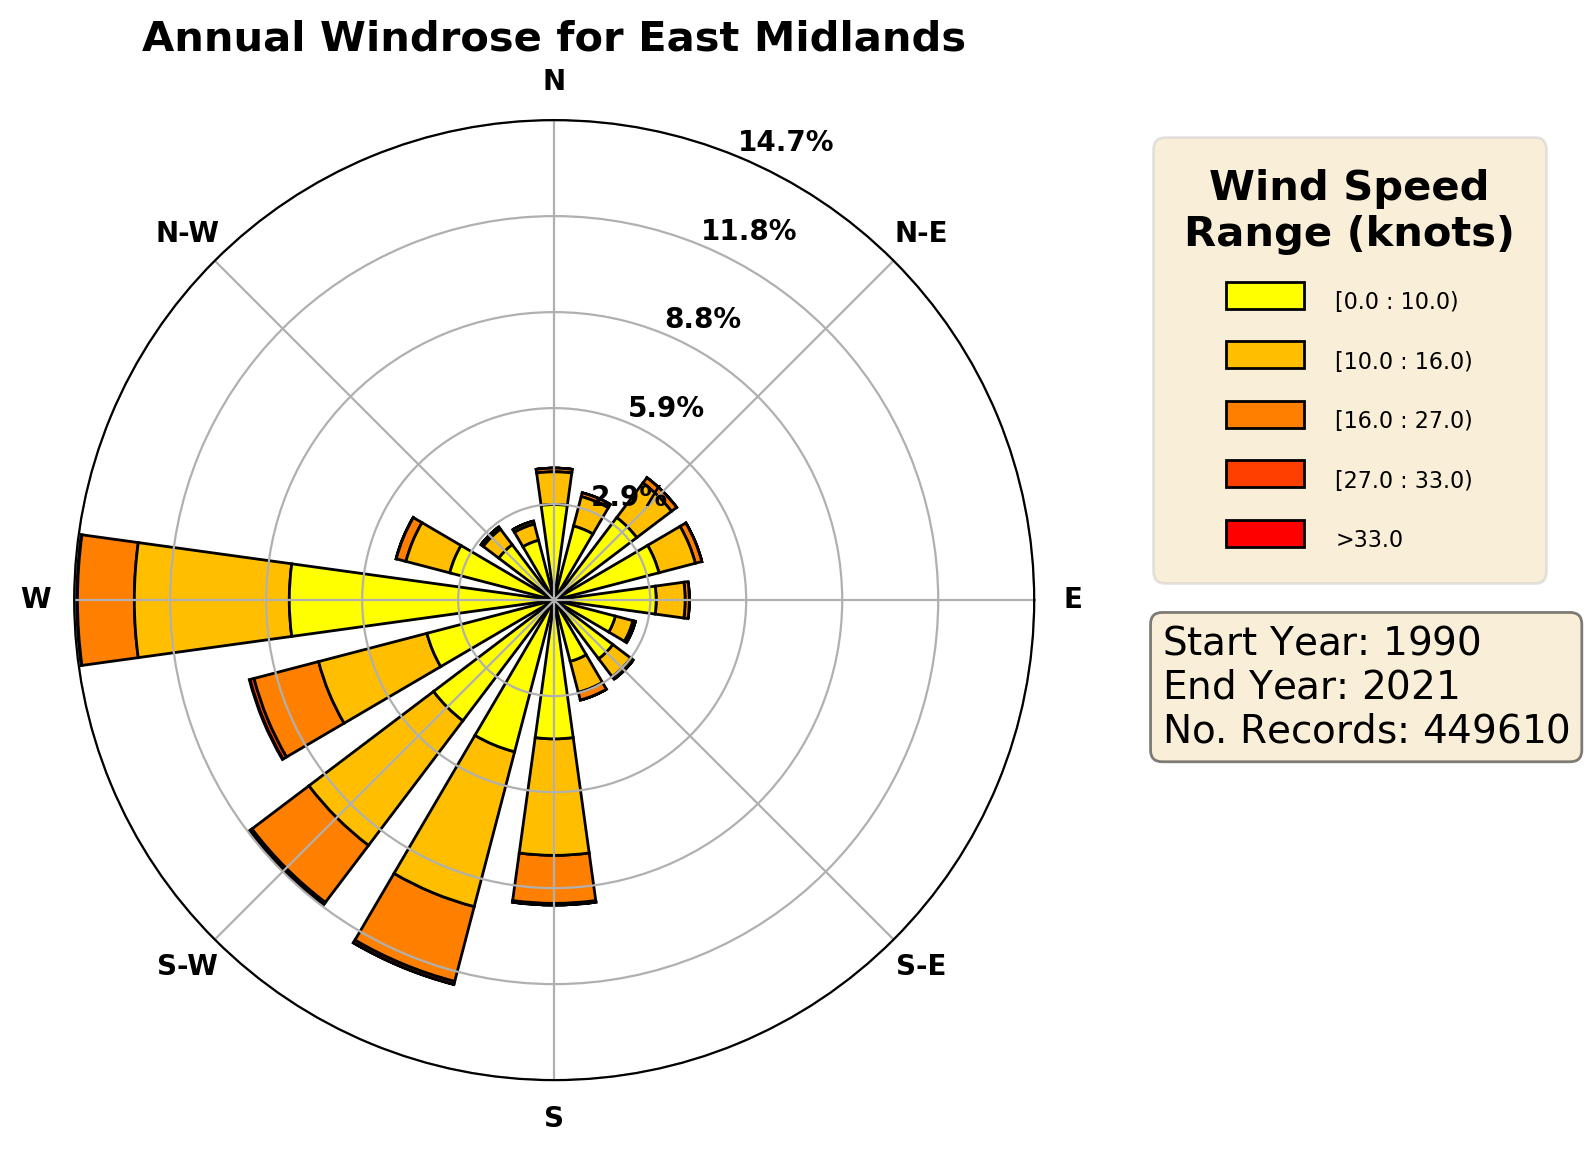
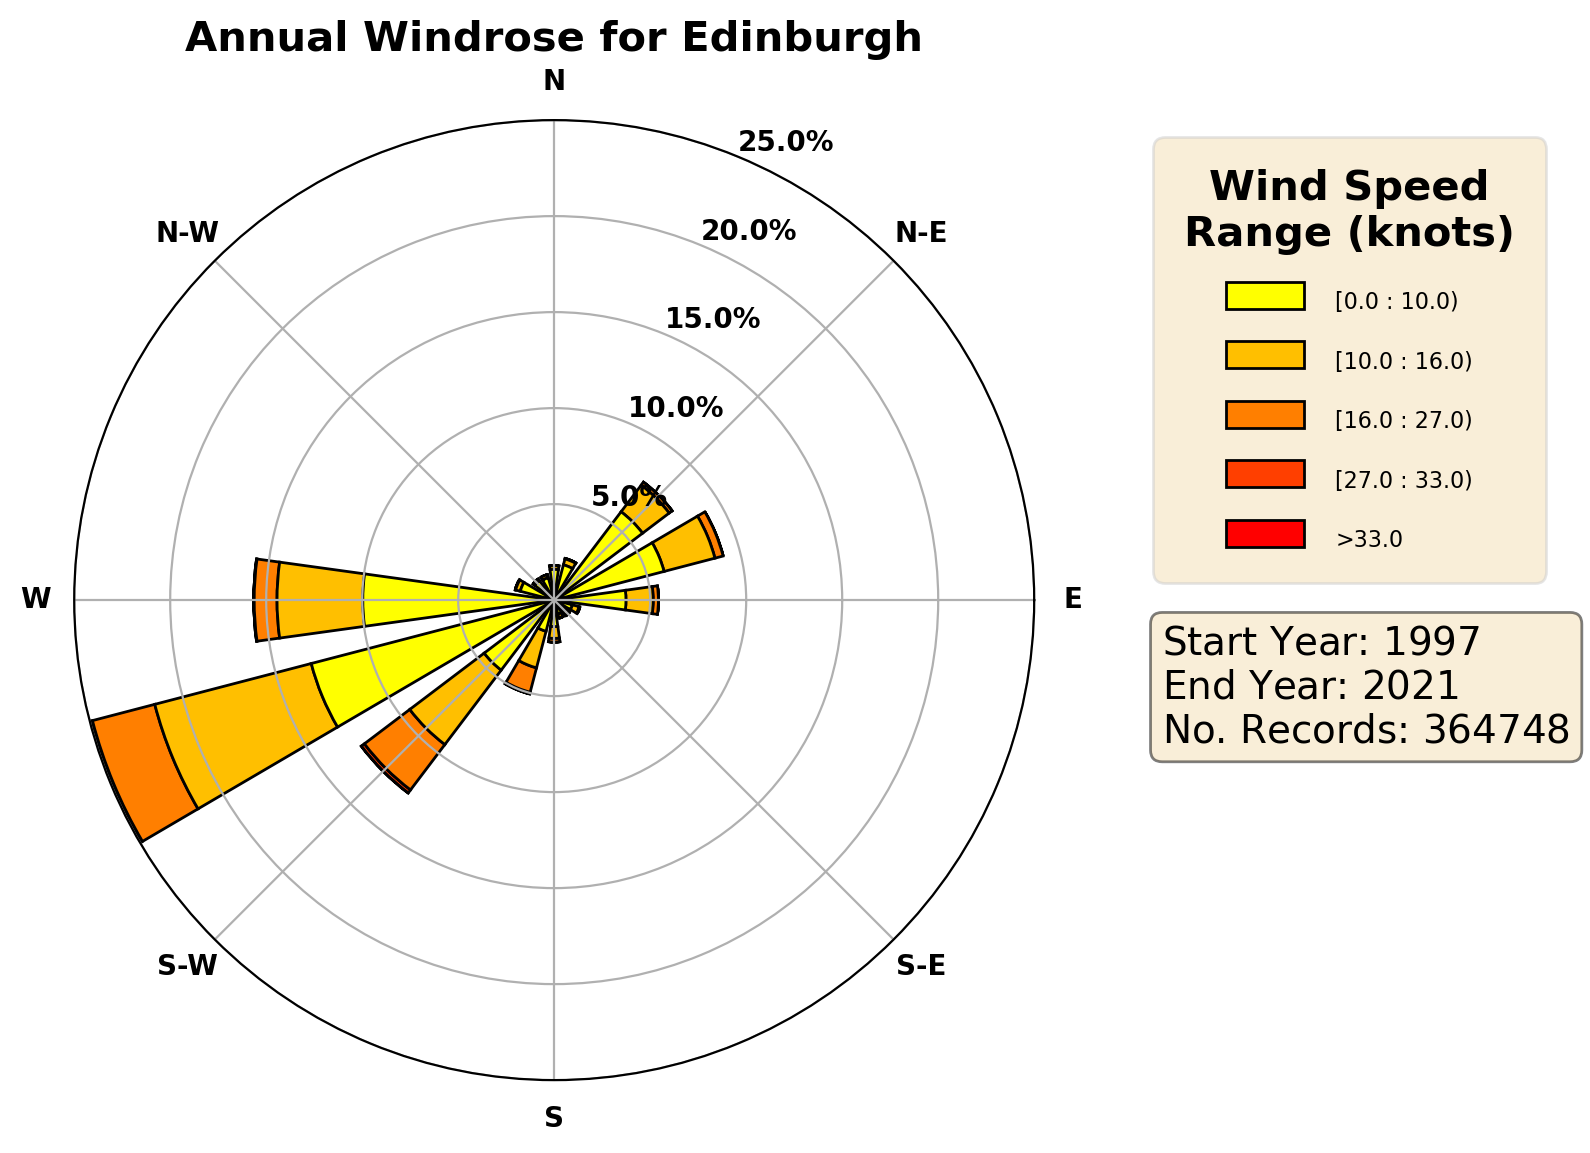
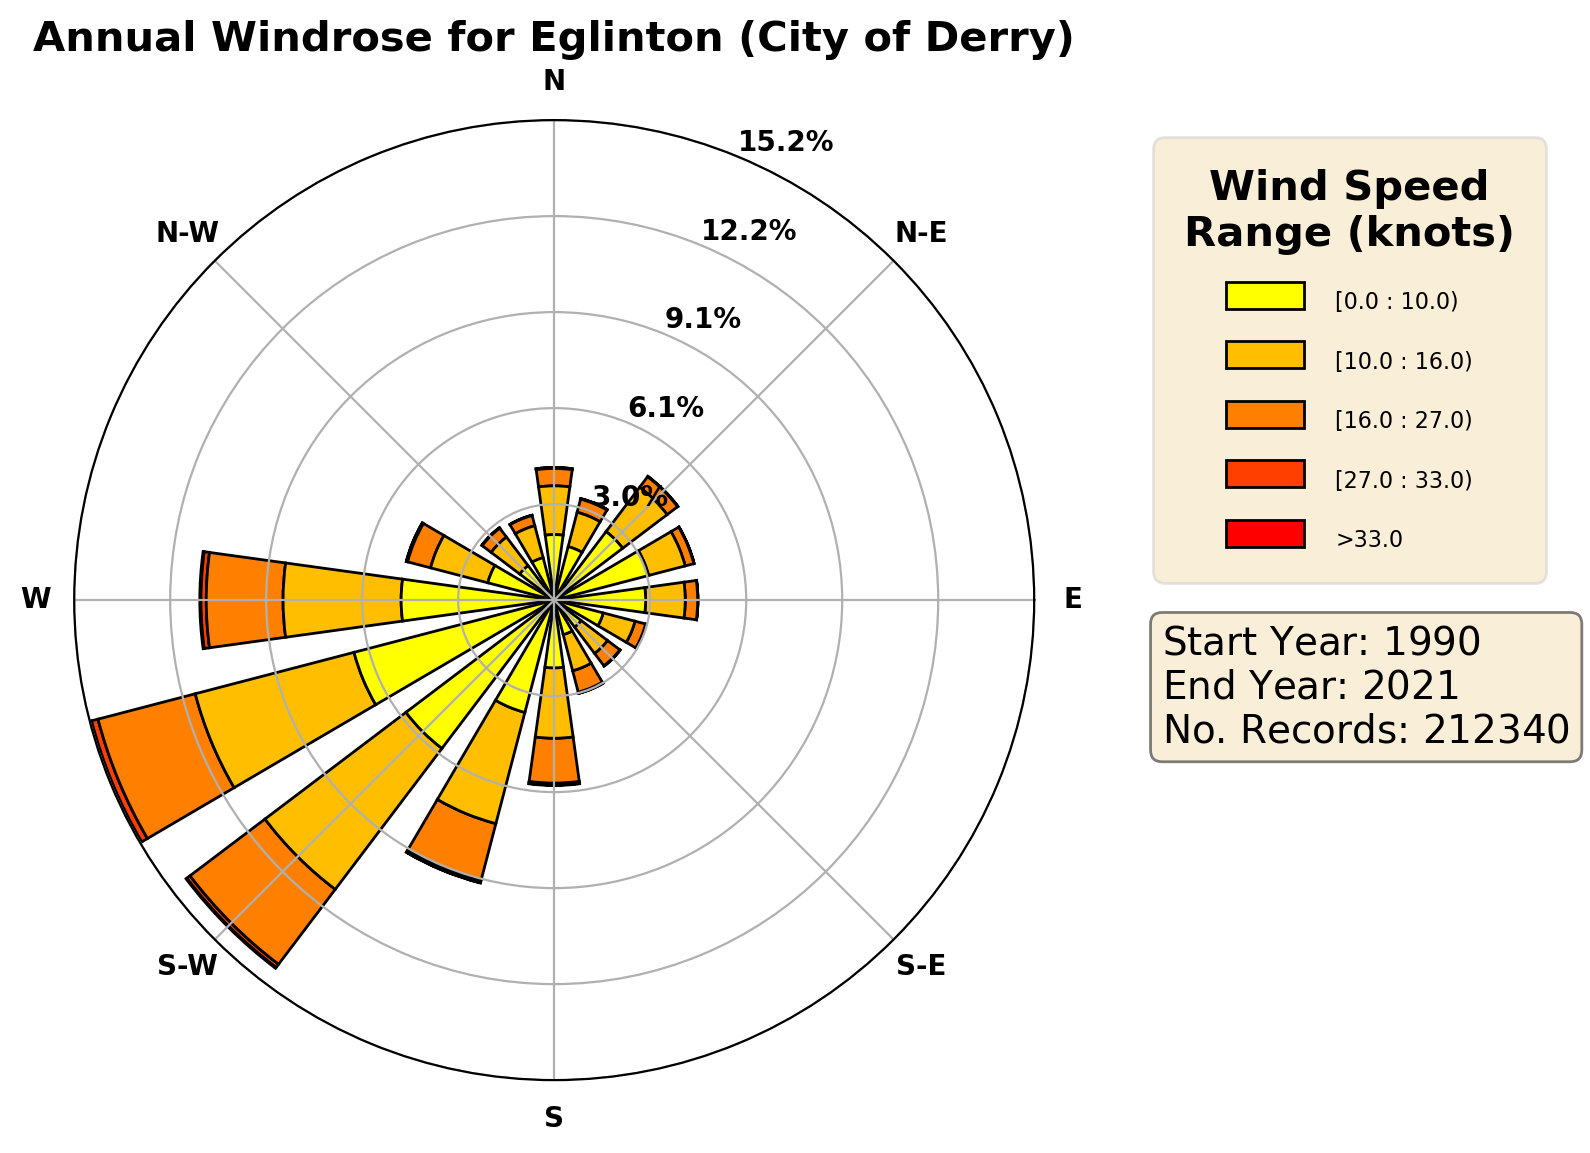
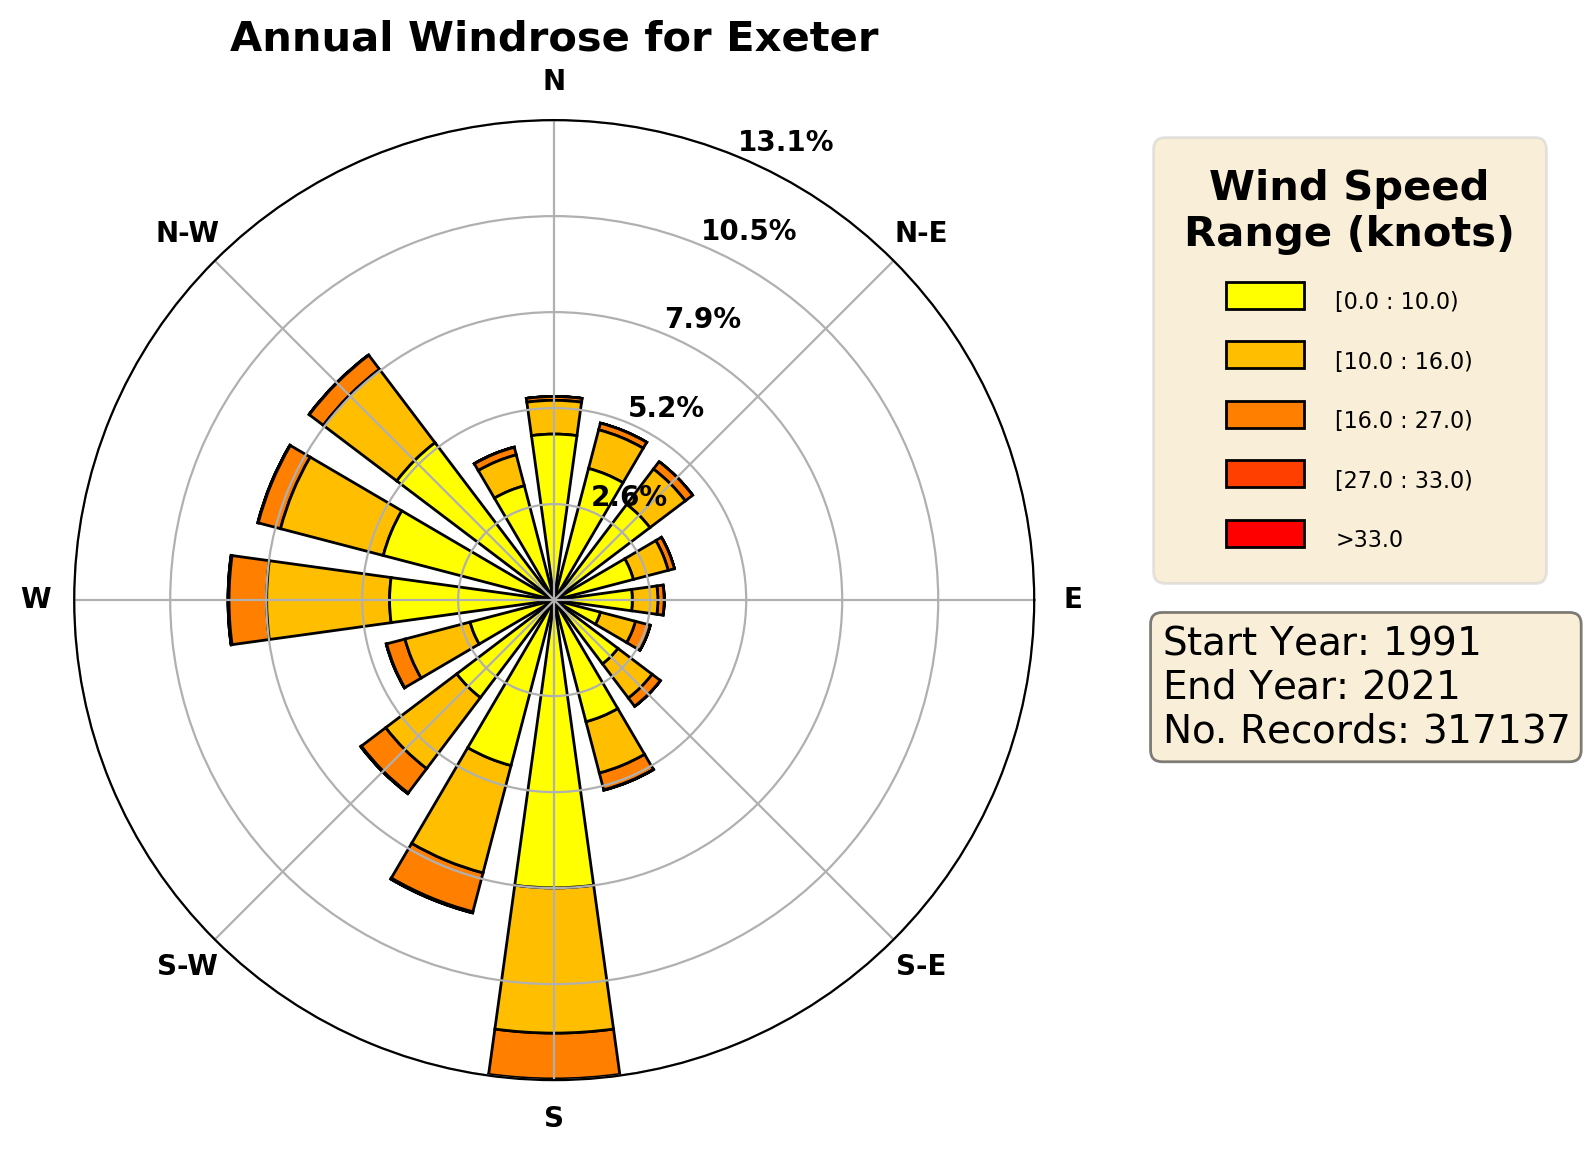
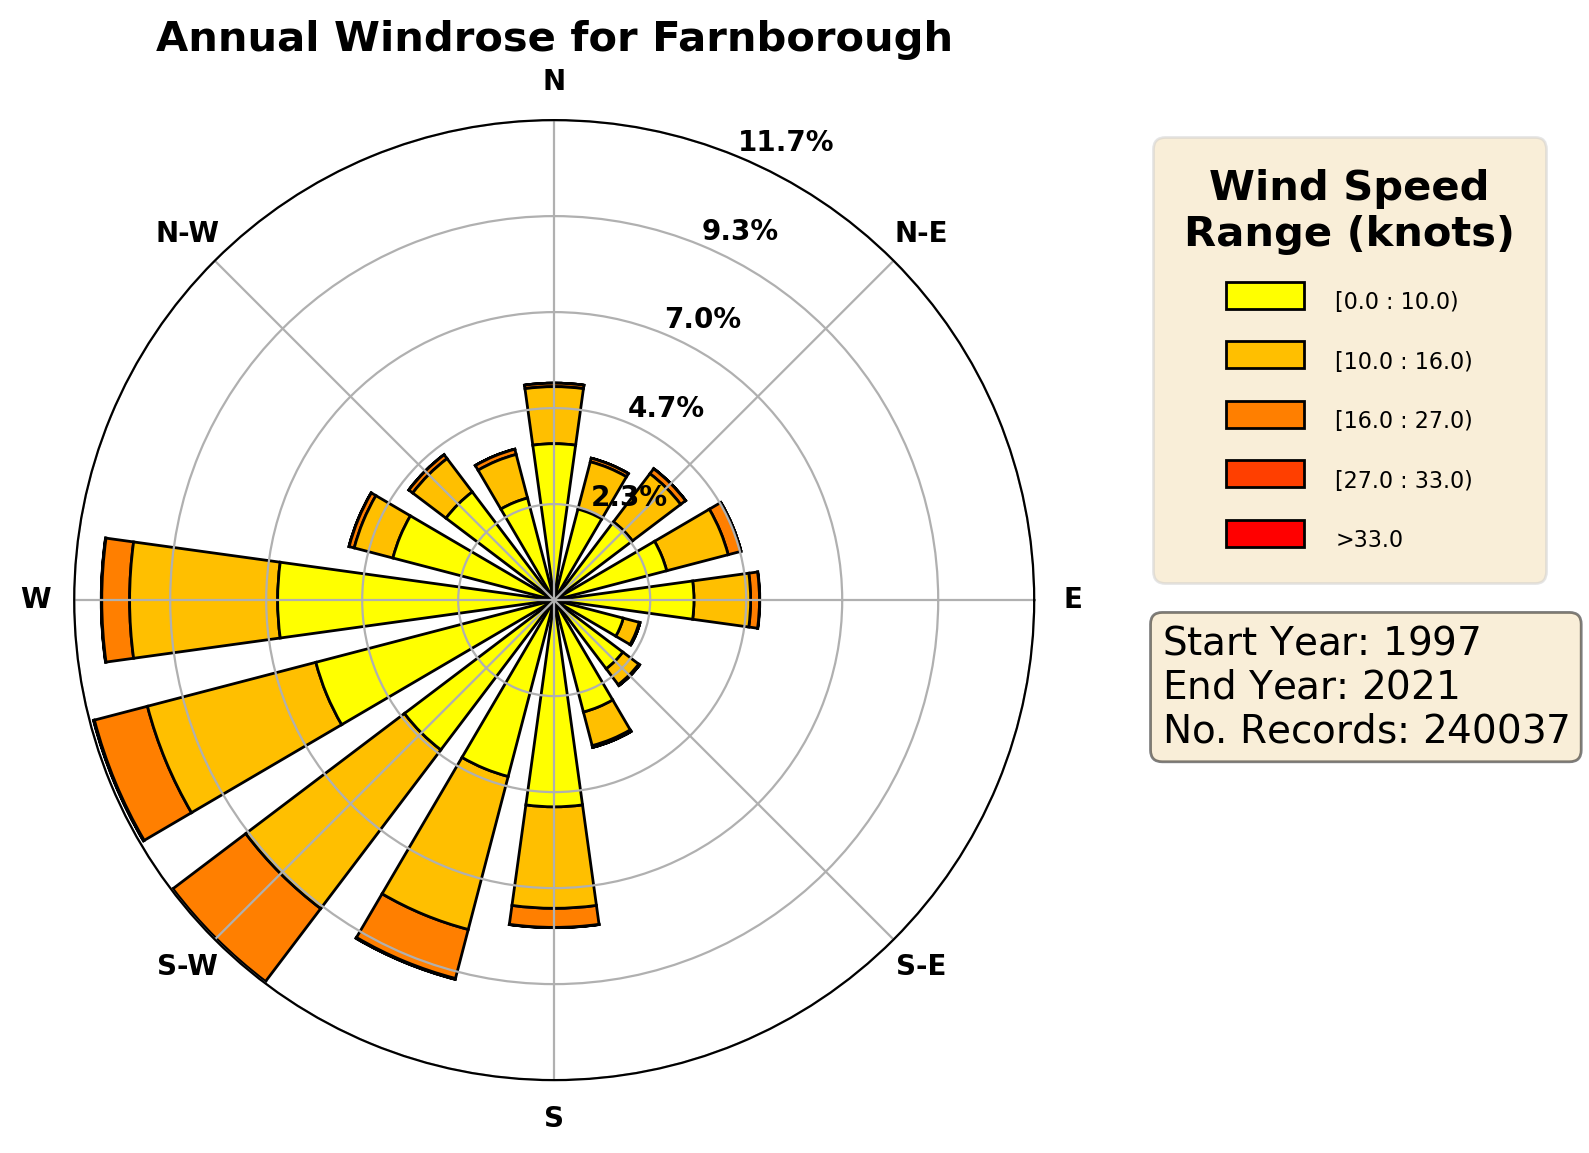
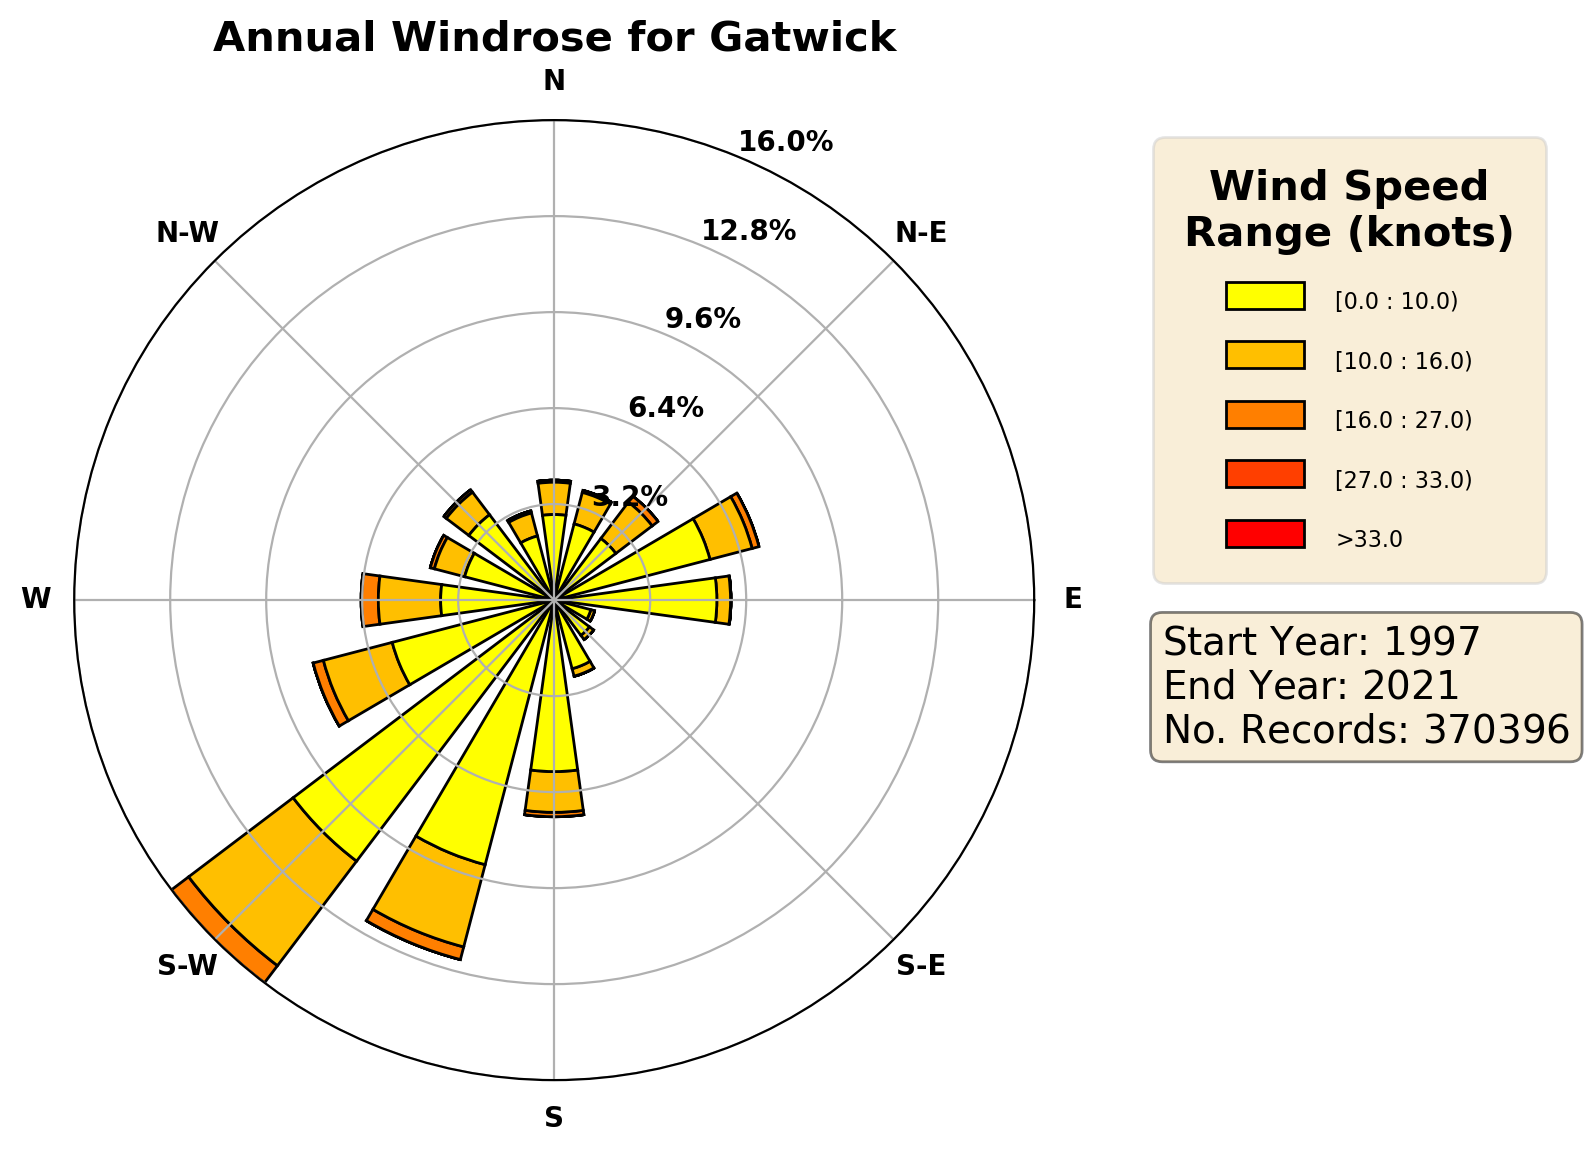
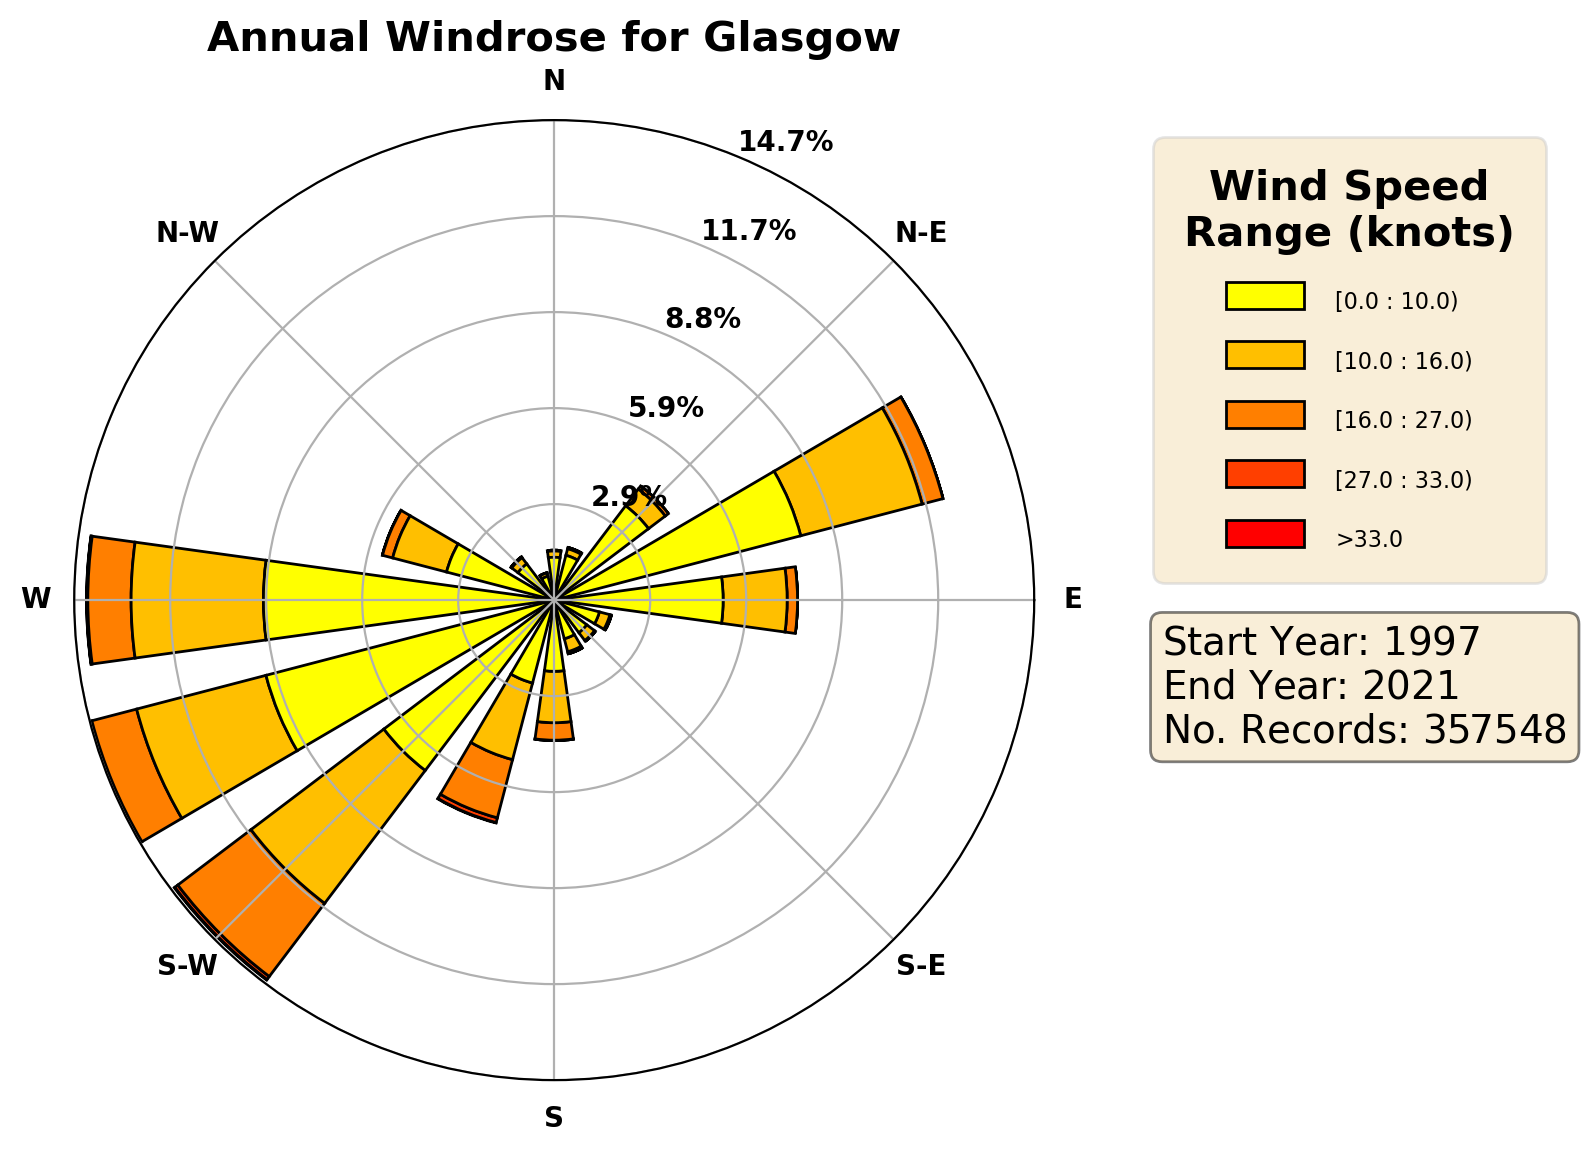
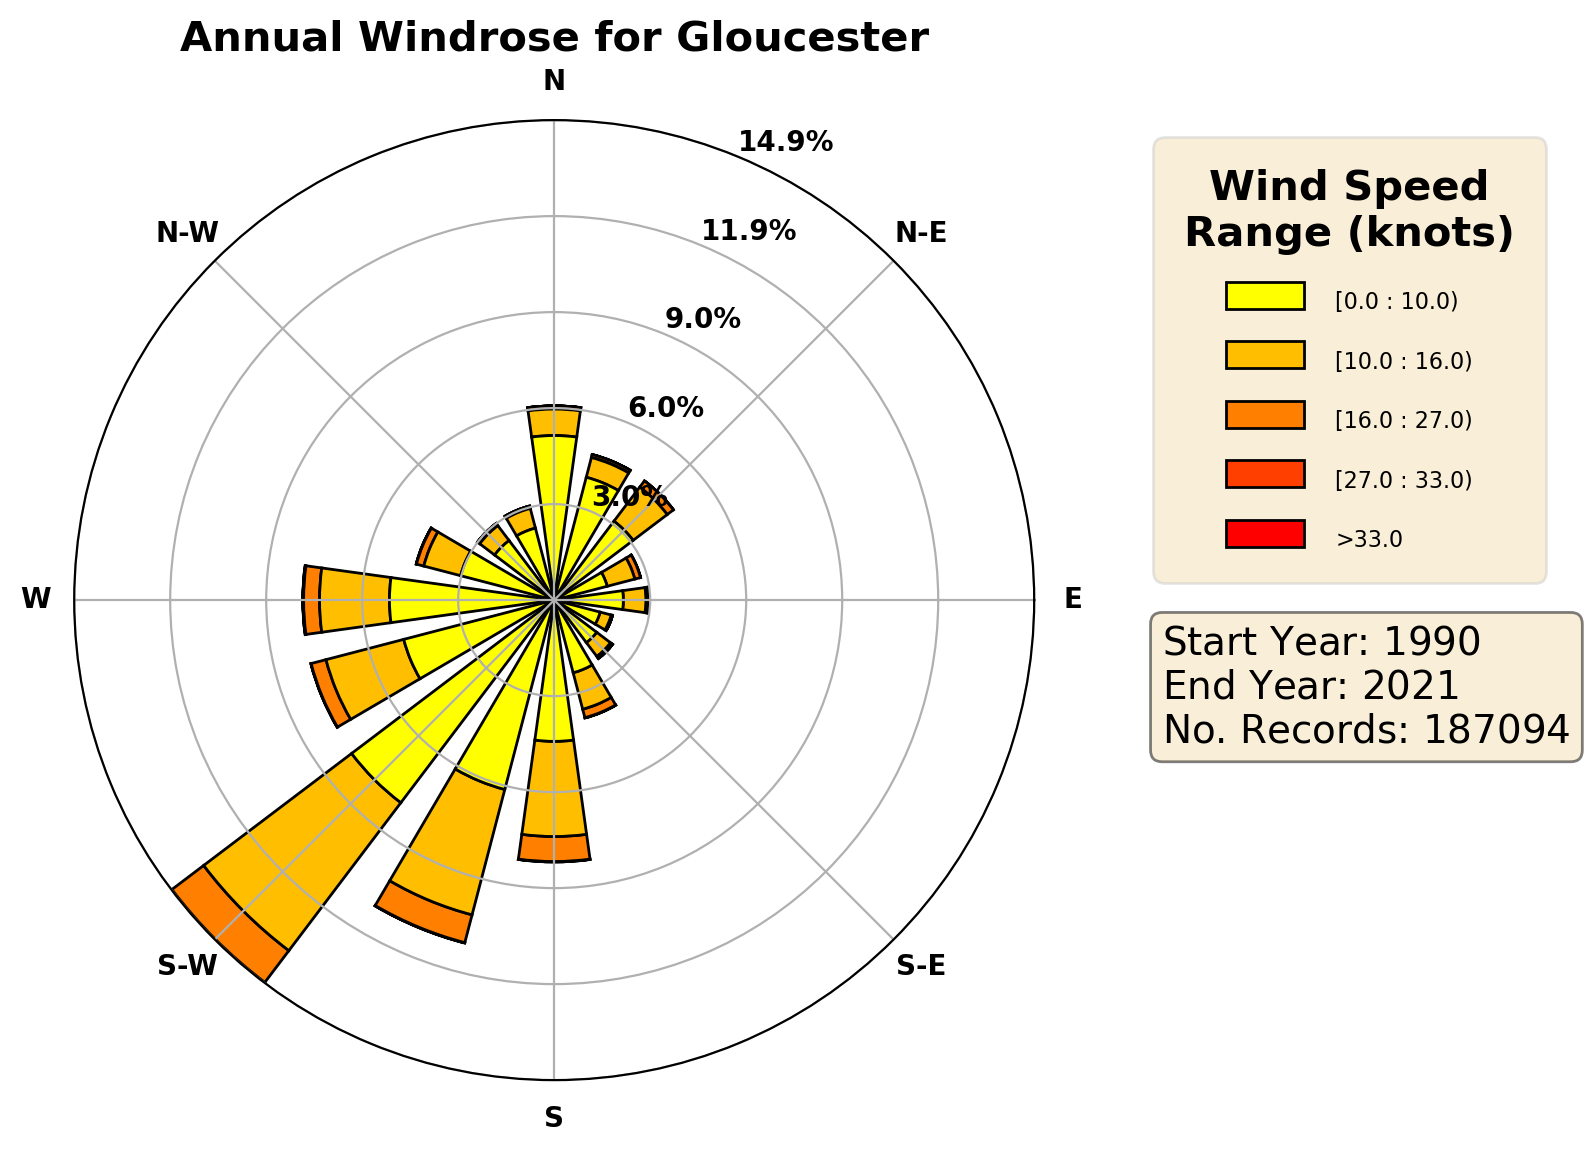
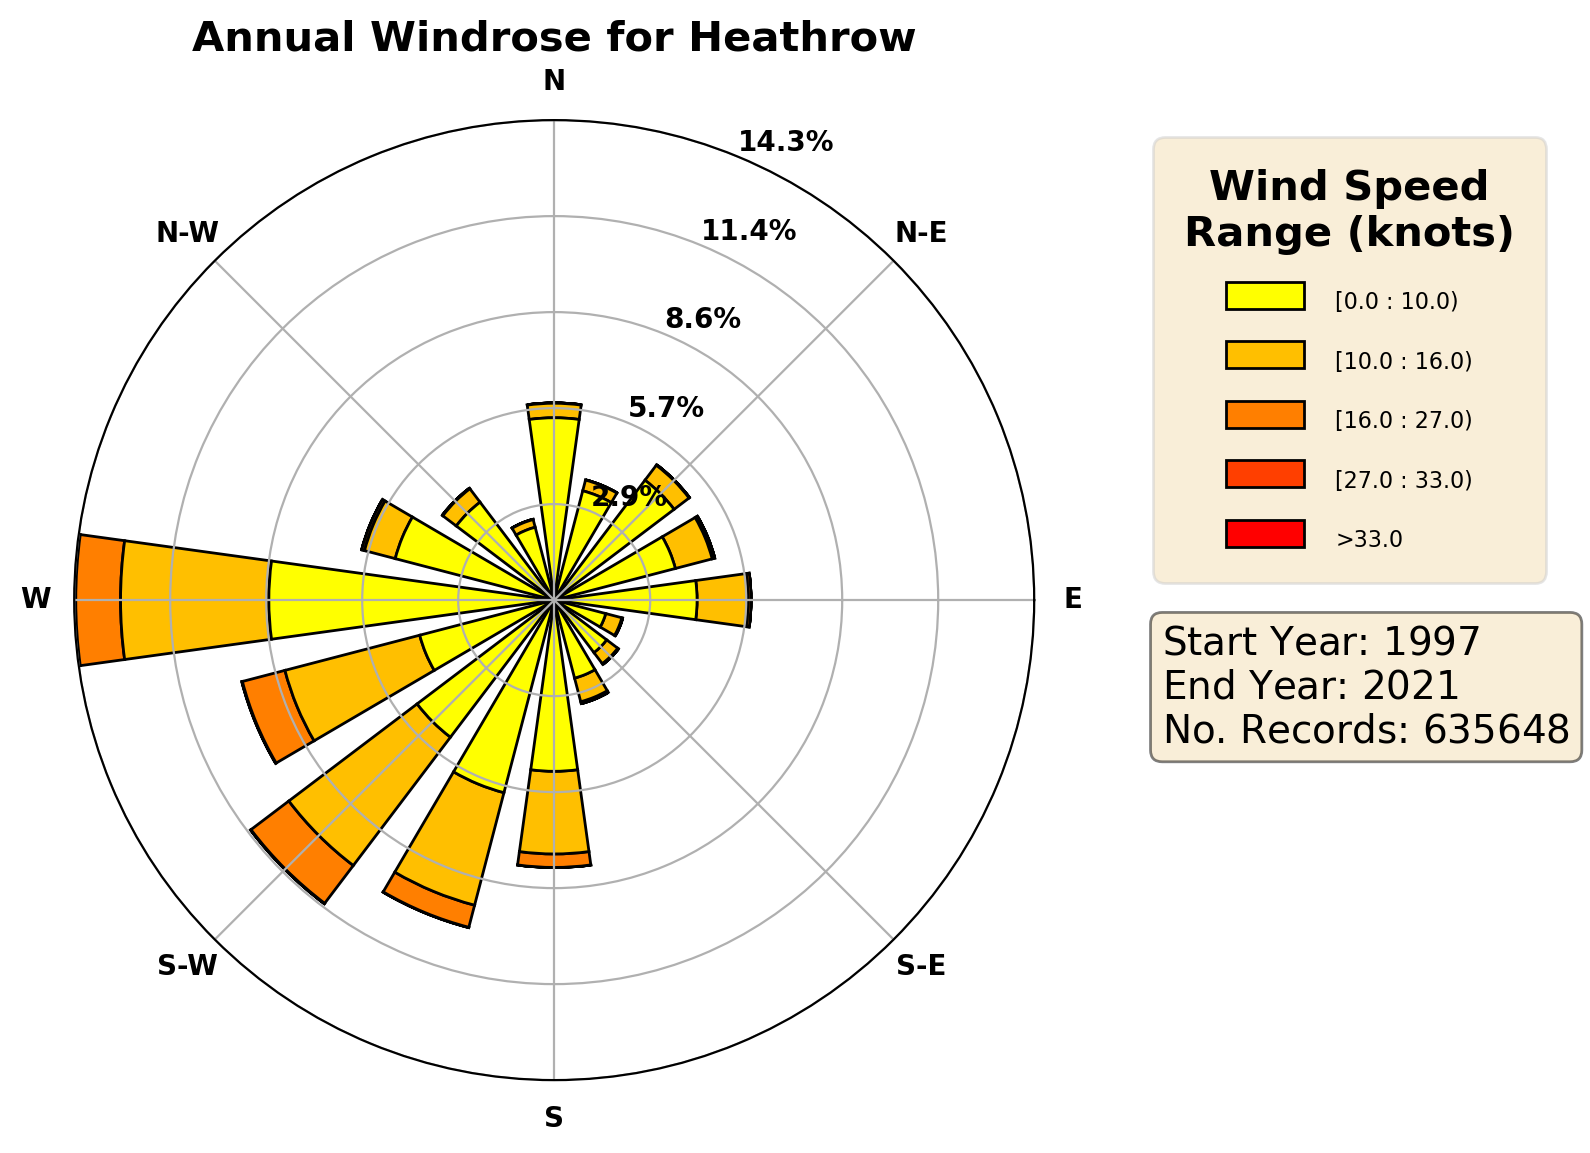
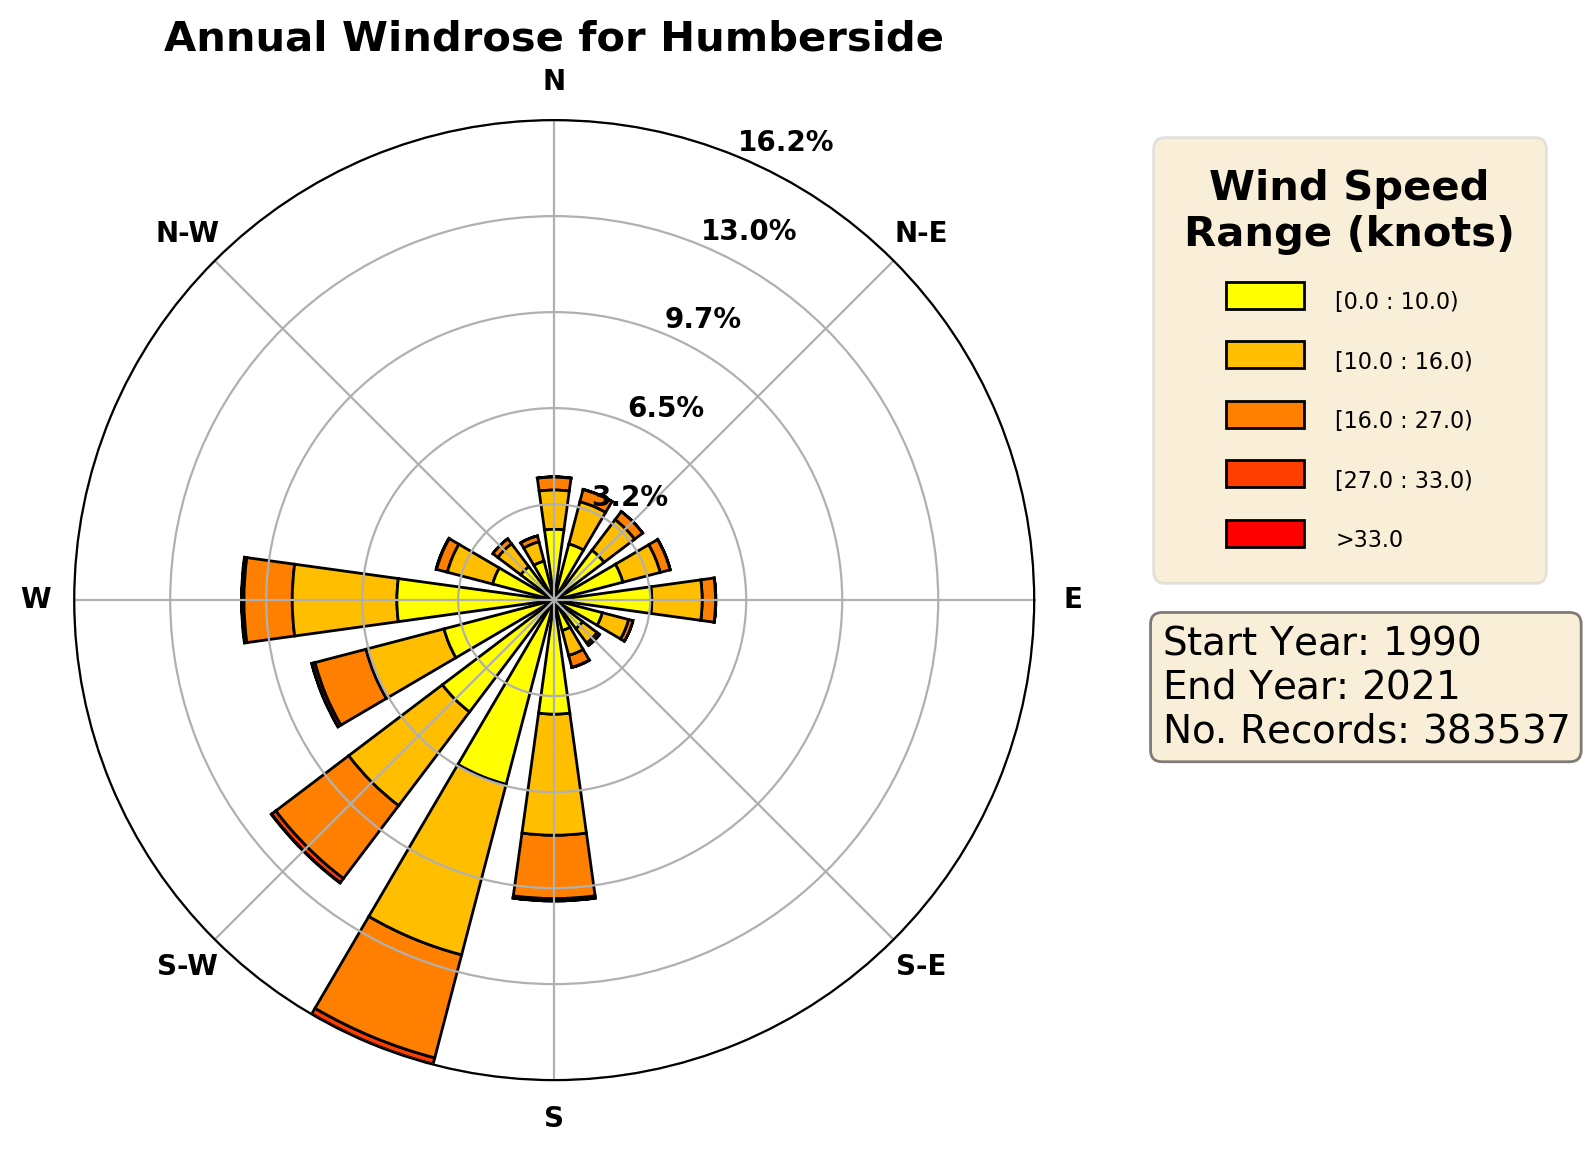
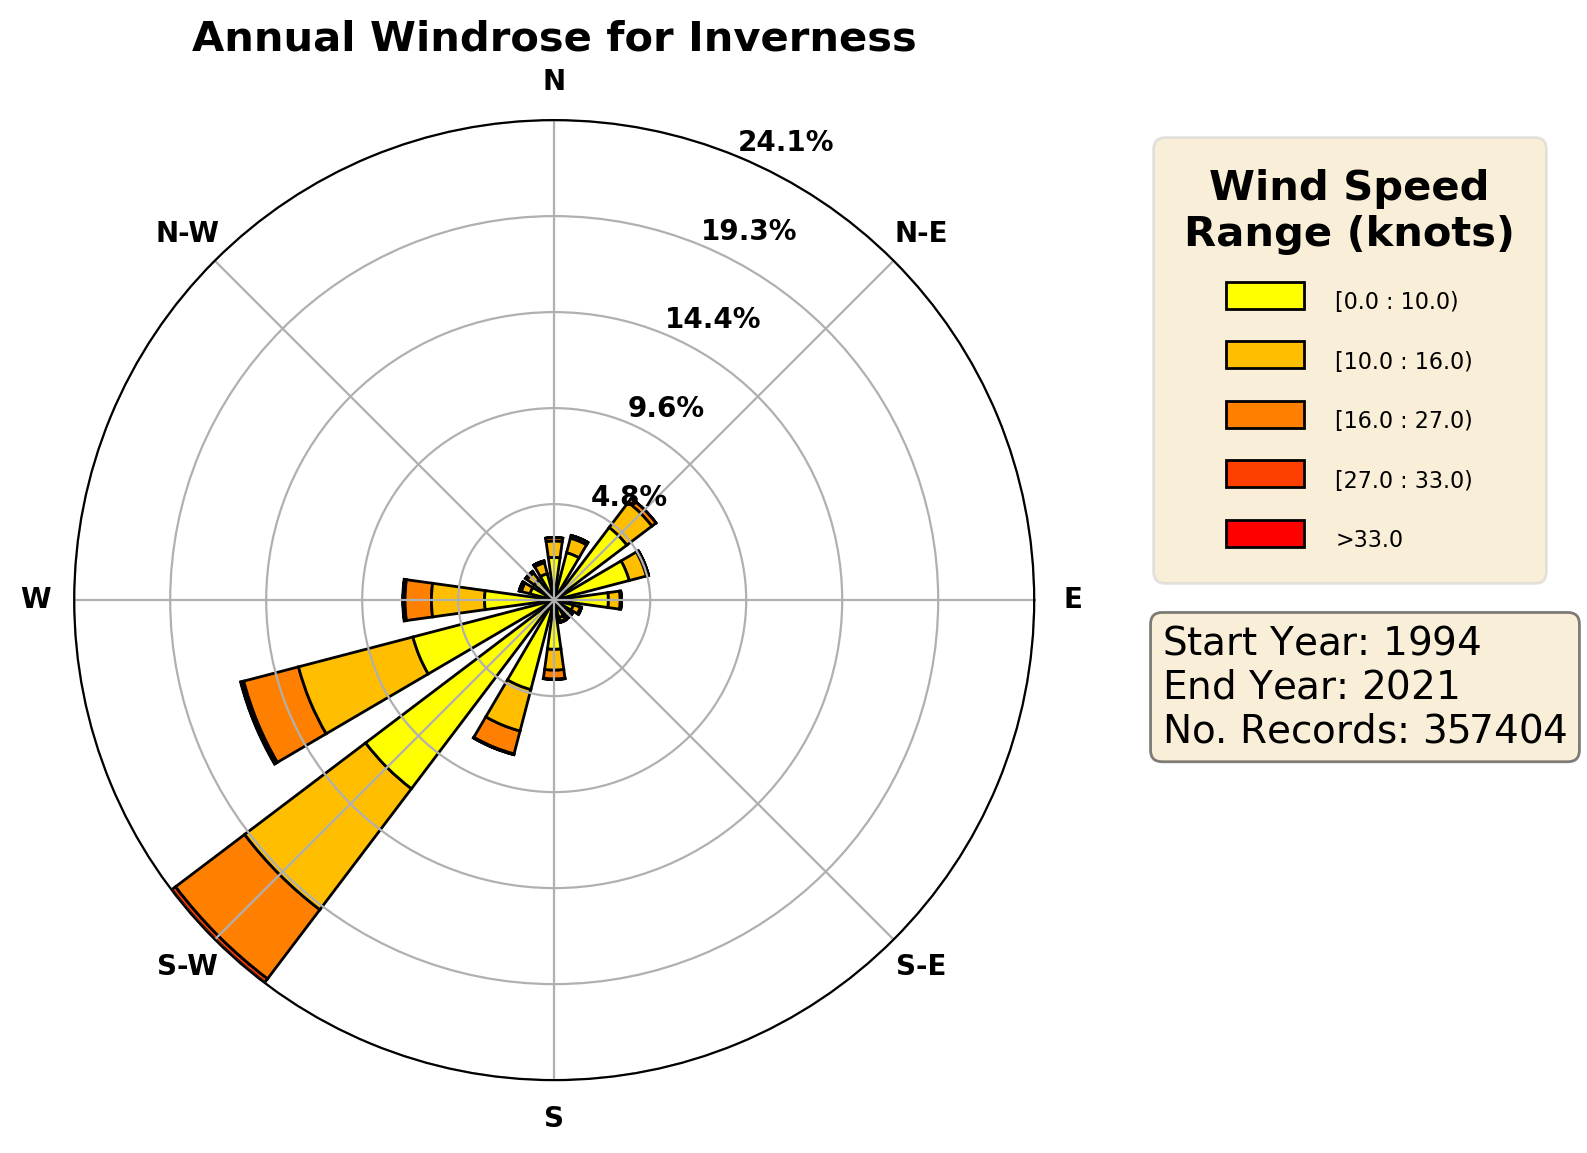
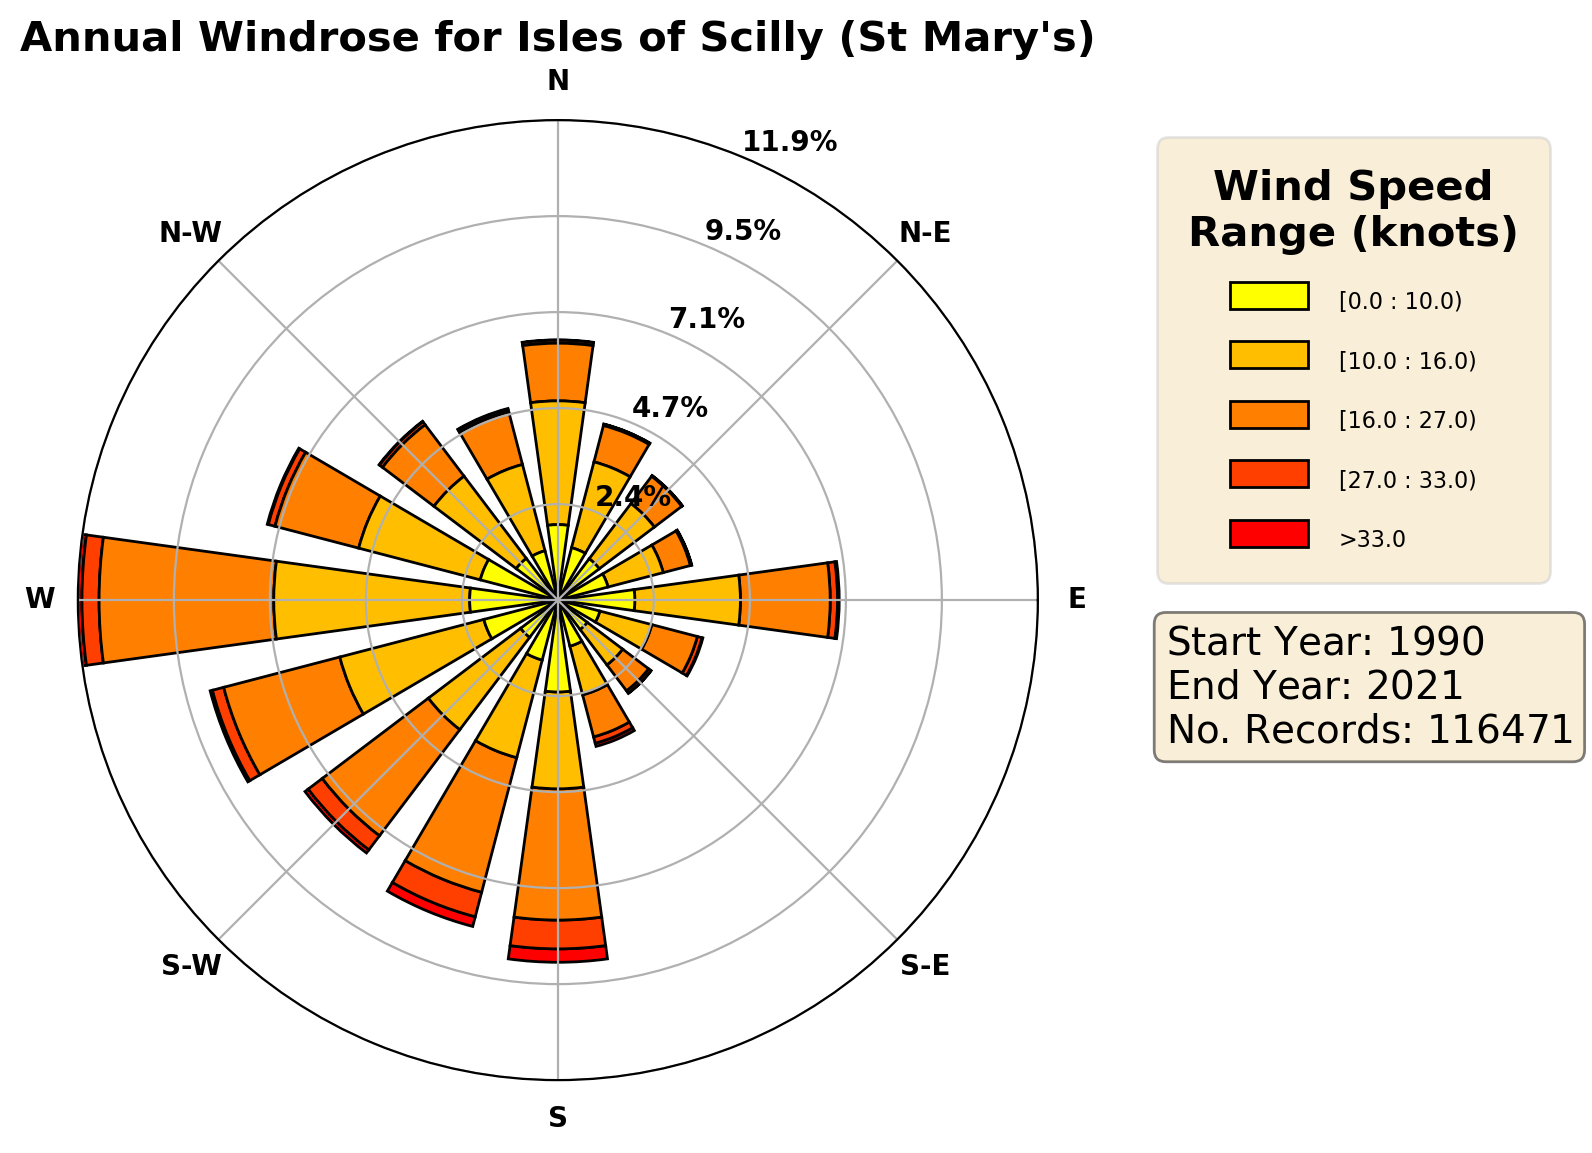
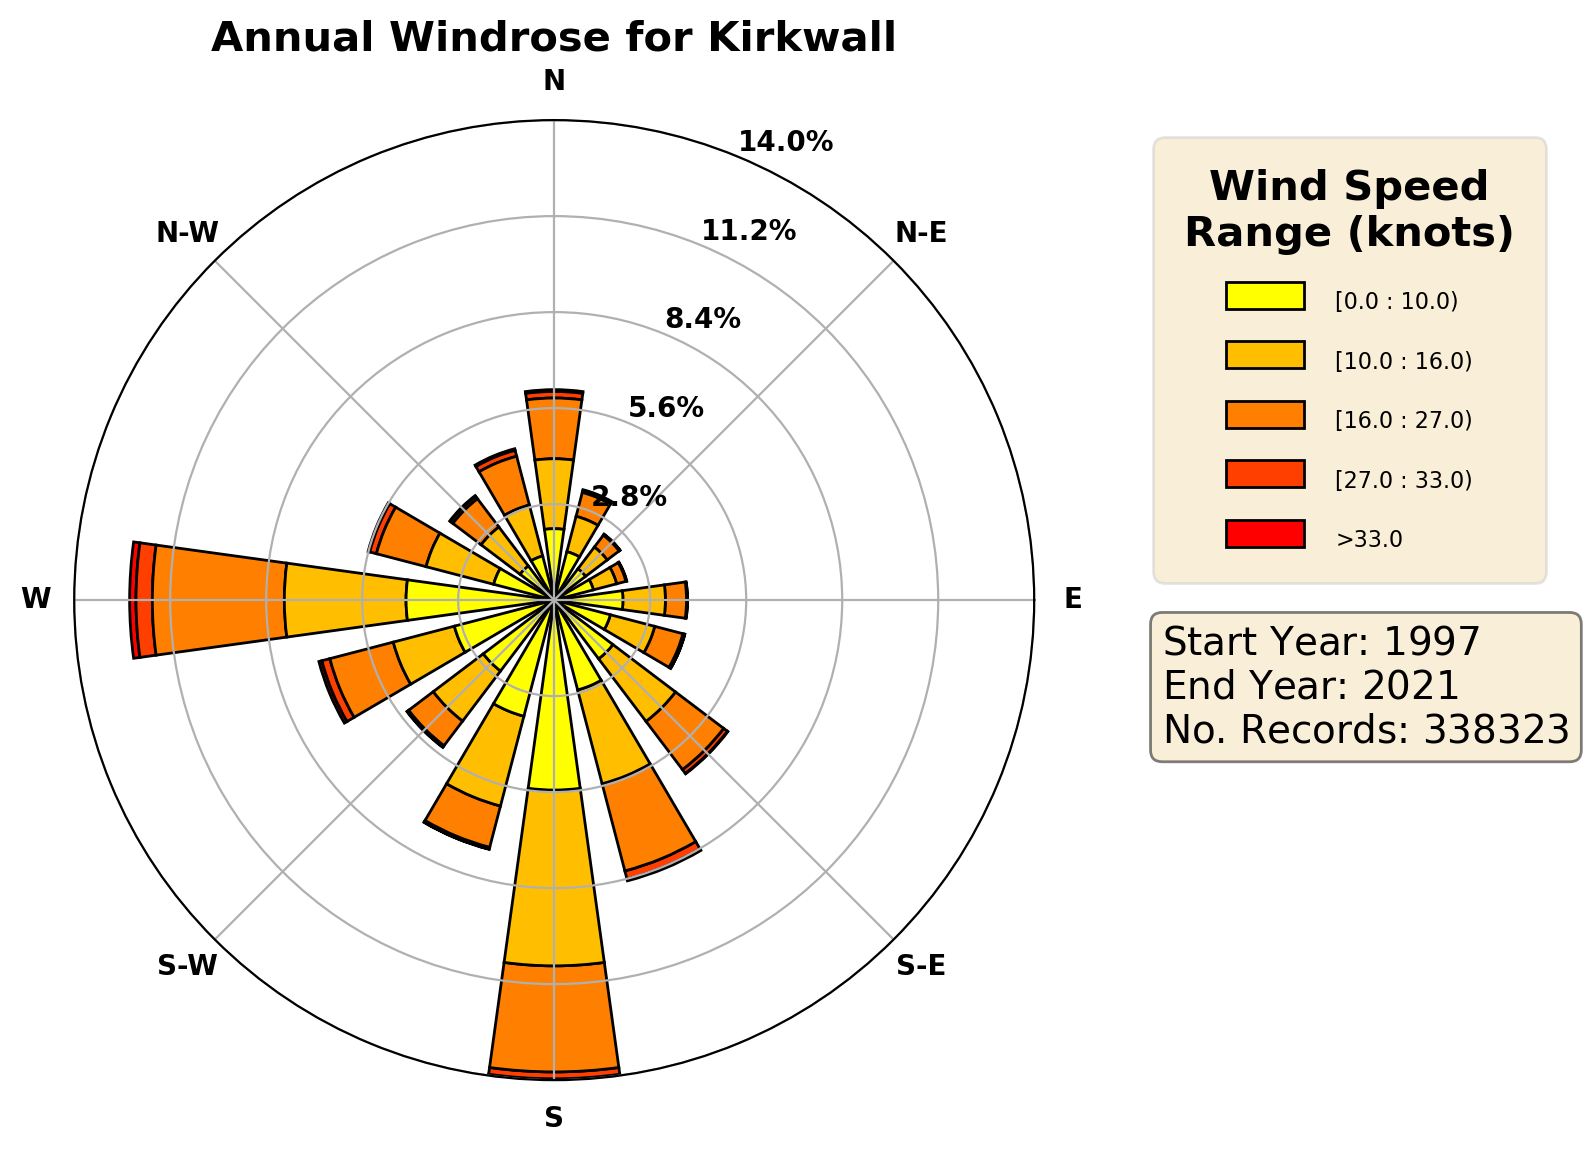
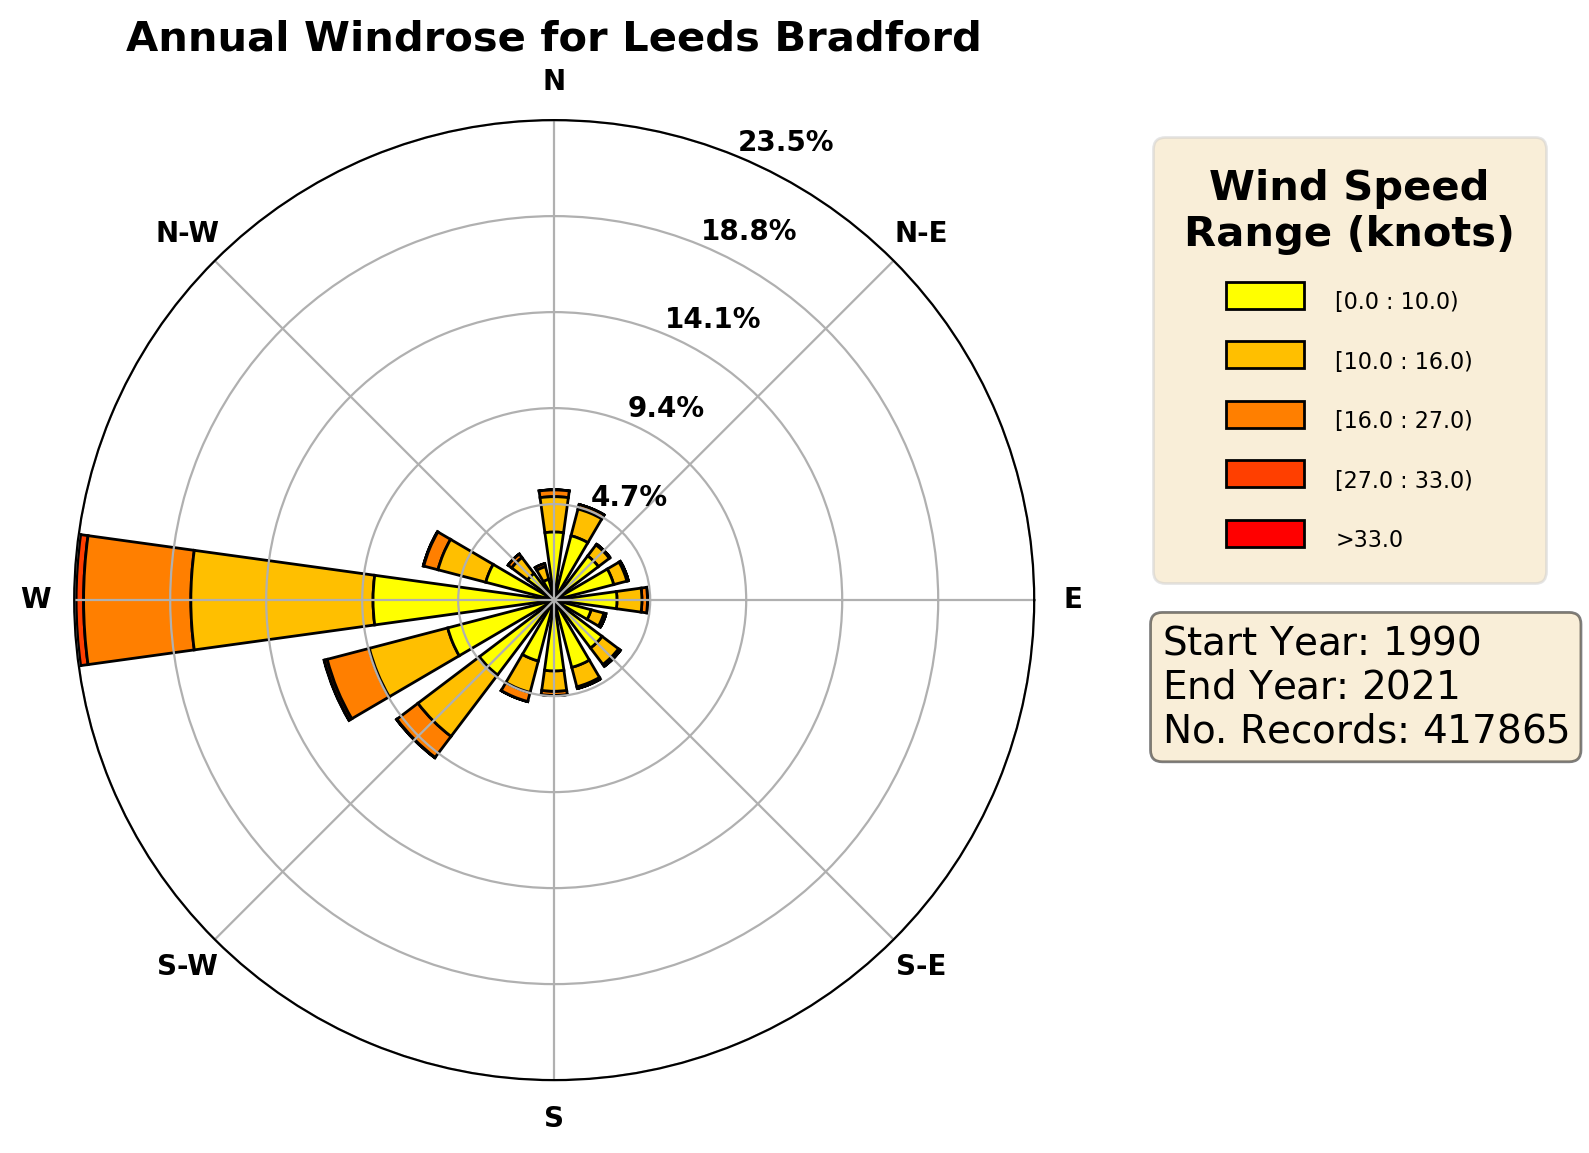
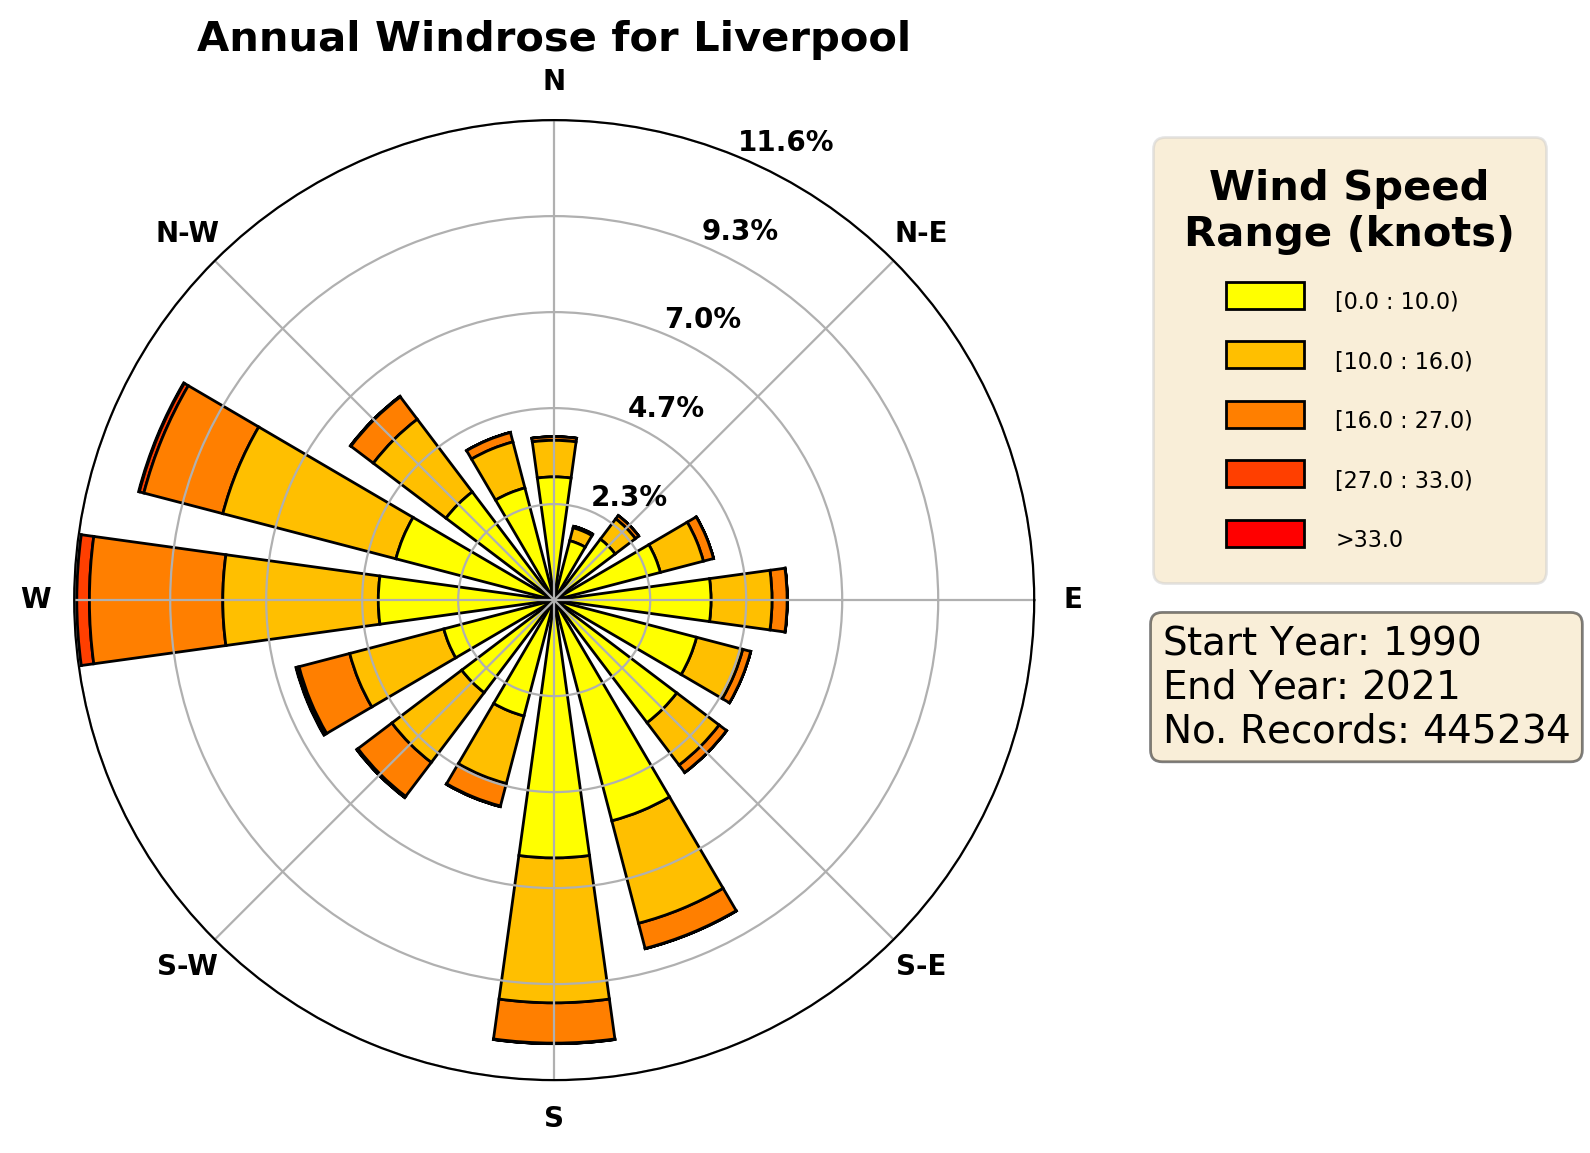
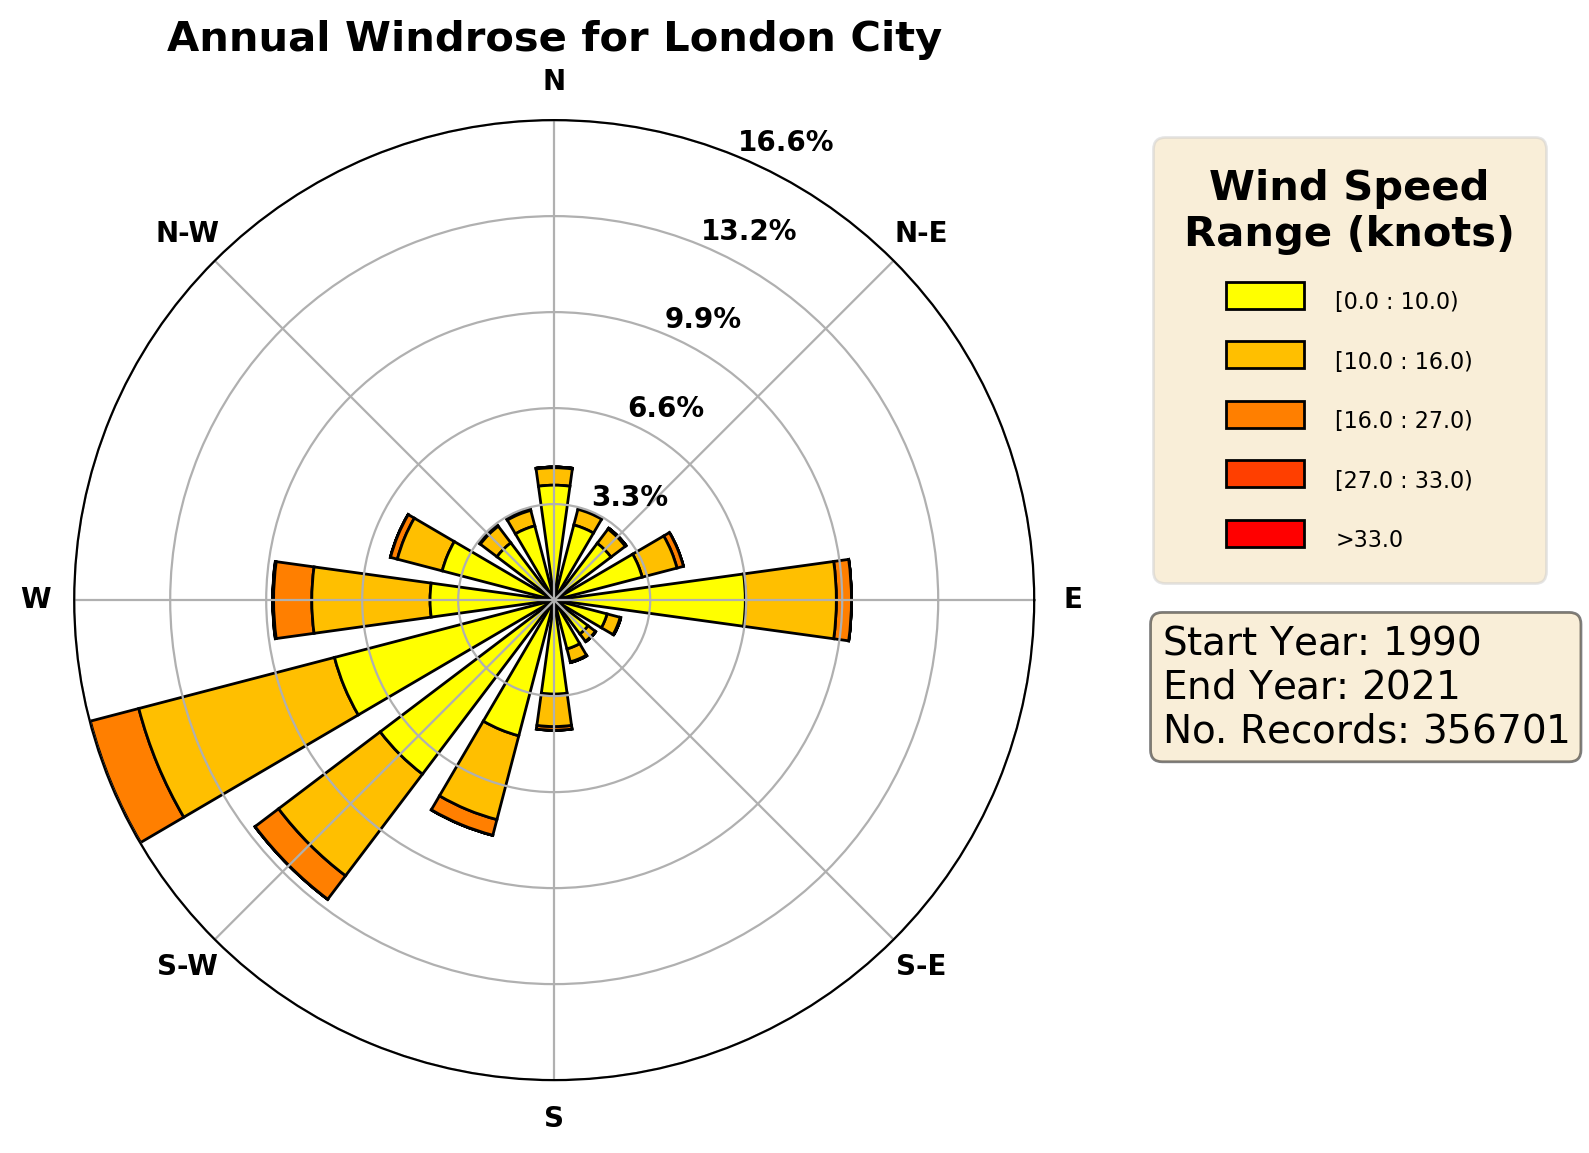
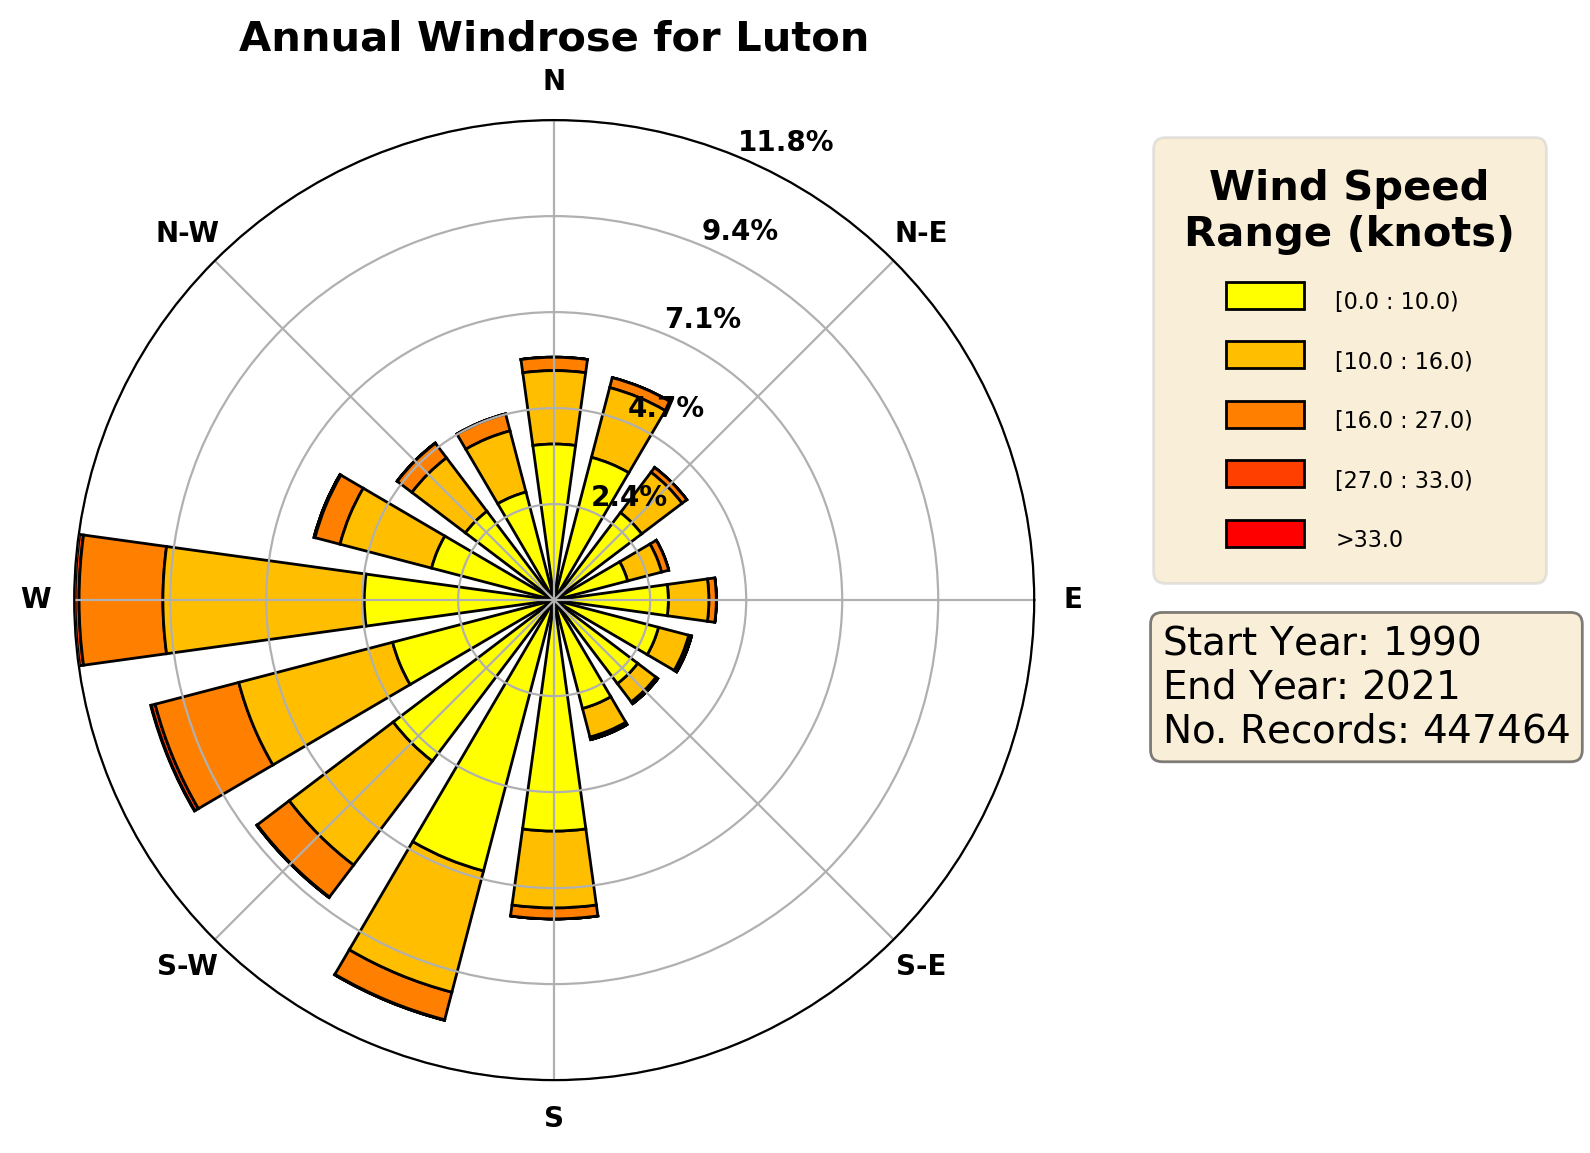
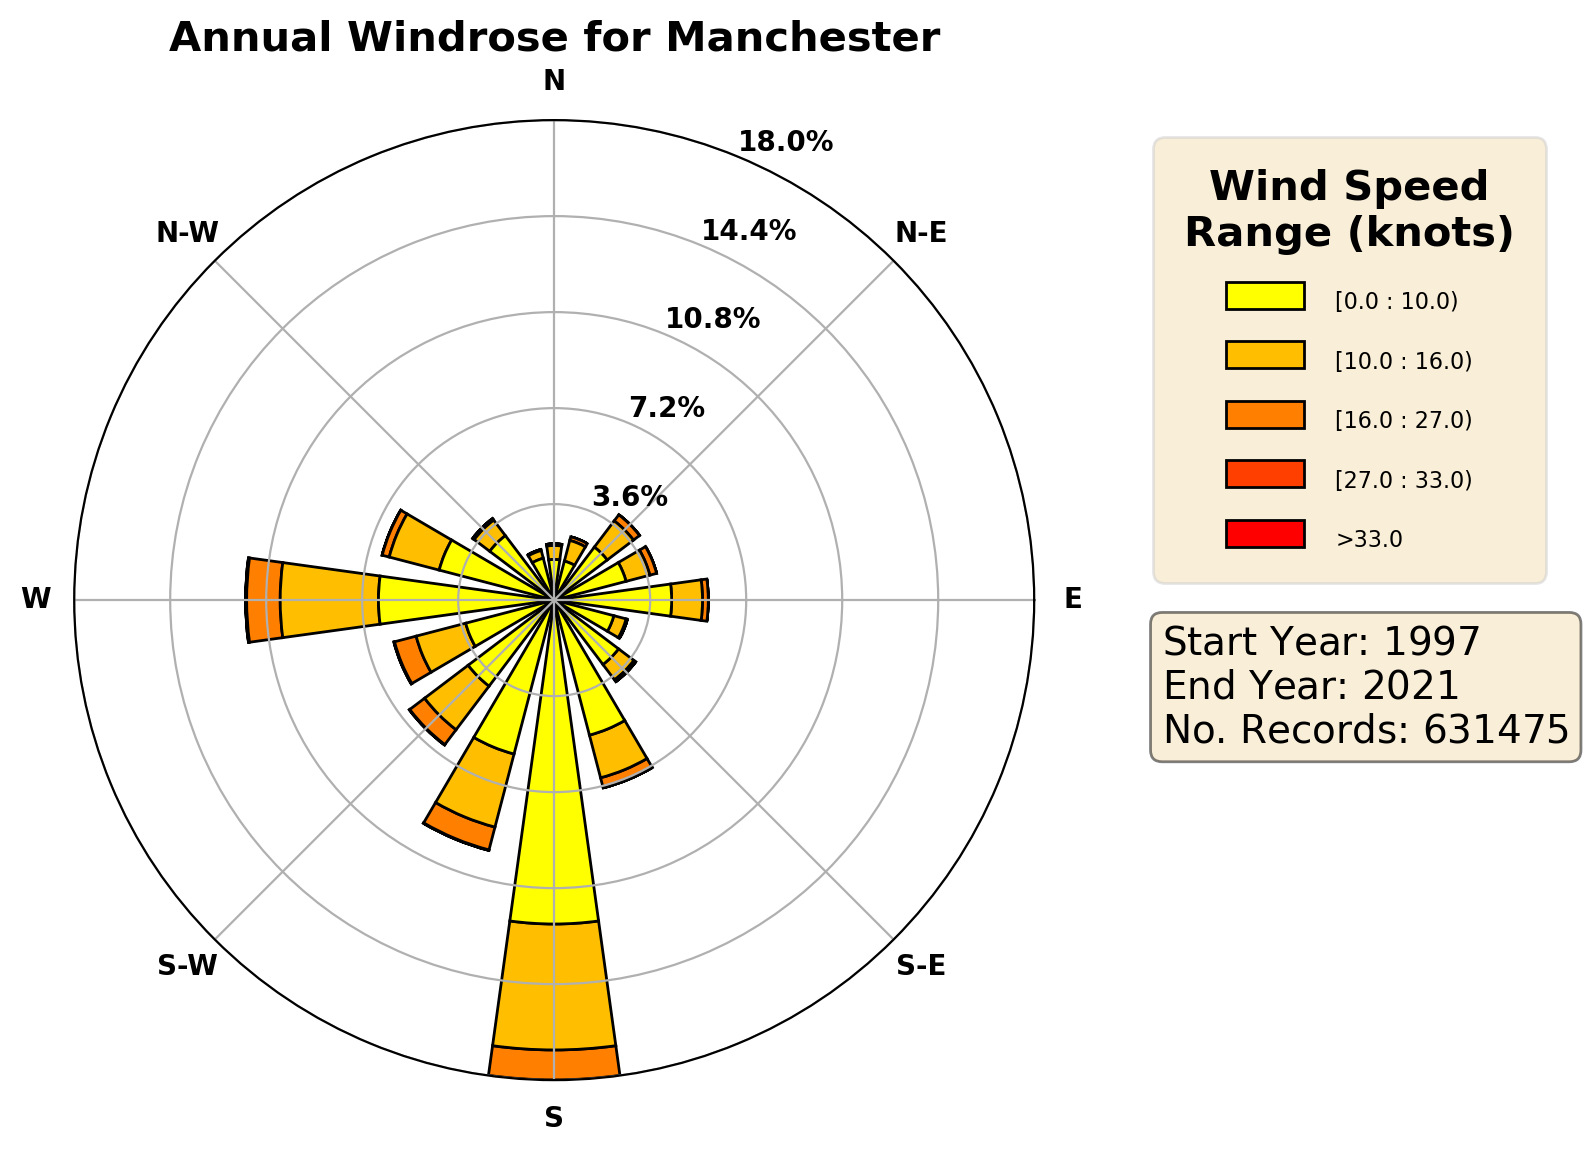
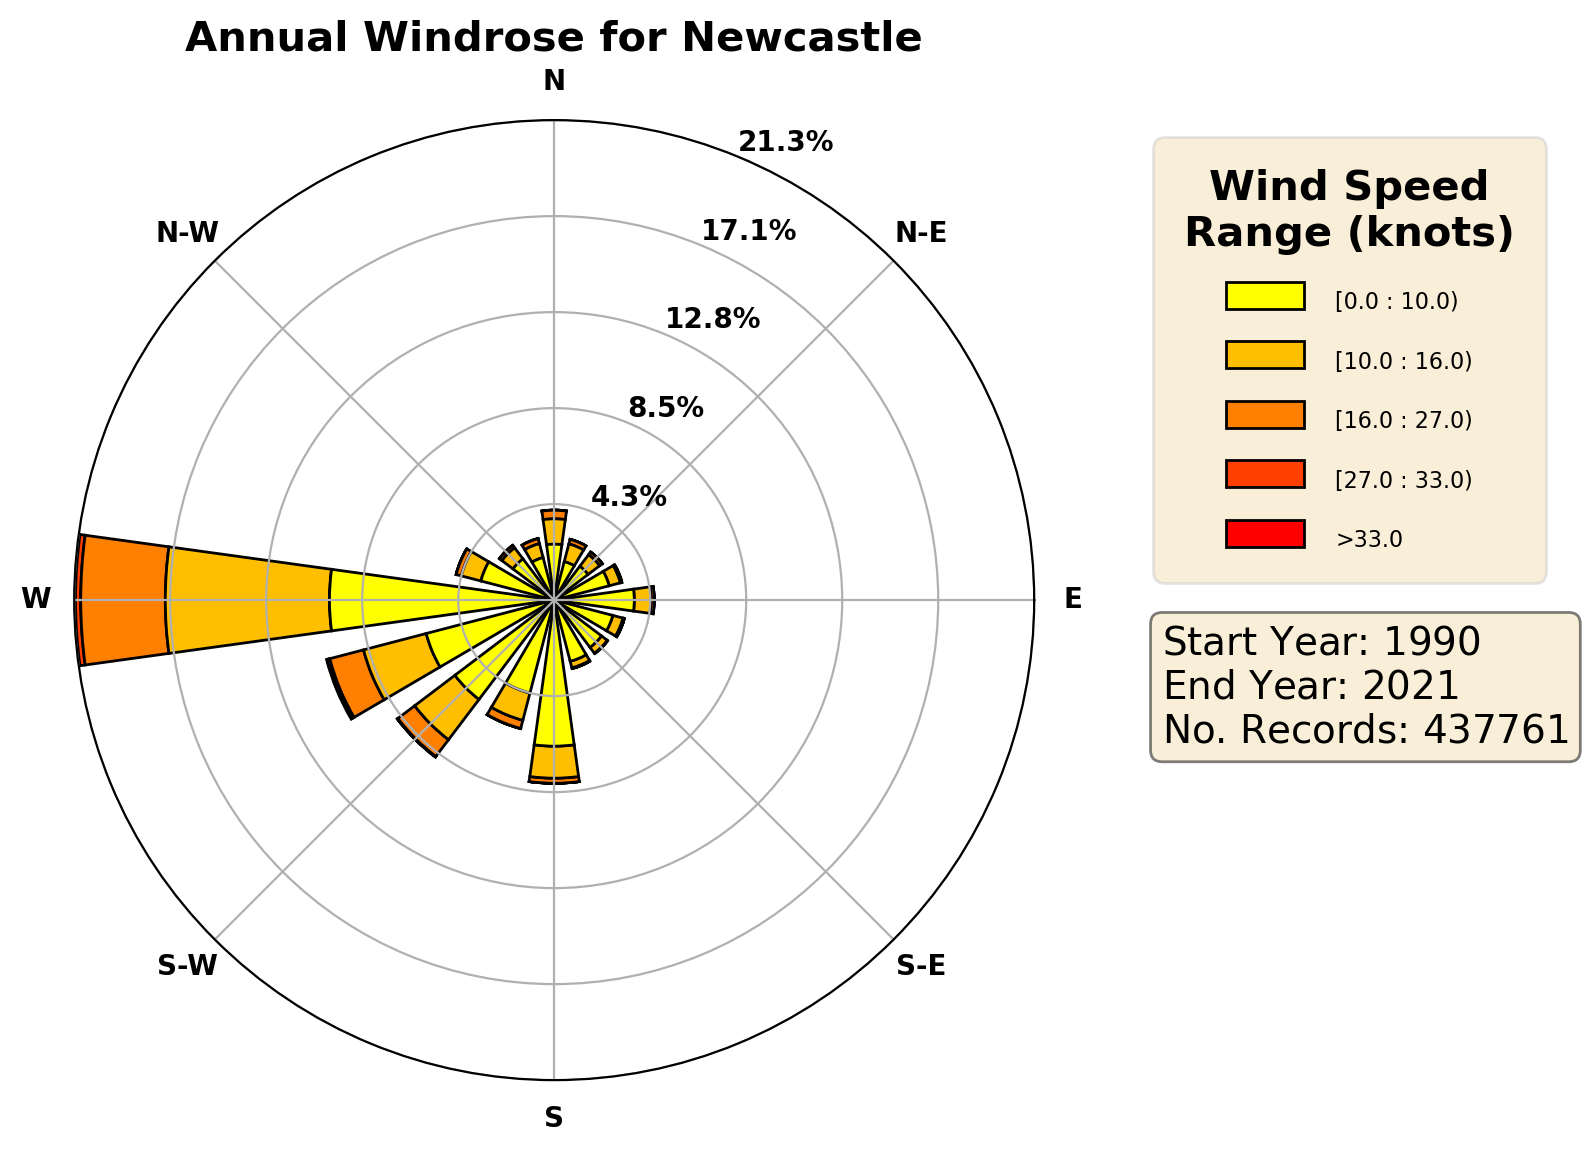
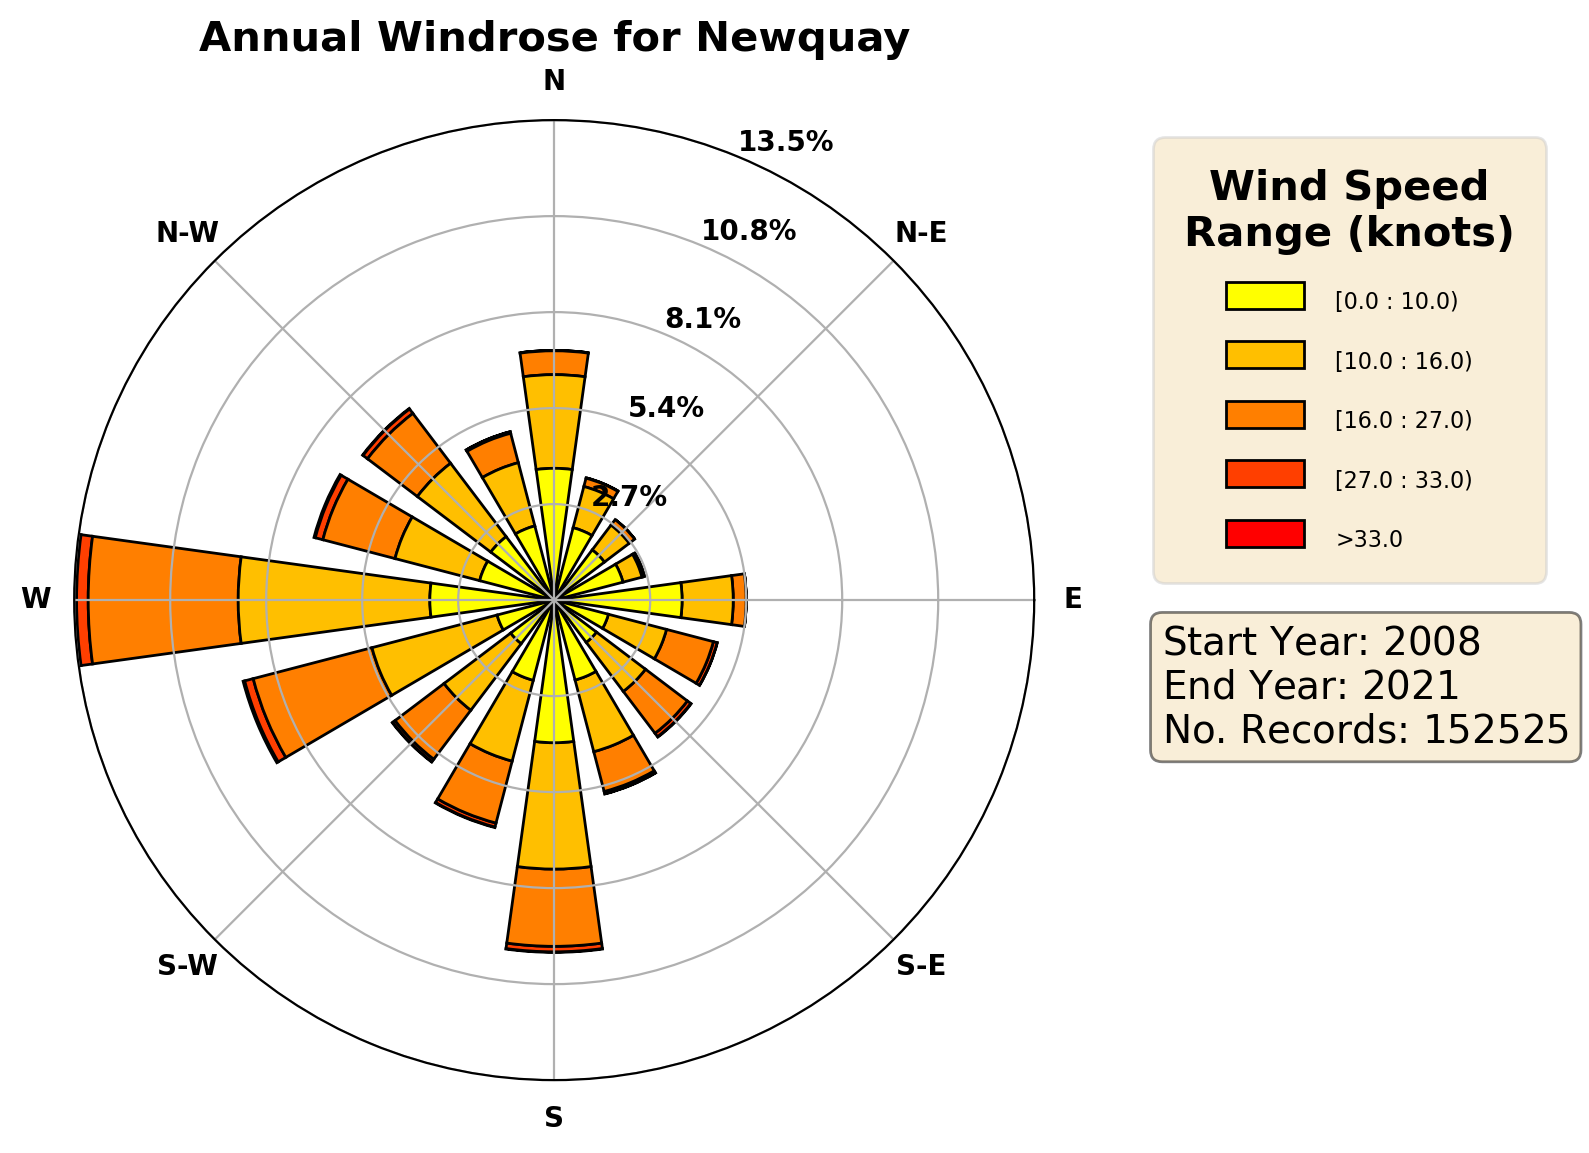
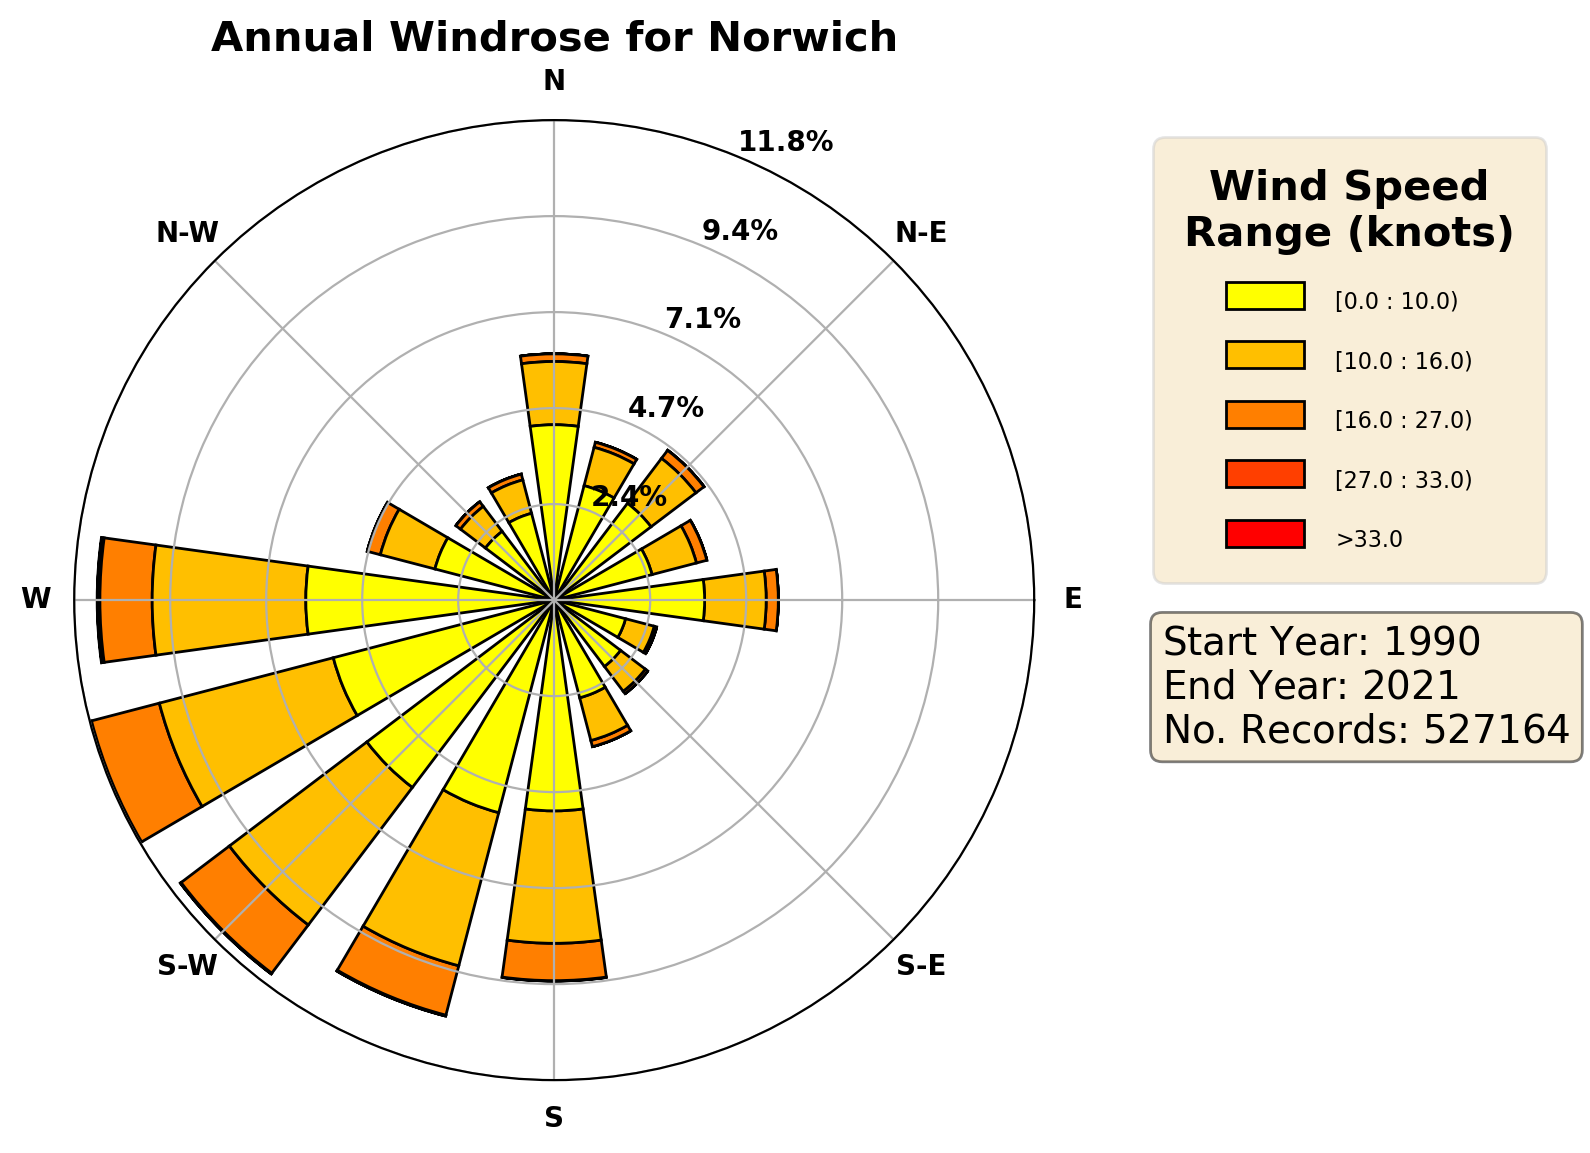
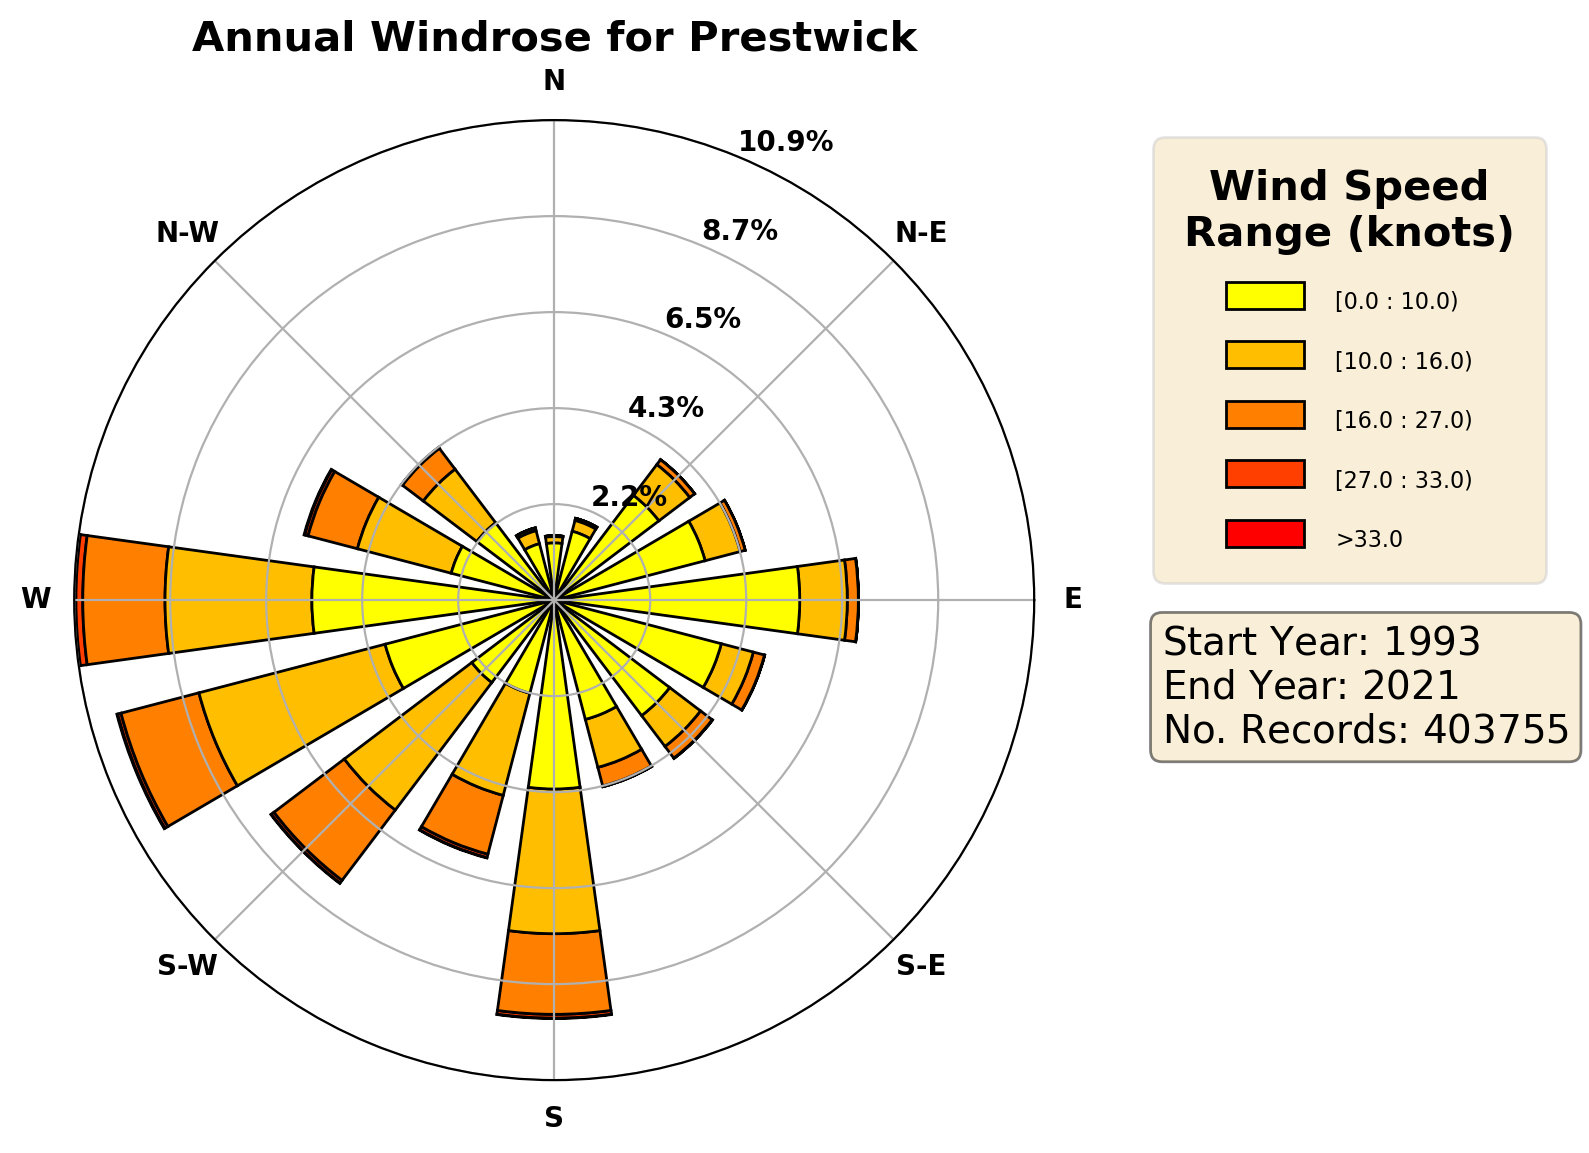
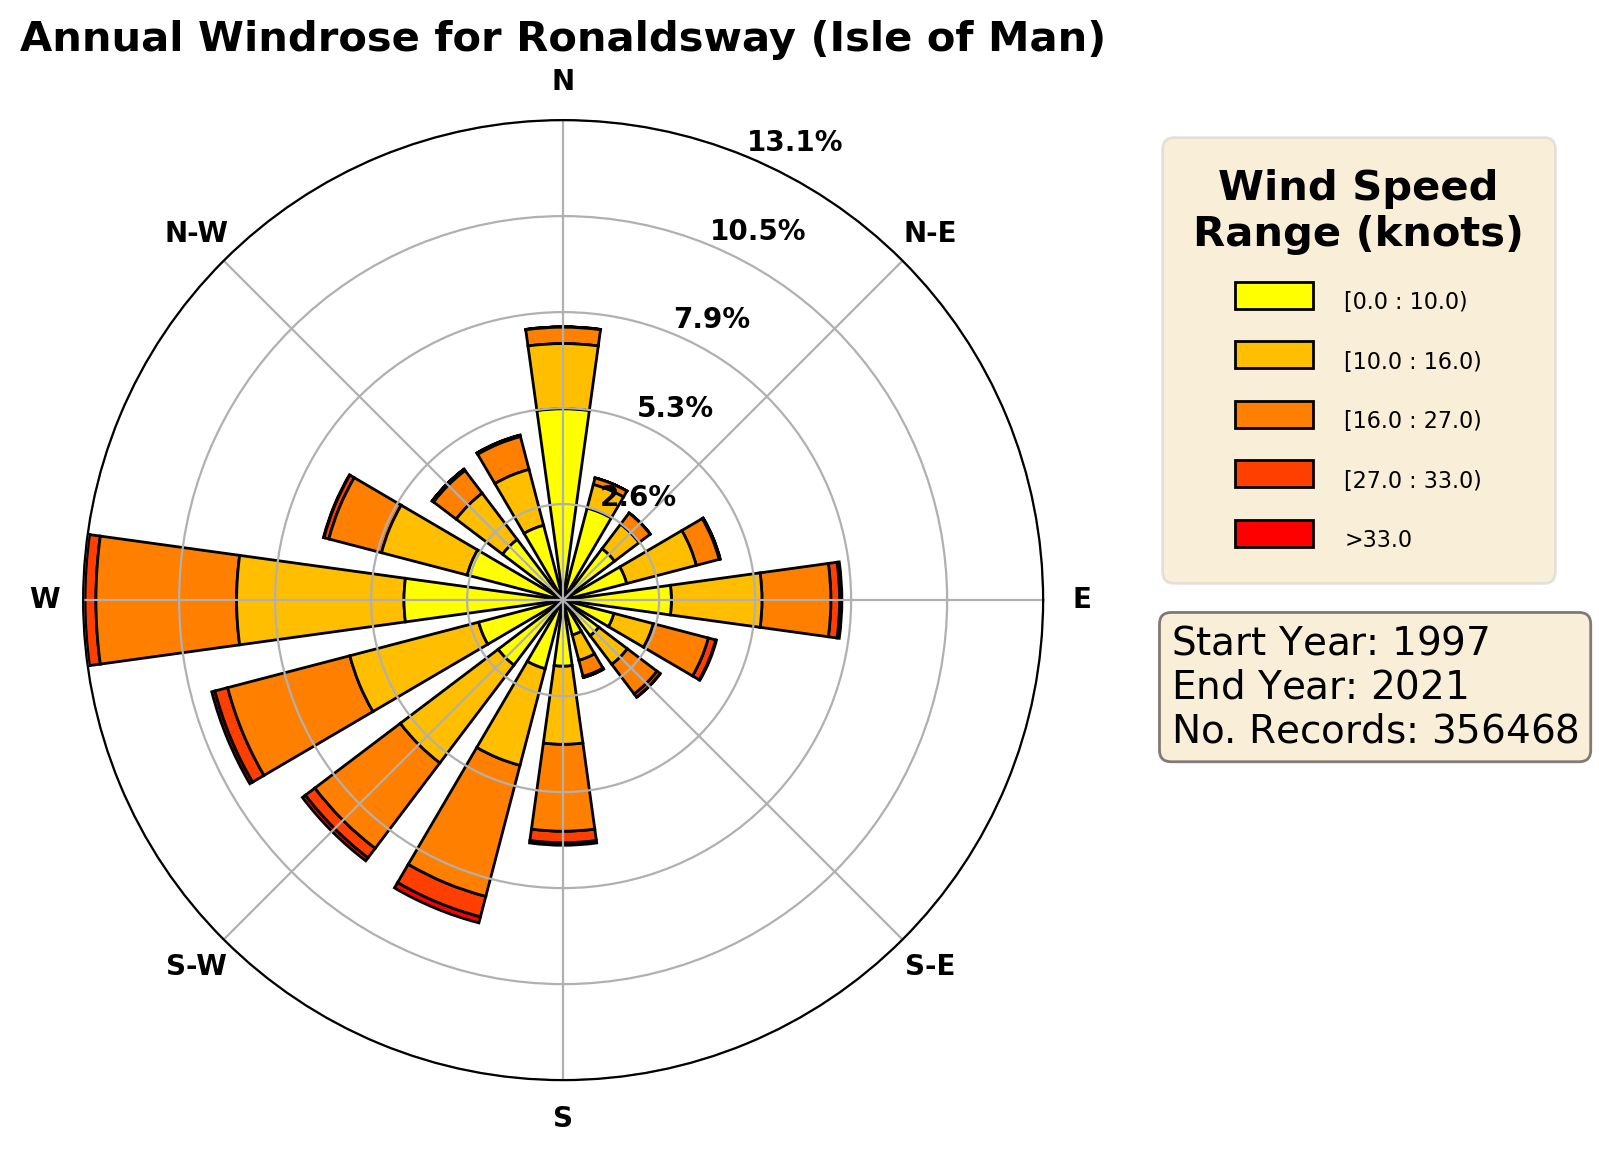
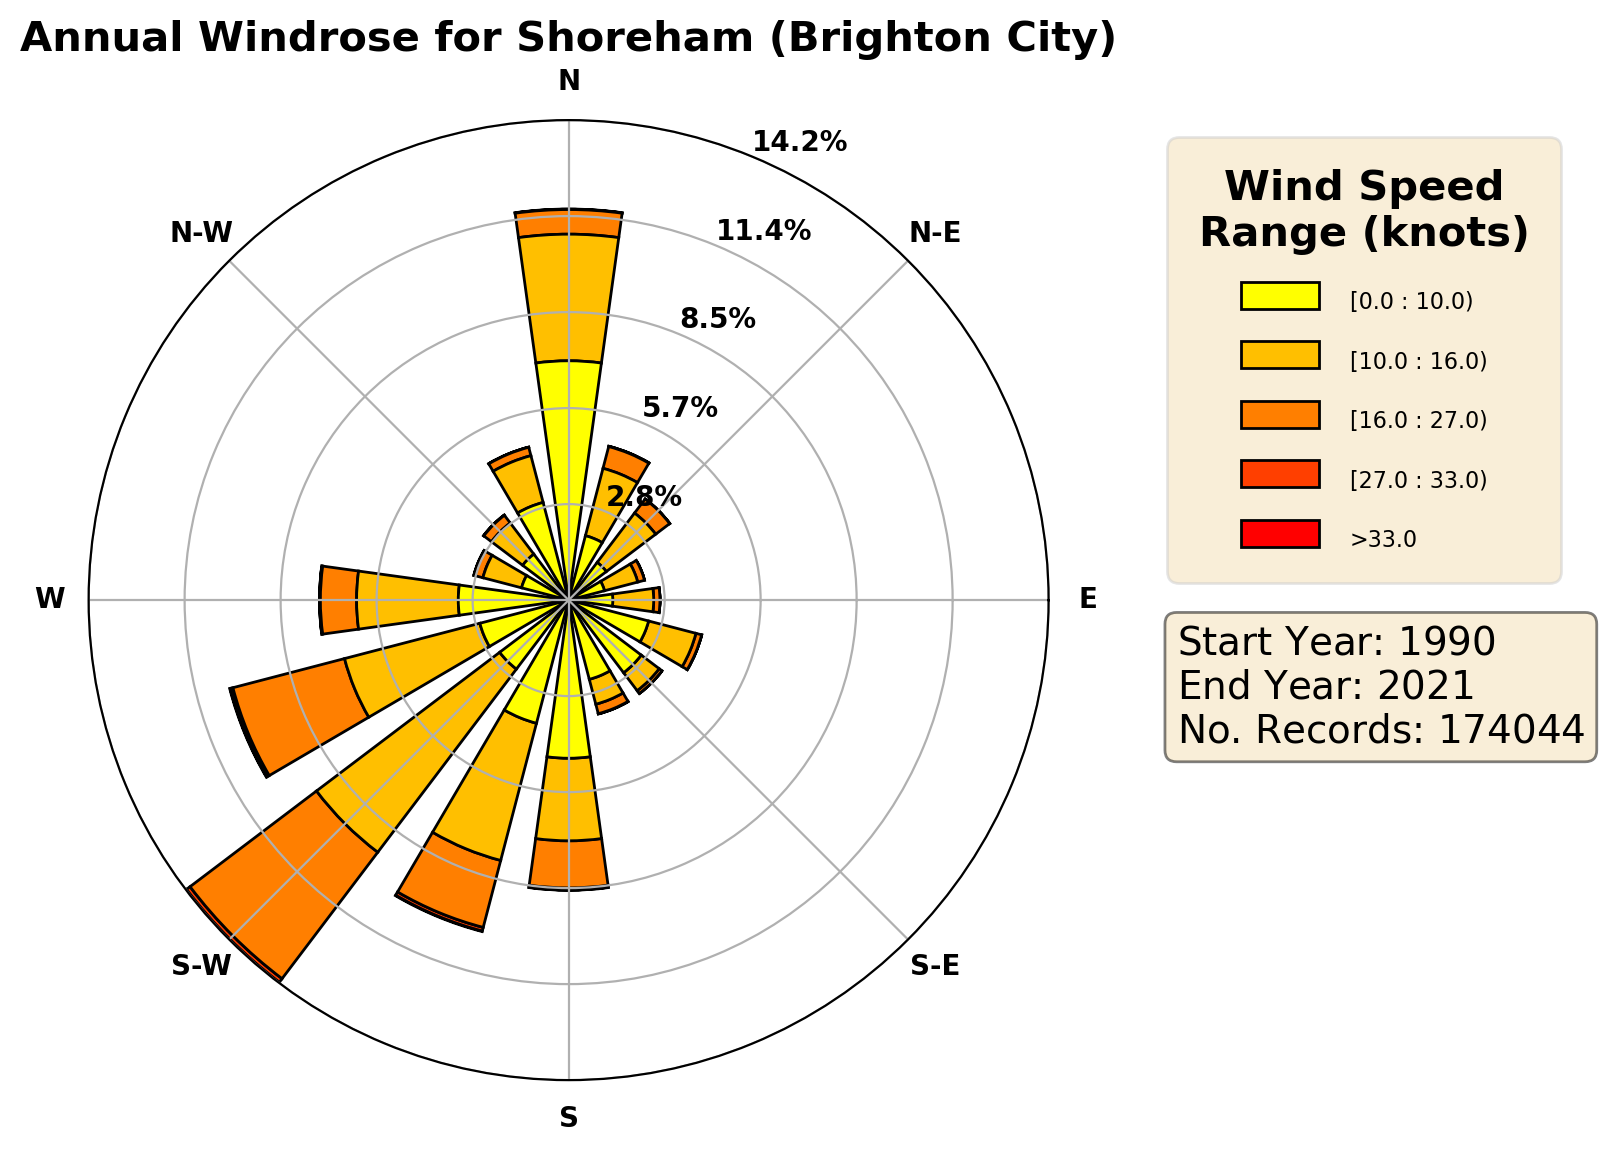
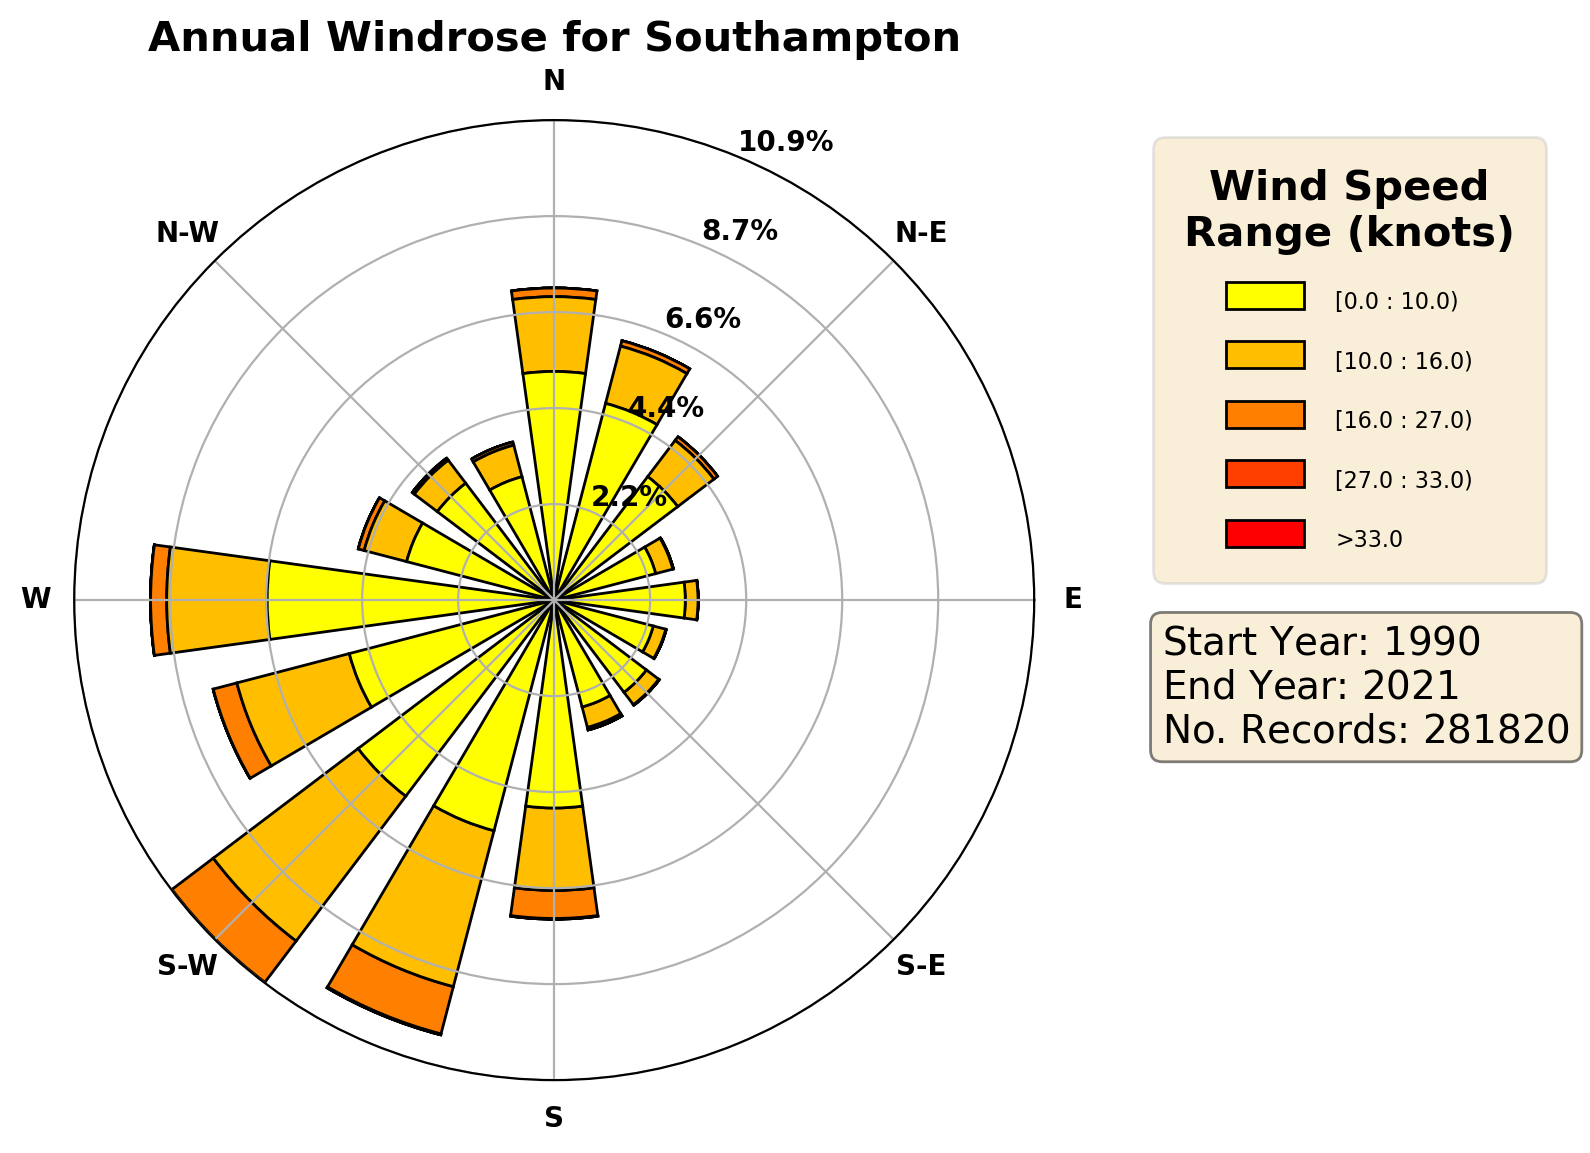
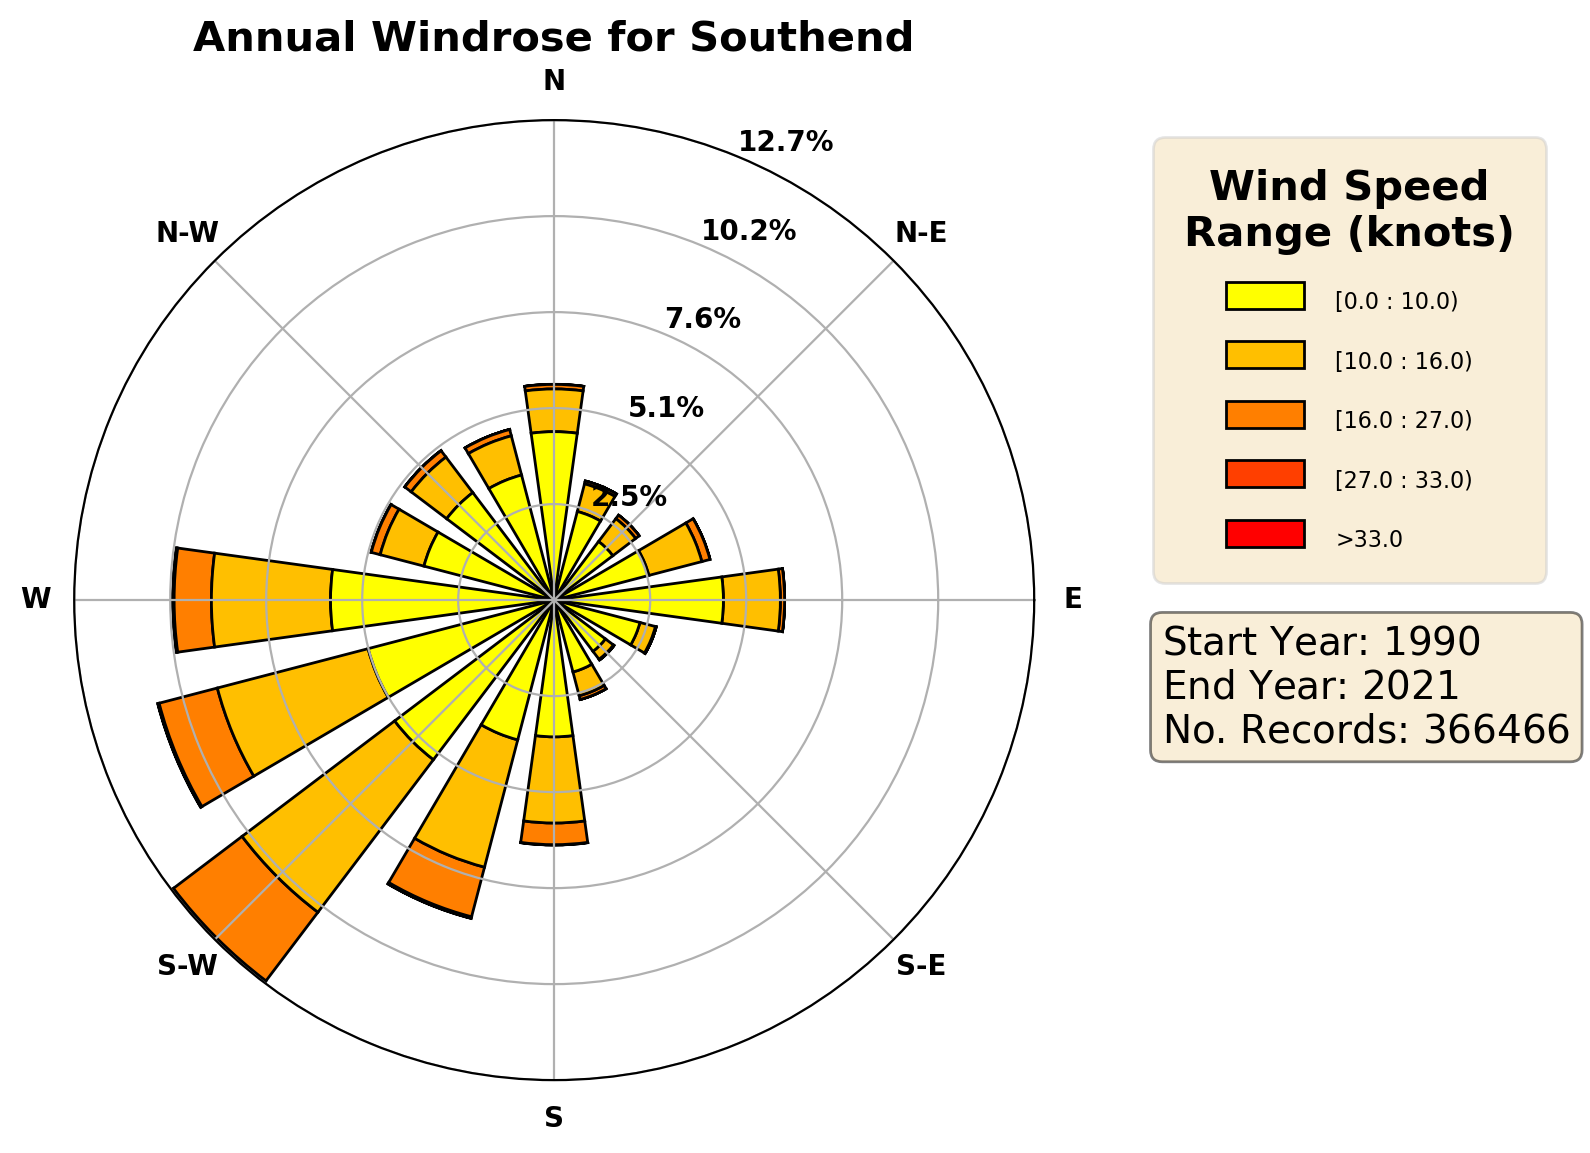
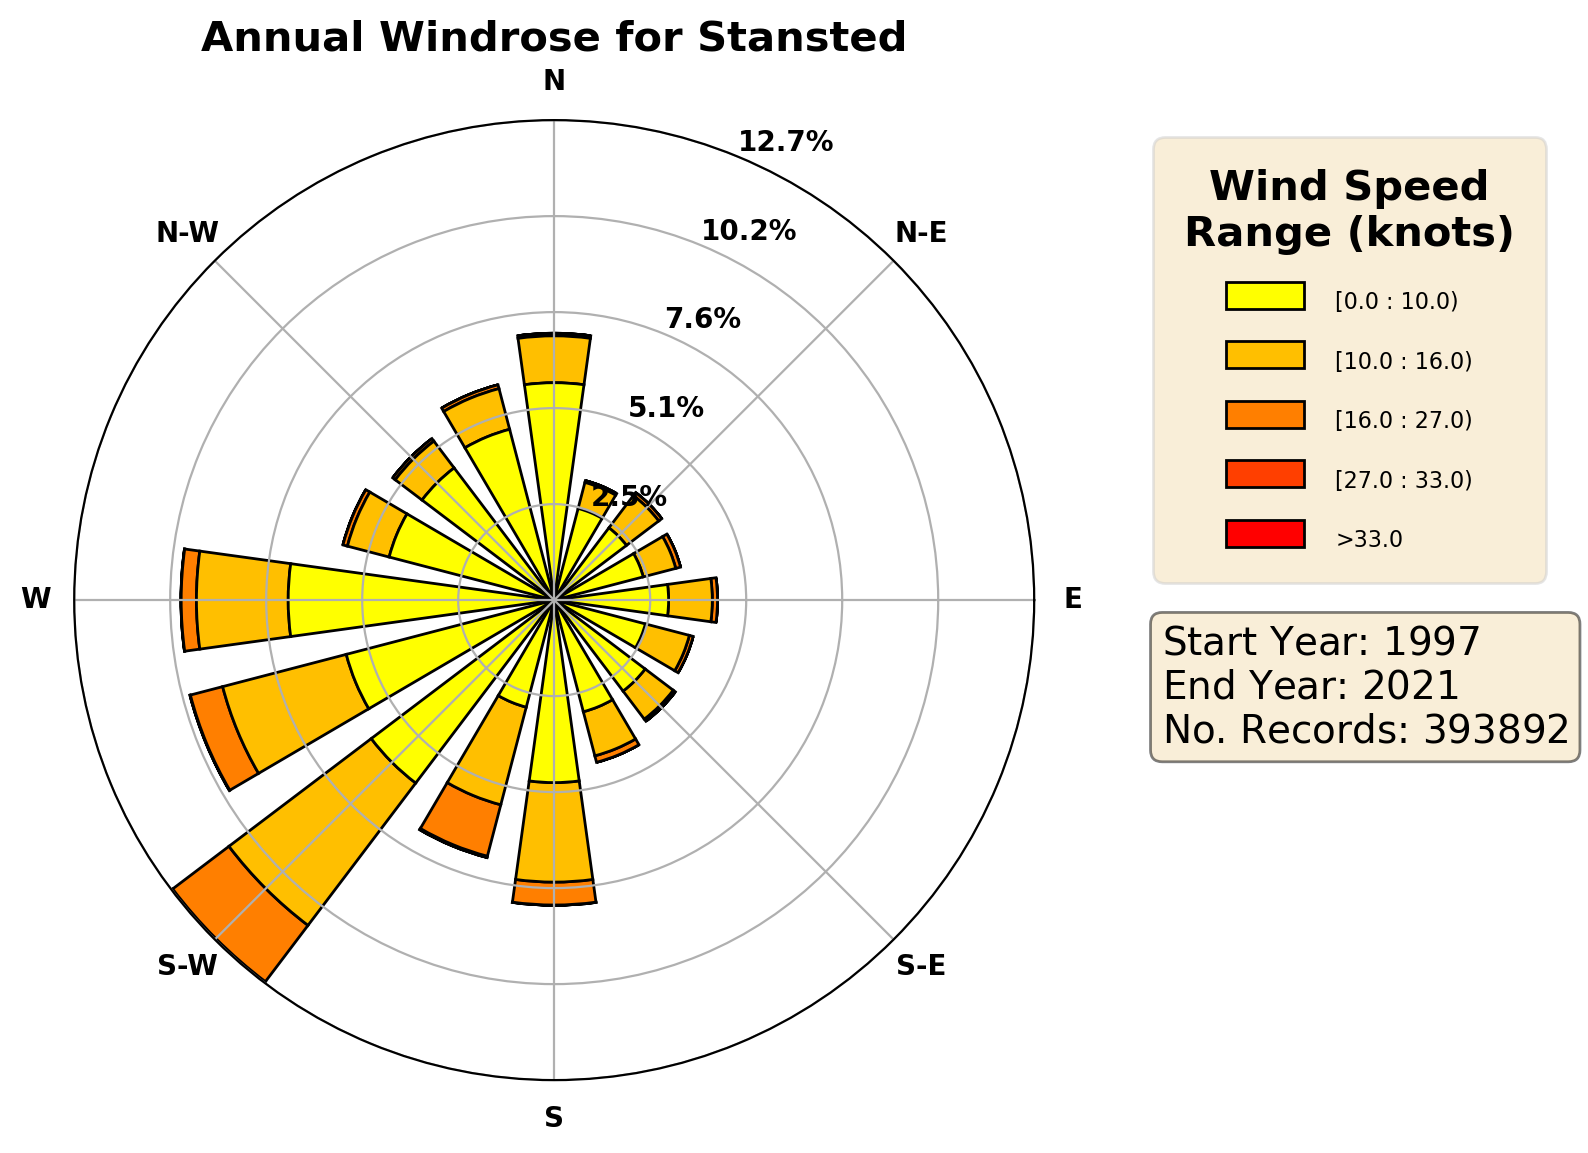
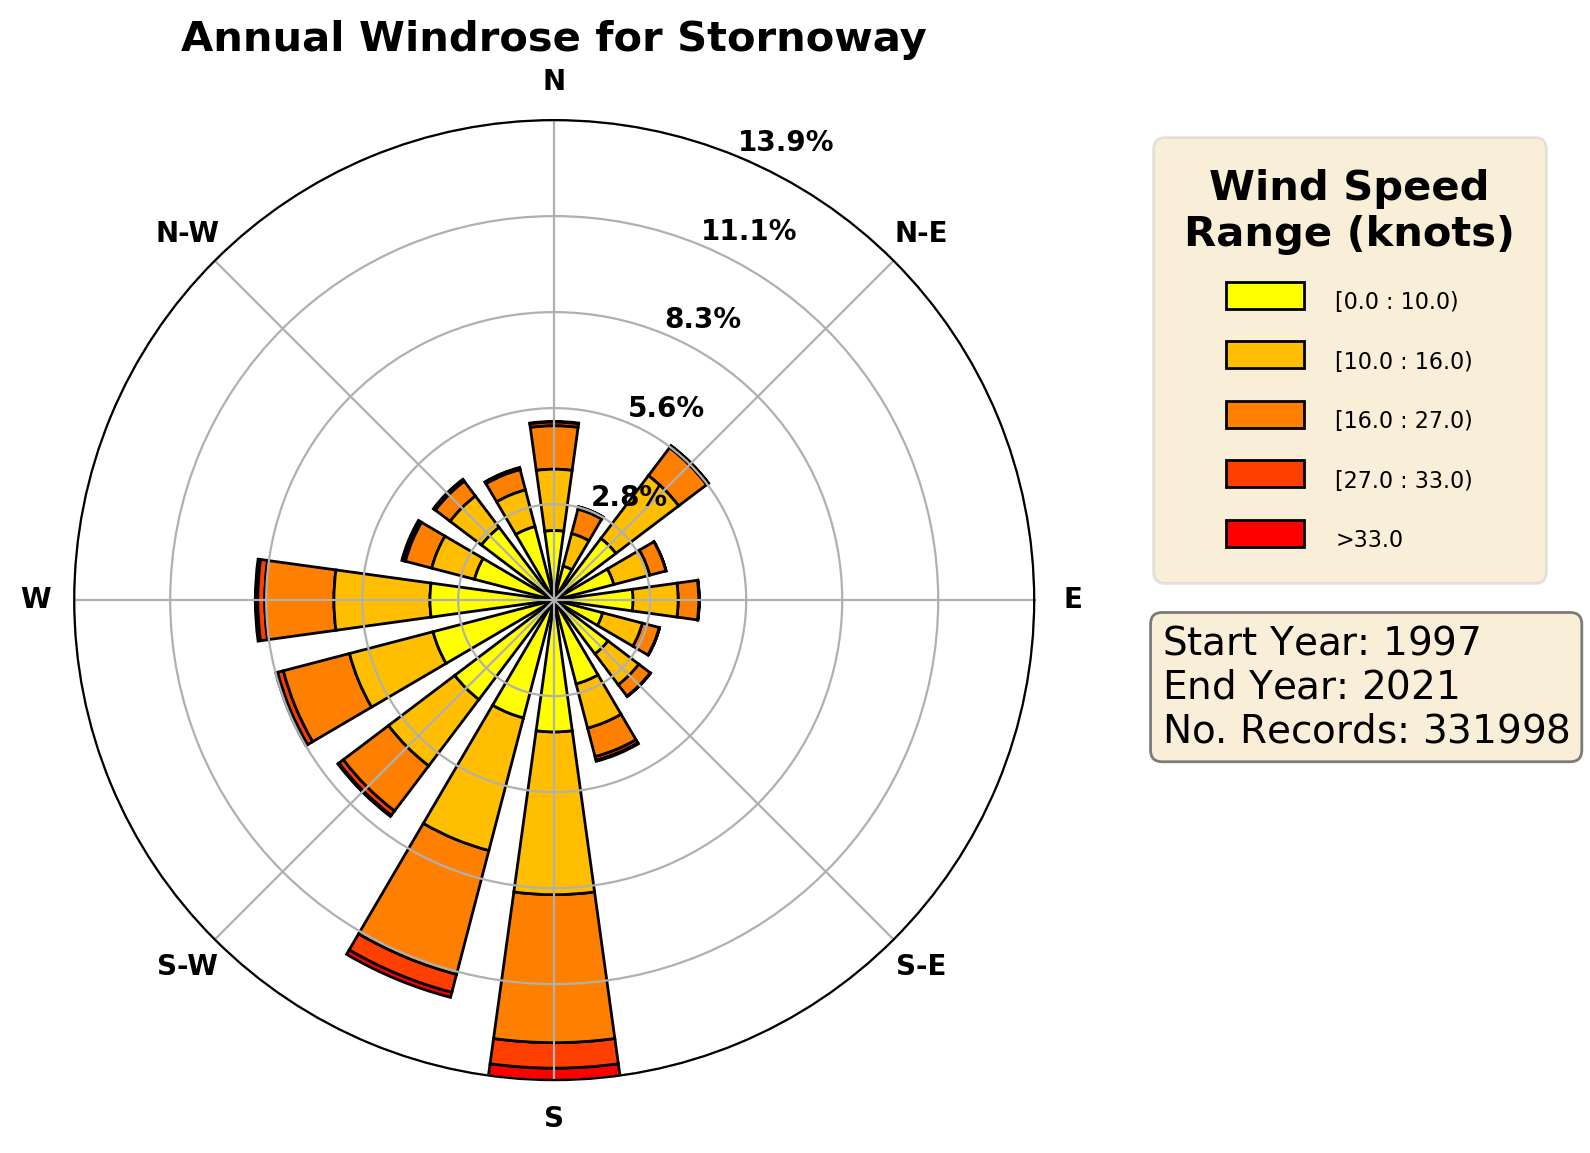
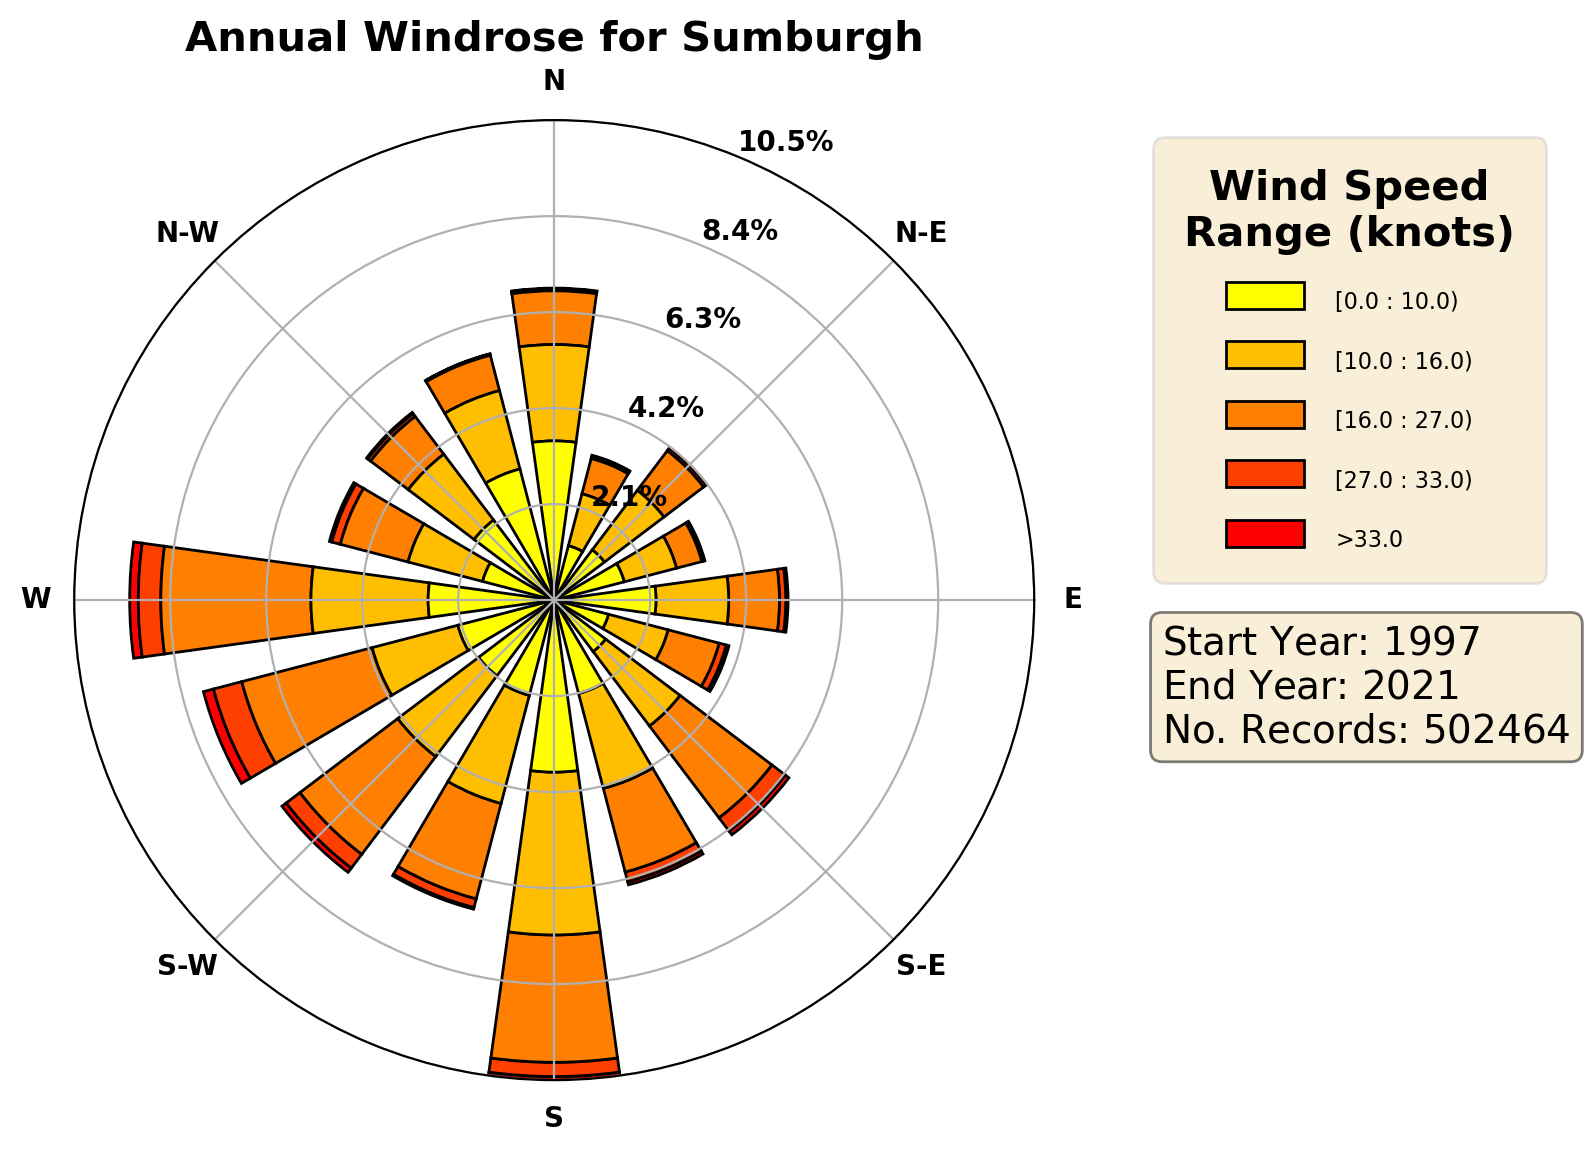
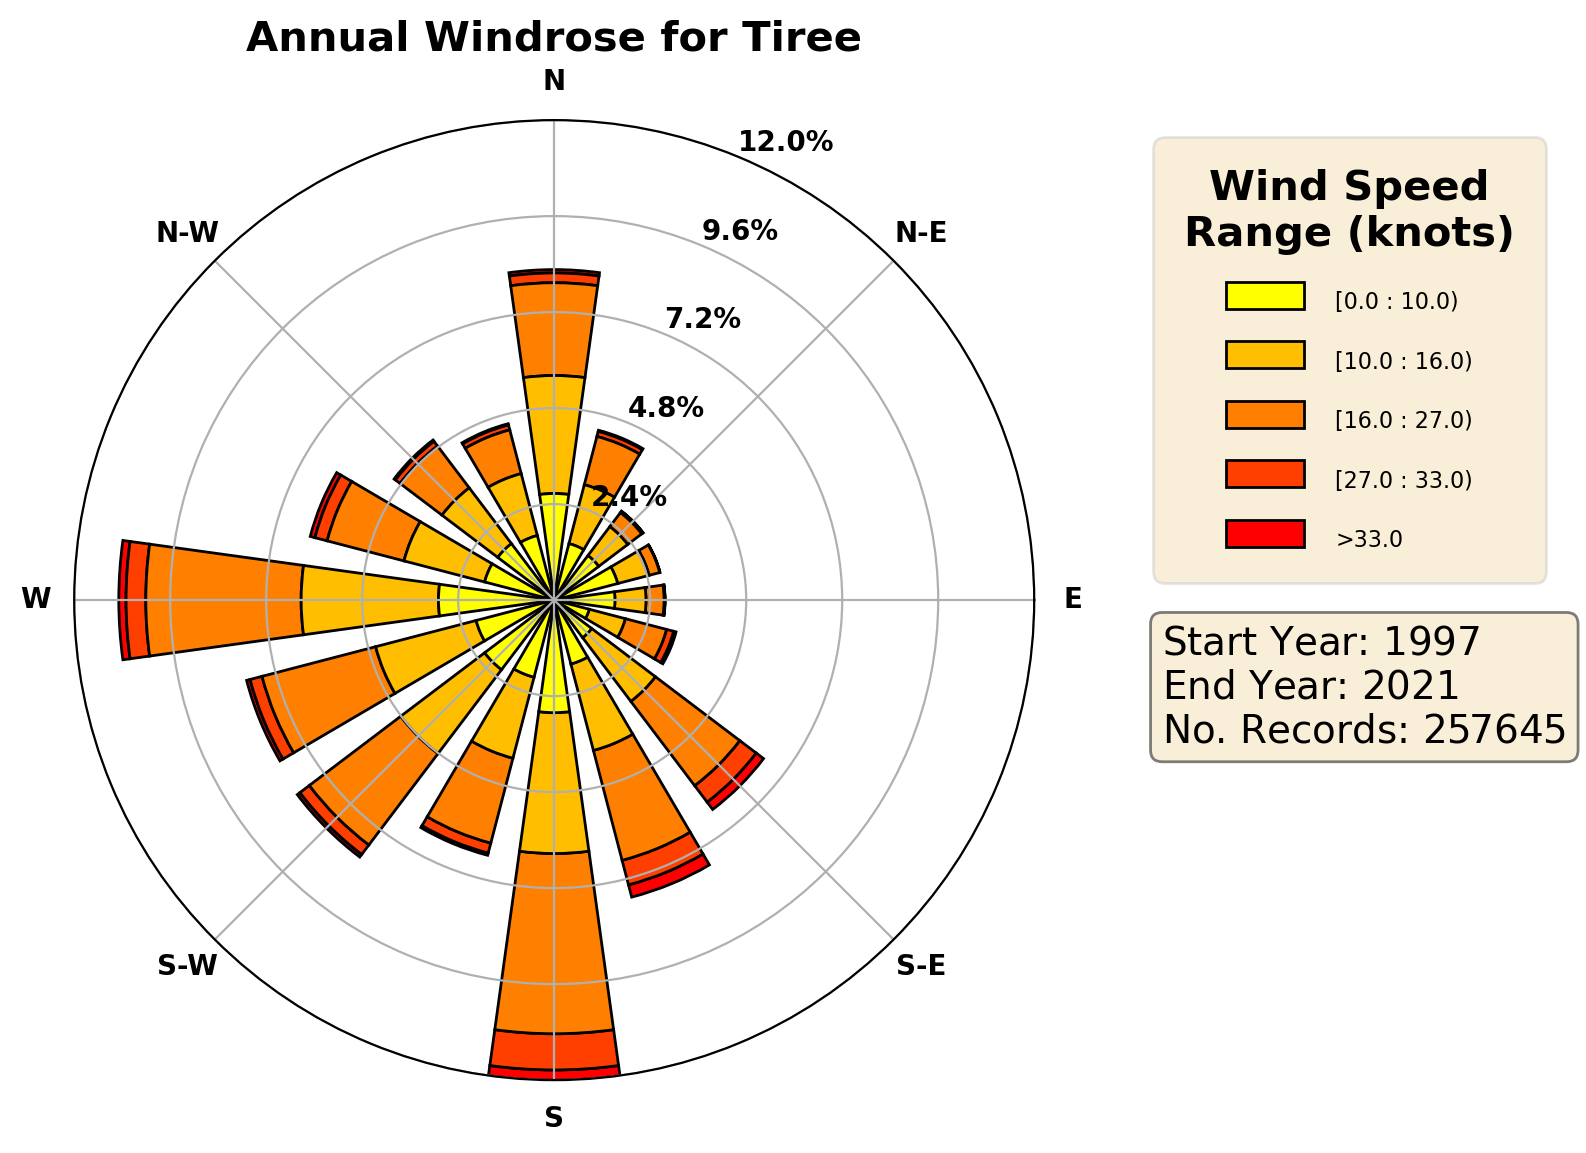
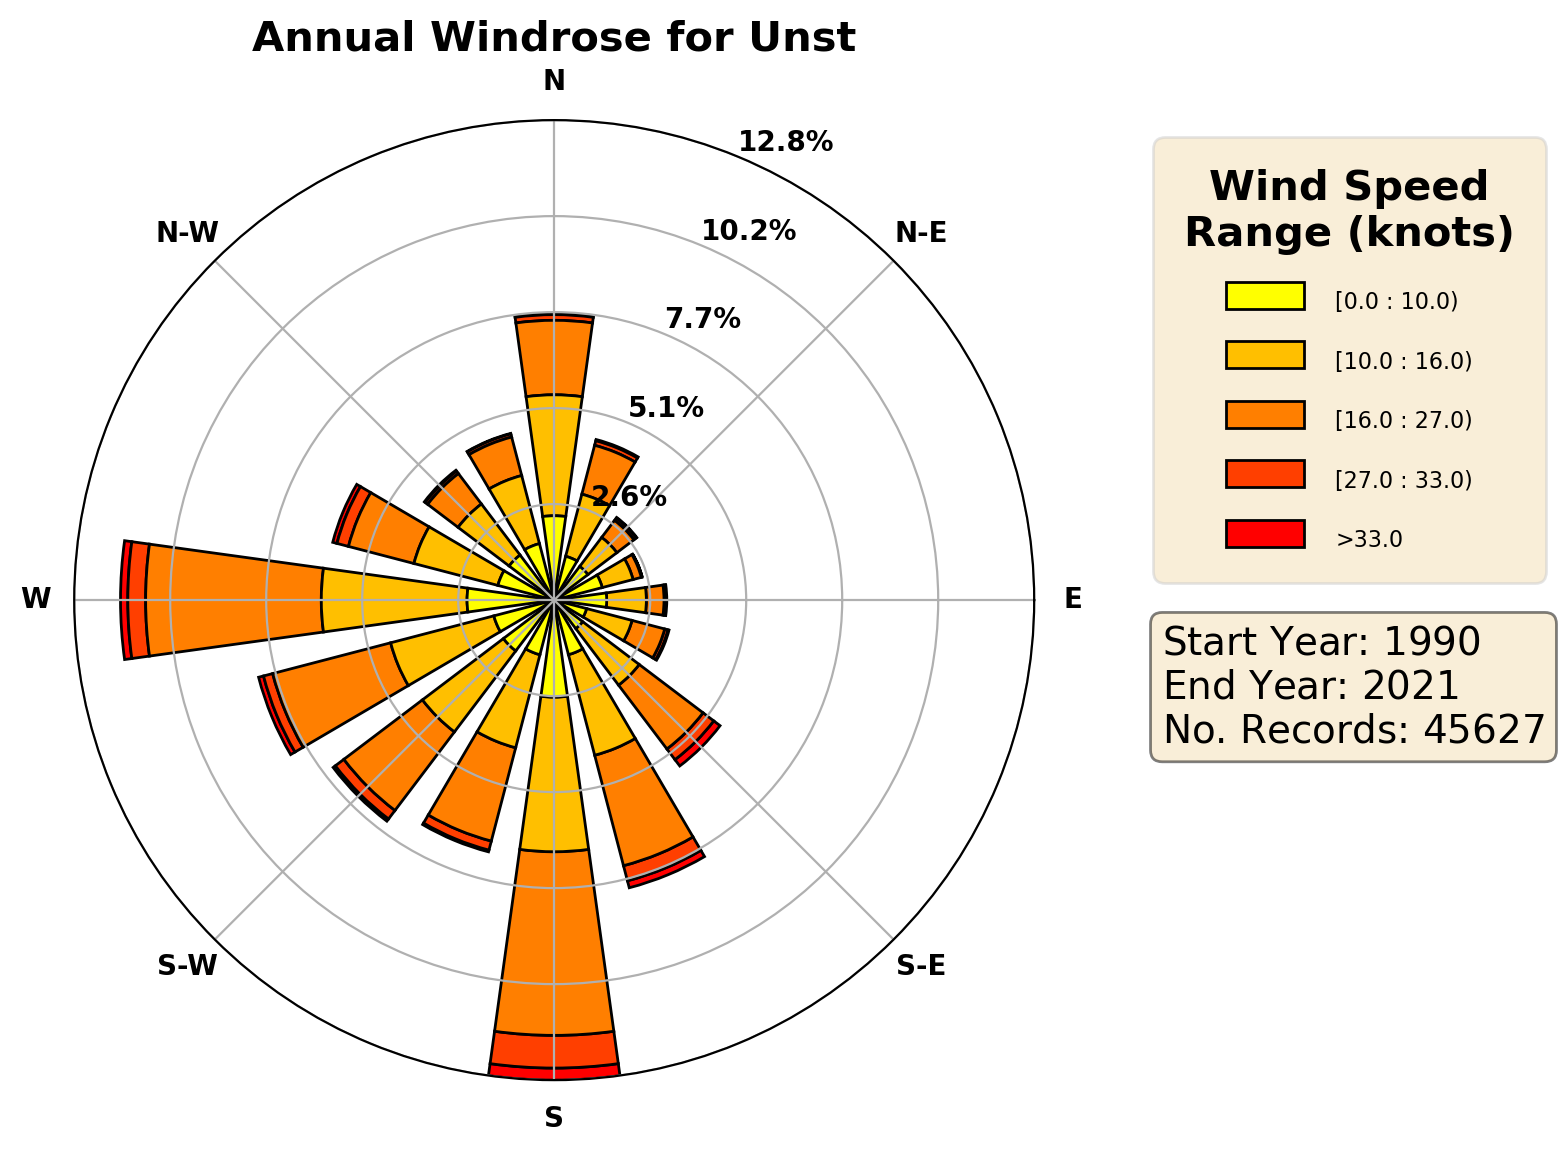
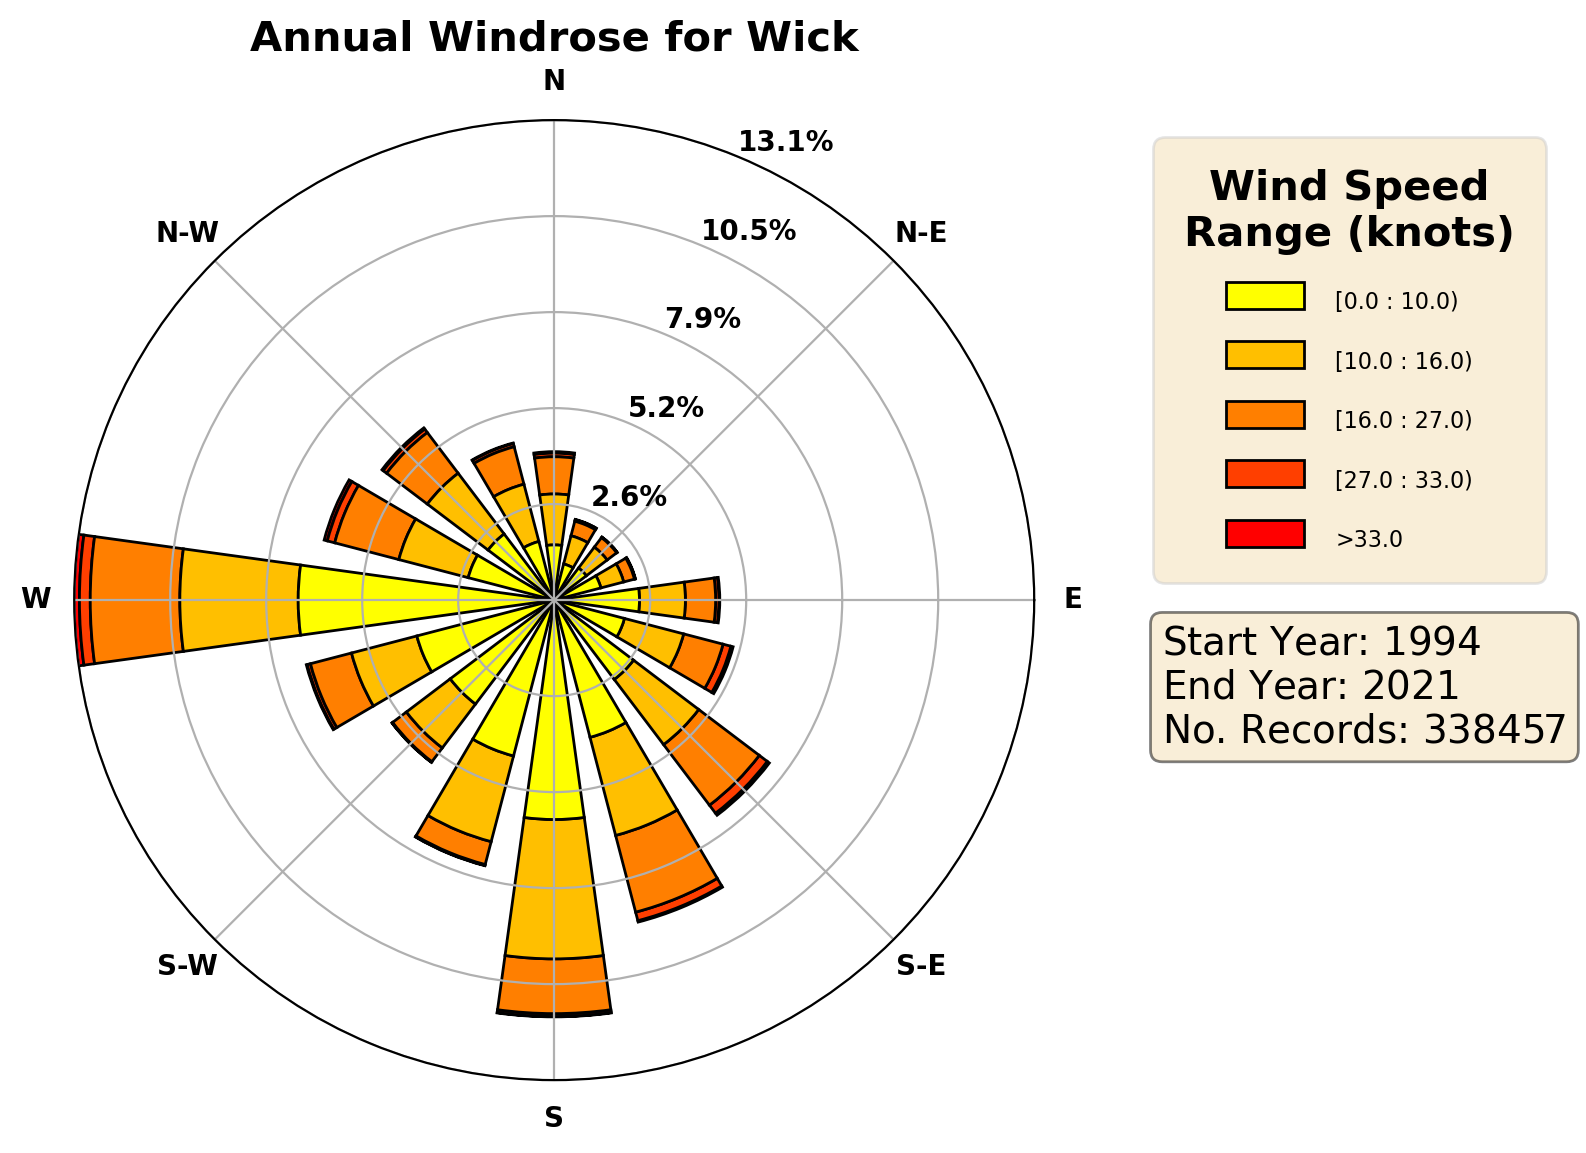
Wind Rose
This plot provides a summary of wind patterns over the full 360-degree range of possible wind directions. Each segment represents a directional bin, showing how frequently the wind blows from that direction. The length of the segment indicates the relative frequency, while the colours within each segment reflects the typical wind speeds associated with that direction. This allows for simultaneous interpretation of both prevailing wind directions and their associated wind speeds.
Available Airfields Map
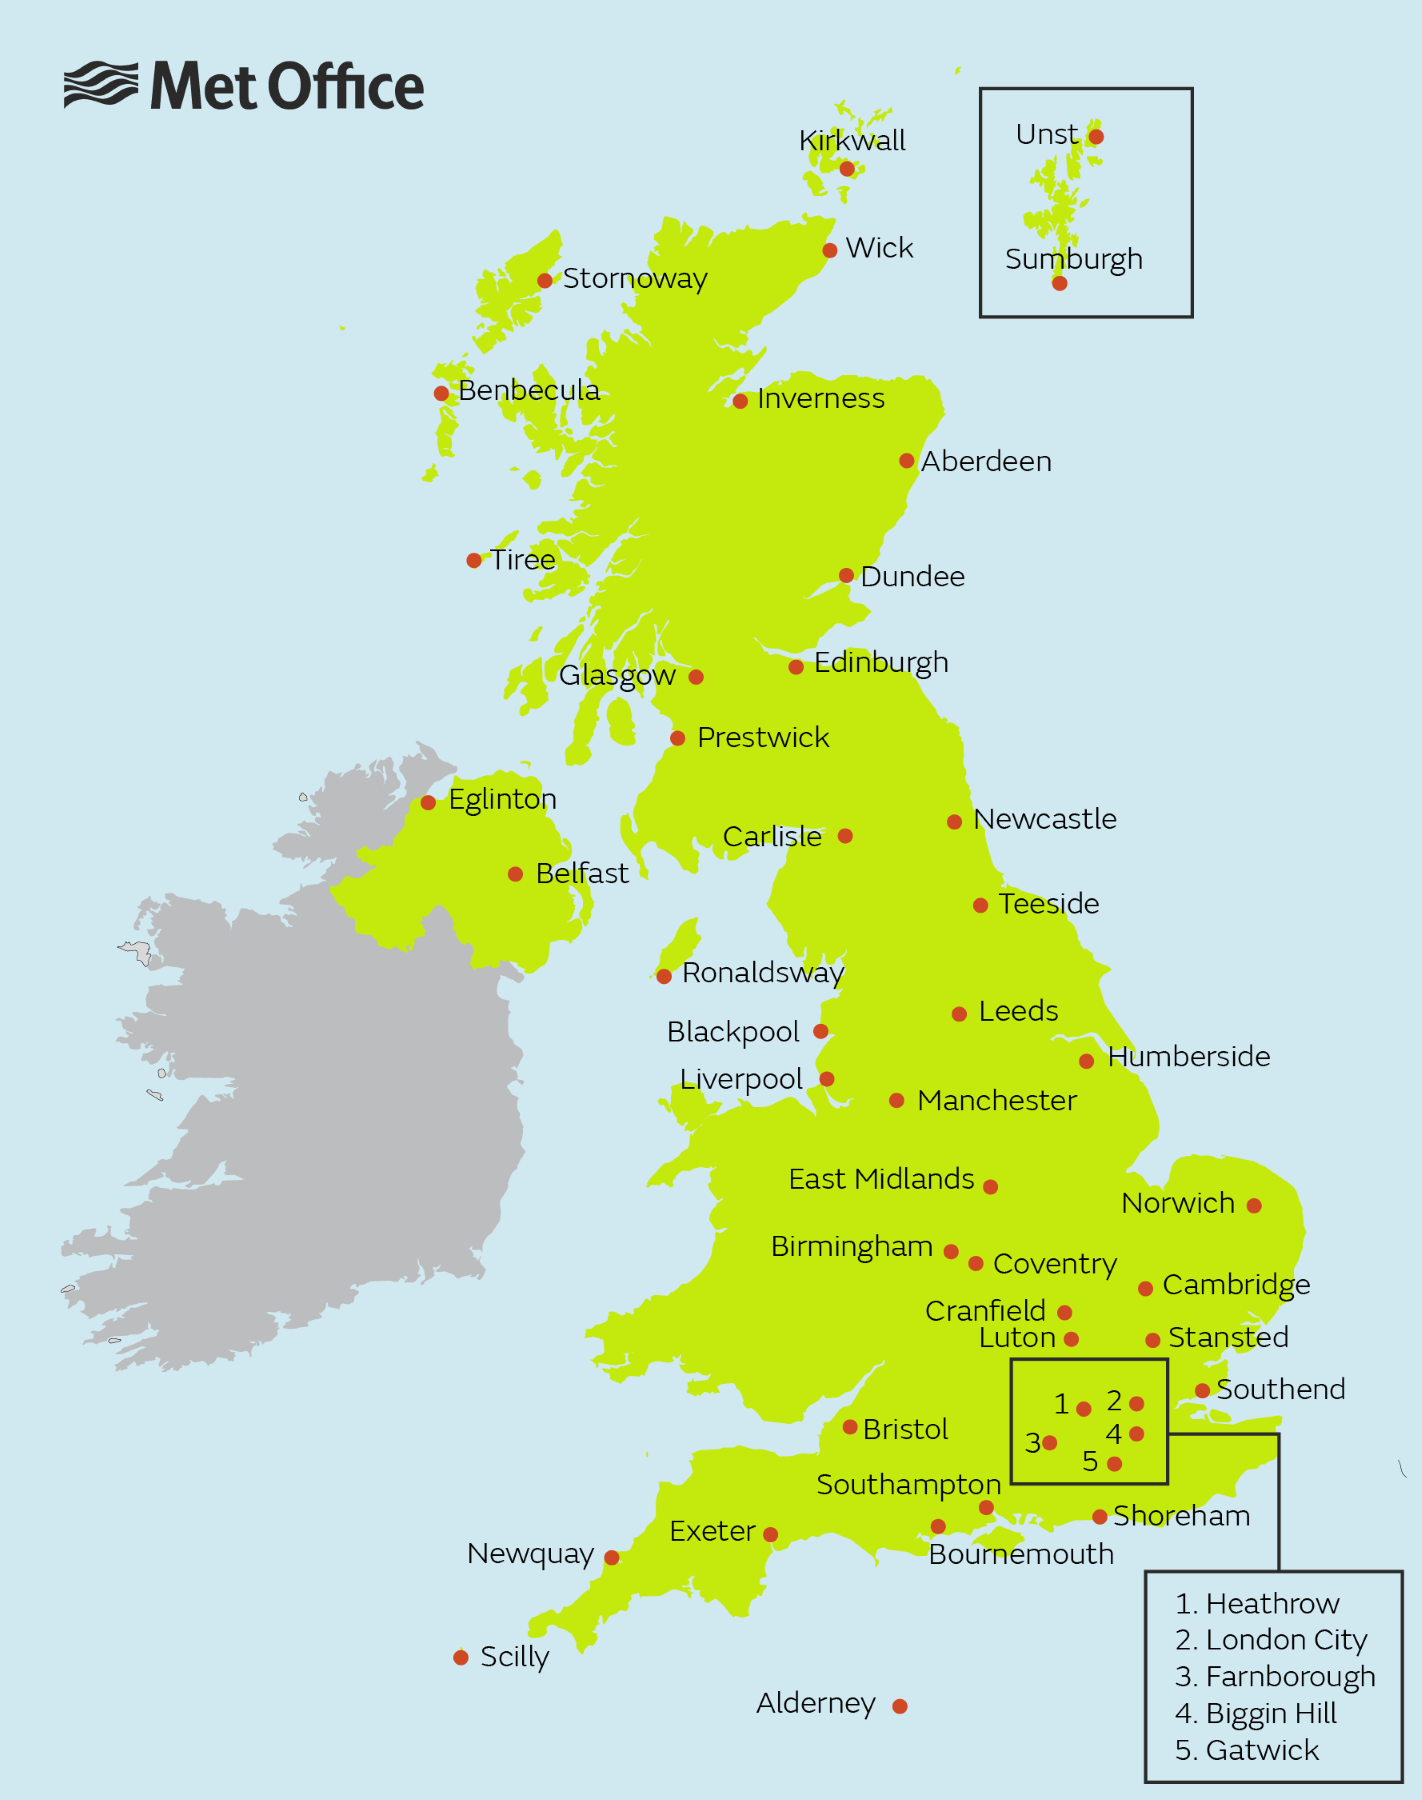
List of airports
Click on any airport to see its airfield climate statistics.
- Aberdeen
- Aldergrove (Belfast International)
- Alderney
- Belfast City
- Benbecula
- Biggin Hill
- Birmingham
- Blackpool
- Bournemouth
- Bristol
- Cambridge
- Carlisle
- Coventry
- Cranfield
- Dundee
- Durham Tees Valley (Teeside)
- East Midlands
- Edinburgh
- Eglinton (City of Derry)
- Exeter
- Farnborough
- Gatwick
- Glasgow
- Gloucester
- Heathrow
- Humberside
- Inverness
- Isles of Scilly (St Mary's)
- Kirkwall
- Leeds Bradford
- Liverpool
- London City
- Luton
- Manchester
- Newcastle
- Newquay
- Norwich
- Prestwick
- Ronaldsway (Isle of Man)
- Shoreham (Brighton City)
- Southampton
- Southend
- Stansted
- Stornoway
- Sumburgh
- Tiree
- Unst
- Wick
 |
 |
|---|---|
 |
 |
 |
 |
 |
 |
|---|---|
 |
 |
 |
 |
 |
 |
|---|---|
 |
 |
 |
 |
 |
 |
|---|---|
 |
 |
 |
 |
 |
 |
|---|---|
 |
 |
 |
 |
 |
 |
|---|---|
 |
 |
 |
 |
 |
 |
|---|---|
 |
 |
 |
 |
 |
 |
|---|---|
 |
 |
 |
 |
 |
 |
|---|---|
 |
 |
 |
 |
 |
 |
|---|---|
 |
 |
 |
 |
 |
 |
|---|---|
 |
 |
 |
 |
 |
 |
|---|---|
 |
 |
 |
 |
 |
 |
|---|---|
 |
 |
 |
 |
 |
 |
|---|---|
 |
 |
 |
 |
 |
 |
|---|---|
 |
 |
 |
 |
 |
 |
|---|---|
 |
 |
 |
 |
 |
 |
|---|---|
 |
 |
 |
 |
 |
 |
|---|---|
 |
 |
 |
 |
 |
 |
|---|---|
 |
 |
 |
 |
 |
 |
|---|---|
 |
 |
 |
 |
 |
 |
|---|---|
 |
 |
 |
 |
 |
 |
|---|---|
 |
 |
 |
 |
 |
 |
|---|---|
 |
 |
 |
 |
 |
 |
|---|---|
 |
 |
 |
 |
 |
 |
|---|---|
 |
 |
 |
 |
 |
 |
|---|---|
 |
 |
 |
 |
 |
 |
|---|---|
 |
 |
 |
 |
 |
 |
|---|---|
 |
 |
 |
 |
 |
 |
|---|---|
 |
 |
 |
 |
 |
 |
|---|---|
 |
 |
 |
 |
 |
 |
|---|---|
 |
 |
 |
 |
 |
 |
|---|---|
 |
 |
 |
 |
 |
 |
|---|---|
 |
 |
 |
 |
 |
 |
|---|---|
 |
 |
 |
 |
 |
 |
|---|---|
 |
 |
 |
 |
 |
 |
|---|---|
 |
 |
 |
 |
 |
 |
|---|---|
 |
 |
 |
 |
 |
 |
|---|---|
 |
 |
 |
 |
 |
 |
|---|---|
 |
 |
 |
 |
 |
 |
|---|---|
 |
 |
 |
 |
 |
 |
|---|---|
 |
 |
 |
 |
 |
 |
|---|---|
 |
 |
 |
 |
 |
 |
|---|---|
 |
 |
 |
 |
 |
 |
|---|---|
 |
 |
 |
 |
 |
 |
|---|---|
 |
 |
 |
 |
 |
 |
|---|---|
 |
 |
 |
 |
 |
 |
|---|---|
 |
 |
 |
 |
 |
 |
|---|---|
 |
 |
 |
 |
For more information and learning on Climate change and Climate services, visit Met Office - Science and services