
Briefing on Arctic and Antarctic sea ice - August 2021
Alex West and Ed Blockley
Summary
- Arctic sea ice extent on 11th August was the 10th lowest on record for the time of year.
- Extent remained very low in the seas north of Siberia, but was near-normal in the seas north of Canada and Alaska.
- July Arctic sea ice extent was the joint-2nd lowest on record, following very fast ice loss early in the month associated with heatwaves in East Siberia in late June and early July.
- Arctic temperatures during July were near-normal everywhere except in a region reaching from the Greenland Sea to the North Pole.
- Predictions submitted to the Sea Ice Prediction Network, and basic statistical analysis, suggest the 2021 September minimum will most likely be between 3rd and 12th lowest on record.
- Antarctic sea ice extent on 11th August was higher than the long-term average, the 9th highest on record for the date.
Current Arctic sea ice extent
Arctic sea ice extent on 11th August 2021 was 5.95 million sq km (Figure 1), 1.46 million sq km below the 1981-2010 average. This was the 10th lowest extent recorded for this time of year in the era of satellite observations (since 1979), the lowest having been 5.02 million sq km, recorded in 2012.
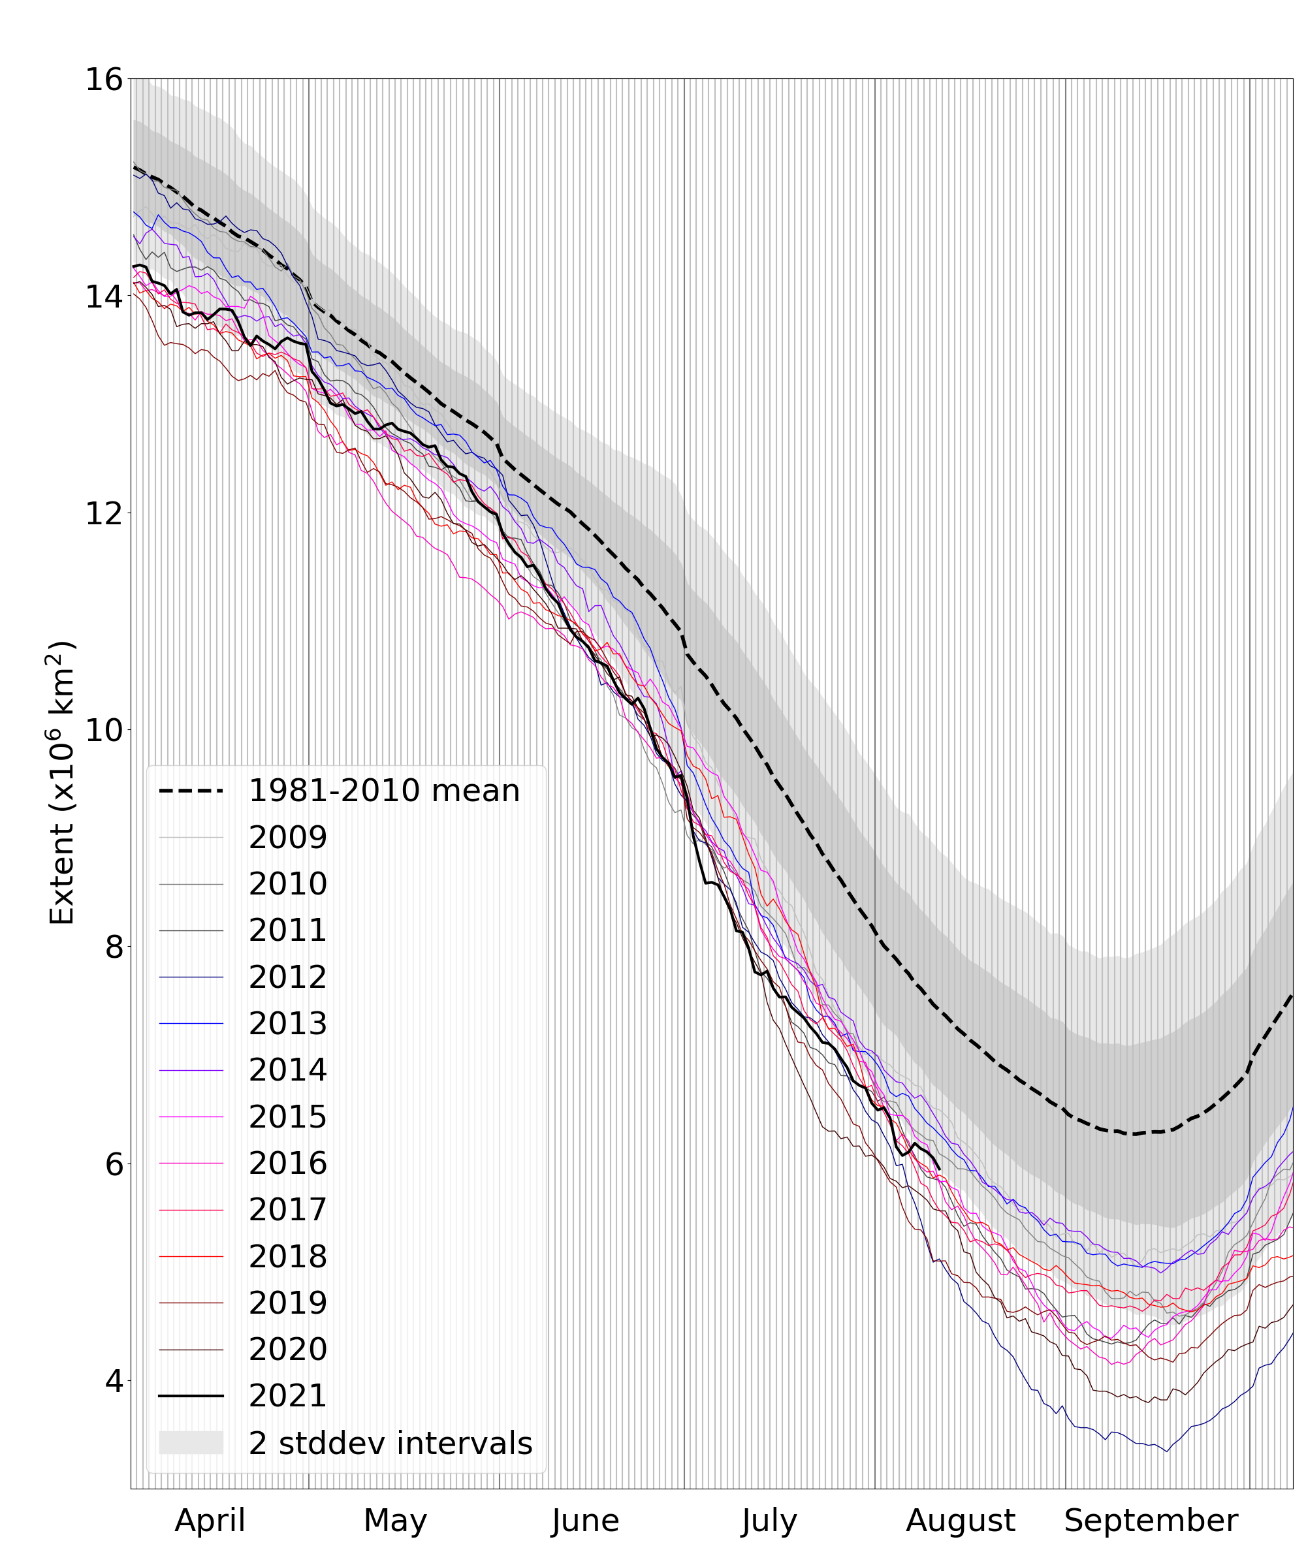
Figure 1. Daily Arctic sea ice extent for 2021, compared with recent years and the 1981-2010 average with ± 1 and 2 standard deviation intervals indicated by the shaded areas. Data are from the National Snow and Ice Data Center (NSIDC).
Extent was well below average in all seas north of Siberia (Kara, Laptev and East Siberian Seas) and also in the Greenland Sea, but was nearer average in the Beaufort and Chukchi Seas north of Alaska and Canada (Figure 2).
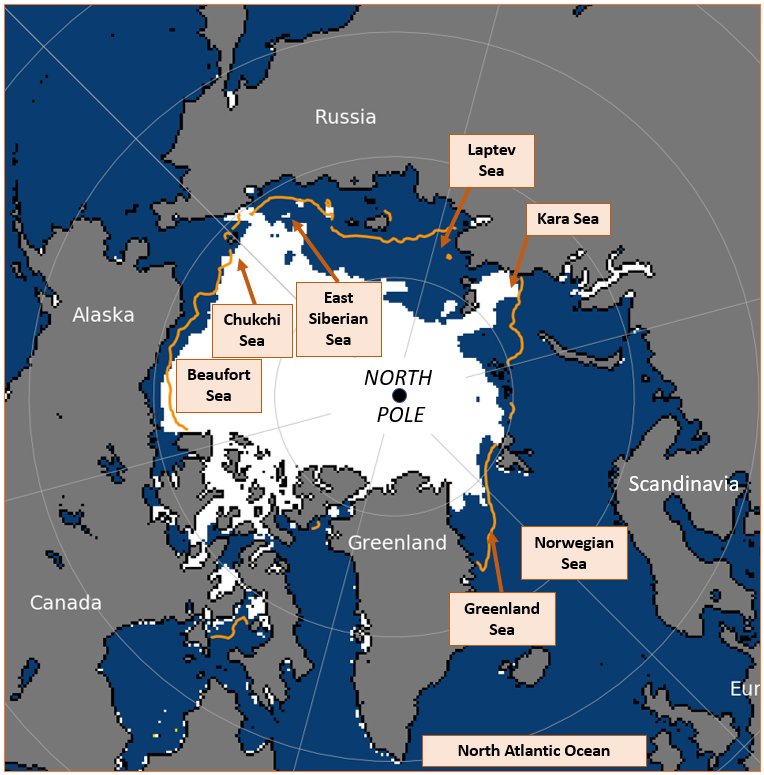
Figure 2. Arctic sea ice extent on 11th August 2021, with 1981-2010 average extent indicated in orange, and the regions referred to in the text labelled. Underlying map and data courtesy of NSIDC.
July 2021 in context
The average sea ice extent for July 2021 was 7.49 million sq km according to the HadISST1.2 dataset (Figure 3; Rayner et al., 2003). This was 1.99 million sq km below the 1981-2010 average and 0.07 million sq km below the long-term linear trend. It was the joint-2nd lowest July extent on record, the lowest having been 7.03 million sq km in 2020.
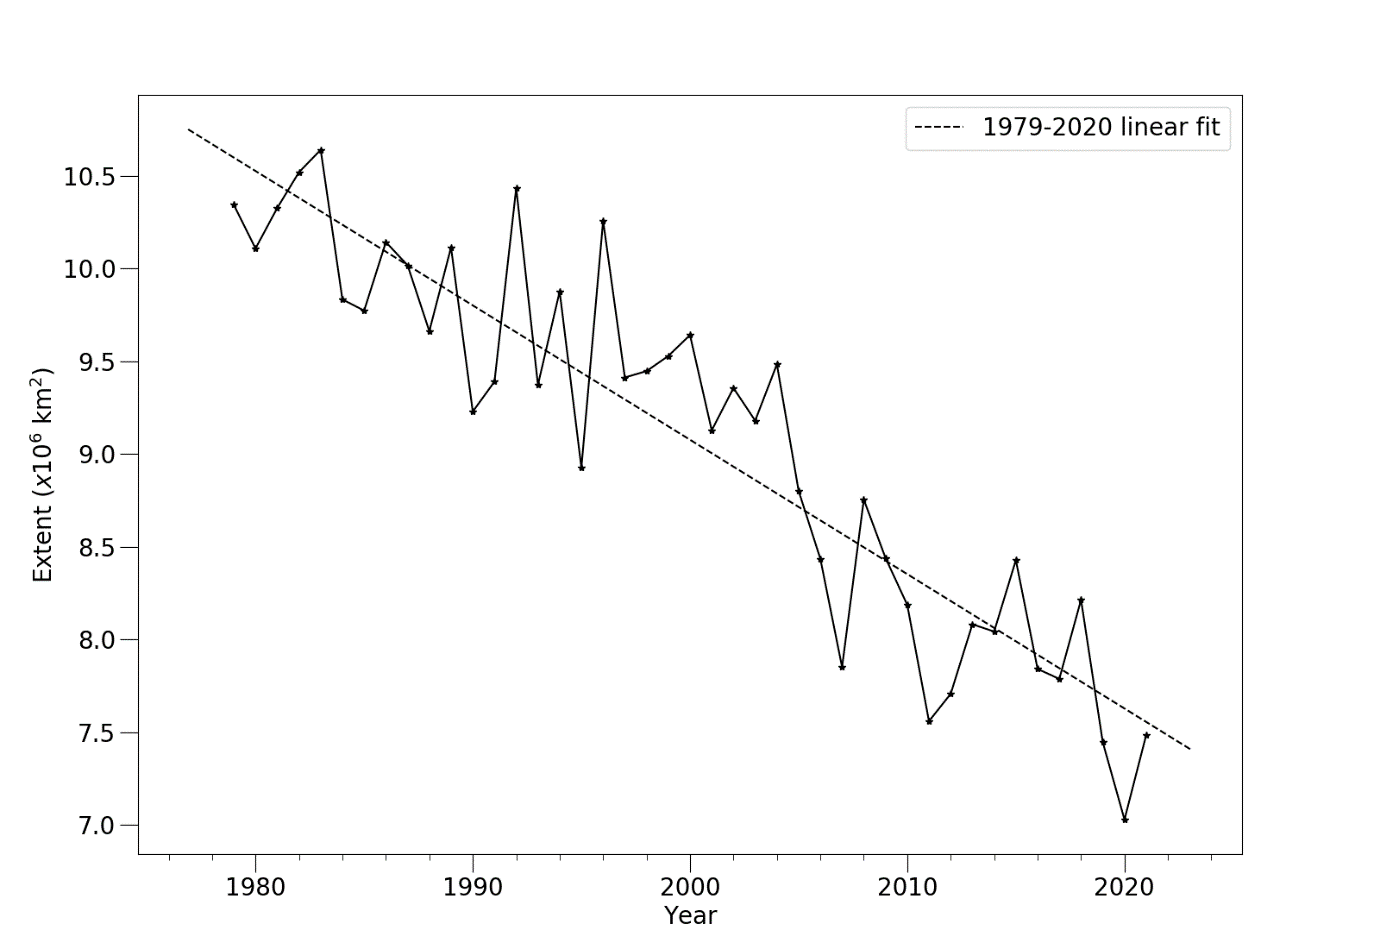
Figure 3. Average July Arctic sea ice extent according to the Hadley Centre Sea Ice and Sea Surface Temperature (HadISST) 1.2 dataset (Rayner et al., 2003).
The average rate of sea ice loss during July 2021 was 95,000 sq km per day. This was faster than the 1981-2010 average of 86,000 sq km per day, and was the 12th fastest rate of ice loss for July observed in the satellite era. Ice loss was much faster during the first half of the month at 128,000 sq km per day. This followed repeated outbreaks of warm air over the Siberian seas in late June and early July. During the second half of the month ice loss was comparatively slow at 66,000 sq km per day.
Unusually for recent summer months, July 2021 was not notably warm over the Arctic Ocean, with most regions experiencing near-average temperatures (Figure 4a). However, this conceals much variation within the month. Incursions of warm air in the Siberian seas occurred at the beginning and end of the month, but the middle of the month here was dominated by cold, stormy weather. The only region where warm conditions dominated was an area reaching north from the Greenland Sea to the North Pole. This was likely associated with a north-shifted jet stream over the Atlantic Ocean, with high pressure over Scandinavia and the Norwegian Sea driving warm south-westerly winds over the Greenland Sea towards the Arctic Ocean (Figure 4b).
During the first 10 days of August, warm, settled conditions have continued to dominate over the Siberian seas. Colder, stormier weather has predominated in the Atlantic sector, the Central Arctic, and the Beaufort and Chukchi Seas.
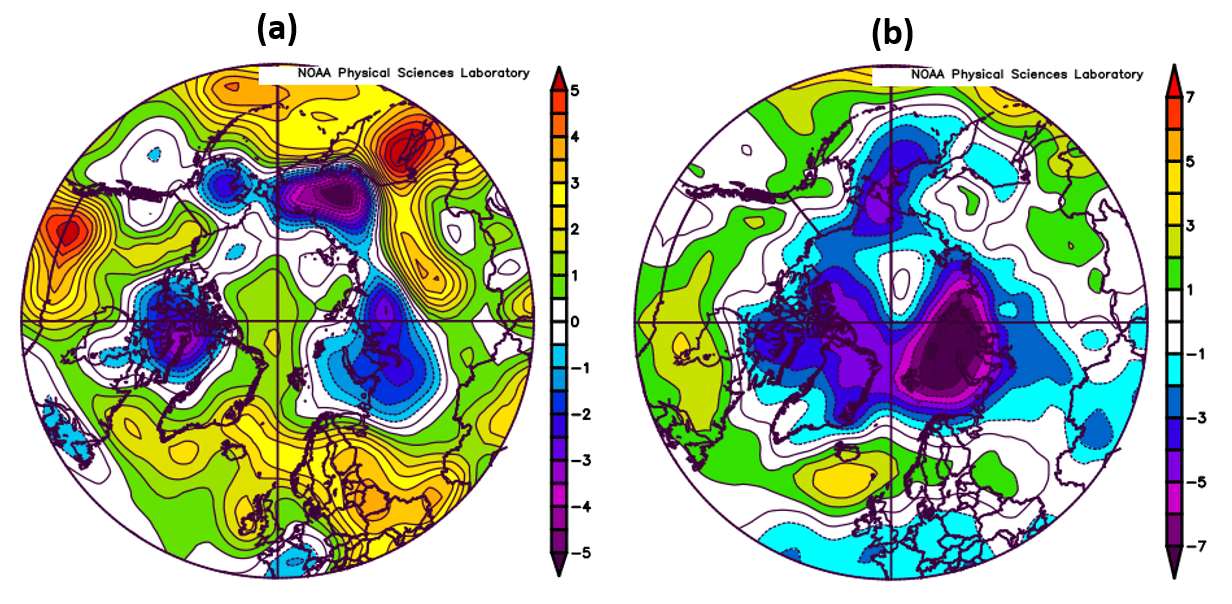
Figure 4. (a) Air temperature anomaly (°C) at 925 hPa; (b) mean sea level pressure anomaly (hPa), for July 2021. Anomalies are relative to the 1981-2010 average. Data are from the NCEP reanalysis (Kalnay et al., 1996).
Outlook for September
Present indications are that this year will see another notably low September sea ice extent, among the 15 lowest on record. At this stage, it appears unlikely that a new record low September extent will be observed, and an extent between 3rd and 12th lowest is most likely.
Each year the Sea Ice Prediction Network (SIPN) compiles predictions of September Arctic sea ice extent from scientific centres around the world in a series of three reports published in June, July and August (known as the Sea Ice Outlook, SIO). The July report comprises 38 predictions of 2021 September extent ranging from 3.83 to 5.17 million sq km (equivalent to 2nd and 12th lowest respectively), with a median estimate of 4.36 million sq km and an interquartile range of 4.09 to 4.52 million sq km (Figure 5, purple box-plot). None of the SIO predictions would represent a new record low extent.
To complement the SIO estimates, three predictions of September sea ice extent are made using basic statistical methods (also shown on Figure 5):
- A prediction based on extrapolating the long-term linear trend gives a predicted September sea ice extent of 4.15 ± 1.05 million sq km, indicated in black on Figure 5.
- There is a good correlation between mean September ice extent and the extent for 28th July – 11th August (the most recent 15 days of data available at the time of writing). Applying simple statistical methods to the anomalies for these dates gives a prediction of September mean extent of 4.54 ± 0.53 million sq km, indicated in blue on Figure 5. This encompasses ice extents that would range from 3rd to 12th lowest.
- Finally, applying the trajectories of melting observed over August and September of each year in the 1979-2020 satellite record to the current Arctic sea ice extent provides an estimate of the September sea ice extents that remain likely this year, ranging from 4.33 to 5.44 million sq km (Figure 5, red box-plot). A sea ice extent of 4.33 million sq km would represent the 5th lowest September extent on record (after 2012, 2020, 2007 and 2019), whilst 5.44 million sq km would represent the 15th lowest. When only the most recent 15 years are used, a period when late summer ice loss tended to be faster, the highest possible September extent is 5.15 million sq km, representing the 12th lowest.
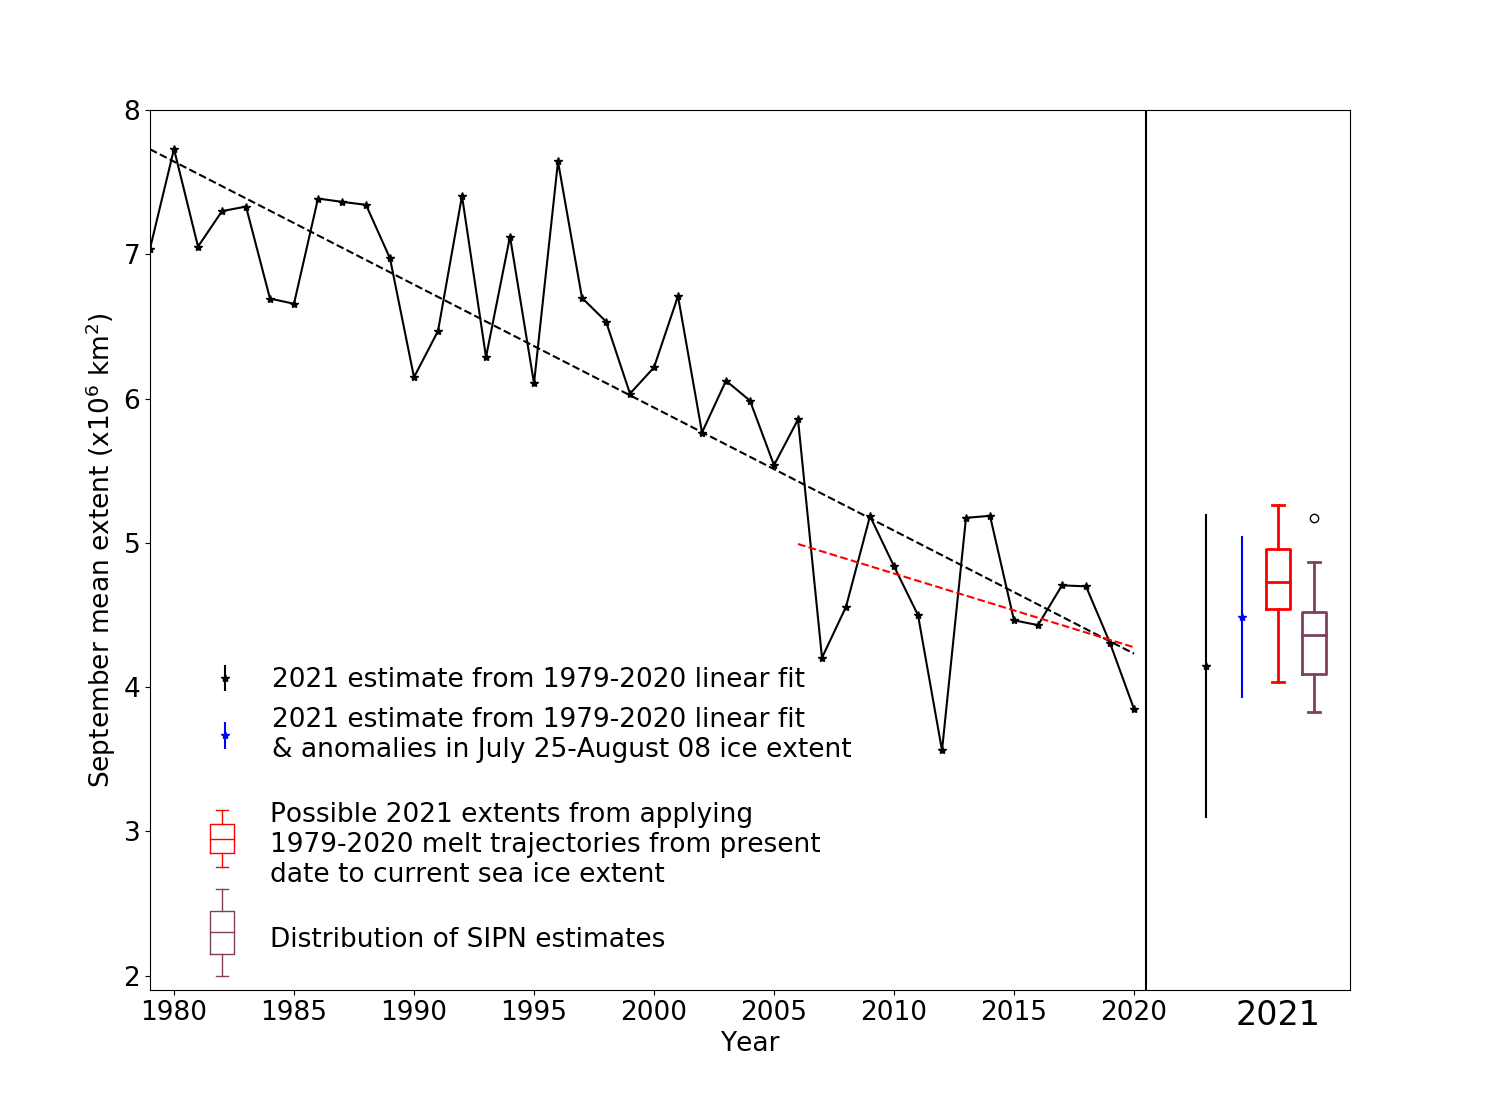
Figure 5. September median Arctic sea ice extent since satellite records began in 1979 from the HadISST1.2 dataset (Rayner et al., 2003), with SIPN Sea Ice Outlook and statistical predictions for September 2021. For the statistical predictions derived from linear fit, error bars represent twice the standard deviation of September mean ice extent about the trend lines with respect to which the estimates are taken. The range of predictions derived from past melting trajectories is shown as a (red) boxplot indicating range, median and quartiles of estimates derived from each trajectory in the 1979-2020 period. The Sea Ice Outlook is shown as a (purple) boxplot indicating range, median and quartiles of the 38 predictions submitted.
Current Antarctic sea ice extent
Antarctic sea ice extent on 11th August 2021 was 17.84 million sq km (Figure 6). This was 0.28 million sq km above the 1981-2010 average, and the 9th highest extent recorded for this date in the satellite era (the highest was 18.82 million sq km, recorded in 2014). Extent was well above average throughout the Indian Ocean sector of the Southern Ocean, as well as in most of the Bellingshausen Sea and the eastern Ross Sea. However, extent was slightly below average in the western Ross Sea and in the Weddell Sea, as well as the area directly north of the Antarctic Peninsula (Figure 7).
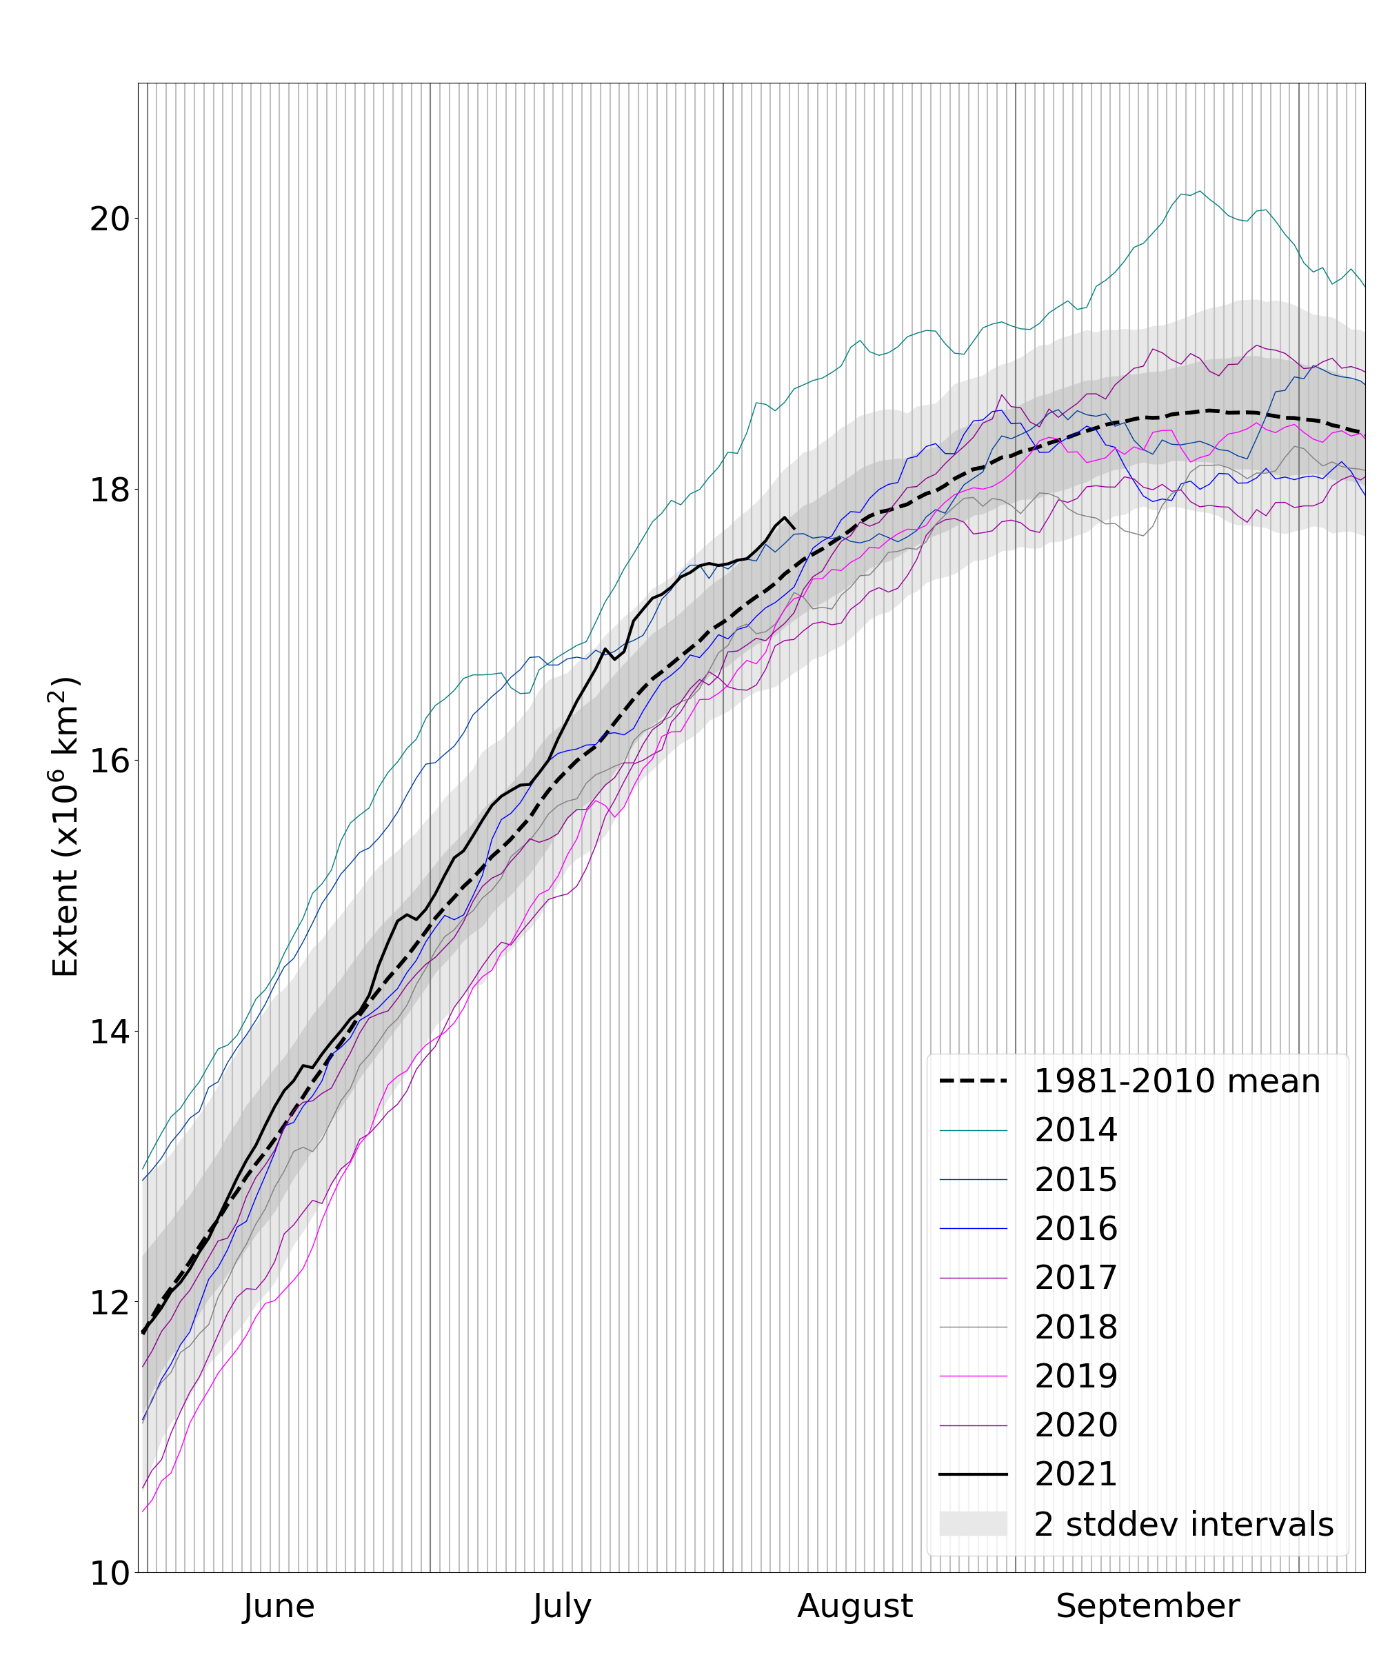
Figure 6. Daily Antarctic sea ice extent for 2021, compared with recent years and the 1981-2010 average, with ± 1 and 2 standard deviation intervals indicated by the shaded areas. Data are from NSIDC.
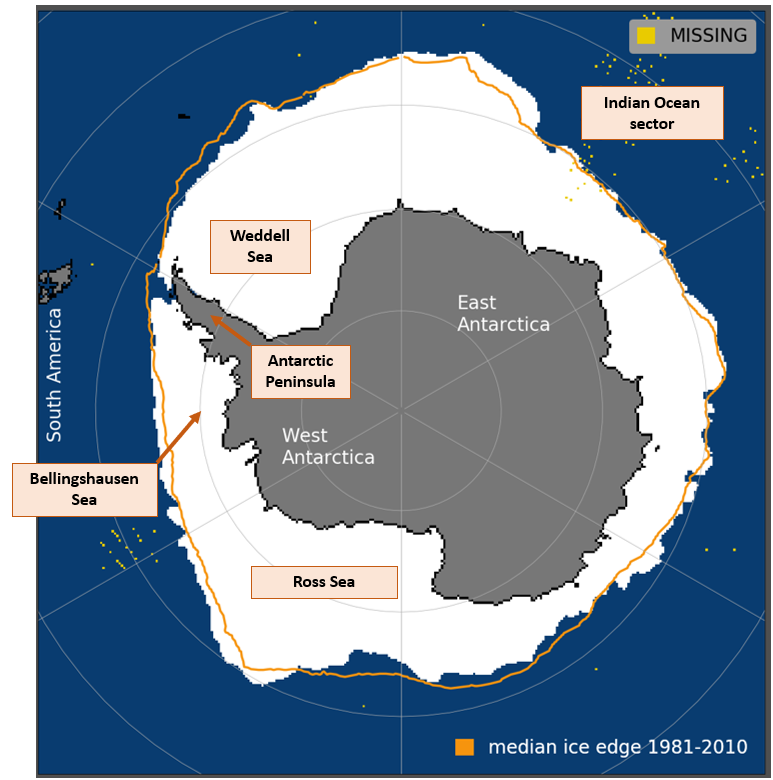
Figure 7. Antarctic sea ice extent on 11th August 2021, with 1981-2010 average extent indicated in orange, and regions referred to in the text labelled. Underlying map and data courtesy of NSIDC.
References
Kalnay, E., and Coauthors (1996) The NCEP/NCAR 40-Year Reanalysis Project. Bull. Amer. Meteor. Soc., 77, 437–472, https://doi.org/10.1175/1520-0477(1996)077<0437:TNYRP>2.0.CO;2
Rayner, N.A., Parker, D.E., Horton, E.B., Folland, C.K., Alexander, L.V., Rowell, D.P., Kent, E.C. and Kaplan, A. (2003) Global analyses of sea surface temperature, sea ice, and night marine air temperature since the late nineteenth century. J. Geophys. Res., 108, D14, 4407, https://doi.org/10.1029/2002JD002670