
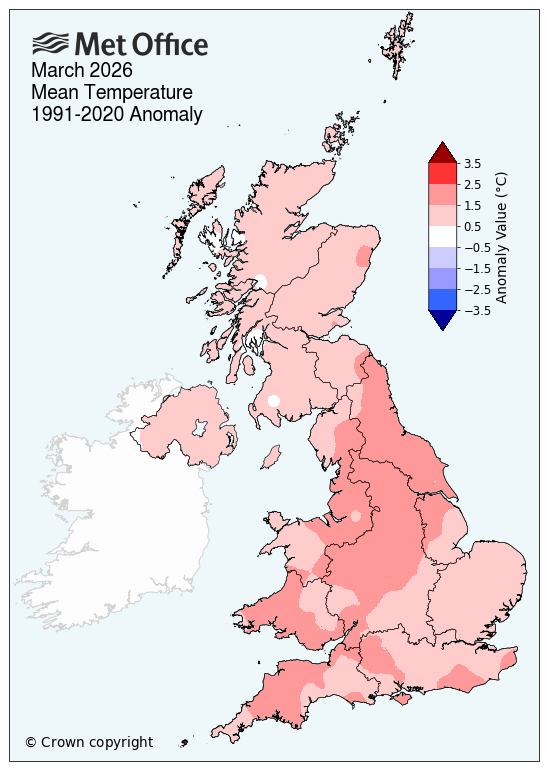
UK sees joint tenth warmest March on record, as Wales ranks joint fourth and England joint sixth
The final day of March 2026 reached 20.9°C in Pershore, Worcestershire – the joint warmest day of the year so far – capping off a warm and sunny start to spring for much of the UK.
According to provisional Met Office statistics, the UK experienced its joint tenth warmest March in a series dating back to 1884. With a mean temperature of 7.0°C, March 2026 is tied with March 2025 as the joint tenth warmest on record. The warmest March for the UK remains 1938.
Wales saw its joint fourth warmest and England its joint sixth warmest March – with both nations experiencing their warmest March since 2017.
Across the UK and individually, in all four nations, March was warmer than the long-term meteorological average, although there were a few short cooler spells early in the month and towards the end of the month.
At county level, several counties recorded one of their top five warmest Marches on record, including South Glamorgan its second and East Sussex its third.
READ MORE: Fool’s spring: why warm spells can be misleading
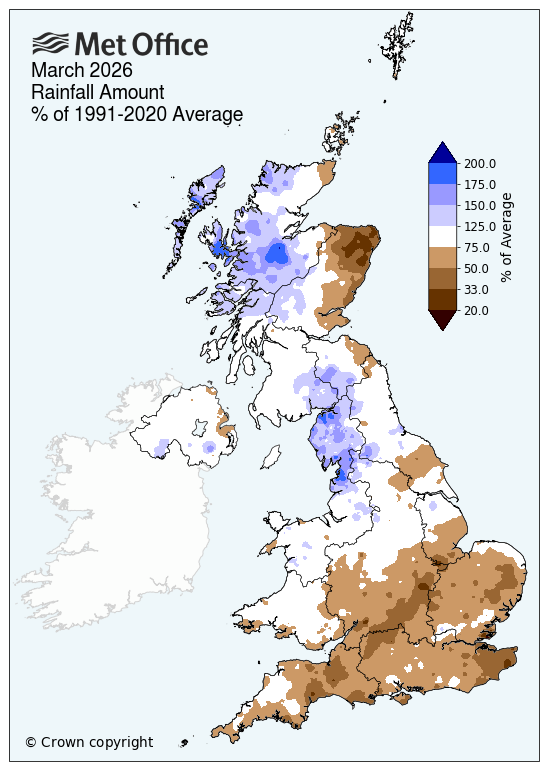
Average rainfall, with regional variations
UK rainfall concludes just above the long-term average (102%) for March. This continues a notable run of wetter-than-average months, with March becoming the fifth consecutive month since November in which UK rainfall has been above average.
As is often the case, rainfall showed considerable regional variation. England was generally the driest of the UK nations, seeing 17% less than its March average. Within this however, there was a pronounced north–south split, with northern England seeing 14% above average and southern England 37% below.
Northern Ireland and Wales saw less rainfall than average, whilst Scotland saw particularly wet conditions (19% above average). This was especially seen across northern parts of the country, where several significant spells of rainfall contributed to rainfall 36% above average.
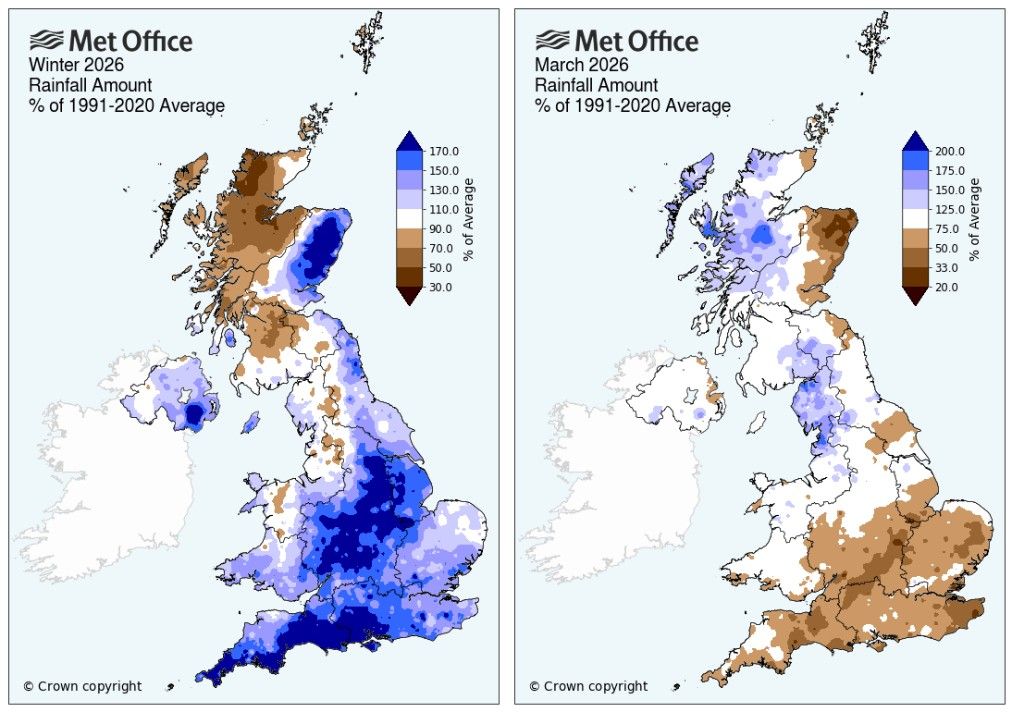
A reversal in rainfall patterns since winter
Comparing the March rainfall map with that of the winter just passed reveals a clear reversal in where rainfall fell. During winter, northwestern Scotland was much drier than average, while many other areas – particularly eastern Scotland, southeast and southwest England, and eastern parts of Northern Ireland – were much wetter than average. By contrast, the March map shows an almost opposite pattern, with areas that were dry over winter seeing wetter conditions, and vice versa. This shows the strong month-to-month variability in UK rainfall patterns.
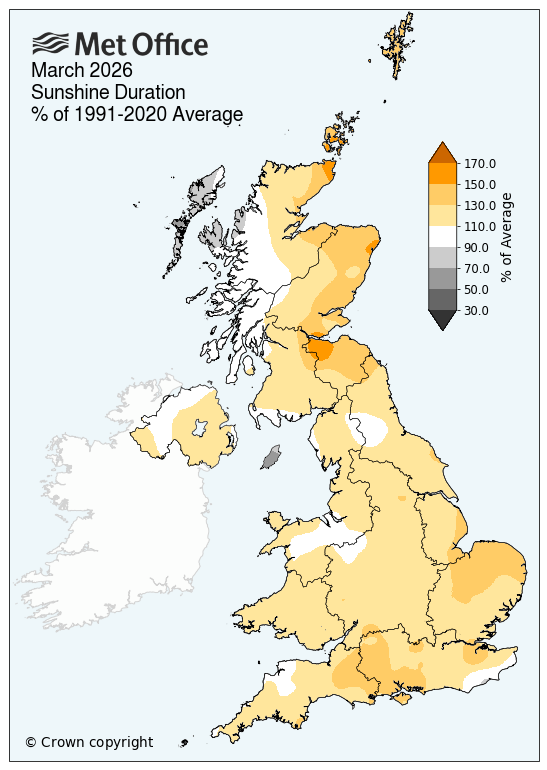
Plenty of spring sunshine
The UK and all four nations recorded above-average sunshine for March, helping to reinforce the early spring feel to the month. Eastern parts of Scotland stood out in particular, with sunshine levels around 34% above average, making it the sixth sunniest March since 1910, and notably brighter than other parts of Scotland.
Commenting on the provisional figures, Met Office Scientist, Dr Emily Carlisle, said: “March has delivered some notably warm weather for England and Wales in particular, alongside plenty of sunshine and near-average rainfall overall. While those milder conditions will have stood out for many, the month has still delivered a mix of weather across the UK, including more unsettled spells and even snow for some. This variability is entirely typical for March, a month of transition when lingering winter influences can sit alongside the increasing warmth of spring.”
READ MORE: Easter weather extremes: the records behind a famously changeable weekend
READ MORE: Wet and windy with warnings for Easter weekend
Where does the monthly data come from?
The Met Office’s monthly climate statistics use HadUK‑Grid data to work out county, regional and UK‑wide averages. The dataset takes weather observations from across the country and interpolates them across the UK onto a 1km x 1km grid, covering every part of the UK. Some of these records stretch all the way back to 1836, meaning almost 200 years of weather data.
READ MORE:How do we know when weather records are broken?
READ MORE:What is HadUK-Grid?
|
Provisional March 2026 stats |
Mean temp (°C) |
Rainfall (mm/%) |
Sunshine (hours/ %) |
|||
|
Actual |
91/20 anom |
Actual |
91/20 anom |
Actual |
91/20 anom |
|
|
UK |
7.0 | 1.3 | 86.6 | 102 | 132.3 | 121 |
|
England |
7.9 | 1.5 | 48.5 | 83 | 143.5 | 123 |
|
Wales |
7.5 | 1.5 | 95.1 | 92 | 129.1 | 118 |
|
Scotland |
5.4 | 1.0 | 148.6 | 119 | 117.8 | 121 |
|
Northern Ireland |
6.8 | 0.9 | 81.9 | 94 | 115.2 | 114 |