Dashboard highlights urgency of climate action
Author: Grahame Madge
00:01 (UTC) on Fri 5 Nov 2021
A Met Office Hadley Centre dashboard monitoring key indicators of global climate is providing an authoritative way to stay up to date with the current state of the climate.
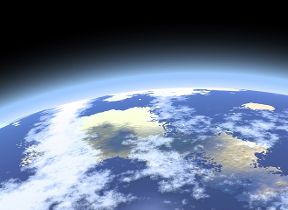
The Climate Dashboard – compiled by Met Office scientists – will help decision makers, including those at COP 26, to view how indicators of climate change, such as global temperature, ocean heat content, sea level rise, sea ice extent and atmospheric greenhouse gas concentrations are shifting.
The Met Office’s Nick Rayner leads the project team. She said: “Bringing together key climate data into a clear and concise dashboard helps increase understanding of our dramatically changing climate. In future visitors to the dashboard should be able to see the outcomes of increasing mitigation efforts reflected in the fastest-responding indicators.”
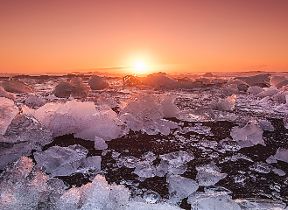
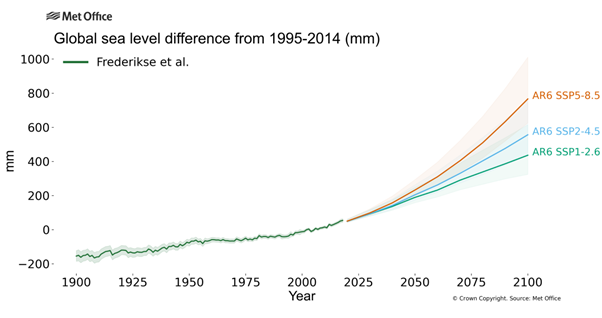
Sea level rise is a key indicator covered by the dashboard. Nick Rayner added: “Observations from coastal tide gauges show sea levels rose by nearly 200mm between 1900 and 2000. However, by building in projections of sea level rise linked to different scenarios for future greenhouse gas emissions, you can easily see what we are already committed to and the need for urgent action to minimise further changes.”
Dr Helene Hewitt is an expert on sea level rise with the Met Office. She said: “Without strong action to tackle climate change we could see global sea levels rise by a metre by 2100, depending on the greenhouse gas emission scenario: that could be up to five times the rate or more in the next 100 years, compared with the previous century.
“Even with aggressive action to cut greenhouse gas emissions, global sea levels will continue to rise.”
A section of the dashboard looking at global weather extremes up to 2018 shows how extreme weather is changing its character with warm nights becoming more frequent, daily rainfall more intense, and warm spells lasting longer.
- The number of warm days averaged over the globe has increased by around 20 per year in the most recent decade when compared to the 1970s, and the number of days in warm spells increased by around 10 days.
- The number of cool nights has decreased by around 20 per year when compared to the 1970s, while the global average number of warm nights has increased by around 30 nights since the middle of the 20th century.
- Coldest nights have become 4°C less cold than the beginning of the century and the warmest nights have become more than 0.5 °C warmer over the same period.
- The increase in the total annual precipitation is over 50mm since the beginning of the 20th century.
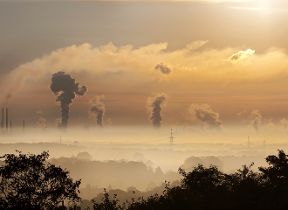
It is through extreme weather, such as heatwaves and heavy rainfall, that we experience the impacts of climate change, presenting the greatest shocks to our wellbeing, key infrastructure, the economy and our environment.
The global climate dashboard is the result of a number of continuing projects to present clearly and simply how climate change is affecting the planet and its inhabitants.
Along with the Met Office Hadley Centre global dashboards, the Met Office has been working with the Office for National Statistics and other agencies across government to develop a UK climate change portal and dashboard which brings together weather and climate monitoring for the UK with other key data.
This dashboard (which includes key metrics from the Met Office State of the UK Climate report) shows that changes in UK climate have been broadly consistent with those seen globally with:
- The most recent decade some 1.1 °C warmer than the 1961 to 90 long term average. All of the top 10 warmest years since 1884 have occurred this century with all of the top 10 coldest years occurring before the 21st century.
- The decade from 2011 to 2020 on average 9% wetter than 1961 to 1990. Over the same period UK winters were 19% wetter and UK summers 17% wetter.
Bringing together key climate data with wider information into a clear dashboard will help increase understanding of our changing climate, emissions, drivers for change and climate impacts along with measures of mitigation such as increases in energy efficiency and increases in the proportion of energy coming from renewable sources and the adaptation steps being taken such as reductions in water leakage from infrastructure.
Only by increasing our action to limit further global temperature rises can we limit the impacts of changing extremes in our weather and help protect ourselves and the most vulnerable in the world.