UK and Global extreme events – Heatwaves
Determining the likelihood and severity of extreme events for the past, present and future.
The latest report from the Intergovernmental Panel on Climate Change states that “it is unequivocal that human influence has warmed the atmosphere, ocean and land.”
We have already seen average global land temperatures increase over 1 °C since the Industrial Revolution. As a result of this baseline increase in temperature, we are seeing extreme heat events, such as heatwaves and record-breaking high temperatures, become more frequent, long-lasting, and intense.
Whilst a 1 °C background temperature increase may not seem significant, the resulting increase in the severity of extreme heat events is already evident in the observed record. This has widespread and significant impacts.
Extreme heat events do occur within natural climate variation due to changes in global weather patterns. However, the increase in the frequency, duration, and intensity of these events over recent decades is clearly linked to the observed warming of the planet and can be attributed to human activity.
Global circulation patterns, such as the El Niño Southern Oscillation (ENSO), are also being affected by the warming climate. These global circulation patterns affect weather patterns, which can lead to extreme heat events developing. We expect that as the planet continues to warm, these extreme heat events will continue to become more severe.
The overwhelming evidence that anthropogenic greenhouse gases are contributing to global warming, and the impacts being felt worldwide, led to the 2015 Paris Agreement. Nearly every nation signed this agreement, agreeing to address climate change and aiming to prevent global temperatures exceeding 2 °C above pre-industrial levels.
UK Observations
Each year a report on the UK State of the Climate is published in order to highlight how the UK’s weather and climate have changed compared to historical averages. The reports use scientific observations from the UK land weather station network and the HadUK-Grid dataset.
The top 10 warmest years for the UK since 1884 have occurred since 2002. In contrast, none of the coldest years have been recorded in this century.
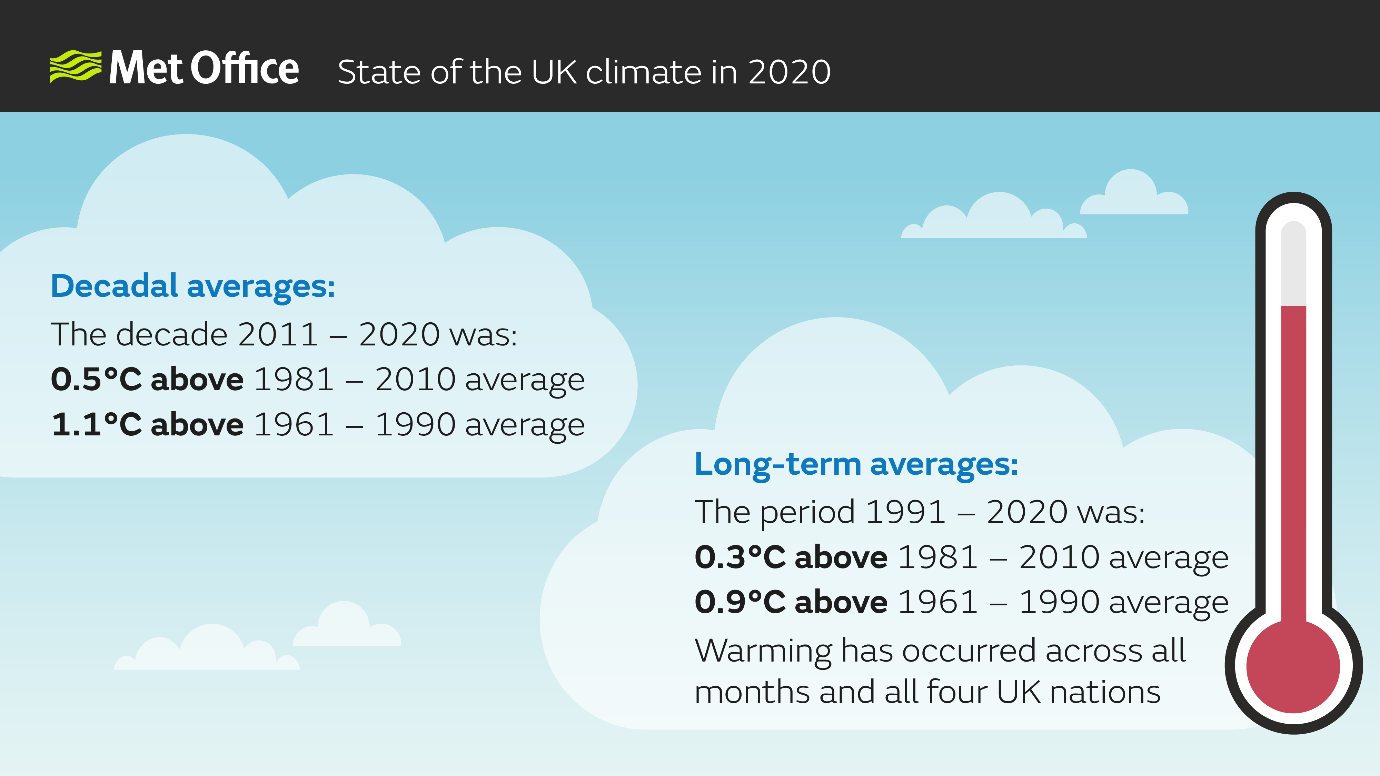
UK average temperatures have increased.
In early August 2020, at least twenty stations across southern England recorded maximum temperatures reaching 34 °C or more on six consecutive days. Five “tropical nights” were also recorded, when temperatures did not drop below 20 °C. The last time a similar event occurred was the summer of 1976, when at least twenty stations recorded 32 °C or more for six consecutive days.
Since the start of this century, all but three years have recorded at least one tropical night. In contrast, only half the years between 1961-2000 recorded tropical nights.
A special report on climate extremes in the UK found that we are experiencing higher maximum temperatures and longer warm spells in recent years. Warm spells have seen their average length more than double – increasing from 5.3 days in 1961-90 to over 13 days in the decade 2008-2017.
South East England has seen some of the most significant changes, with warm spells increasing from around 6 days in length (during 1961-90) to over 18 days per year on average during 2008-2017.
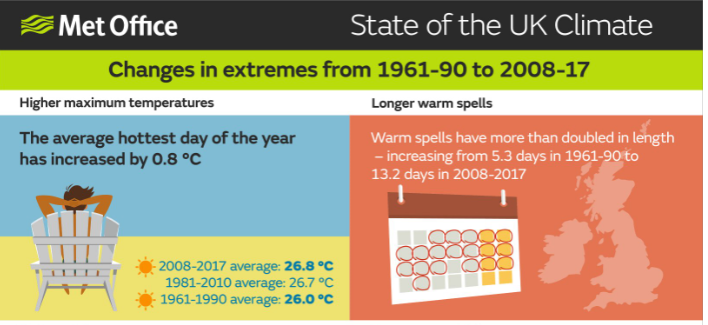
UK average maximum temperatures have increased and warm spells are longer.
All this evidence points to the UK’s climate warming in recent decades, leading to warmer summers and milder winters on average. However, it is difficult to quantify if the UK is experiencing more heatwaves in recent years due to their sporadic nature.
UK Projections
In the UK, climate predictions suggest that by the end of the 21st century all areas of the UK are projected to be warmer. Hotter and drier summers are likely to become more common. The latest set of UK climate projections (UKCP18) provide the most up-to-date assessment of how the UK climate could change over the 21st century.
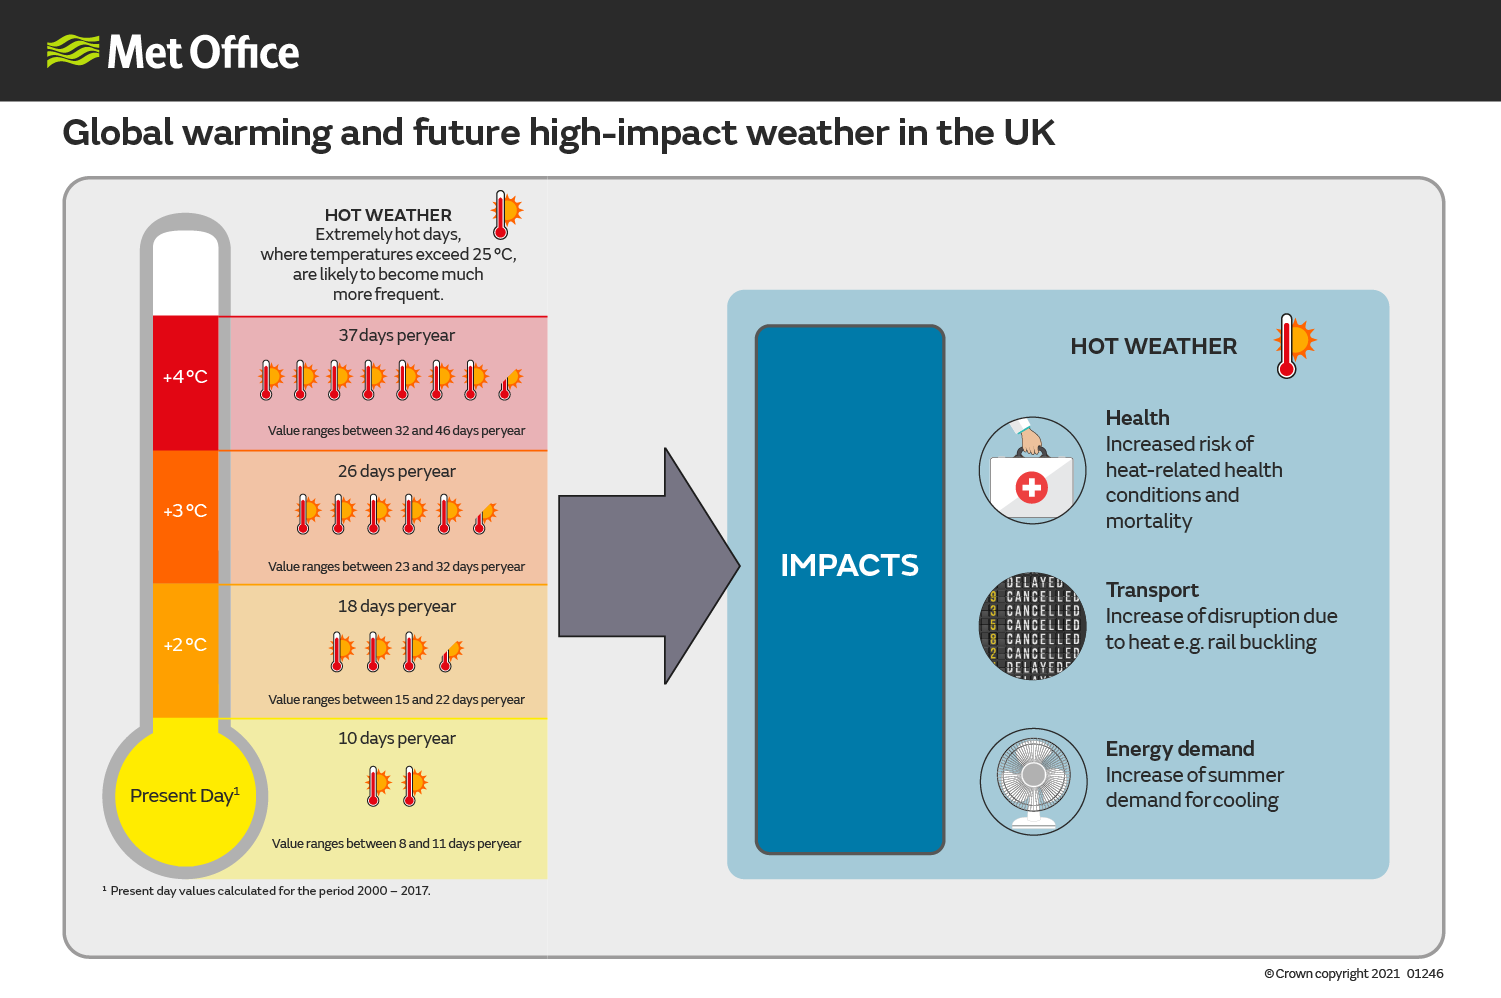 As global temperatures rise, the number of days the UK observes 25 °C or more will increase. Data available here.
UKCP18 showed that a summer as exceptionally warm as 2018 was very unlikely (less than 10% chance) in the recent past (1981-2000), but that warming so far had increased the chance to between 10-20%.
By mid-century, summers as warm as 2018 are expected to occur as often as not (about a 50% chance). By the end of the century the chance could increase to over 90% under a high greenhouse gas emission scenario.
The 2022 UK summer heatwave, marked a milestone in UK climate history, with 40°C being recorded for the first time in the UK and new national records set in Wales and Scotland and England.
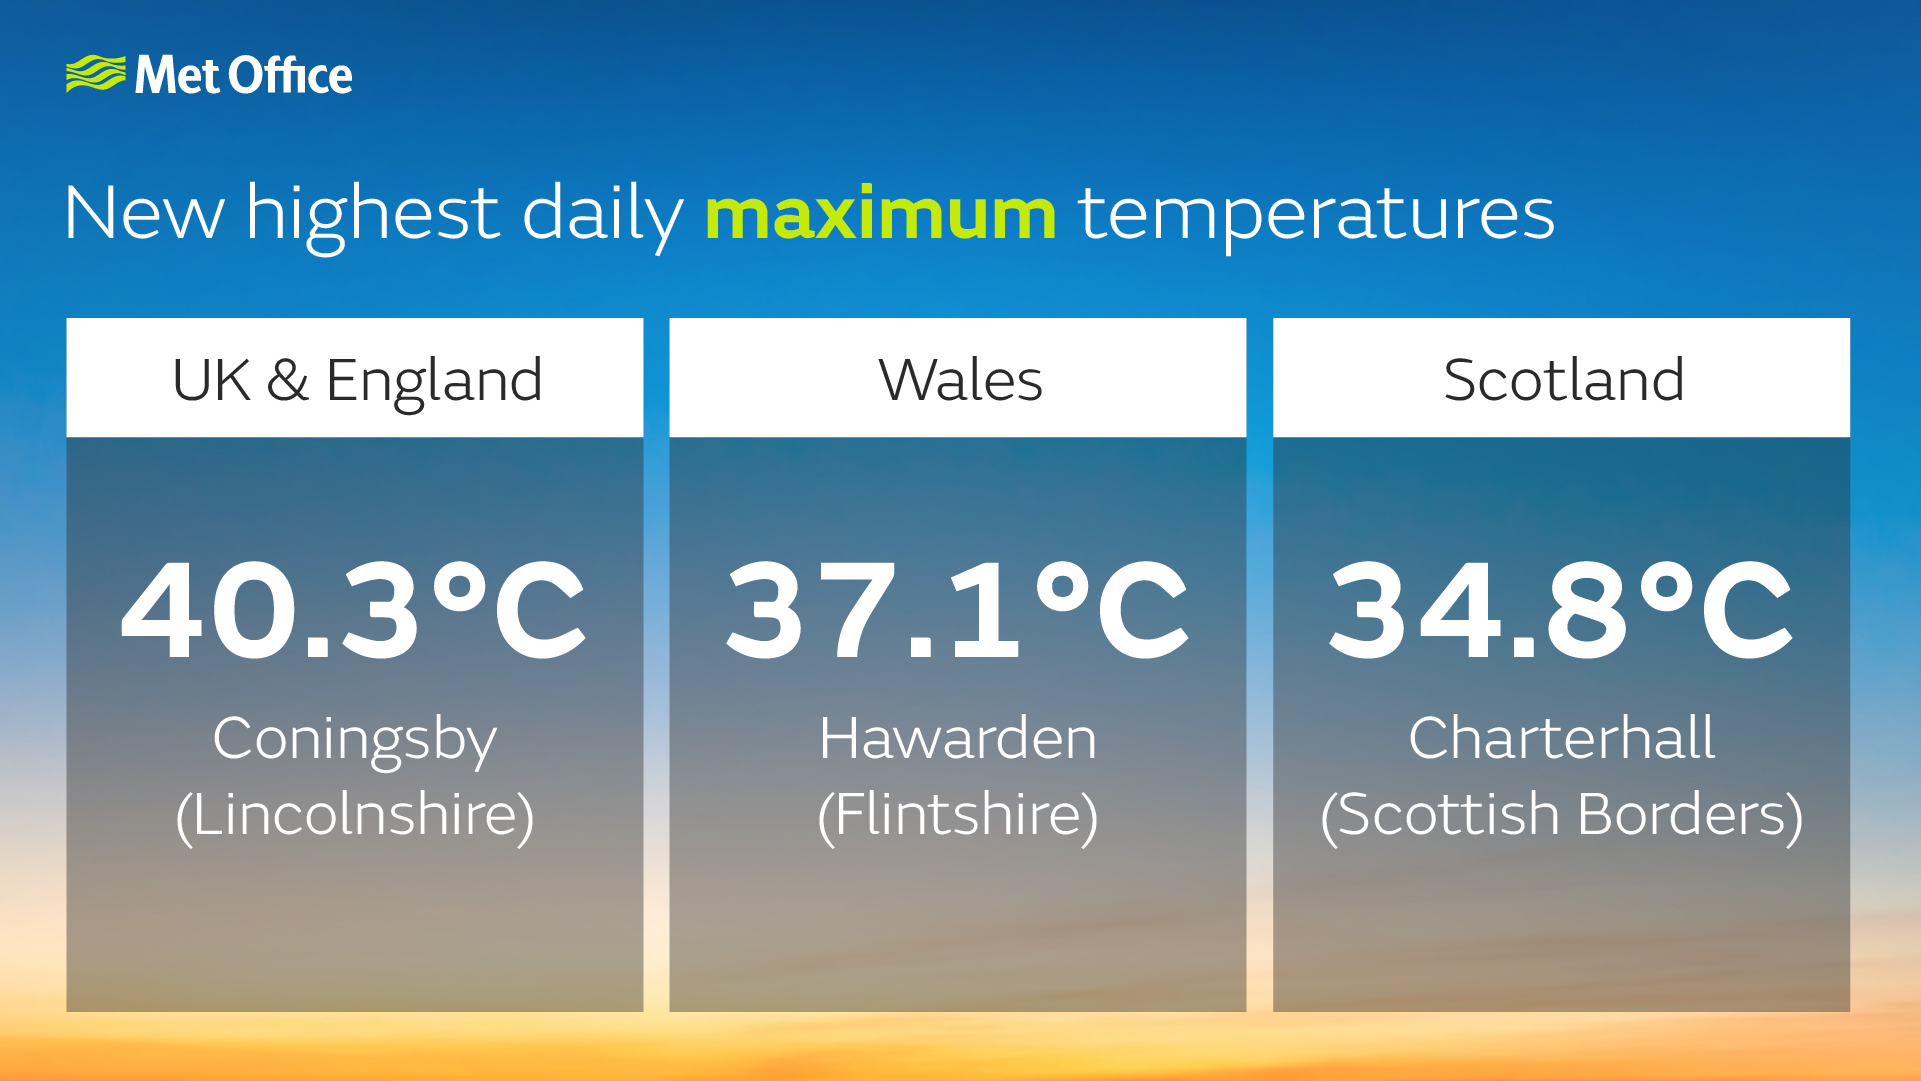
A study by the Met Office Hadley Centre suggests the current chance of seeing days reaching 40 °C or more is extremely low. However, by 2100 under a high emissions scenario the UK could see 40 °C days every 3-4 years.
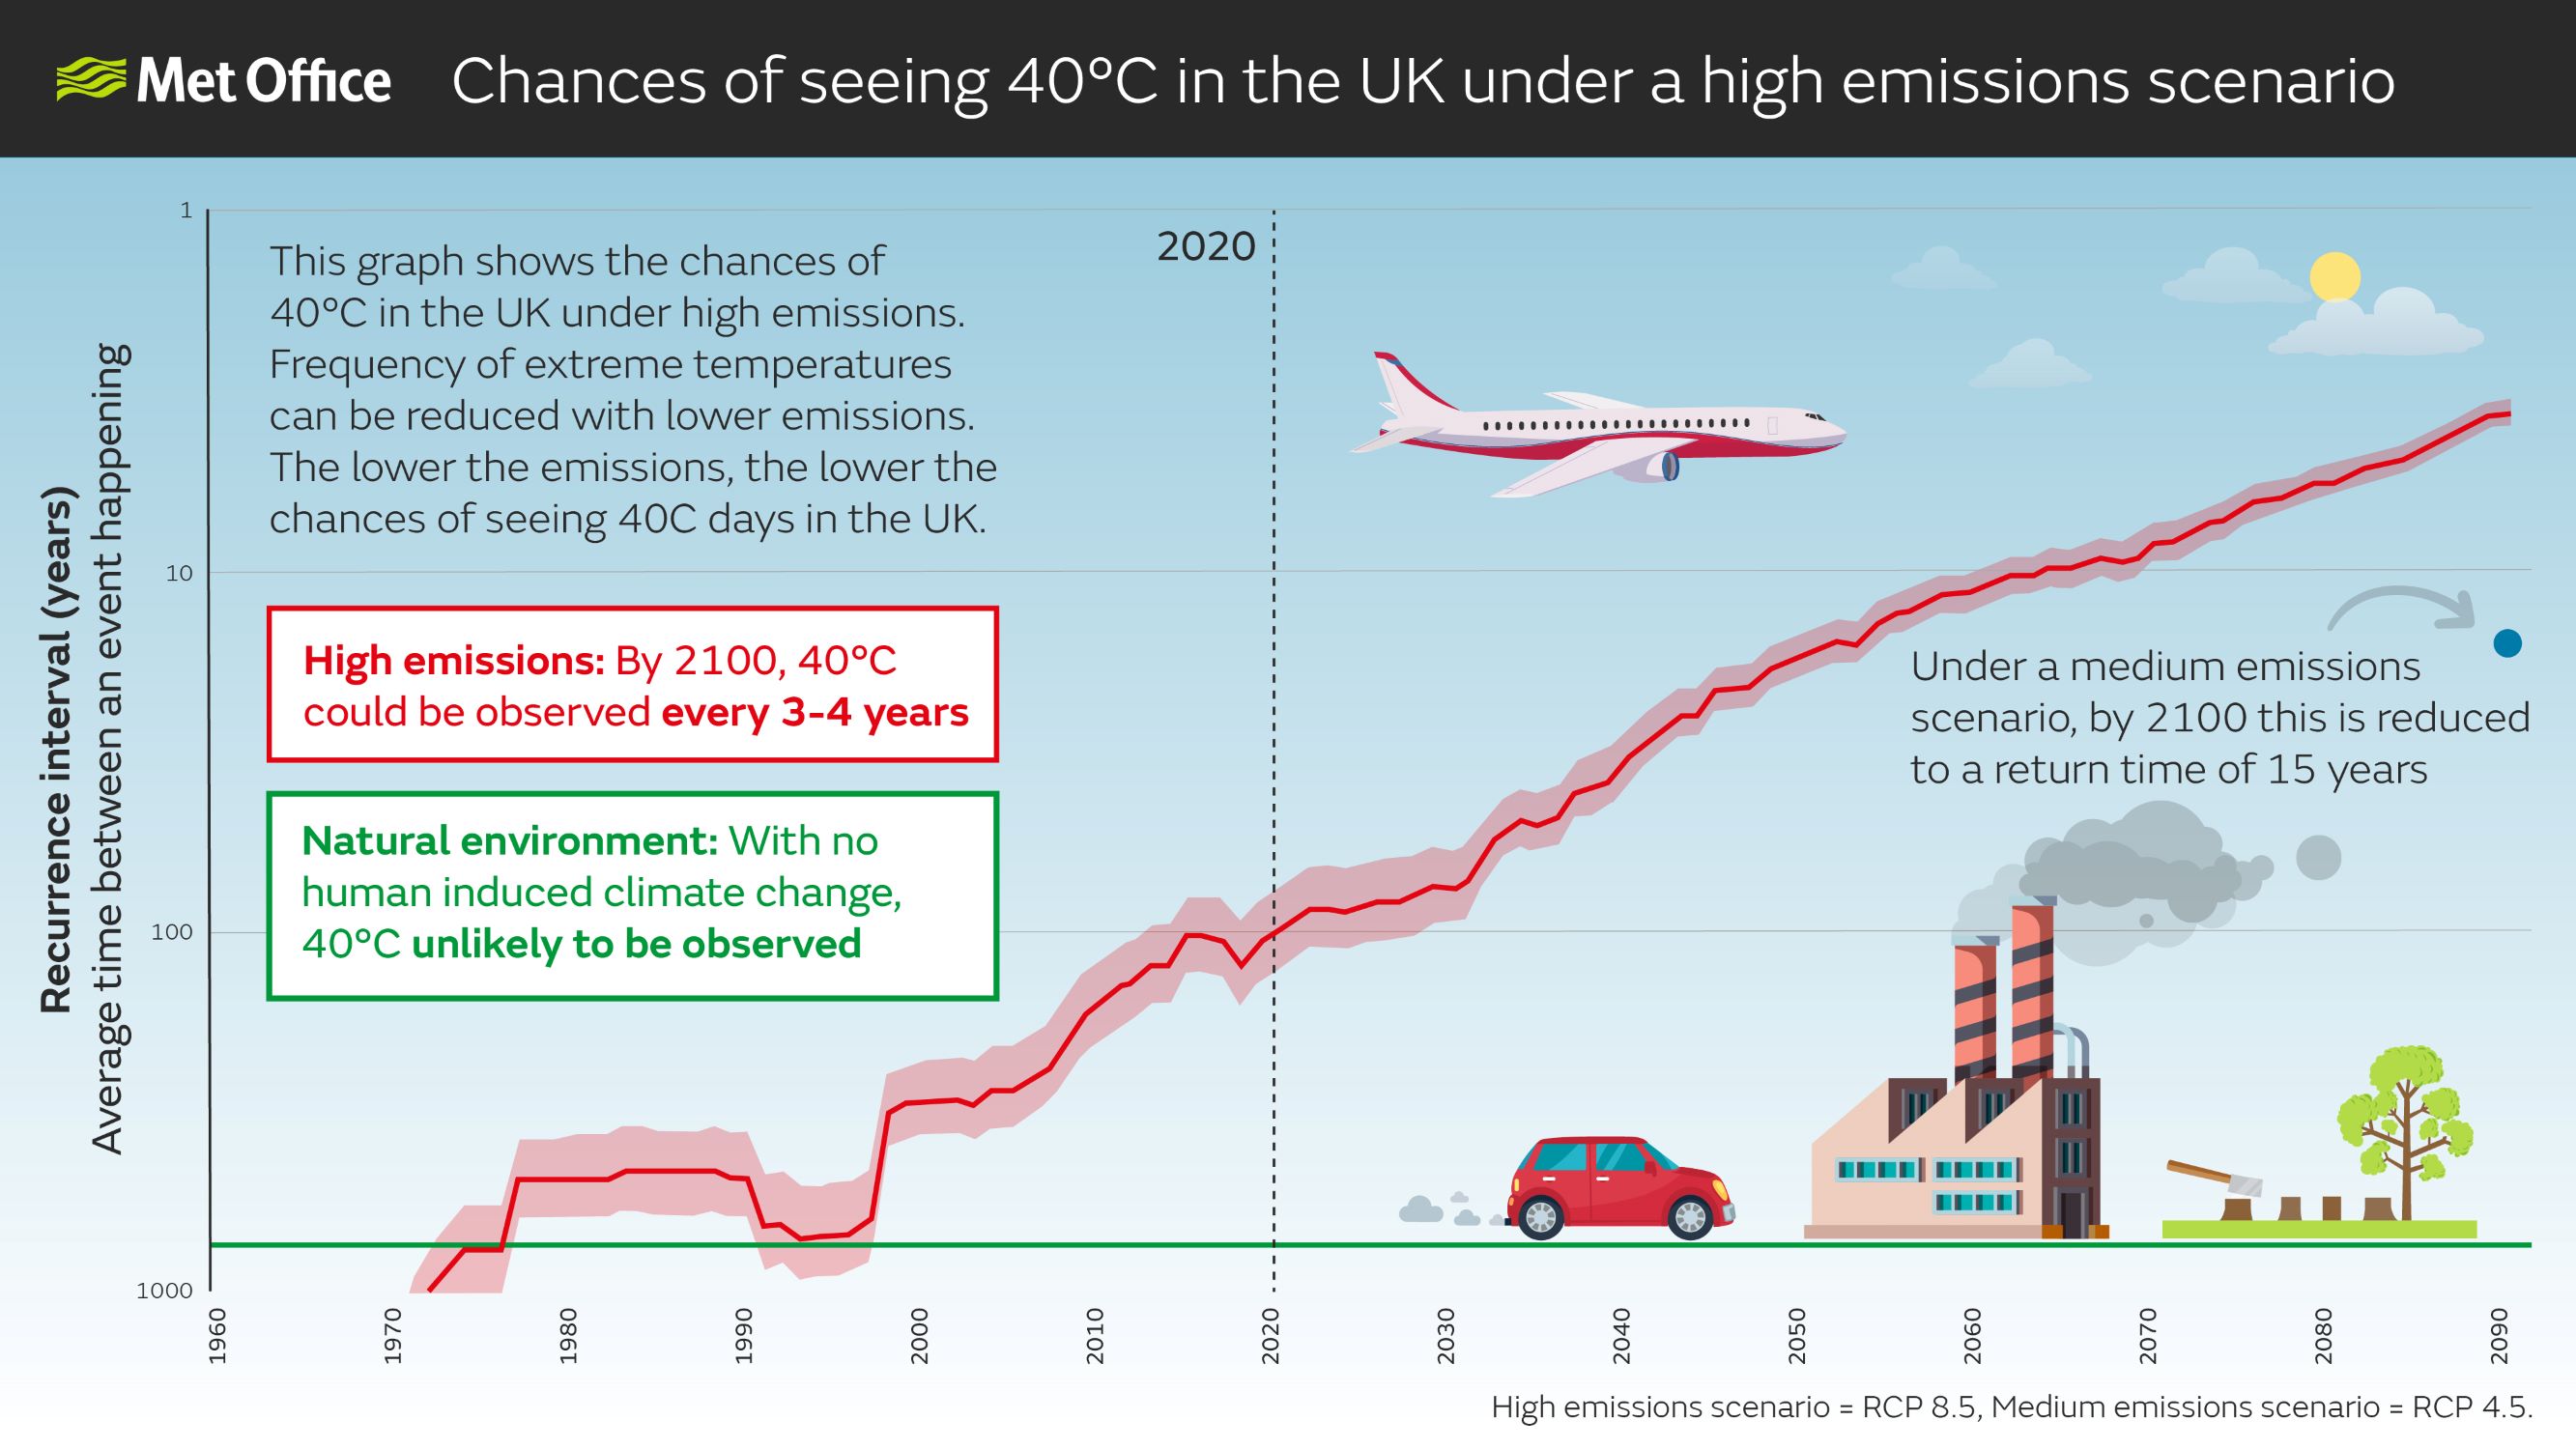
Climate change is increasing the chance of seeing 40 °C temperatures in the UK.
Global Observations
Each of the last four decades has been successively warmer than any decade preceding it since 1850. The Intergovernmental Panel on Climate Change (IPCC) Sixth Assessment Report (AR6) states, with high confidence, that global surface temperatures have increased faster since 1970 than any other 50-year period over at least the last 2000 years.
The AR6 report states that it is virtually certain (over 99% probability) that the frequency and intensity of hot extremes have increased on a global scale since 1950. It is also virtually certain that there have been increases in intensity and duration of heatwaves.
Urban heat island effects have enhanced the impact of global warming in cities, particularly night-time extremes. It is extremely likely that human influence is the main contributor to these observed changes.
On a regional scale, Europe, North America, Asia and Australasia have very likely (over 90% probability) observed an increase in heat extremes and decrease in cold extremes. Europe, Asia and Australia have also likely (over 66% probability) observed an increase in heatwaves.
Due to less data and a shorter observational record, it is likely these trends have been observed in much of South America, with medium confidence for Africa. It is very likely these regional changes are due to human influence.
A 2020 study led by Dr Robert Dunn from the Met Office demonstrated a clear increase in the number of warm days globally when compared with the number between 1961-1990. The team used a recently updated global data set called HadEX3 to track an upward trend in daily maximum temperature. This trend is important as it highlights that the window for extreme heatwaves to develop is lengthening each year, particularly in Europe, Asia, and North and Central America.
Global projections
The IPCC AR6 report states it is virtually certain that further increases in intensity and frequency of hot extremes will occur throughout the 21st century. On land, there is high confidence temperature extremes will increase at a greater rate than global mean temperature increases.
Higher temperature extremes mean that there is a bigger risk of regions becoming difficult for humans to live and work in. At 2 °C average warming above pre-industrial levels, the number of people living in areas affected by extreme heat stress could rise from 68 million today to around one billion. A further increase to an average of 4 °C above pre-industrial temperatures could see nearly half of the world’s population living in areas potentially affected by extreme temperatures.
The below map shows the parts of the world that could reach high heat stress with a 4 °C temperature rise (based on wet bulb global temperature – a measurement that accounts for both temperature and humidity) when those working outside should be taking more frequent rest breaks to lessen the worst effects of extreme heat.
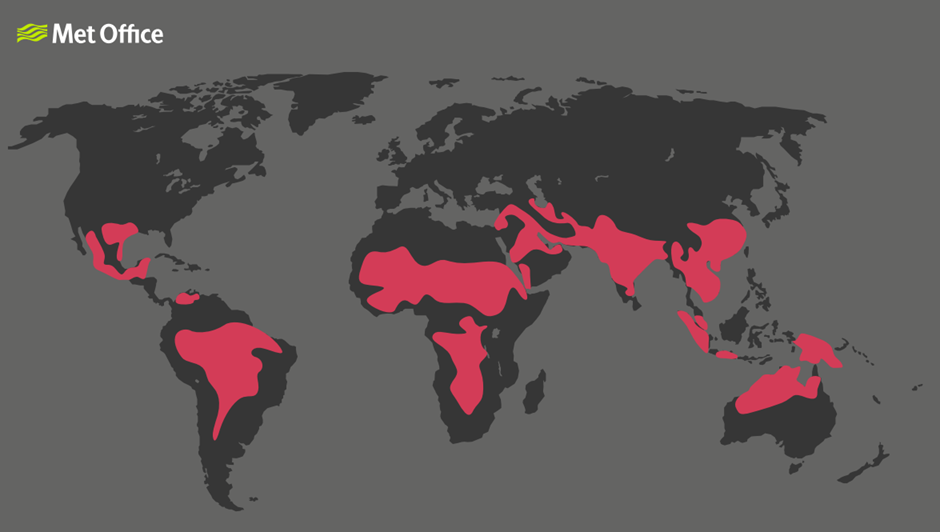
Large areas of the world could face high heat stress risk with a 4 °C temperature rise.
Related pages
Attributing extreme weather to climate change
UK and Global extreme events – Cold
UK and Global extreme events – Drought


