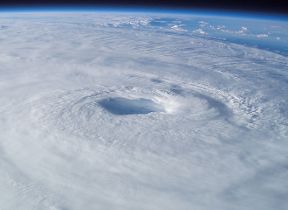
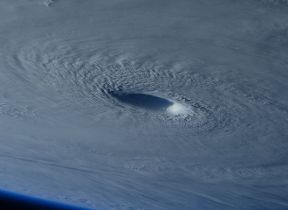
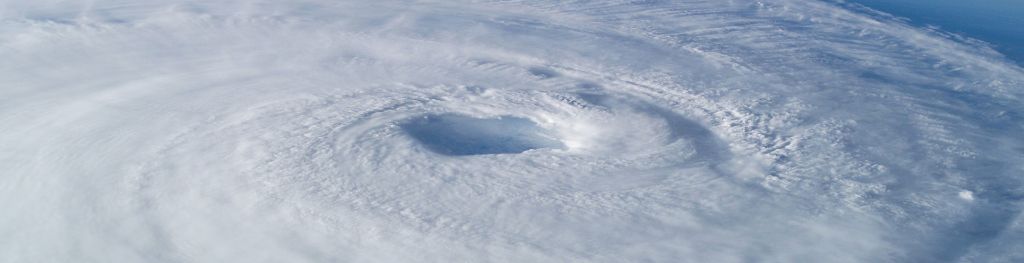
• home

Observed and Forecast Tracks: Northern Hemisphere 2010

All tropical cyclones in the northern hemisphere season in 2010 are listed below including details of their start and end dates and maximum sustained wind (MSW). Qualitative comments are included on the performance of the Met Office global model in predicting the track of each tropical cyclone. Click on the name of the tropical cyclone to see a chart of the observed track and forecast tracks from the Met Office global model. Verification statistics on each tropical cyclone are available upon request from tropical_cyclones@metoffice.gov.uk. At the end of the season a verification report on the performance of the Met Office global model will be published.

North-west Pacific
Name & ID Start & end dates 1-/10-minute MSW Comments on Met Office global model forecasts
01W 18-19 January 30/- knots 01W did not attain tropical storm status and no forecasts were verified.
Omais (02W) 21-26 March 50/35 knots Track errors were above last season's average for this storm as there was a left-of-track bias. Skill scores against CLIPER were poor.
Conson (03W) 11-17 July 75/70 knots Track forecast errors were near to or slightly above last season's average. Skill scores against CLIPER were negative. There was a right-of-track bias in forecasts particularly prevalent for the first few forecasts for the storm.
Chanthu (04W) 18-23 July 75/70 knots One forecast had a right-of-track bias, but other forecasts were very good resulting in low track forecast errors and high skill scores overall.
Dianmu (05W) 08-12 August 55/55 knots Track forecast errors were slightly above last season's average for this storm due to a slow bias. However, the right turn of the storm was well predicted and skill against CLIPER was positive.
Mindulle (06W) 22-24 August 60/45 knots This storm was fairly short-lived, but track forecasts were very good with low errors.
Lionrock (07W) 27 August-02 September 55/45 knots Apart from one poor forecast, the predicted tracks were very good. Track errors up to 84 hours were near to or below last season's average and skill scores against CLIPER were high.
Kompasu (08W) 28 August-02 September 100/75 knots Track forecast errors were above last season's average for this storm. During the early part of the storm's life there were forward speed biases and later the model failed to turn the storm quick enough towards the Korean peninsula. However, skill scores against CLIPER were high.
Namtheun (09W) 30 August-01 September 40/40 knots Namtheun was short-lived and took an unusual track (due to interactions with other storms), but track errors were low.
Malou (10W) 01-08 September 45/50 knots Track errors were generally above last season's average for this storm. The main model failing was to not turn the storm east quick enough. However, skill scores against CLIPER were good.
Meranti (11W) 08-10 September 65/45 knots Meranti was short-lived and track errors were large.
Fanapi (12W) 14-20 September 105/95 knots Track forecast errors for this storm were very low and skill scores against CLIPER exceptionally high. The landfall on Taiwan was well predicted.
Malakas (13W) 20-25 September 90/75 knots Track forecast errors were generally below last season's average for this storm. The acceleration northwards was well predicted. Skill scores against CLIPER were high.
14W 05-06 October 30/- knots 14W did not attain tropical storm status and no forecasts were verified.
Megi (15W) 13-23 October 155/125 knots Megi was the first super typhoon of the season. The landfall over the Philippines was well predicted. Despite a left of track bias in many forecasts for the track after leaving the Philippines, the track forecast errors were below last season's average - particularly at short lead times. Skill scores against CLIPER were also very high.
Chaba (16W) 21-30 October 115/90 knots At short lead times there was a slow bias in forecasts which resulted in errors above last season's average and low skill scores. However, errors at longer lead times were generally lower than last season's average and the direction of motion well predicted.
17W 21-23 October 30/- knots 17W did not attain tropical storm status and no forecasts were verified.
18W 12-14 November 25/- knots 18W did not attain tropical storm status and no forecasts were verified.
19W 12-13 December 25/- knots 19W did not attain tropical storm status and no forecasts were verified.

North-West Pacific observed tracks in 2010
North-West Pacific tropical cyclone names


North-east Pacific
Name & ID Start & end dates 1-minute MSW Comments on Met Office global model forecasts
Agatha (01E) 29/30 May 40 knots Agatha only briefly reached tropical storm status and no forecasts were verified.
02E 16-17 June 25 knots No forecasts verified as did not reach tropical storm status.
Blas (03E) 17-21 June 55 knots Track forecast errors were below last season's average for this storm.
Celia (04E) 19-29 June 140 knots Track forecast errors were well below last season's average for this storm. Skill scores were high. There was a slight right-of-track bias
Darby (05E) 23-28 June 100 knots Track errors were low for this storm and the model did well in predicting the slow down and reversal in direction of the storm prior to dissipation.
06E 14-16 July 30 knots No forecasts verified as did not reach tropical storm status.
Estelle (07E) 06-10 August 55 knots Track forecast errors were close to last season's average for this storm. There was a slight slow bias in forecasts.
08E 20-22 August 30 knots No forecasts verified as did not reach tropical storm status.
Frank (09E) 22-28 August 80 knots There was a slow bias in forecasts, but track errors were below last season's average for this hurricane.
10E 03-04 September 30 knots No forecasts verified as did not reach tropical storm status.
11E 03-04 September 30 knots No forecasts verified as did not reach tropical storm status.
Georgette (12E) 21-23 September 35 knots This storm was short-lived and only one forecast was verified.

Central North Pacific
Name & ID Start & end dates 1-minute MSW Comments on Met Office global model forecasts
Omeka (01C) 20-21 December 45 knots Omeka was short-lived and just one forecast was verified.

North-East and Central North Pacific observed tracks in 2010
North-east Pacific tropical cyclone names
Central North Pacific tropical cyclone names


North Atlantic
Name & ID Start & end dates 1-minute MSW Comments on Met Office global model forecasts
Alex (01L) 25 June-02 July 85 knots Track forecast errors were generally below last season's average and skill scores very high.
02L 08 July 30 knots No forecasts verified as did not reach tropical storm status.
Bonnie (03L) 22-24 July 35 knots Only one 12-hour forecast was verified as Bonnie was very short-lived as a tropical storm.
Colin (04L) 02-08 August 50 knots Colin struggled against vertical wind shear and was a tropical storm in two spells. Track forecast errors were higher than last season's average.
05L 10-11 August 30 knots No forecasts verified as did not reach tropical storm status.
Danielle (06L) 21-31 August 115 knots Track forecast errors for this hurricane were below last season's average - particularly at longer lead times. There was a slow bias in forecasts, but skill scores against CLIPER were very high. The timing and location of the turn north-eastwards were very well predicted.
Earl (07L) 25 August-04 September 120 knots Global model forecasts for Earl were very good. There was a slight slow and right-of-track bias, but track forecast errors were below last season's average and skill scores against CLIPER were high.
Fiona (08L) 30 August-04 September 50 knots Track forecast errors were mixed for this storm, but skill scores against CLIPER were good. The model tended to dissipate the storm a little too early. Fiona did eventually become absorbed by the larger Earl.
Gaston (09L) 01-02 September 35 knots Gaston only briefly reached tropical storm status, so no forecasts are verified. However, the remnant low did persist for a long time.
Hermine (10L) 06-08 September 55 knots Hermine was a only briefly a tropical storm before making landfall. The one 24-hour forecast verified had a low track error.
Igor (11L) 08-21 September 135 knots Biases were generally small for this hurricane and track errors overall were low. Skill scores against CLIPER were high. The recurvature was generally well handled.
Julia (12L) 12-20 September 115 knots Track forecast errors were a little high at short lead times, but low at longer lead times. Skill scores against CLIPER were high. The dissipation of the storm in mid-Atlantic was generally well handled.
Karl (13L) 14-18 September 105 knots Although track errors were not exceptionally high by historical standards the model had a right-of-track bias which resulted in a prediction of landfall too far north over the Mexican Gulf coast.
Lisa (14L) 21-26 September 70 knots Track forecast errors were near to or below last season's average. Skill scores were high. The unusual track of the storm was mostly predicted well.
Matthew (15L) 23-26 September 50 knots There was a small right-of-track bias which meant the precise location of landfall was not predicted. However, track errors were not large.
Nicole (16L) 28-29 September 35 knots Nicole was only briefly a tropical storm and very few forecasts were verified.
Otto (17L) 06-10 October 75/- knots There was a slight slow bias resulting in track errors above last season's average. However, skill scores against CLIPER were high and the direction of motion was well predicted.
Paula (18L) 11-15 October 85/- knots Track errors were low and skill scores high for this hurricane. The dissipation over Cuba was well predicted.
Richard (19L) 21-26 October 80/- knots Track errors were very low and skill scores high for this hurricane.
Shary (20L) 29-31 October 65/- knots Track errors were a little above last season's average due to a slow bias, but the recurvature was well forecast.
Tomas (21L) 29 October-07 November 85/- knots Track forecast errors for Tomas were near to or below last season's average and were particularly good at longer lead times. Skill scores against CLIPER were high. The turn of the storm towards the north and north-east was well predicted by the model.

North Atlantic observed tracks in 2010
North Atlantic tropical cyclone names


North Indian
(forecast track charts for Global and South Asia models shown)
Name & ID Start & end dates 1-/10-minute MSW Comments on Met Office global model forecasts
Laila (01B) 17-21 May 65/55 knots Global track forecast errors were above last season's average due to a propensity to recurve too soon. Skill scores were low at short lead times, but high at longer lead times. The South Asia model had slightly larger track errors, but its bias varied between left-of-track and right-of-track. Skill scores were positive throughout.
Bandu (02A) 19-22 May 55/40 knots Global model track forecast errors were above last season's average, but skill scores were high. The South Asia model performed a little better than the global model.
Phet (03A) 31 May - 06 June 125/85 knots Global model track forecast errors were above last season's average for this storm. The model had difficulty in determining when the storm would recurve. However, skill scores against CLIPER were generally high. The South Asia model performed slightly worse for track than the global model, keeping the storm over Oman for too long.
Giri (04B) 21-22 October 135/80 knots Giri was relatively short-lived, but deepened explosively just prior to landfall. Track forecast errors were low for the global model and a little higher for the South Asia model due to a slow bias.
Jal (05B) 04-07 November 70/55 knots Track forecast errors were very low for the global model and a little higher for the South Asia model due to a right-of-track bias bias.

North Indian observed tracks in 2010
North Indian tropical cyclone names

Note on estimated wind speeds

1-minute MSW: Maximum sustained wind (knots) averaged over 1 minute (JTWC Hawaii, NHC Miami, CPHC Hawaii)

10-minute MSW: Maximum sustained wind (knots) averaged over 10 minutes (JMA Japan, IMD New Delhi)
Note: Although 1-minute average winds should be stronger than 10-minute average, this may not be the case here since estimates are obtained from different warning centres.

Maximum sustained wind (1-minute average) colour codes
Tropical Depression Less than 35 knots
Tropical Storm 35-60 knots
Hurricane/Typhoon 65-95 knots
Major Hurricane/Typhoon 100 knots and above

Related internet links

Tropical cyclone FAQ

The Met Office is not responsible for the content of external internet sites.


Get updates