
The Central England Temperature series
The Central England Temperature (CET) series is the longest running instrumental temperature series in the world.
The UK is warming. We know this from our collection of official weather station data that have been monitoring UK-wide temperatures from 1884. However, people have been measuring the weather for much longer.
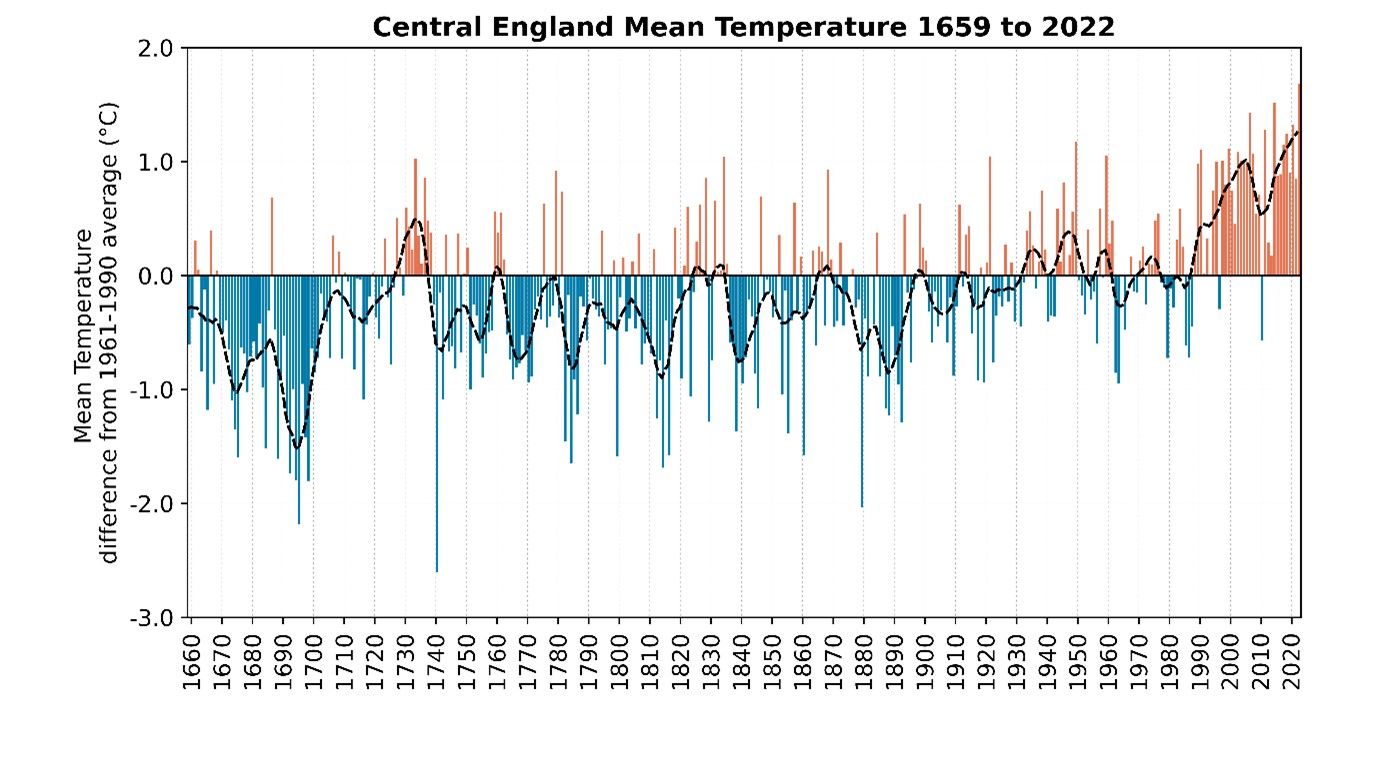
The Central England Temperature (CET) series is the longest-running instrumental temperature series in the world. By collating and combining early instrumental records, the series charts monthly temperature statistics from 1659. The series is representative of a region enclosed by Lancashire, London and Bristol.
Cooler and warmer spells
When looking at the series you can clearly see cooler and warmer spells, but none of these periods have been as marked as the warmer-than-average period since the late 20th Century. In a series that tracks over 360 years of temperature, nine out of the ten warmest years in the CET series have occurred since 1990 and the top five have all occurred since 2006. The last time there was a year in the top ten coldest was in 1879 during the reign of Queen Victoria. 360 years is a long time in any field of science, and you would expect many changes.
The CET today
The present-day CET is calculated from stations located at Stonyhurst (Lancashire), Rothamsted (Hertfordshire), and Pershore (Worcestershire), but a number of weather stations and early archive records of personal measurements have been used to construct the series over time.
The climate misinformation you may encounter
- Misinformation: The Met Office keep adjusting the Central England Temperature record to exaggerate climate change
Our response: The Met Office maintains the Central England Temperature series and we have a process of continual review and improvement to ensure the dataset is robust. This can result in occasional updates to the series. We do this transparently by publishing our results.
To take account of changes in technology and the weather station network over time requires a careful process of adjusting the contributing data to produce a consistent series. This was an effort first undertaken by British climatologist Gordon Manley and was published in a paper to the Royal Meteorological Society in 1952 with the aim of producing a multi-century series to monitor climate change in the UK.
- Misinformation: Temperature during the last two decades has not continued to rise
Our response: The UK has a variable climate so can exhibit natural variations from year-to-year and even decade-to-decade. Human-caused climate change is super-imposed on this natural variation which can therefore appear to enhance or suppress the warming trend over short periods (see chart above). Therefore, climate change is not expected to be a year-on-year increase in UK temperature, but when you look at the series as a whole it is clear that recent decades are warmer than any time in the past 360 years, and we expect further warming this century.
- Misinformation: Why does the Met Office choose the data that most exaggerates global warming?
Our response: To ensure the robustness of our data and conclusions the Met Office uses a range of datasets including the CET. We also use independent measurements and datasets including coastal waters, phenological observations and sea level data. This means we can provide a comprehensive assessment of how climate is changing in the UK so that we do not rely on a single graph or dataset as our evidence. Data on the UK climate is presented in our annual State of the UK Climate report alongside details of the data and methods used.
Further information
This page provides an introduction to the Central England Temperature series. More detail on how this fits into our wider observational evidence for climate change can be found on our UK Climate Datasets webpage and in our State of UK climate report. More details on CET and its construction, and access to the data can be found on this Met Office Hadley Centre datasets webpage.