
North Atlantic tropical storm seasonal forecast 2011
Tropical storm seasonal forecast for the June to November period
Forecast for June to November 2011
Issued 26 May 2011
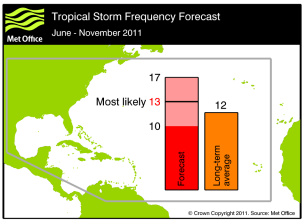
The most likely number of tropical storms predicted to occur in the North Atlantic during the June to November period is 13, with a 70% chance that the number will be in the range 10 to 17. This represents near-normal activity relative to the 1980-2010 long-term average of 12.
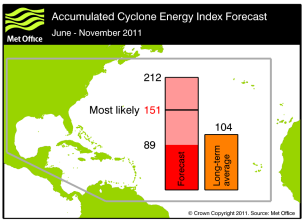
An ACE index of 151 is predicted as the most likely value, with a 70% chance that the index will be in the range 89 to 212 - which is above normal relative to the 1980-2010 average of 104.
Our Risk modelling collaborations provide expert advice on tropical storms. A detailed report with information on probabilities and the strength and credibility of signals within the forecast for the next six months is produced each month from March to September.
Download previous reports issued in June from 2007,2008, 2009, 2010 and in May from 2011.
To purchase forecast reports for 2012 (starting in March 2012) please email [email protected] or contact our Contact us.
Background
'Tropical cyclone' is the generic term for a low-pressure system over tropical or subtropical waters, with intense convective activity (e.g. thunderstorms) and winds circulating in an anticlockwise direction in the northern hemisphere (clockwise in the southern hemisphere). A tropical storm is a tropical cyclone with mean wind speeds of at least 39 mph The terms hurricane and typhoon are region-specific names for strong tropical cyclones with wind speeds of more than 73 mph
The North Atlantic tropical storm season usually runs from June to November. The degree of activity over the whole season varies from year to year and is measured in several ways.
- Total number of tropical storms. The number of tropical storms observed over the season is the best known measure of the level of storm activity. However, the total number of storms tells us little about variations in the intensity and lifetime of storms from one season to the next.
- The Accumulated Cyclone Energy (ACE) index. This is a measure of the collective intensity and duration of all tropical storms over the season and thus includes storm lifetimes and intensities as well as total numbers over the season.
The table below shows the number of tropical storms and ACE index observed in recent years.
| Number of tropical storms | ACE index | |
|---|---|---|
| 2004 | 15 | 225 |
| 2005 | 27 | 242 |
| 2006 | 10 | 79 |
| 2007 | 13 | 71 |
| 2008 | 16 | 144 |
| 2009 | 9 | 53 |
| 2010 | 19 | 164 |
Forecast
At the start of each North Atlantic season the Met Office forecasts the number of tropical storms and the value of the ACE index. Previously, this was for the period July-November. This season it is for the period June-November. The forecast has been produced following research collaborations with the European Centre for Medium-Range Weather Forecasts (ECMWF).
Method
The forecast is made using information from two dynamical global seasonal prediction systems; the Met Office Met Office seasonal prediction system: GloSea4 system and ECMWF system 3. Both systems simulate the ocean-atmosphere processes and interactions that determine tropical storm development. Multiple forecasts are made (using ensemble forecasting methods) to allow estimation of the range of likely outcomes. In contrast to the dynamical methods used in this forecast, statistical prediction methods, which have traditionally formed the basis of most published predictions, do not model atmospheric processes. They rely on past relationships between storm numbers and preceding observed conditions (e.g. pre-season SST patterns).
Seasonal forecasting of tropical storms
Skill
Recent studies have shown that dynamical models have considerable skill predicting the number of tropical storms - for example successfully predicting the change from the exceptionally active season of 2005 to the below-normal activity of the 2006 season. Last year the Met Office forecast was for 20 tropical storms and an ACE index of 204 with a 70% probability range of 13 to 27 storms and an ACE index of 90-319, respectively; in the event, the number of storms was 19 and the ACE index was 164.
See our seasonal tropical storm forecasts for 2007, 2008, 2009 and 2010 .
With increased spatial resolution and improvements to the representation of physical processes in the forecast model - planned for the near future - the prediction skill for tropical storm activity is expected to increase.
Verification
The Met Office seasonal tropical storm forecast for the North Atlantic, issued on 26 May 2011, predicted the most likely number of tropical storms to occur during the June to November period would be 13, with a 70% chance that the number would be in the range 10 to 17. This represents near-normal activity relative to the 1980-2010 long-term average of 11.7. An ACE index of 151 was predicted as the most likely value, with a 70% chance that the index would be in the range 89 to 212 - which was above normal relative to the 1980-2010 average of 104.
In the event the observed number of storms (19) was outside the predicted range, but the observed ACE index (124) was within the predicted range.
Download a report on the forecast verification and analysis of the 2011 season for further details. The Met Office will issue its first forecast for the 2012 season in March 2012. A public forecast for the June-November 2012 period will be issued in May 2012.
To view PDF documents you will need to download Adobe Reader