
North Atlantic tropical storm seasonal forecast 2026
Tropical storm seasonal forecast update July 2026
This forecast was issued on 31 July 2026 and supersedes the pre-season forecast issued in May 2026. Please see the link below for the pre-season forecast.
Forecast for the whole 2026 season
Issued 31 July 2026
All values given below represent observed activity for the 6-month period from February to July 2026 plus the 6-month GloSea6 forecast activity from August 2026 to January 2027. Note, the official tropical storm season, which usually includes most activity, is from June-November.
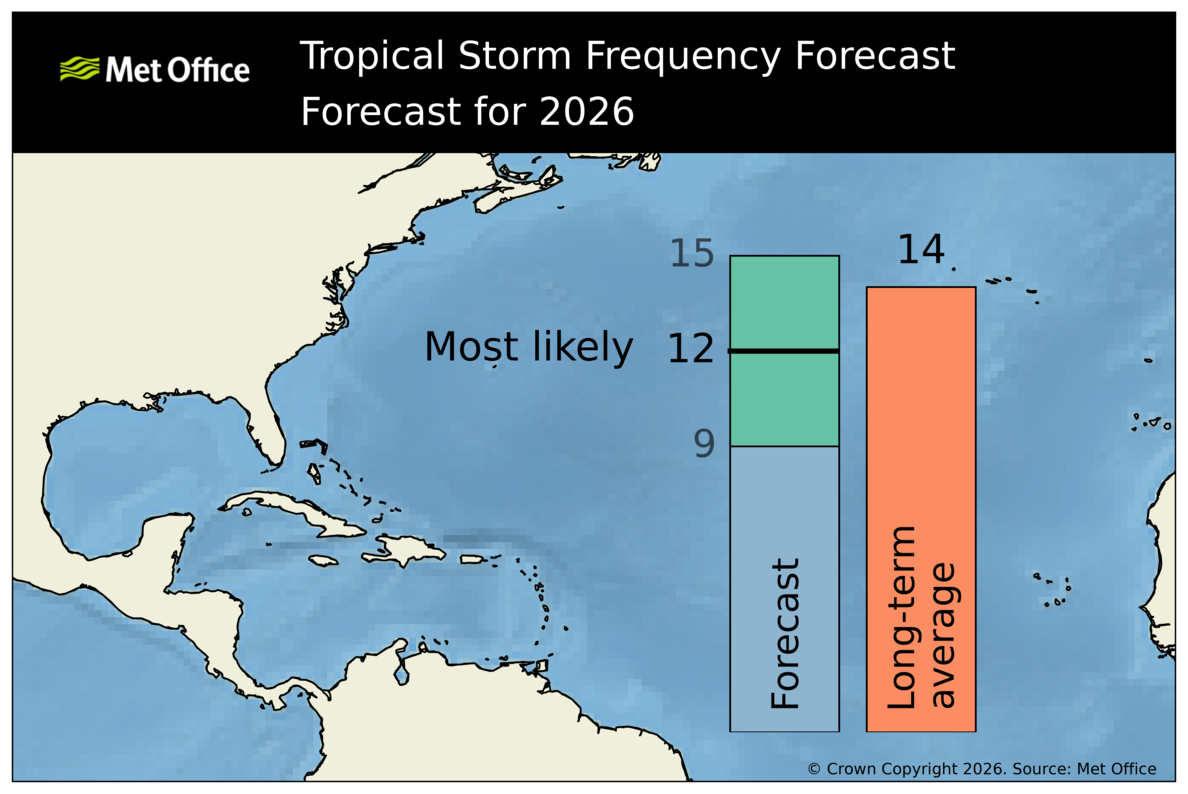
The most likely number of named tropical storms (winds of at least 39 mph) predicted to occur in the North Atlantic is 12, with a 70% chance that the number will be in the range 9 to 15. The 1991-2020 long-term average is 14.
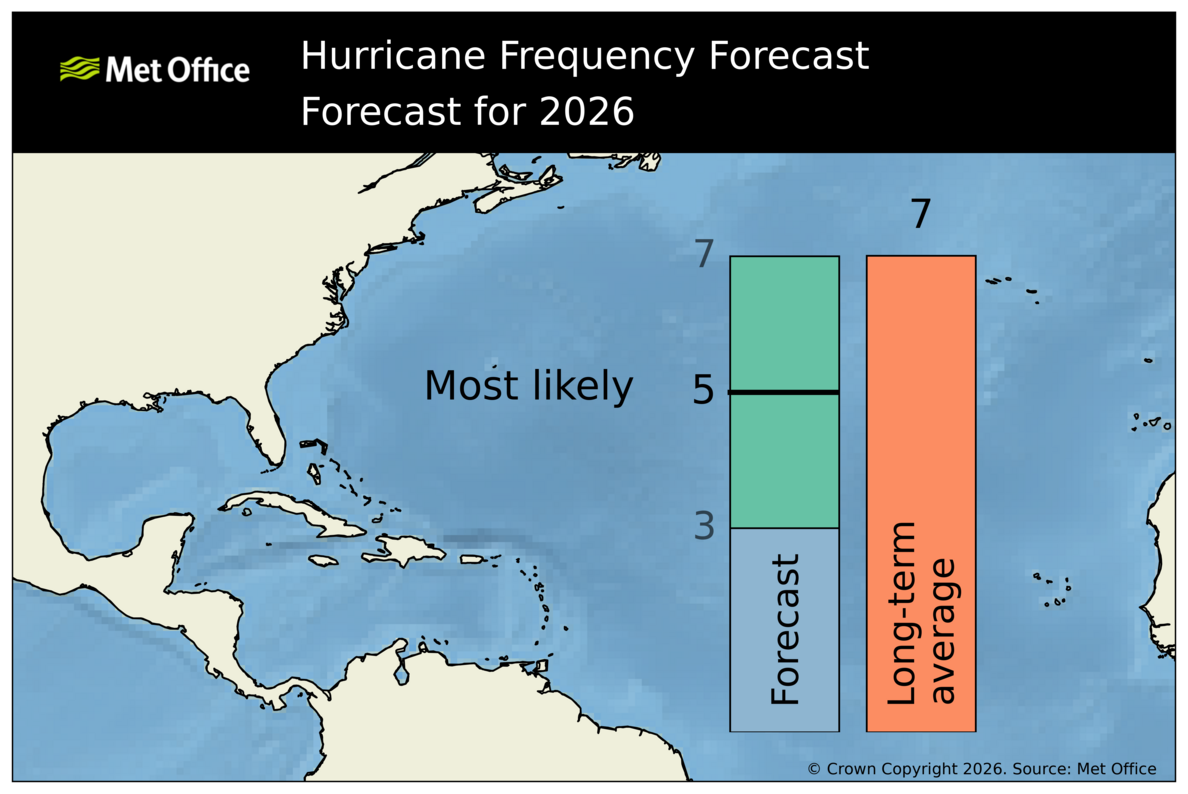
The most likely number of hurricanes (winds of at least 74 mph) predicted to occur in the North Atlantic is 5, with a 70% chance that the number will be in the range 3 to 7. The 1991-2020 long-term average is 7.
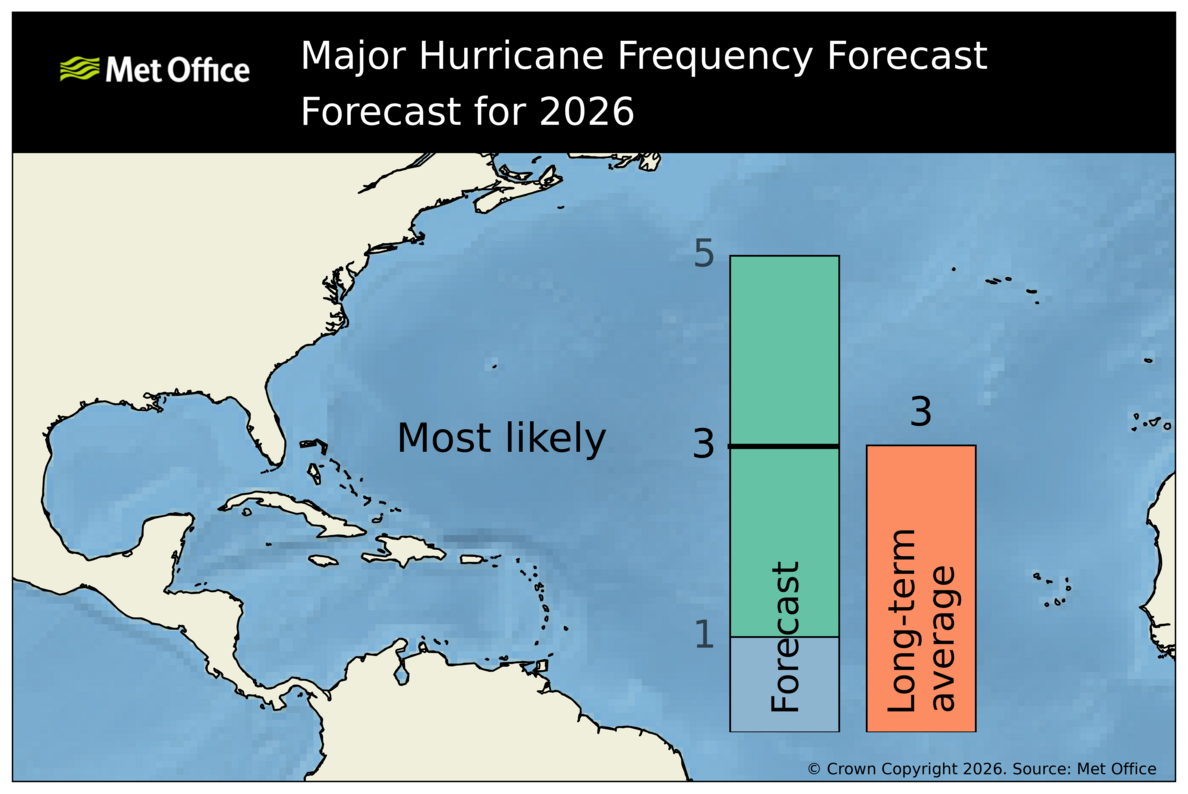
The most likely number of major hurricanes (winds of at least 111 mph) predicted to occur in the North Atlantic is 3, with a 70% chance that the number will be in the range 1 to 5. The 1991-2020 long-term average is 3.
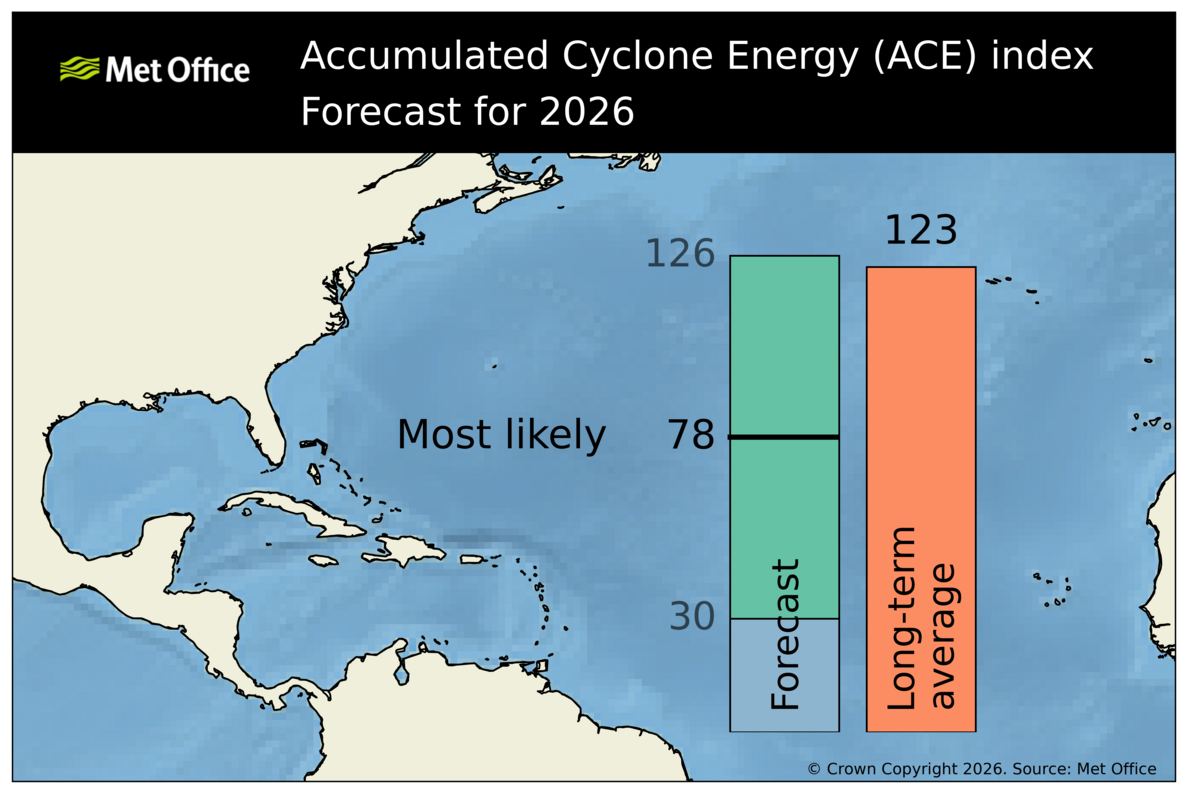
An ACE index of 78 is predicted as the most likely value, with a 70% chance that the index will be in the range 30 to 126. The 1991-2020 average is 123.
Background
'Tropical cyclone' is the generic term for a low-pressure system over tropical or subtropical waters, with intense convective activity (e.g. thunderstorms) and winds circulating in an anticlockwise direction in the northern hemisphere (clockwise in the southern hemisphere). A tropical storm is a tropical cyclone with mean wind speeds of at least 39 mph. The terms hurricane and typhoon are region-specific names for strong tropical cyclones with wind speeds of at least 74 mph. For further details about tropical cyclones see Met Office tropical cyclone facts.
The North Atlantic tropical storm season usually runs from June to November. The degree of activity over the whole season varies from year to year and is measured in several ways.
- Total number of tropical storms. The number of named tropical cyclones with winds of at least 39 mph observed over the season. This is the best known measure of the level of storm activity. In this forecast the number of tropical storms also includes those that reach hurricane and major hurricane strength (see below).
- Total number of hurricanes. The number of tropical cyclones that reach sustained winds of at least 74 mph.
- Total number of major hurricanes. The number of tropical cyclones that reach sustained winds of at least 111 mph.
- The Accumulated Cyclone Energy (ACE) index. A measure of the collective intensity and duration of all named tropical storms, hurricanes and major hurricanes during the season.
The table below shows the number of tropical storms, hurricanes, major hurricanes and ACE index observed in recent years.
North Atlantic tropical storm activity (February to January the following year)
| Year | Tropical storms | Hurricanes | Major hurricanes | ACE index |
| 2016 | 15 | 7 | 4 | 141 |
| 2017 | 17 | 10 | 6 | 225 |
| 2018 | 15 | 8 | 2 | 129 |
| 2019 | 18 | 6 | 3 | 130 |
| 2020 | 30 | 13 | 7 | 180 |
| 2021 | 21 | 7 | 4 | 146 |
| 2022 | 15 | 8 | 2 | 97 |
| 2023 | 19 | 7 | 3 | 144 |
| 2024 | 18 | 11 | 5 | 162 |
|
2025 |
13 |
5 |
4 |
133 |
Historical Forecasts
At the start of each North Atlantic season the Met Office forecasts the number of tropical storms, hurricanes, major hurricanes and ACE index. Seasonal forecasts of tropical storm activity have been issued annually since 2007. See our previous seasonal tropical storm forecasts issued in either May or June for 2007, 2008, 2009, 2010 , 2011, 2012, 2013, 2014, 2015, 2016, 2017, 2018, 2019, 2020, 2021, 2022, 2023, 2024 and 2025.
Method
The forecast is made using information from the Met Office seasonal prediction system, GloSea6, which is an ensemble prediction system based on a fully coupled ocean-atmosphere general circulation model (GCM). This system simulates the ocean-atmosphere processes and interactions that determine tropical storm development. Multiple forecasts are made (using ensemble forecasting methods) to allow estimation of the range of likely outcomes. The ensemble is then used to produce a best estimate (or most likely) predicted value (the ensemble mean) and forecast range (using the spread in the ensemble outcomes). Further details on the forecast method can be found in Camp et al. (2015).
Skill
Recent studies have shown that dynamical models have considerable skill predicting the number of tropical storms - for example successfully predicting the change from the exceptionally active season of 2005 to the below-normal activity of the 2006 season. In 2017, the Met Office seasonal forecast system successfully predicted the above-average activity that was observed in the North Atlantic, including the high frequency of tropical cyclone tracks around the northeast Caribbean (Camp et al., 2018). Full details of the skill to predict tropical storm activity around the world has previously been documented by Camp et al. (2015) and for real-time forecasts in Klotzbach et al. (2019).
References
Camp, J., Roberts, M., MacLachlan, C., Wallace, E., Hermanson, L., Brookshaw, A., Arribas, A., Scaife, A. A., (2015). Seasonal Forecasting of Tropical Storms Using the Met Office GloSea5 Seasonal Forecast System. Q.J.R. Meteorol. Soc, 141: 2206-2219.
Camp, J., Scaife, A. A., Heming, J. (2018). Predictability of the 2017 North Atlantic hurricane season. Atmos Sci Lett. 2018; 19:e813.
Klotzbach, P. et al. (2019). Seasonal Tropical Cyclone Forecasting. Tropical Cyclone Research and Review, 8 (3), 134-149.
To view PDF documents you will need to download Adobe Reader