
Tropical cyclone forecast verification - southern hemisphere 2025-26
A summary of tropical cyclone activity in the southern hemisphere for the 2025-26 season together with an assessment of the performance of the Met Office global model in predicting the tracks of these tropical cyclones.
1. Introduction
A summary of tropical cyclone activity in the Southern Hemisphere for the 2025-26 season is presented below together with an assessment of the performance of the Met Office global model in predicting the tracks of these tropical cyclones.
Tropical cyclones are experienced in the South Indian Ocean, tropical seas to the west, north and east of Australia and the western and central South Pacific Ocean. There are also occasional tropical or subtropical storms in the South Atlantic Ocean. For the purpose of tropical cyclone verification the Southern Hemisphere is divided in to three basins; the South-West Indian (west of 90° E), Australian (east of 90° E) and South Atlantic. Mean error statistics for each basin are presented together with a table of statistics for the whole Southern Hemisphere. The global model produces a seven-day forecast every 12 hours. Verification is performed at 12-hour intervals up to forecast time T+168, although statistics are only presented at 24-hour intervals in this report.
The global model resolution in operation during the season was 0.140625° x 0.09375° x 70 levels. This is equivalent to a horizontal resolution of 16 km × 10 km at the equator.
Tropical cyclone forecast verification - measures of error
Advisory positions from RSMCs La Réunion and Nadi, Fiji, Bureau of Meteorology, Australia and JTWC Hawaii are used as verifying observations of storm location. Best track data from these centres will be obtained once they become available. Past experience shows that use of best track rather than real time data usually only makes minor differences to seasonal track error statistics. Some mean error statistics for last season are also included for the purposes of a comparison. Forecast tracks are only verified when a depression reaches tropical storm status.
2. Tropical cyclone activity
Tropical cyclone activity
| SWI | AUS | SAT | TOTAL | |
| Tropical depressions (<35 knots) | 0 (0) | 0 (0) | 1 (0) | 1 (0) |
| Tropical storms (35-63 knots) | 6 (5) | 11 (12) | 1 (1) | 18 (18) |
| Hurricanes/typhoons (>63 knots) | 5 (6) | 10 (10) | 0 (0) | 15 (16) |
| Total | 11 (11) | 21 (22) | 2 (1) | 34 (34) |
Basin name abbreviations:
SWI : South-West Indian (west of 90° E)
AUS : Australian (east of 90° E)
SAT : South Atlantic
The number in brackets indicates the figure for the 2024-25 season.
3. Summary of all southern hemisphere storms
3.1 South-west Indian basin storms
Table of mean error statistics
| T+0 | T+24 | T+48 | T+72 | T+96 | T+120 | T+144 | T+168 | |
| Cases verified | 108 |
86 |
71 |
58 |
46 |
35 |
26 |
18 |
| Detection rate (%) |
100 |
100 |
100 |
100 |
100 | 100 |
100 |
100 |
| AT error (km) | 3 | -8 | -20 | -42 | -67 | -94 | -30 | -152 |
| CT error (km) |
5 |
12 |
26 | 35 |
-6 |
-87 |
-41 |
241 |
| Track skill (%) | ***** | 69 | 78 | 73 | ***** | ***** | ***** | ***** |
| DPE (km) | 33 |
63 |
93 |
149 | 224 | 320 |
409 |
606 |
| * 2020-25 DPE (km) | 36 | 79 | 135 | 194 | 260 | 338 |
426 |
460 |
| Central pressure bias (mb) | -0.5 |
3.7 |
5.8 |
6.6 |
8.5 |
7.4 |
8.2 |
12.9 |
* DPE and skill for all south-west Indian storms for the previous five seasons.
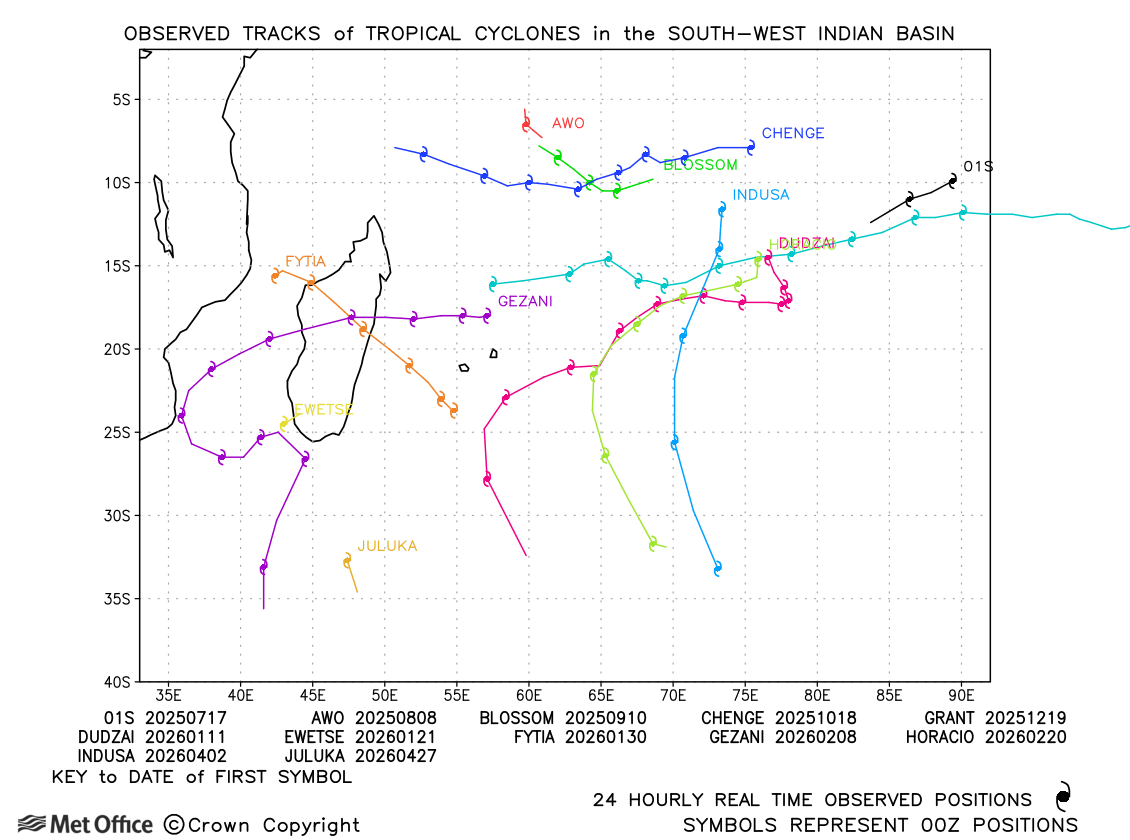
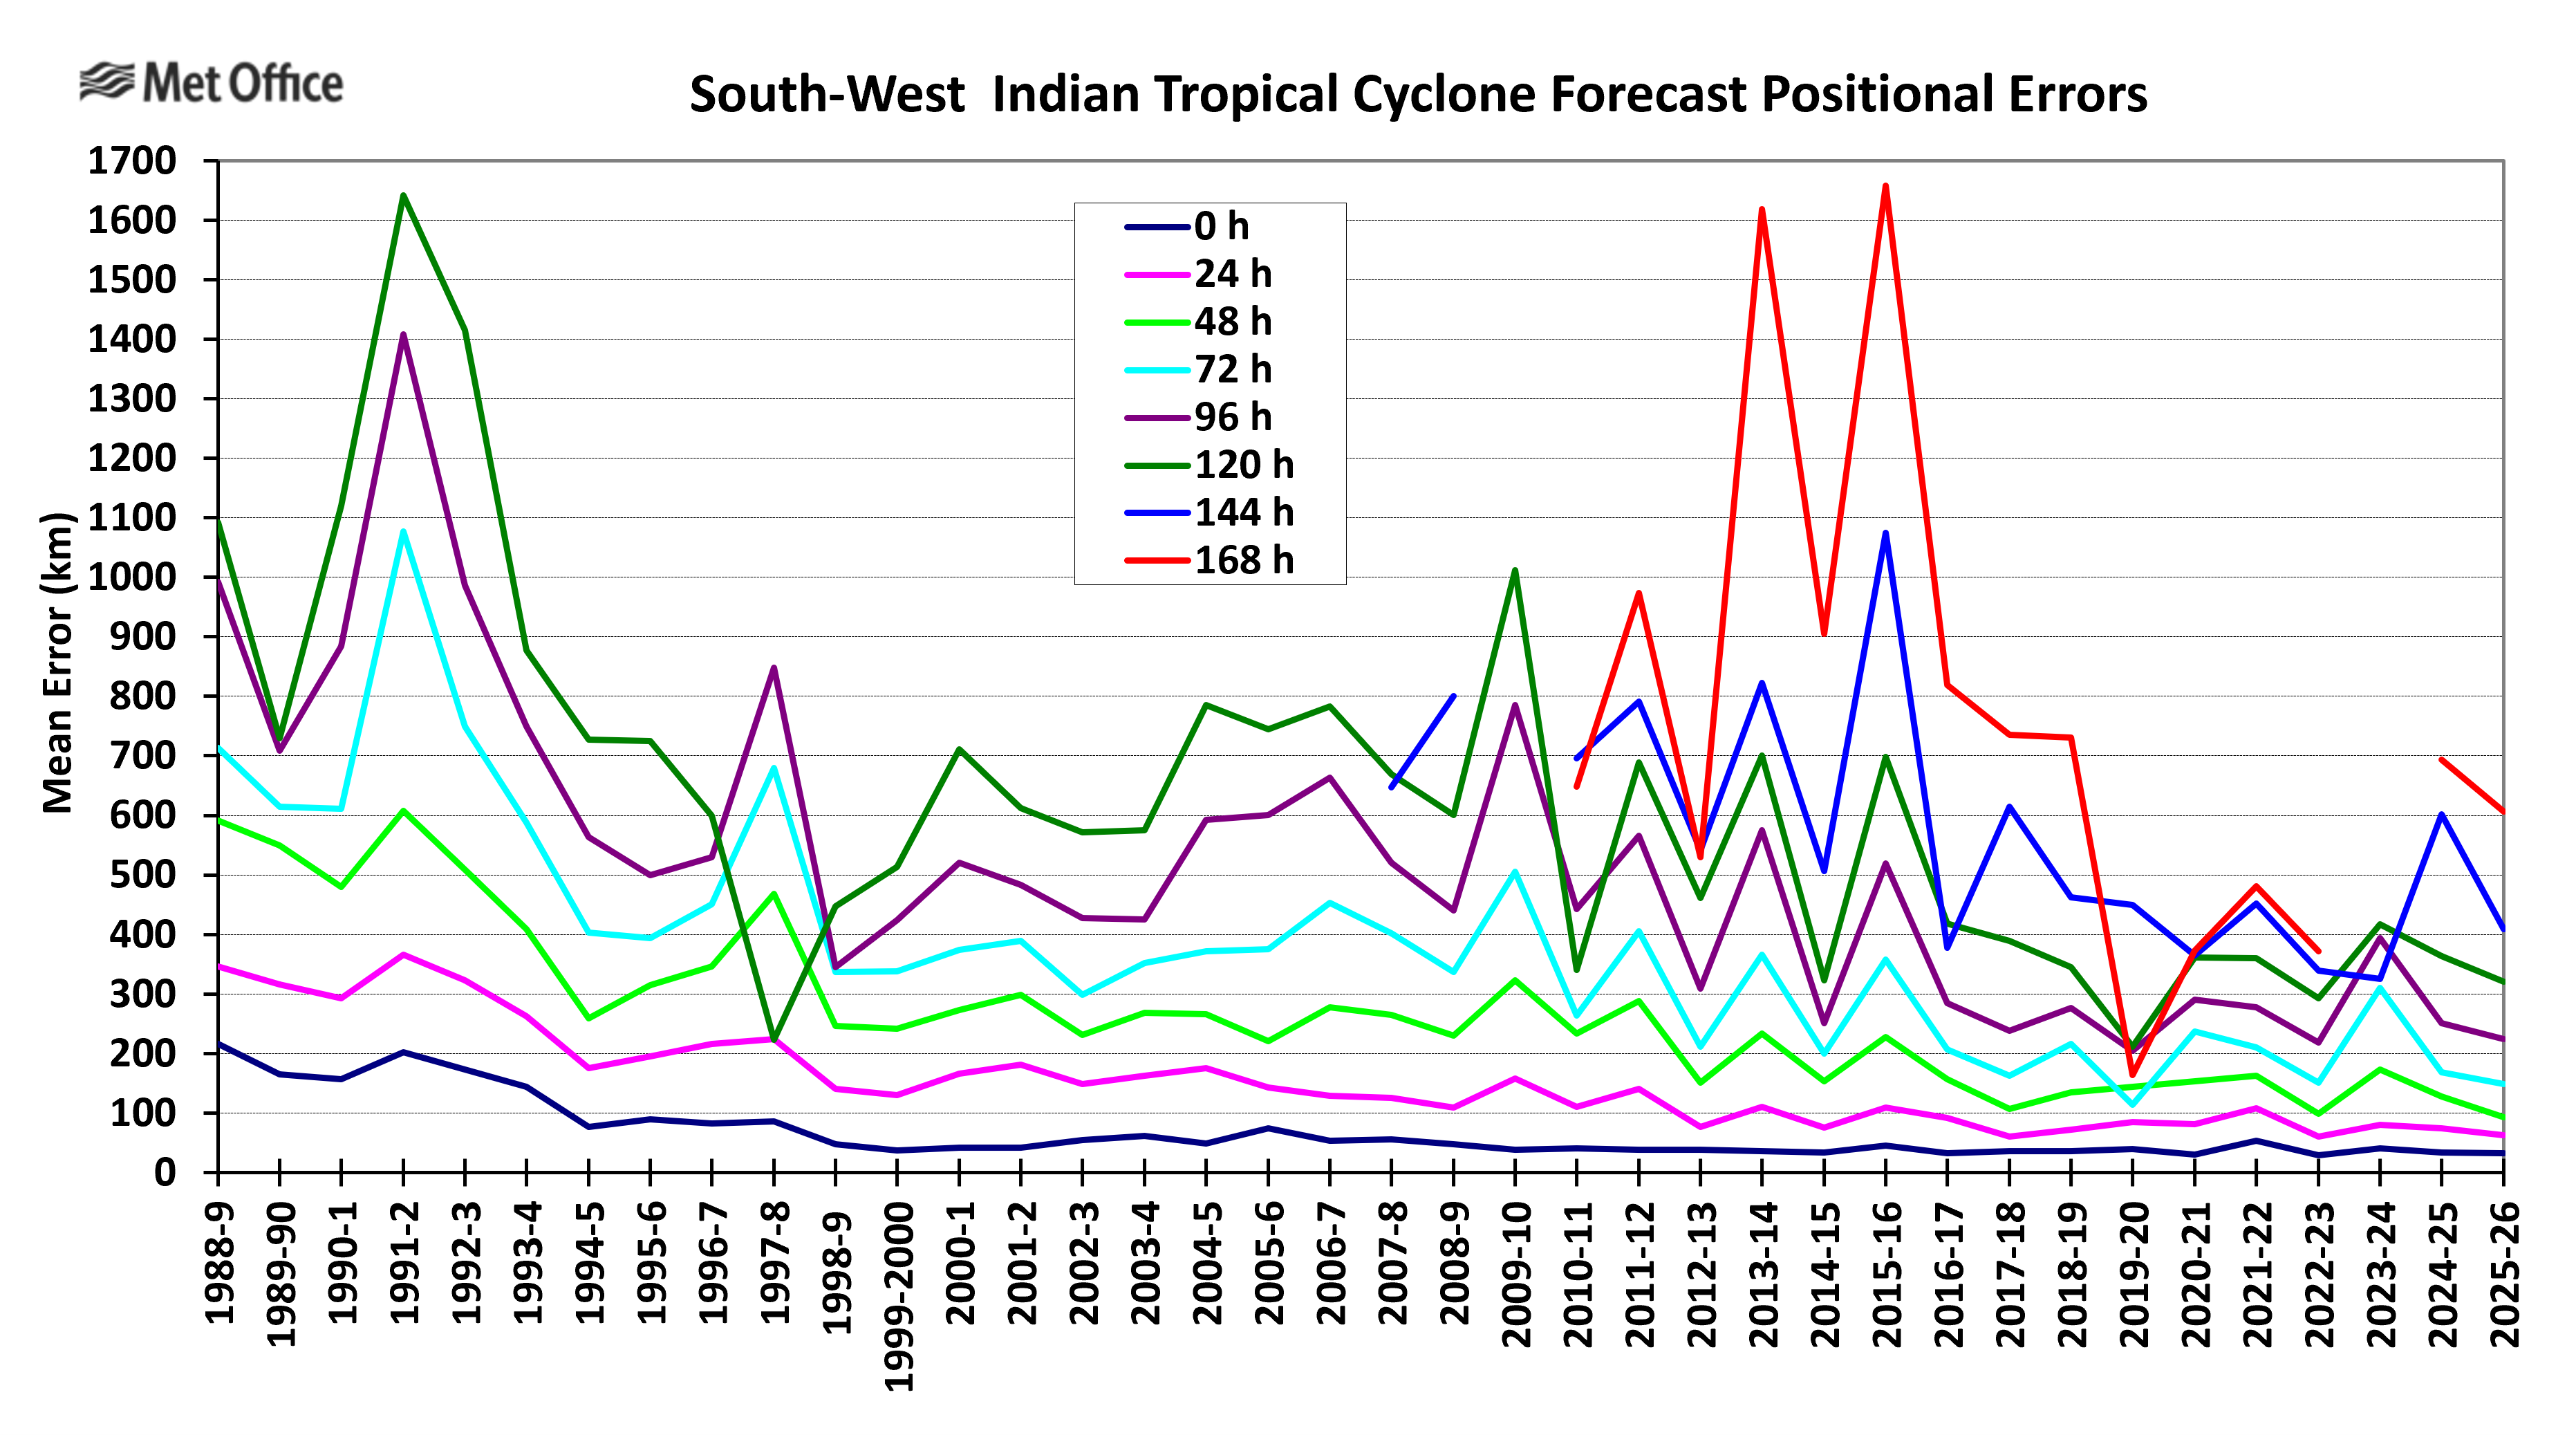
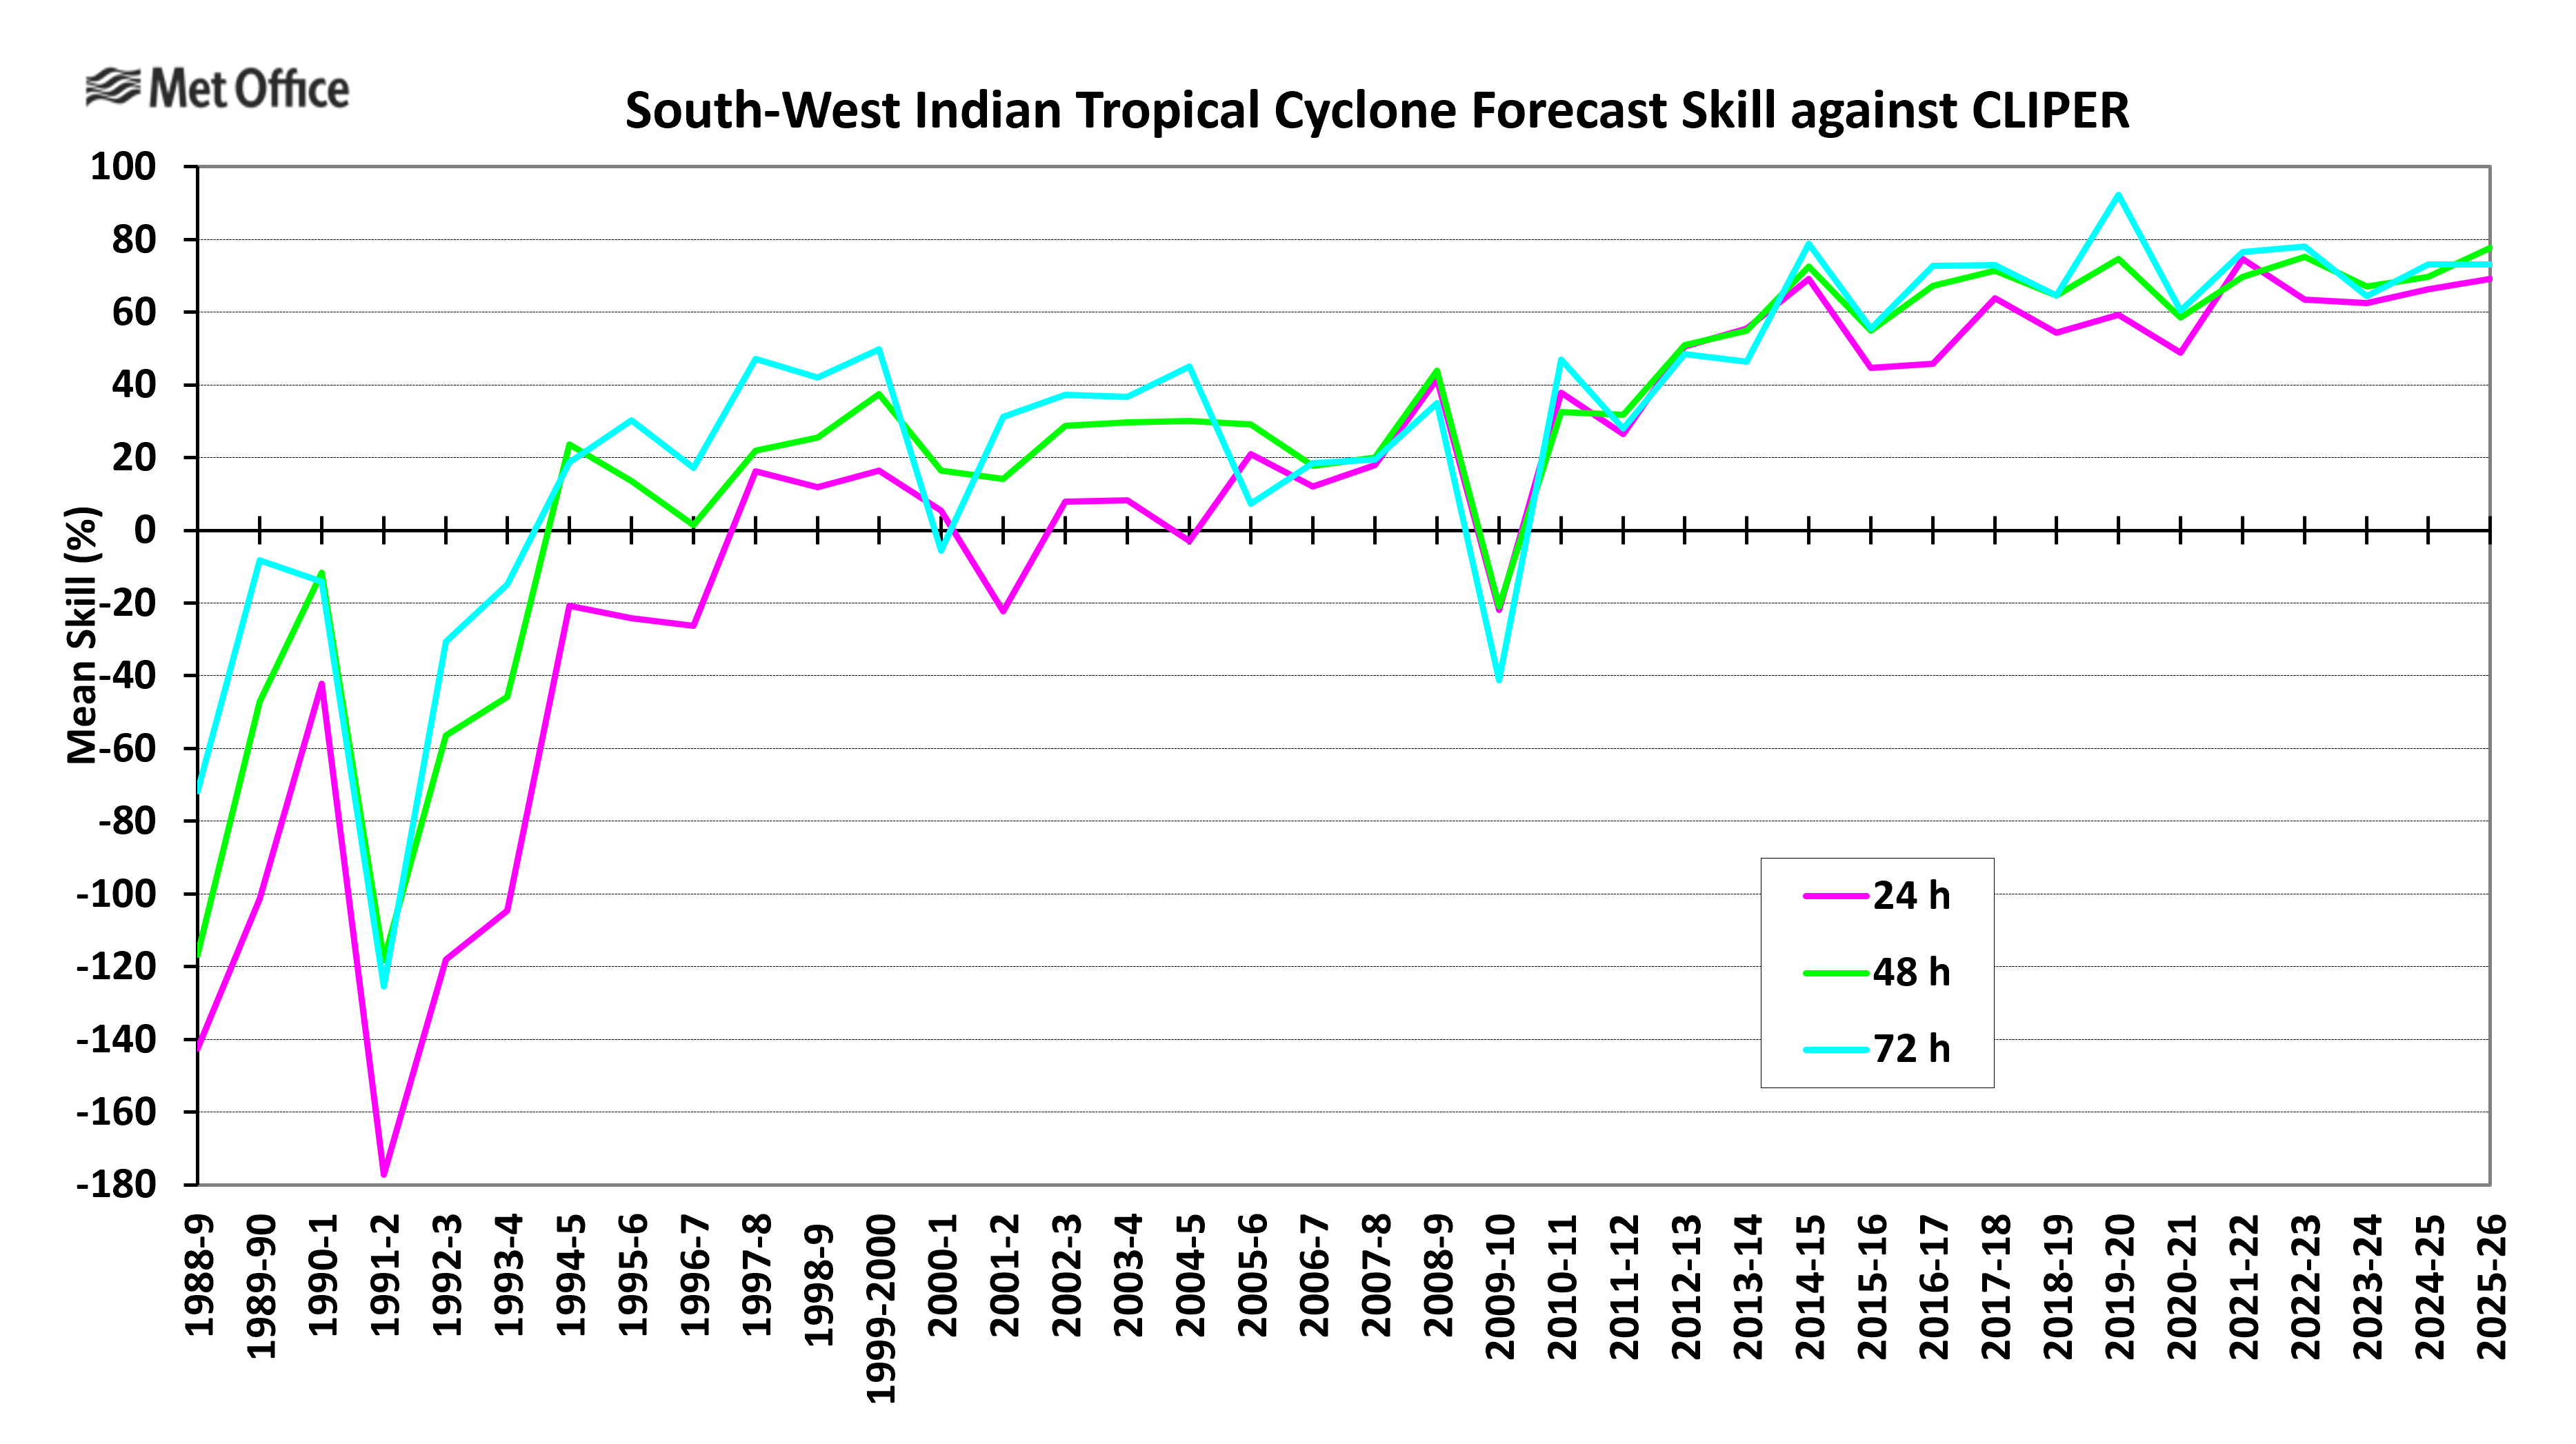
The number of tropical cyclones forming in the South-West Indian basin was similar to last season. Track forecast errors were lower than the five-year mean at all lead times apart from 168 hours. Skill scores against CLIPER were slightly higher than recent seasons. There was a small slow bias in forecasts. There was a small positive (weak) central pressure bias.
3.2 Australian basin storms
Table of mean error statistics
| T+0 | T+24 | T+48 | T+72 | T+96 | T+120 | T+144 | T+168 | |
| Cases verified | 170 | 126 |
94 |
73 |
58 |
46 |
37 |
29 |
| Detection rate (%) | 100 |
98 |
99 |
100 |
100 |
98 |
100 |
100 |
| AT error (km) | -3 | -23 | -20 | -16 | -21 |
22 |
33 |
19 |
| CT error (km) | -2 |
9 |
18 |
19 |
-11 | -38 | -61 | -114 |
| Track skill (%) | ***** | 72 |
78 |
84 |
***** | ***** | ***** | ***** |
| DPE (km) | 33 |
65 |
96 | 128 | 168 | 204 |
239 |
300 |
| * 2020-25 DPE (km) | 35 | 74 | 115 | 171 | 229 | 301 | 408 | 553 |
| Central pressure bias (mb) | 2.6 |
8.0 |
10.9 |
11.5 |
12.9 |
14.3 |
12.3 |
11.1 |
* DPE and skill for all Australian storms in the previous five seasons.
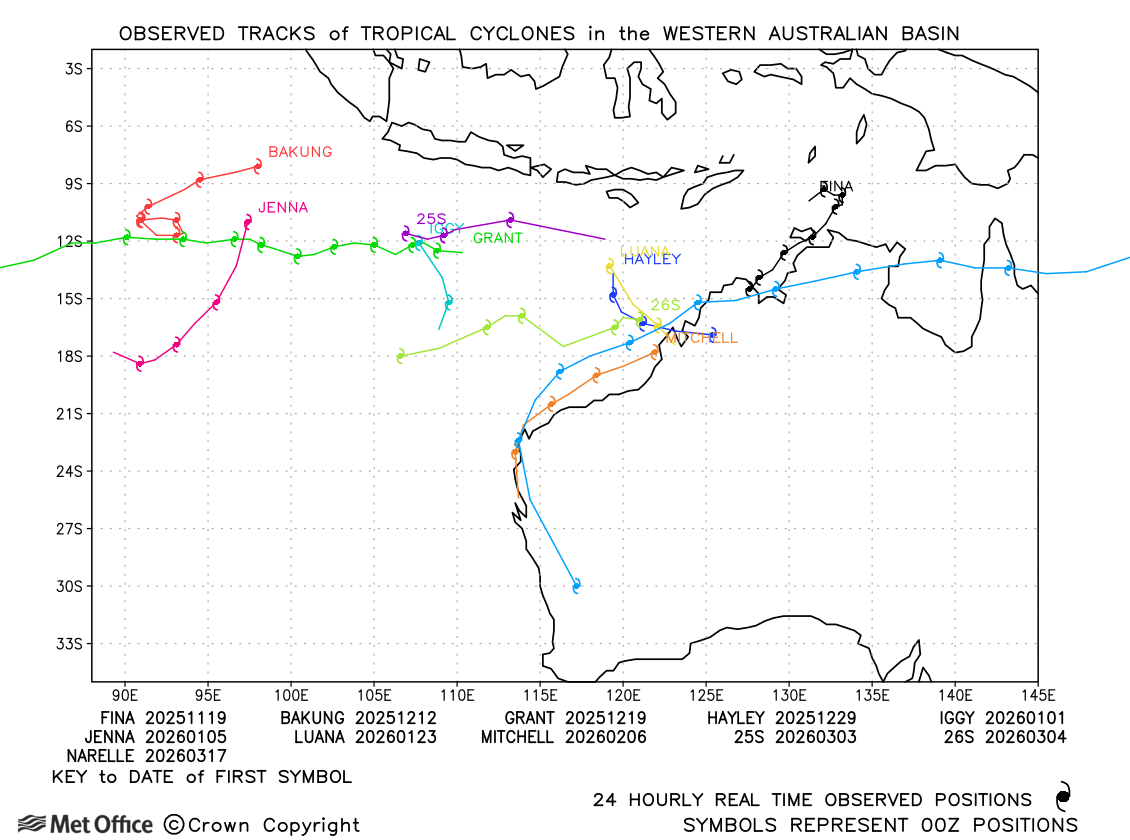
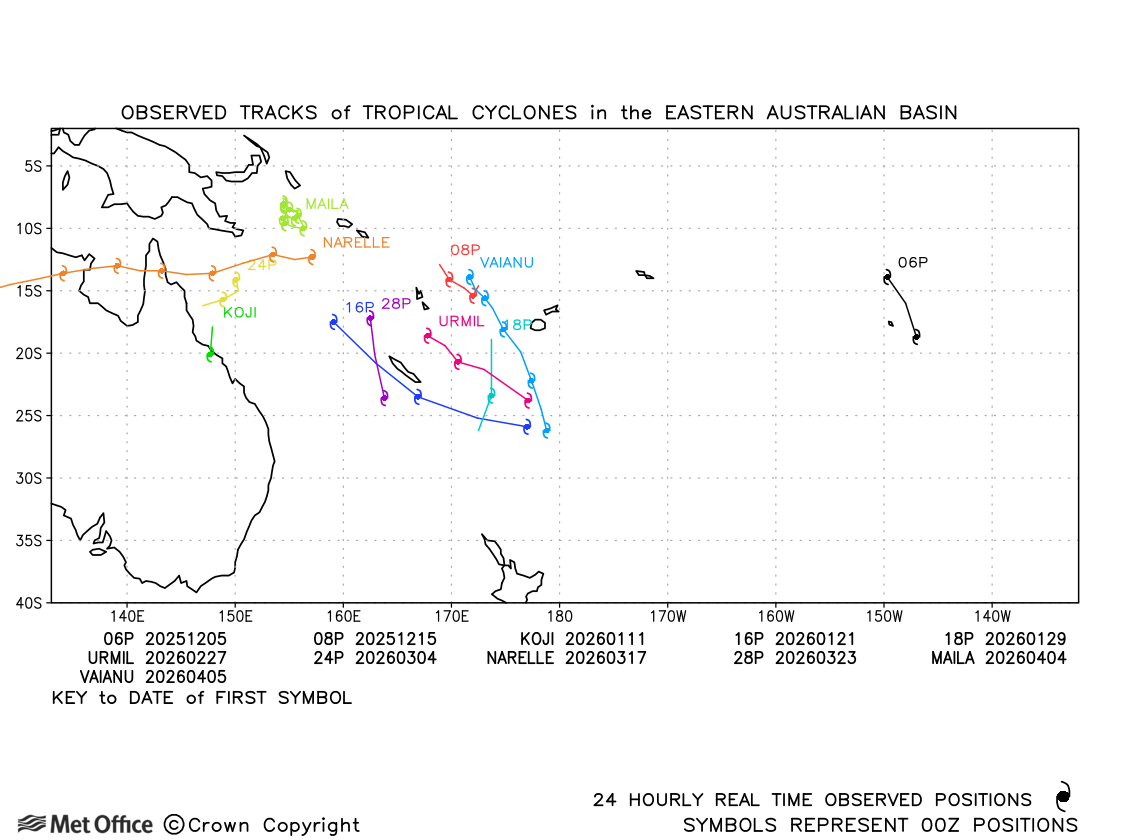
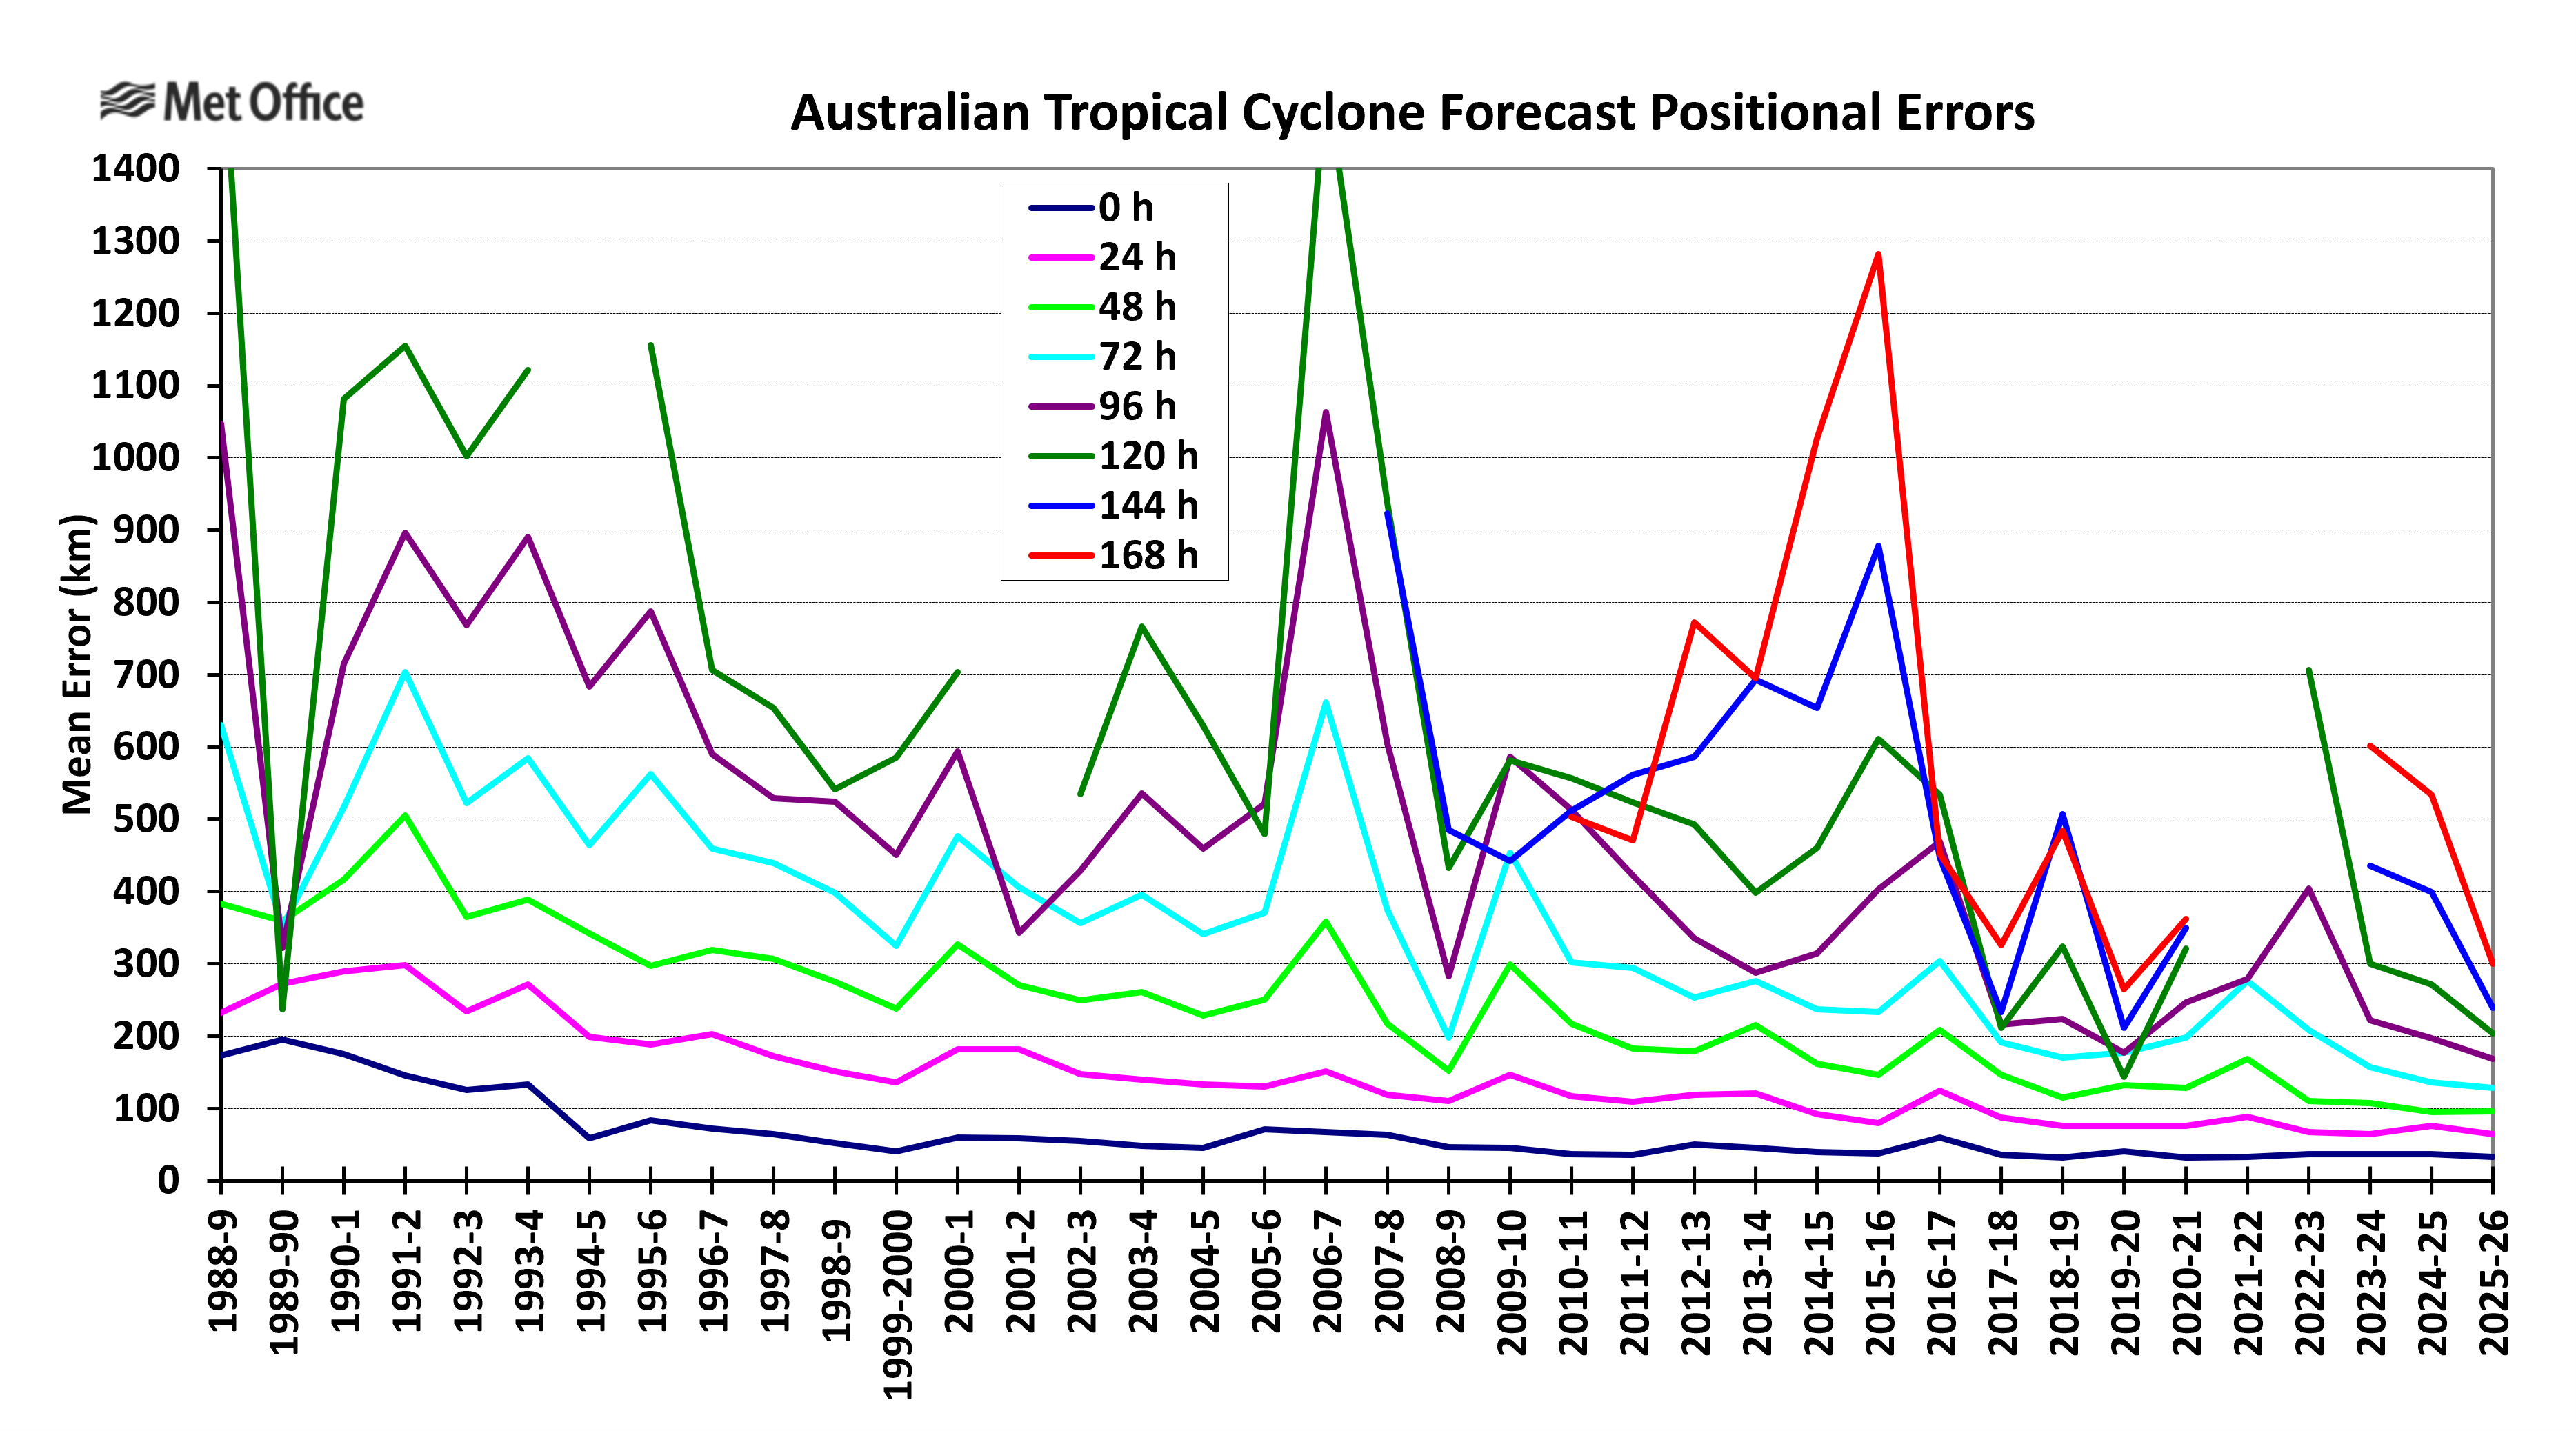
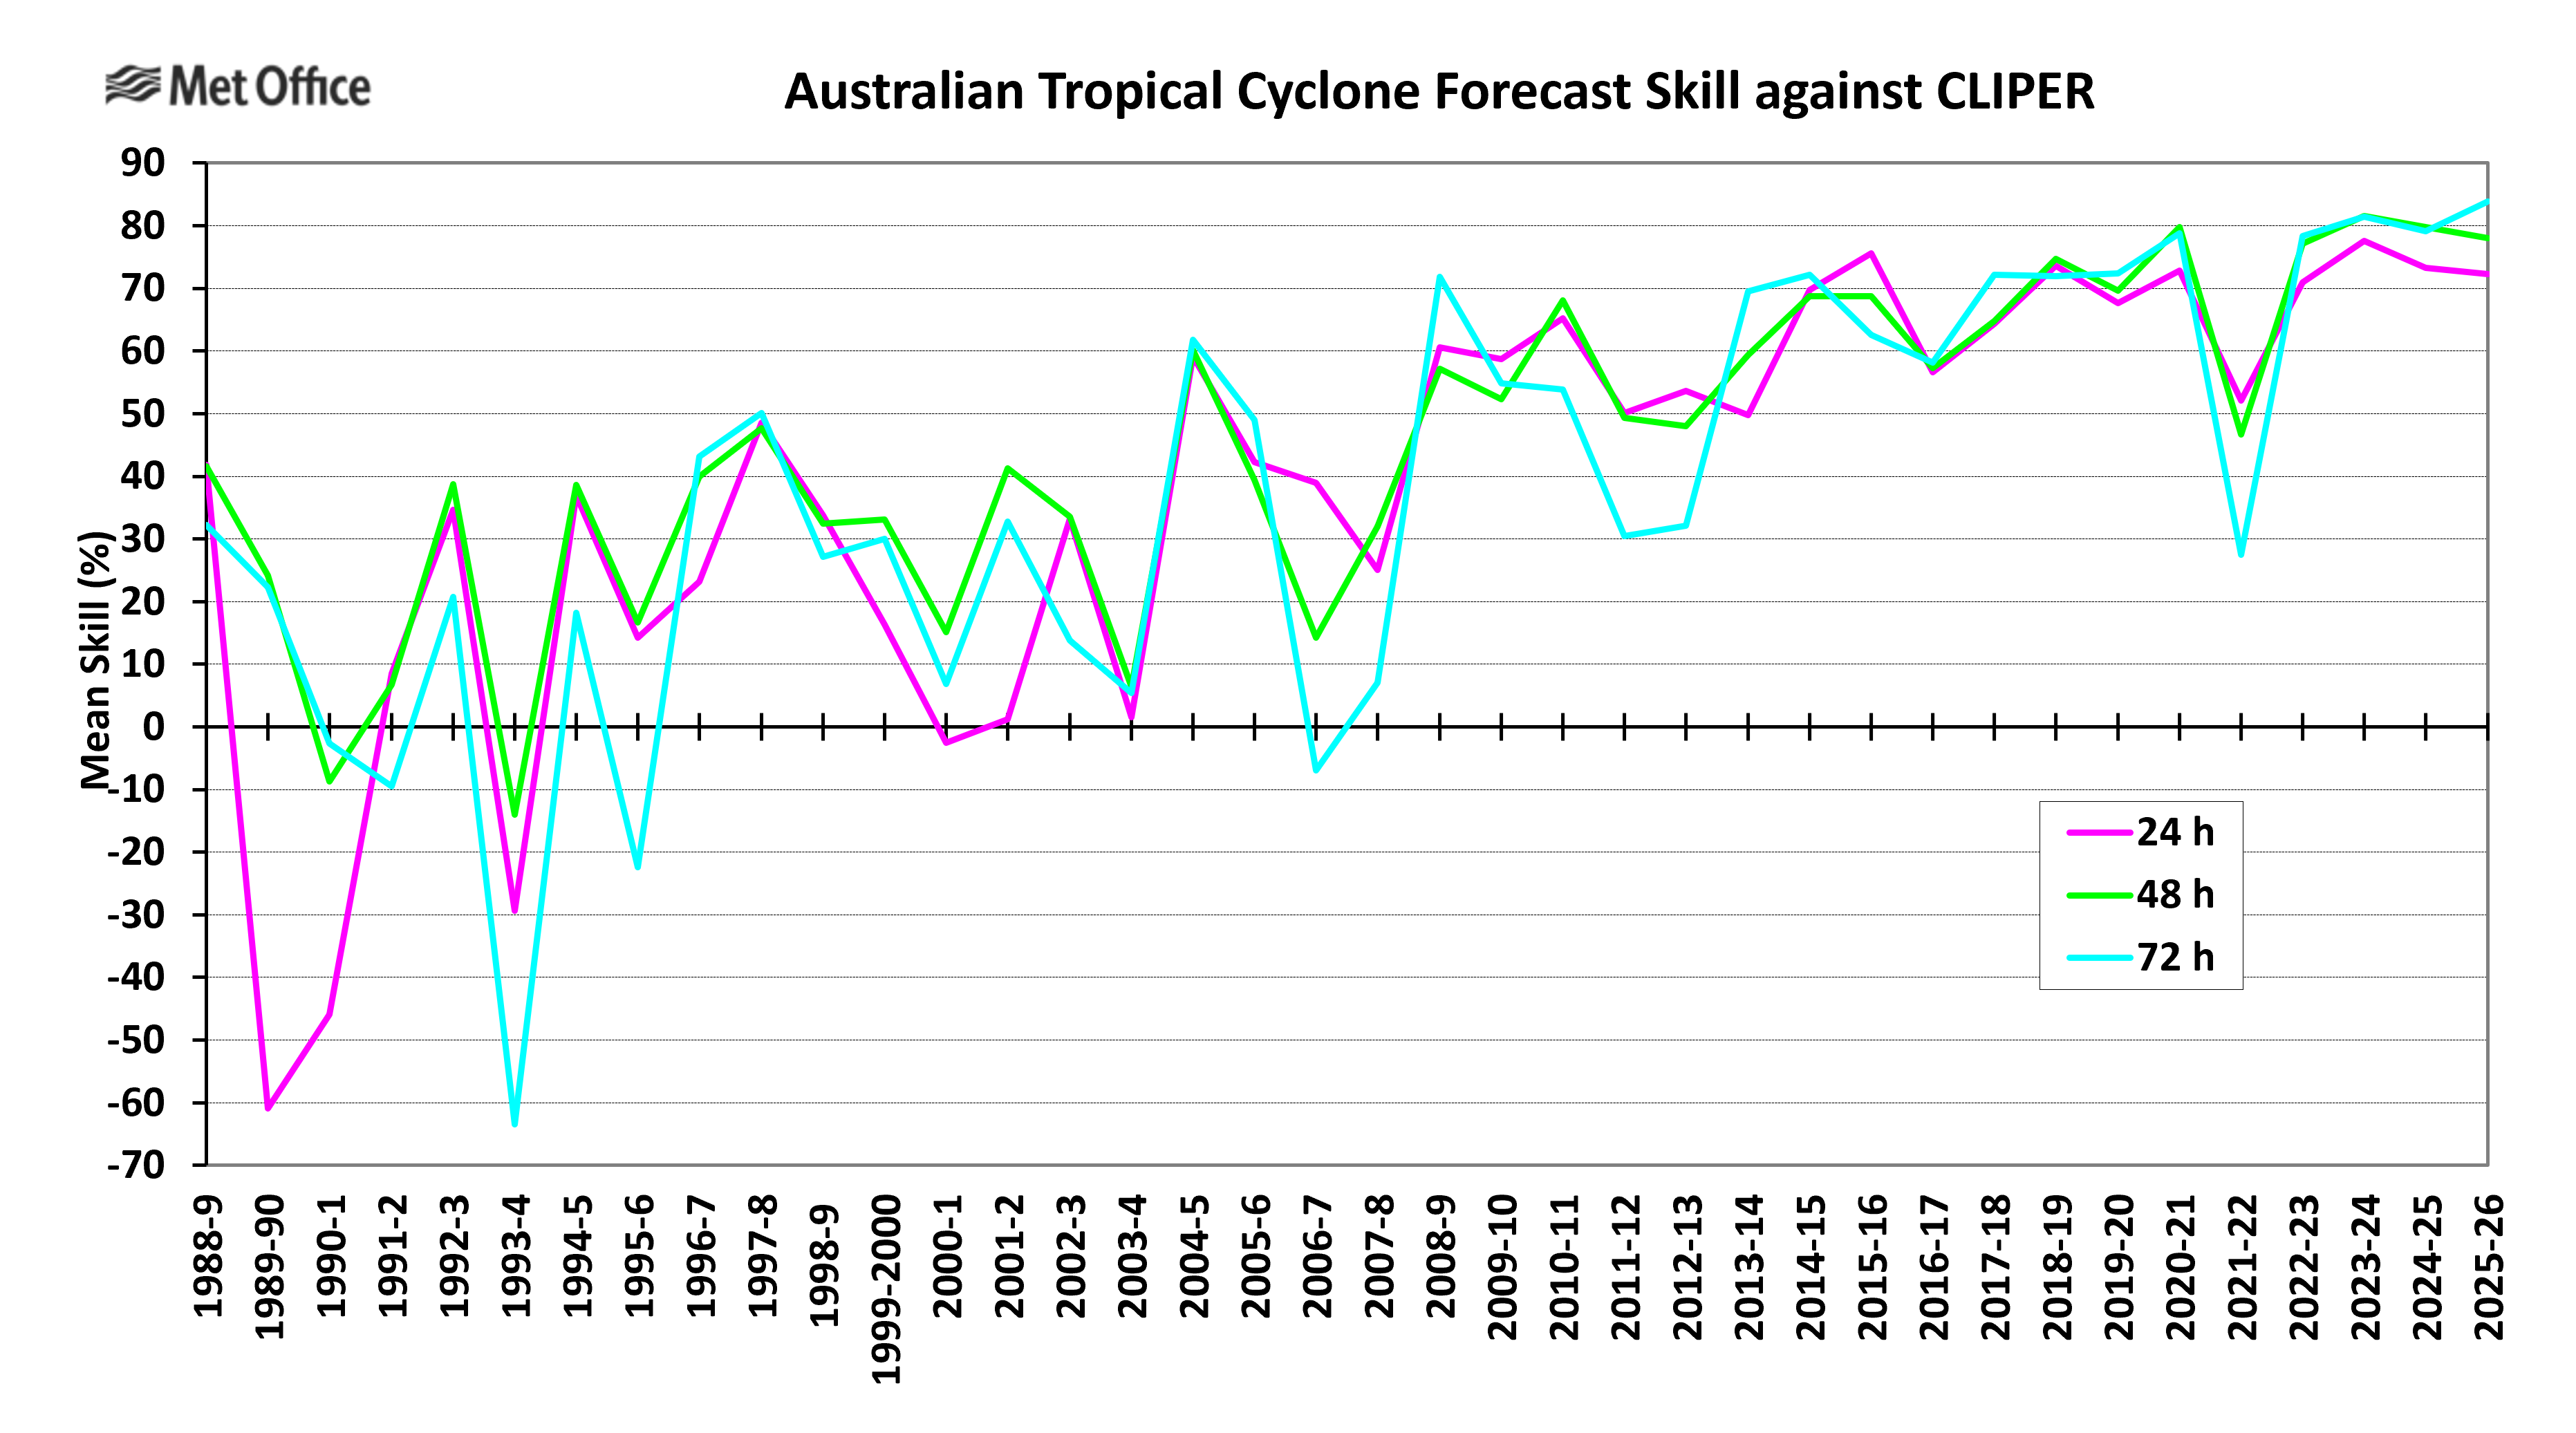
Activity was high in this basin as it was in the 2024-25 season. Track forecast errors were the lowest ever achieved at almost all lead times in over 35 years of evaluation. The along track error was small and mixed in sign. The central pressure bias was positive (weak) at all lead times.
3.3 South Atlantic basin storms
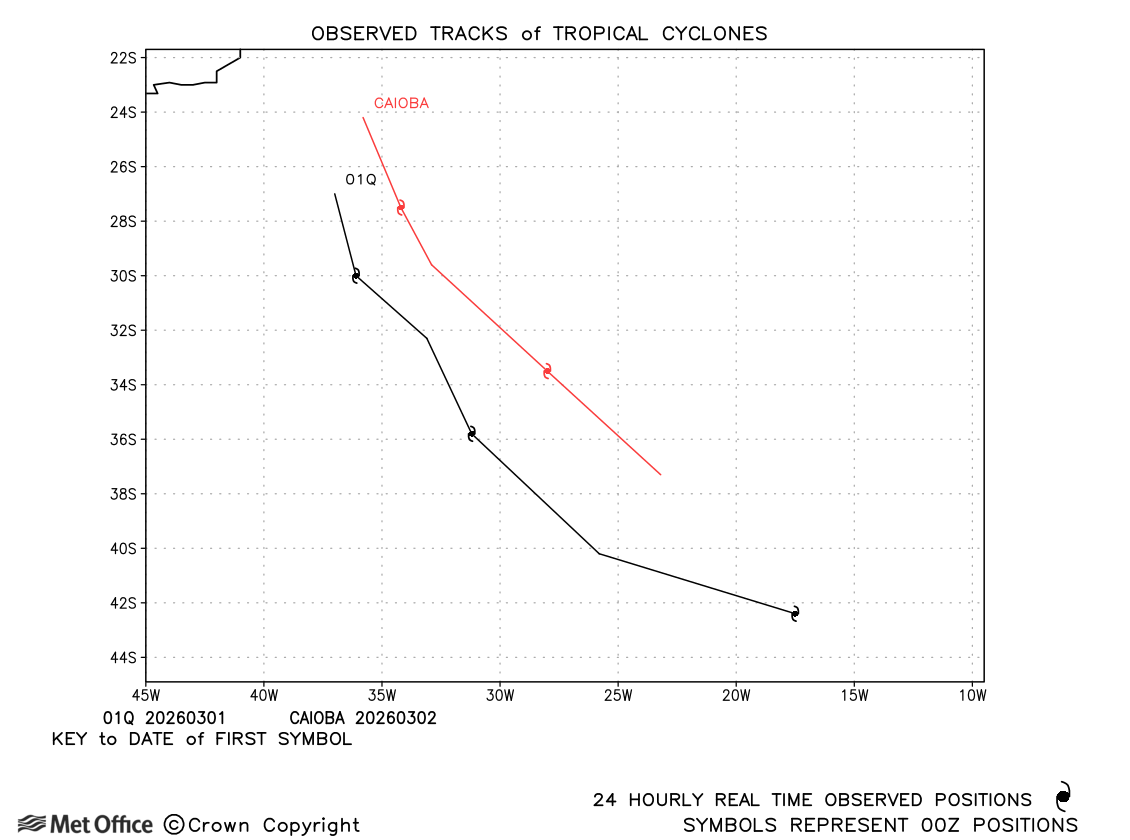
There was one subtropical storm and one subtropical depression in the South Atlantic this season.
3.4 Combined Statistics for whole Southern Hemisphere
Table of mean error statistics
| T+0 | T+24 | T+48 | T+72 | T+96 | T+120 | T+144 | T+168 | |
| Cases verified |
281 |
213 | 165 | 131 | 104 |
81 |
63 |
47 |
| Detection rate (%) | 100 |
99 |
99 |
100 |
100 |
99 |
100 |
100 |
| AT error (km) |
0 |
-17 | -20 | -27 | -41 | -28 |
7 |
-46 |
| CT error (km) |
1 |
10 |
21 |
26 |
-9 |
-59 |
-53 |
22 |
| Track skill (%) | ***** | 71 | 78 |
80 |
***** | ***** | ***** | ***** |
| DPE (km) | 34 |
64 |
95 |
137 |
193 |
254 |
309 |
418 |
| * 2020-25 DPE (km) | 36 | 76 | 126 | 185 | 248 | 324 |
418 |
501 |
| Central pressure bias (mb) |
1.4 |
6.2 | 8.7 |
9.4 |
11.0 |
11.3 |
10.6 |
11.8 |
* DPE and skill for all southern hemisphere storms in the previous five seasons.
Tropical cyclone activity in the southern hemisphere was high this season - at similar levels to the 2024-25 season.
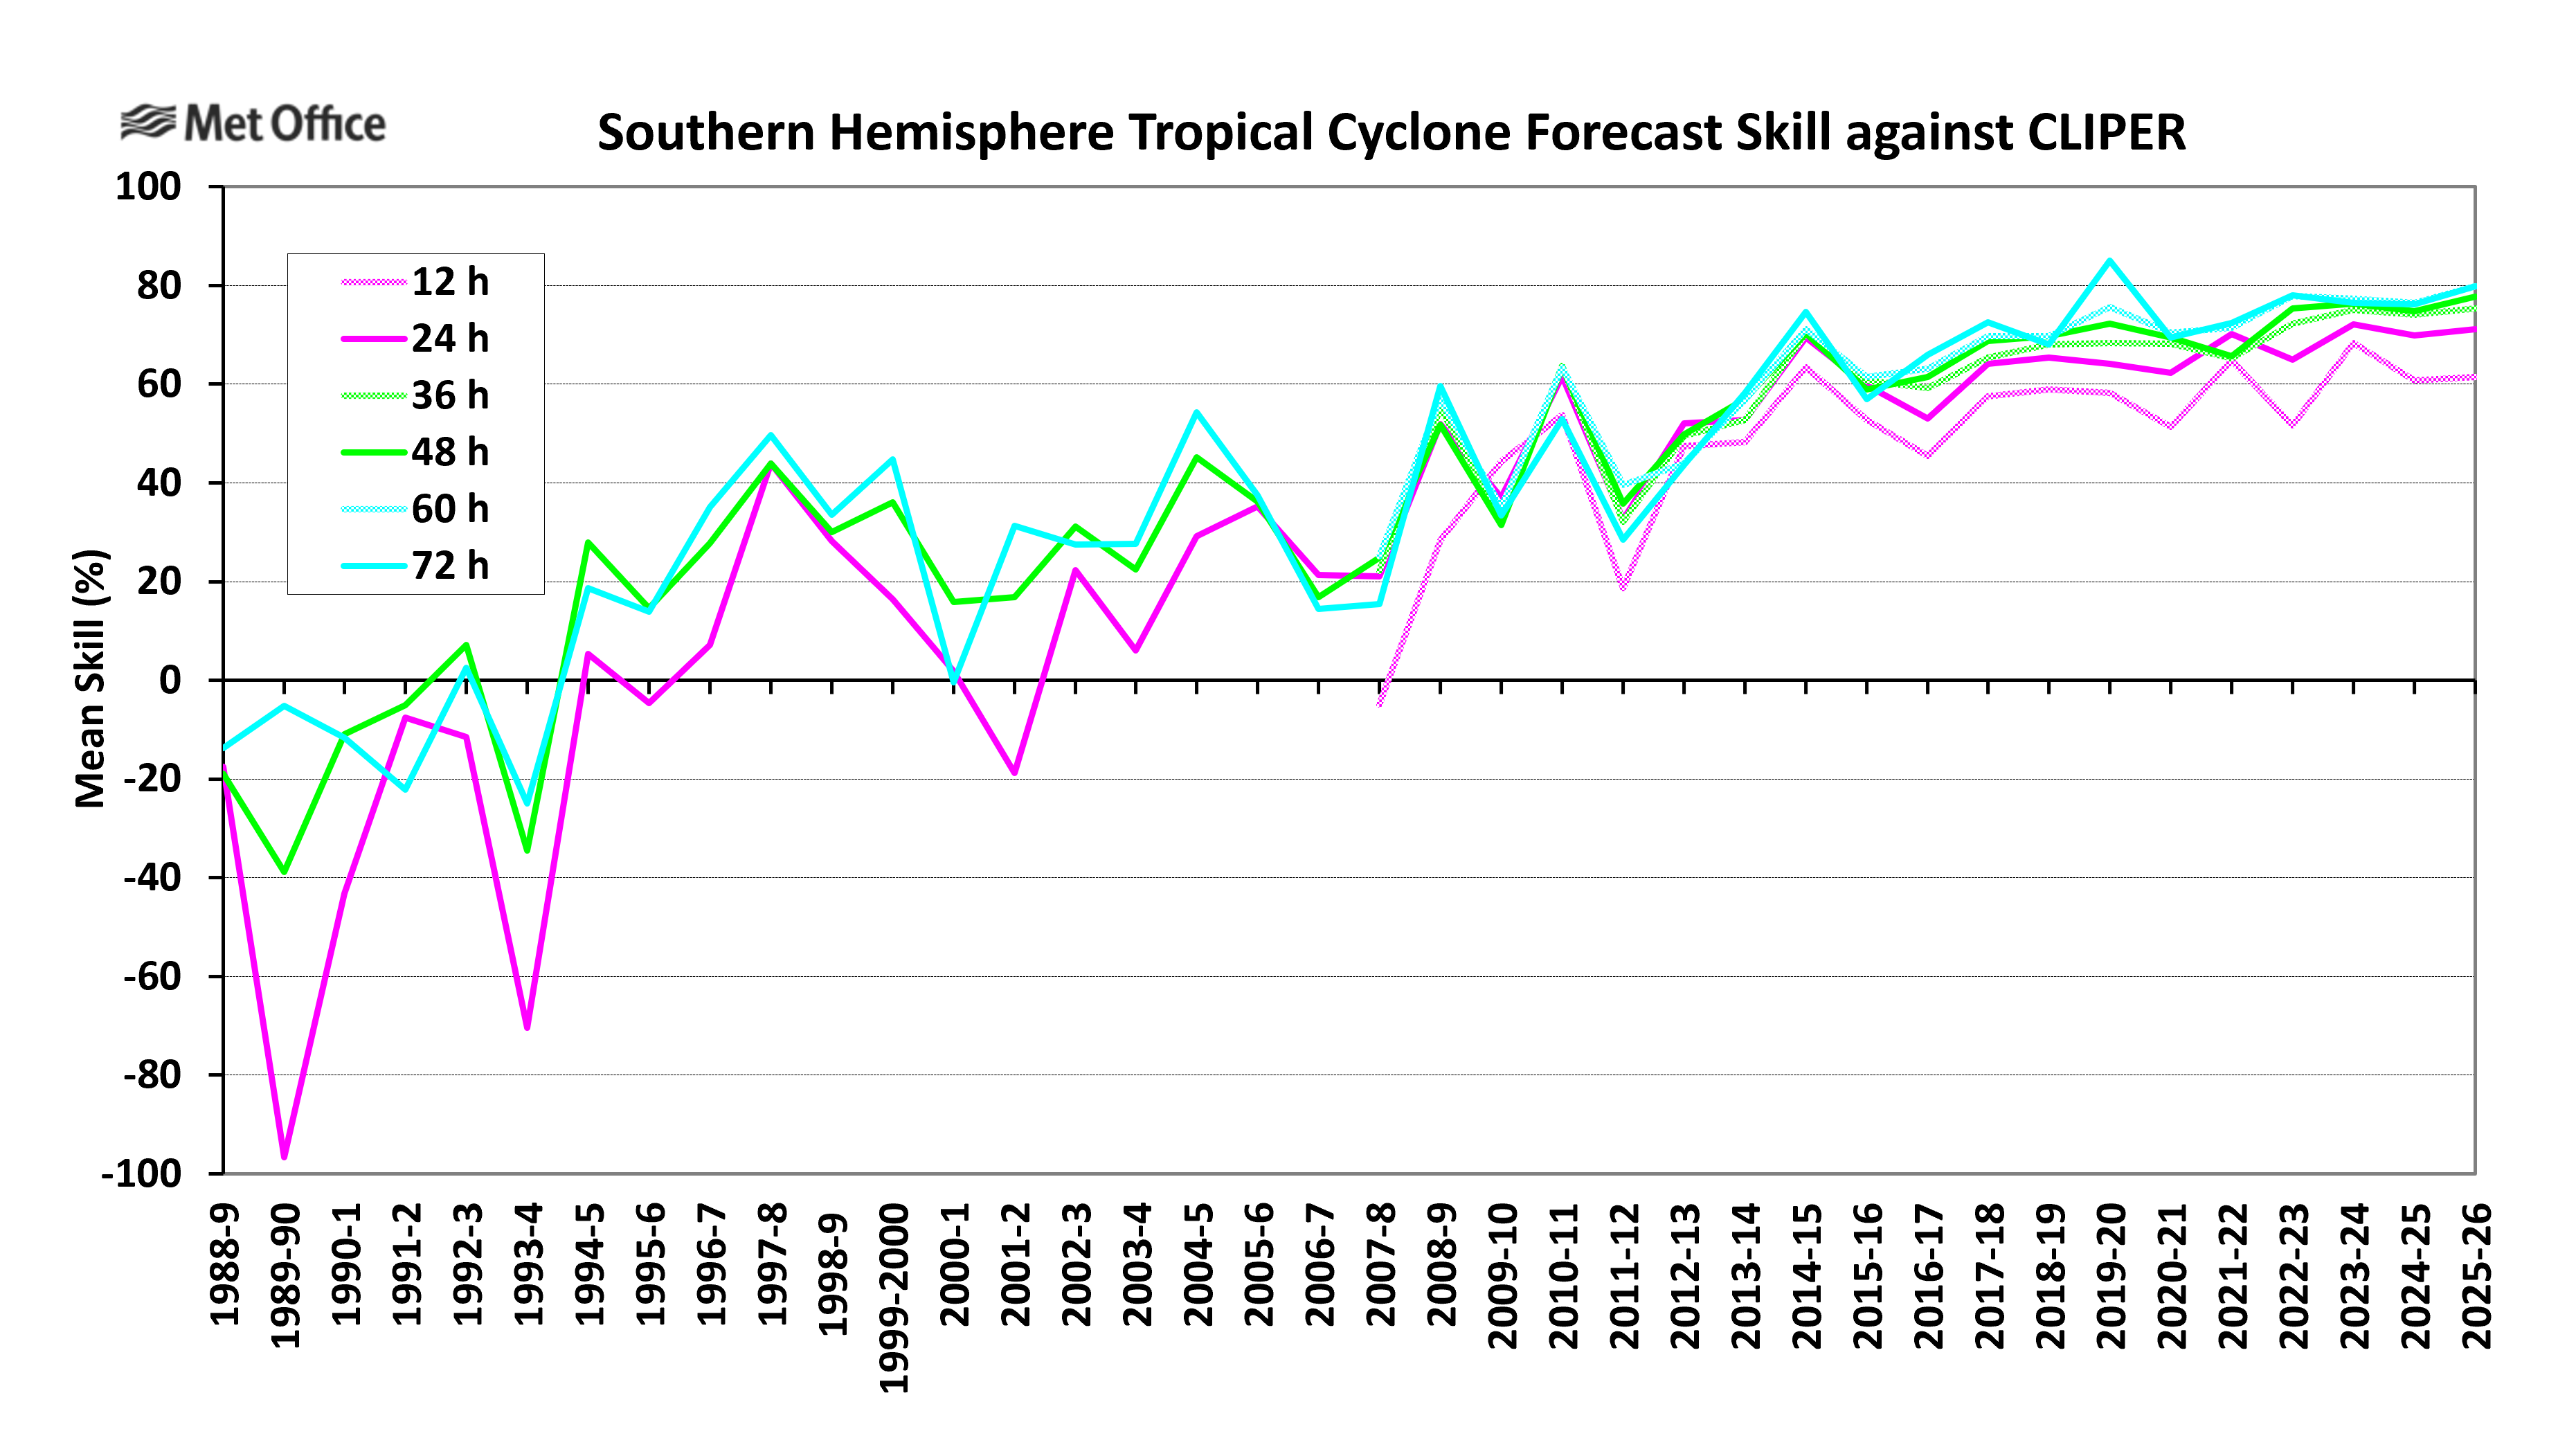
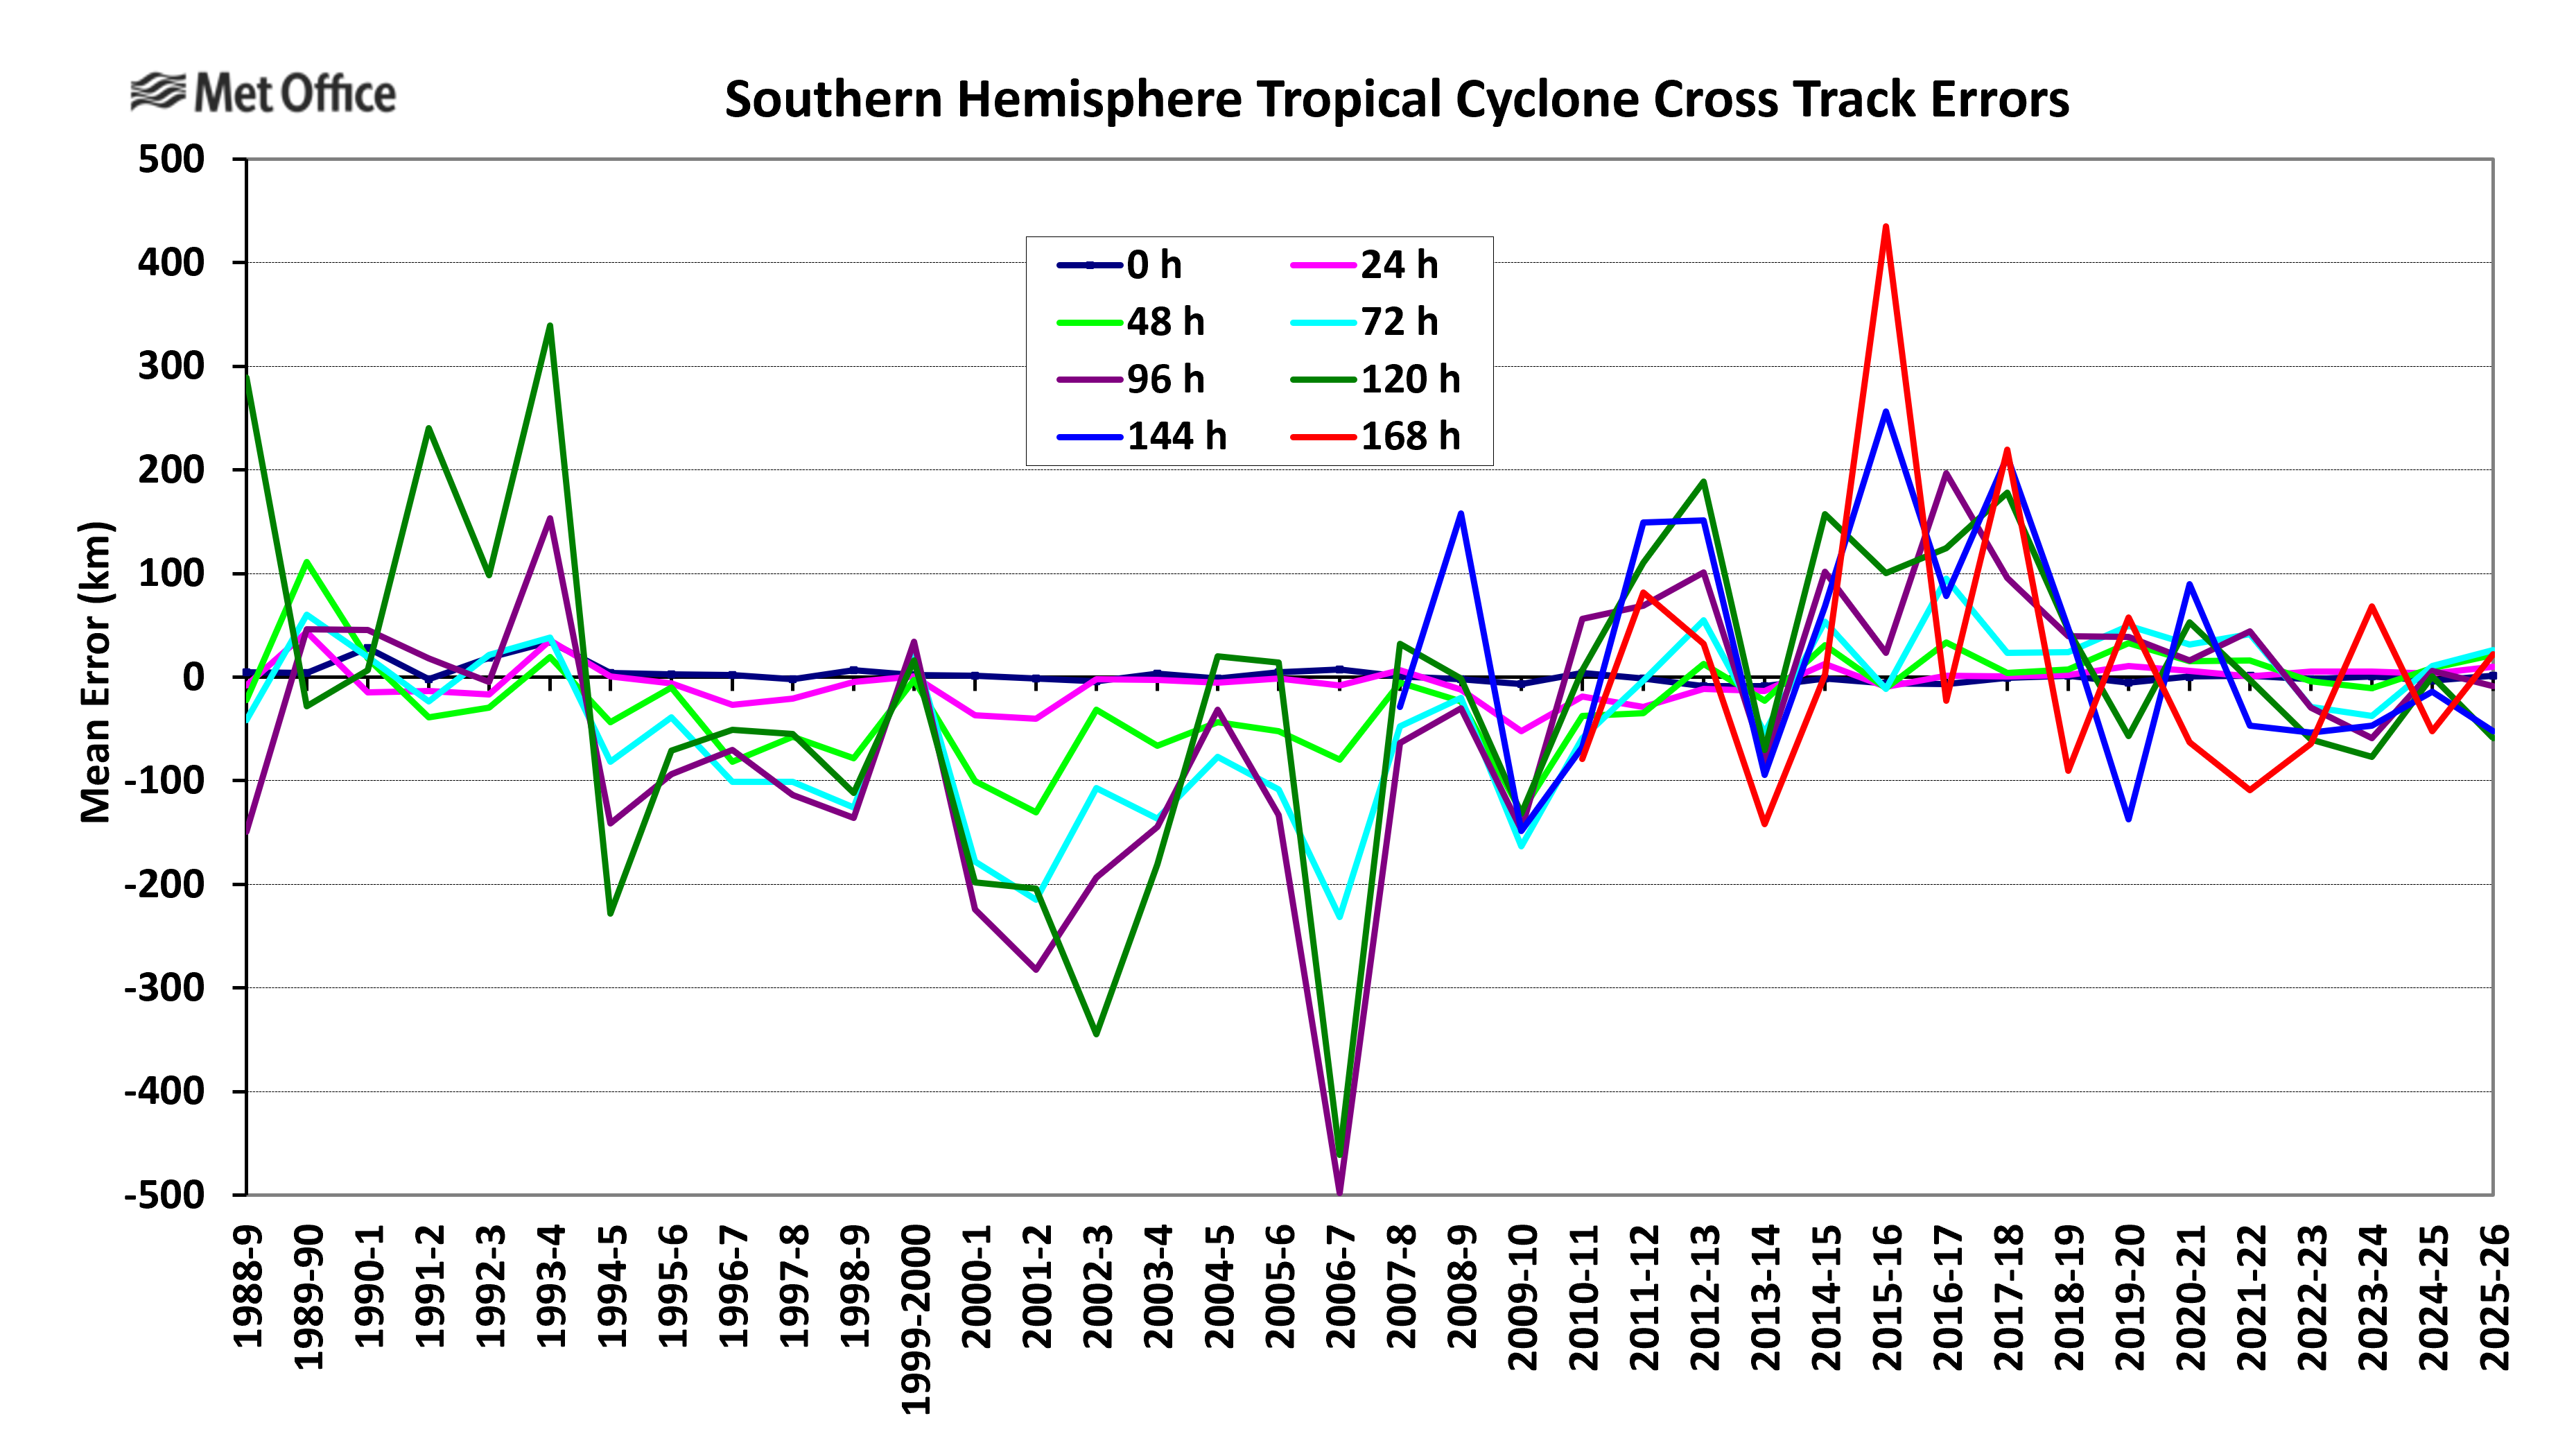
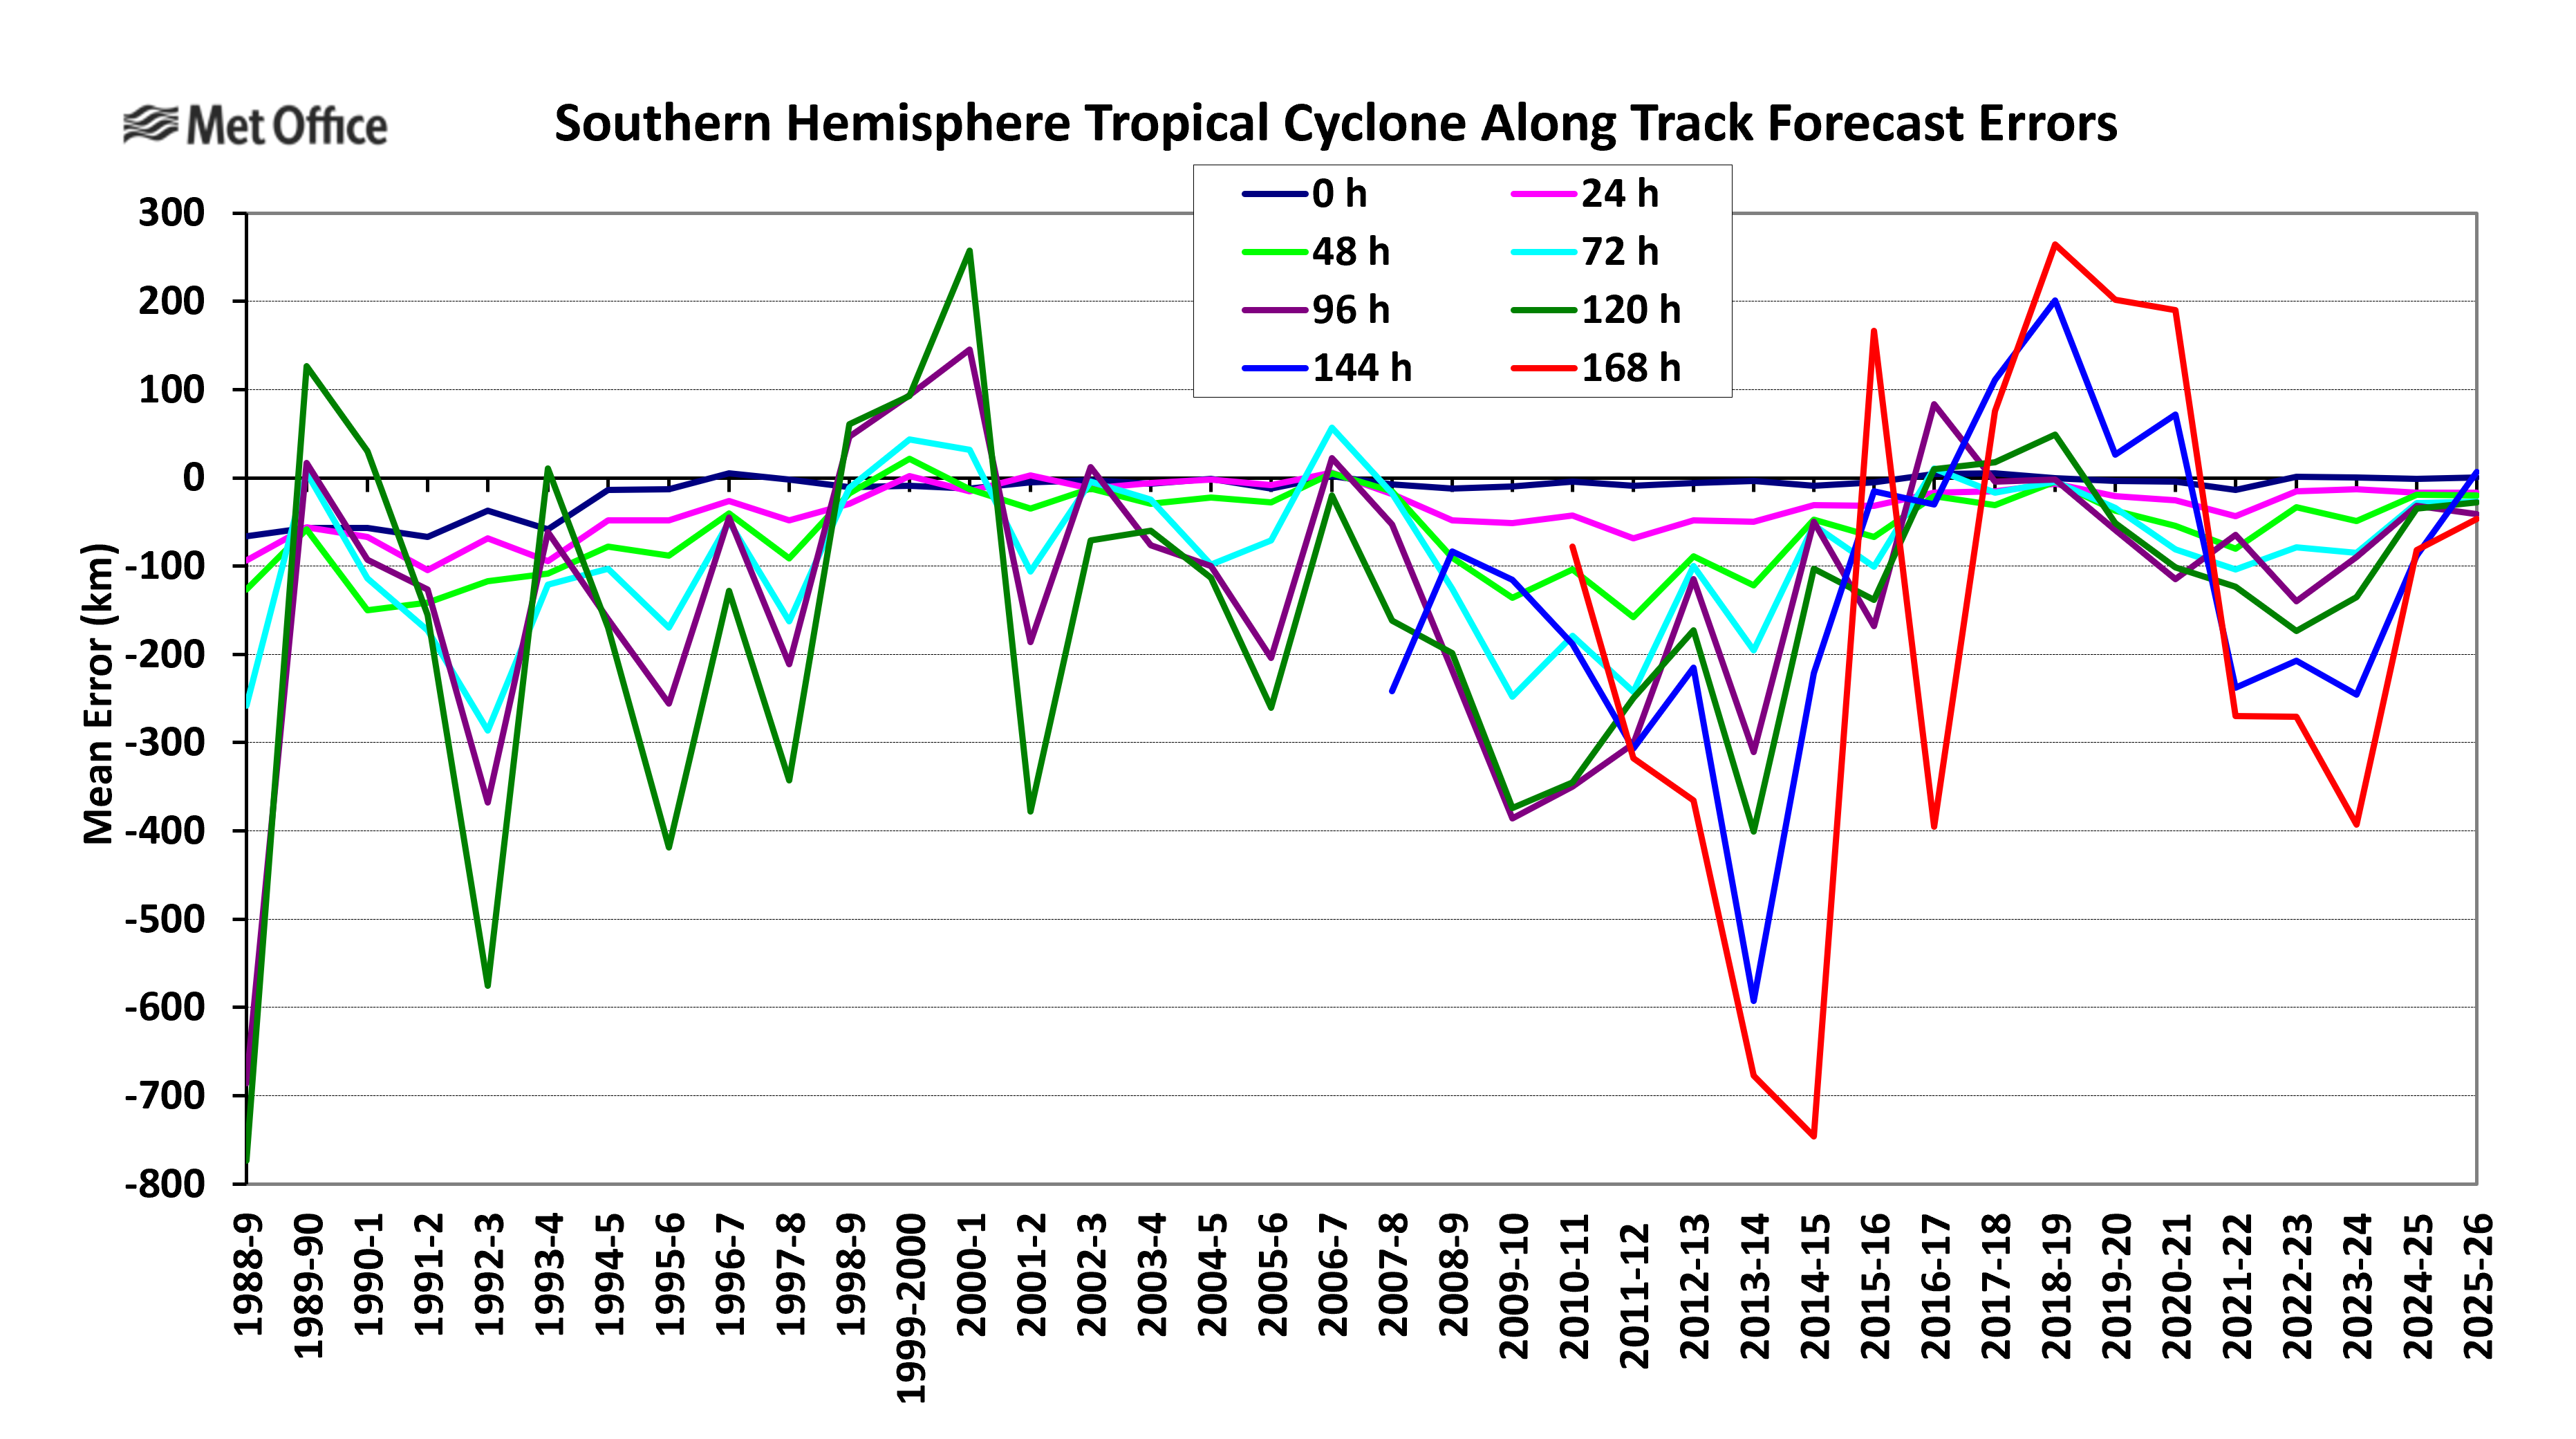
Track forecast errors were lower than the five-year mean at all lead times and were the lowest or second lowest at most lead times in over 35 years of evaluation. Skill scores against CLIPER were also high. There was a small slow bias in forecasts at most lead times.
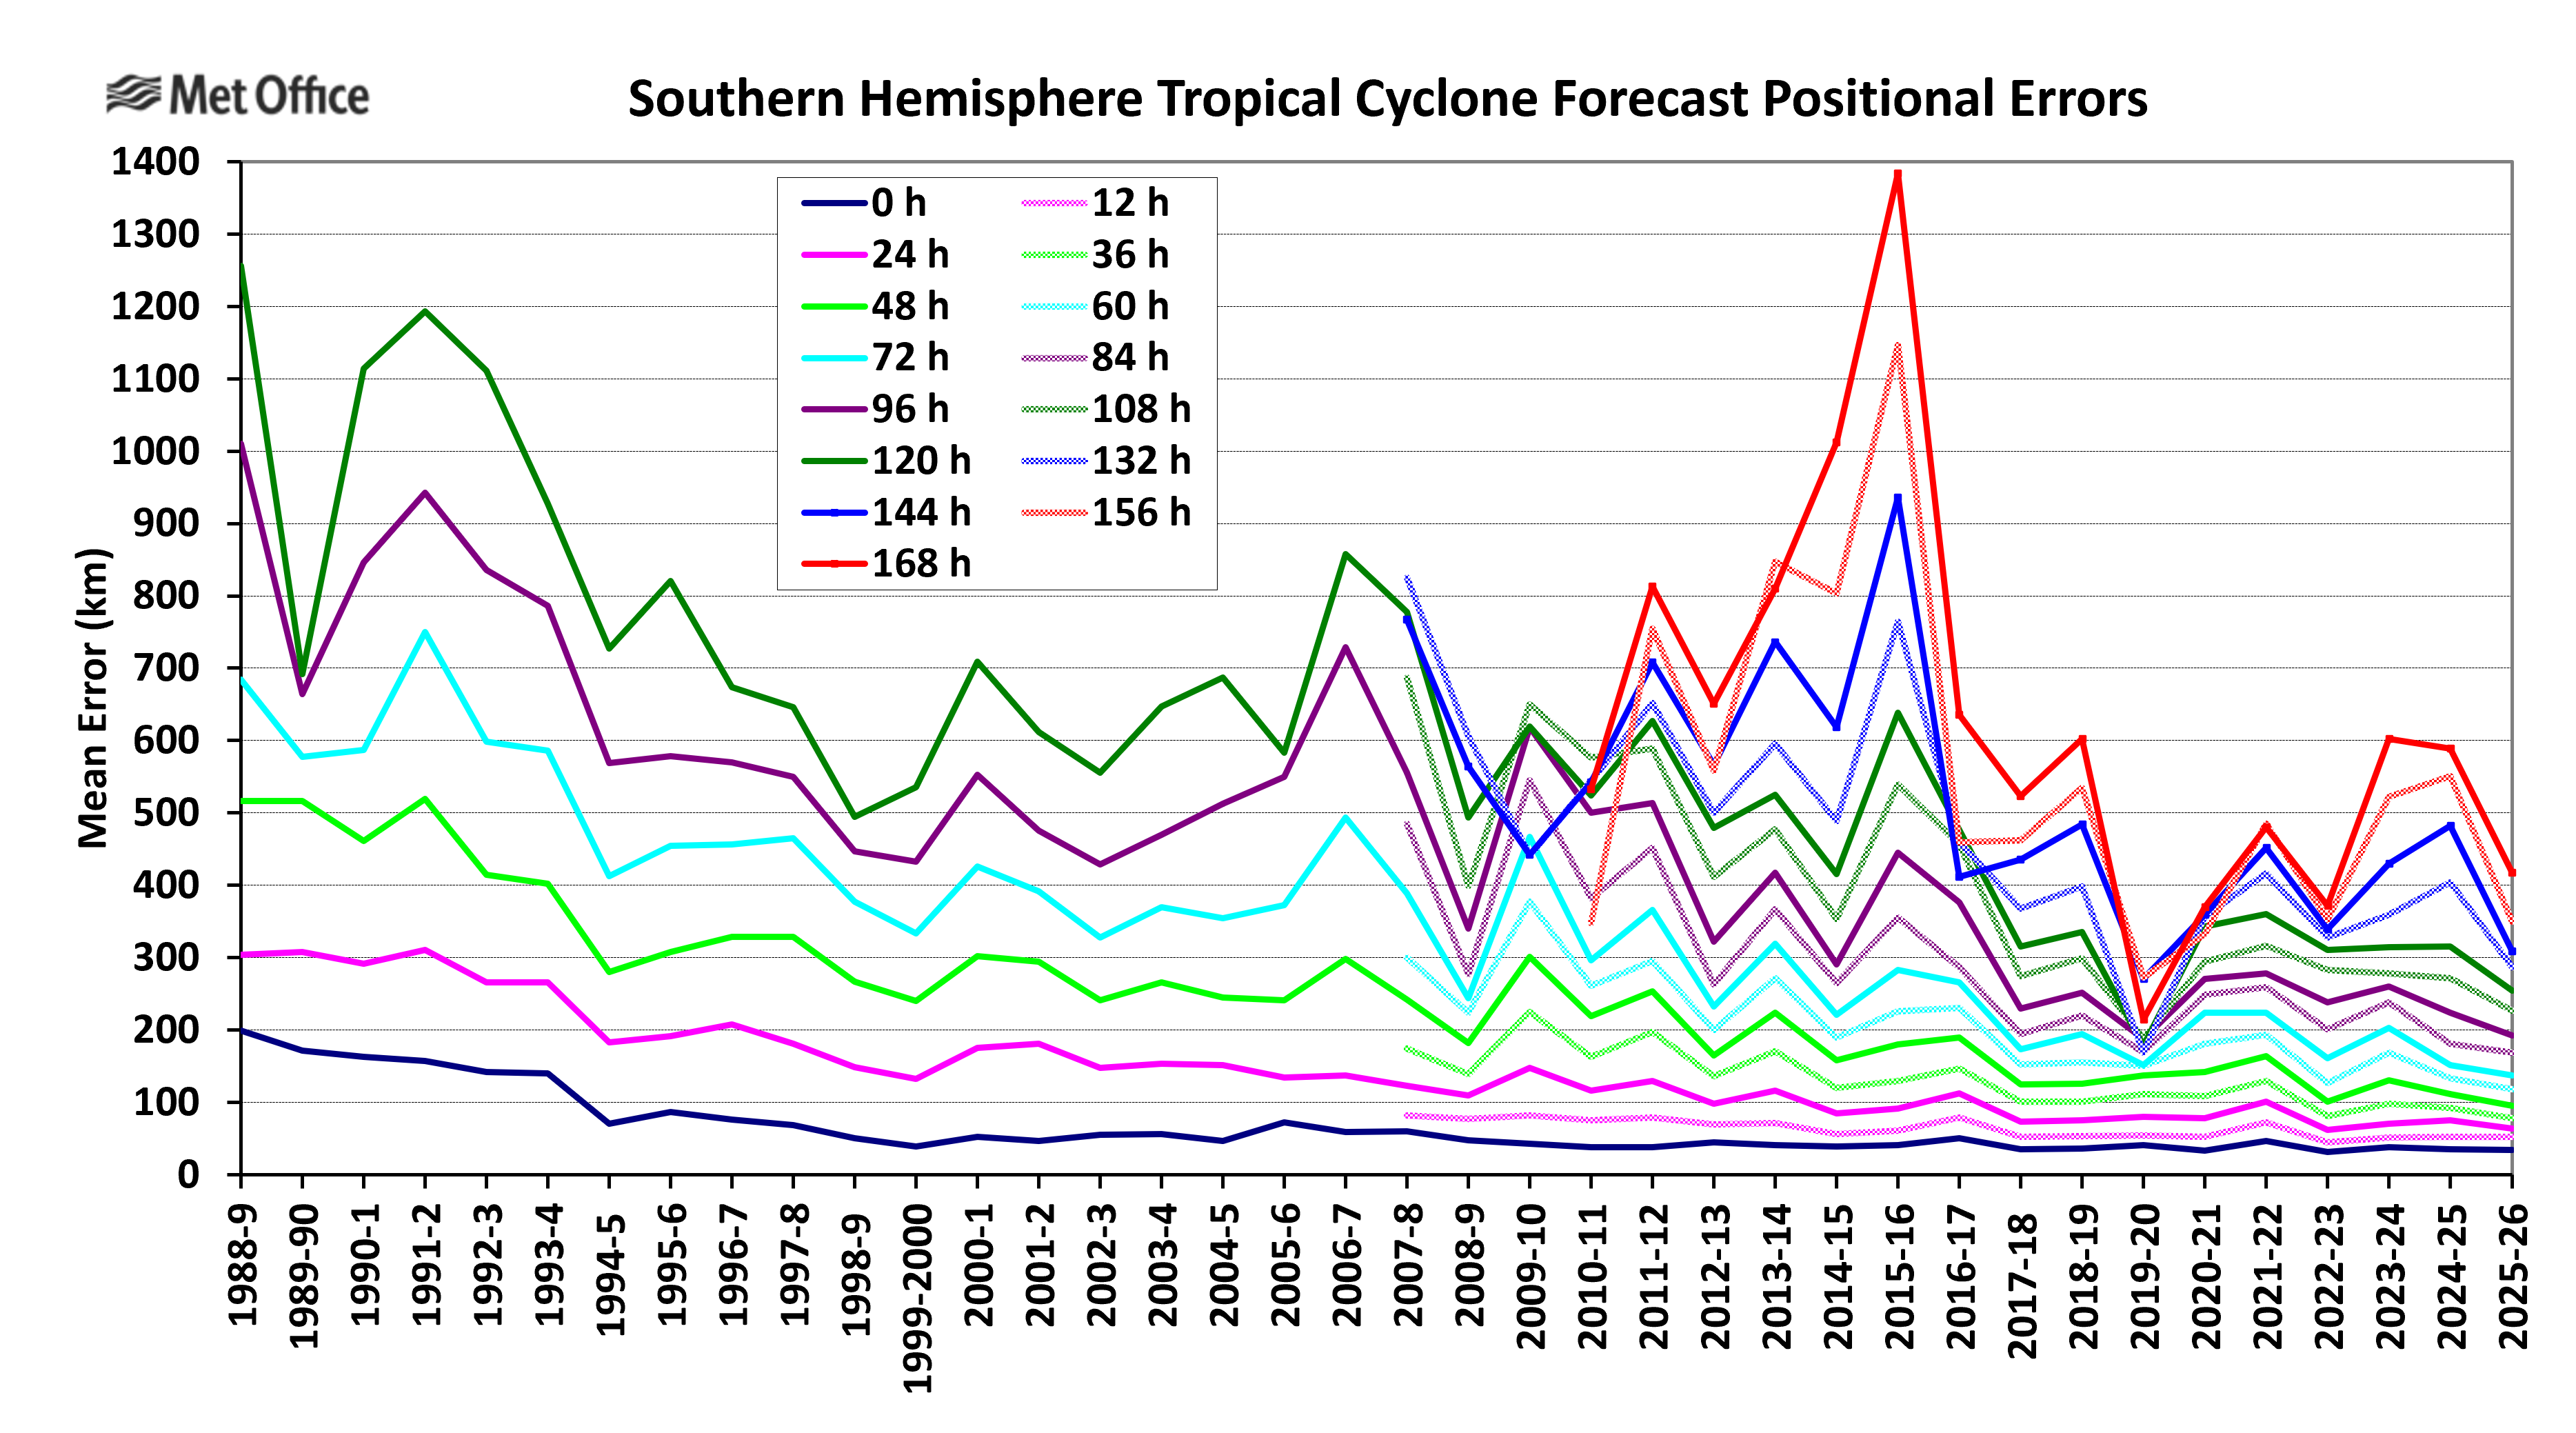
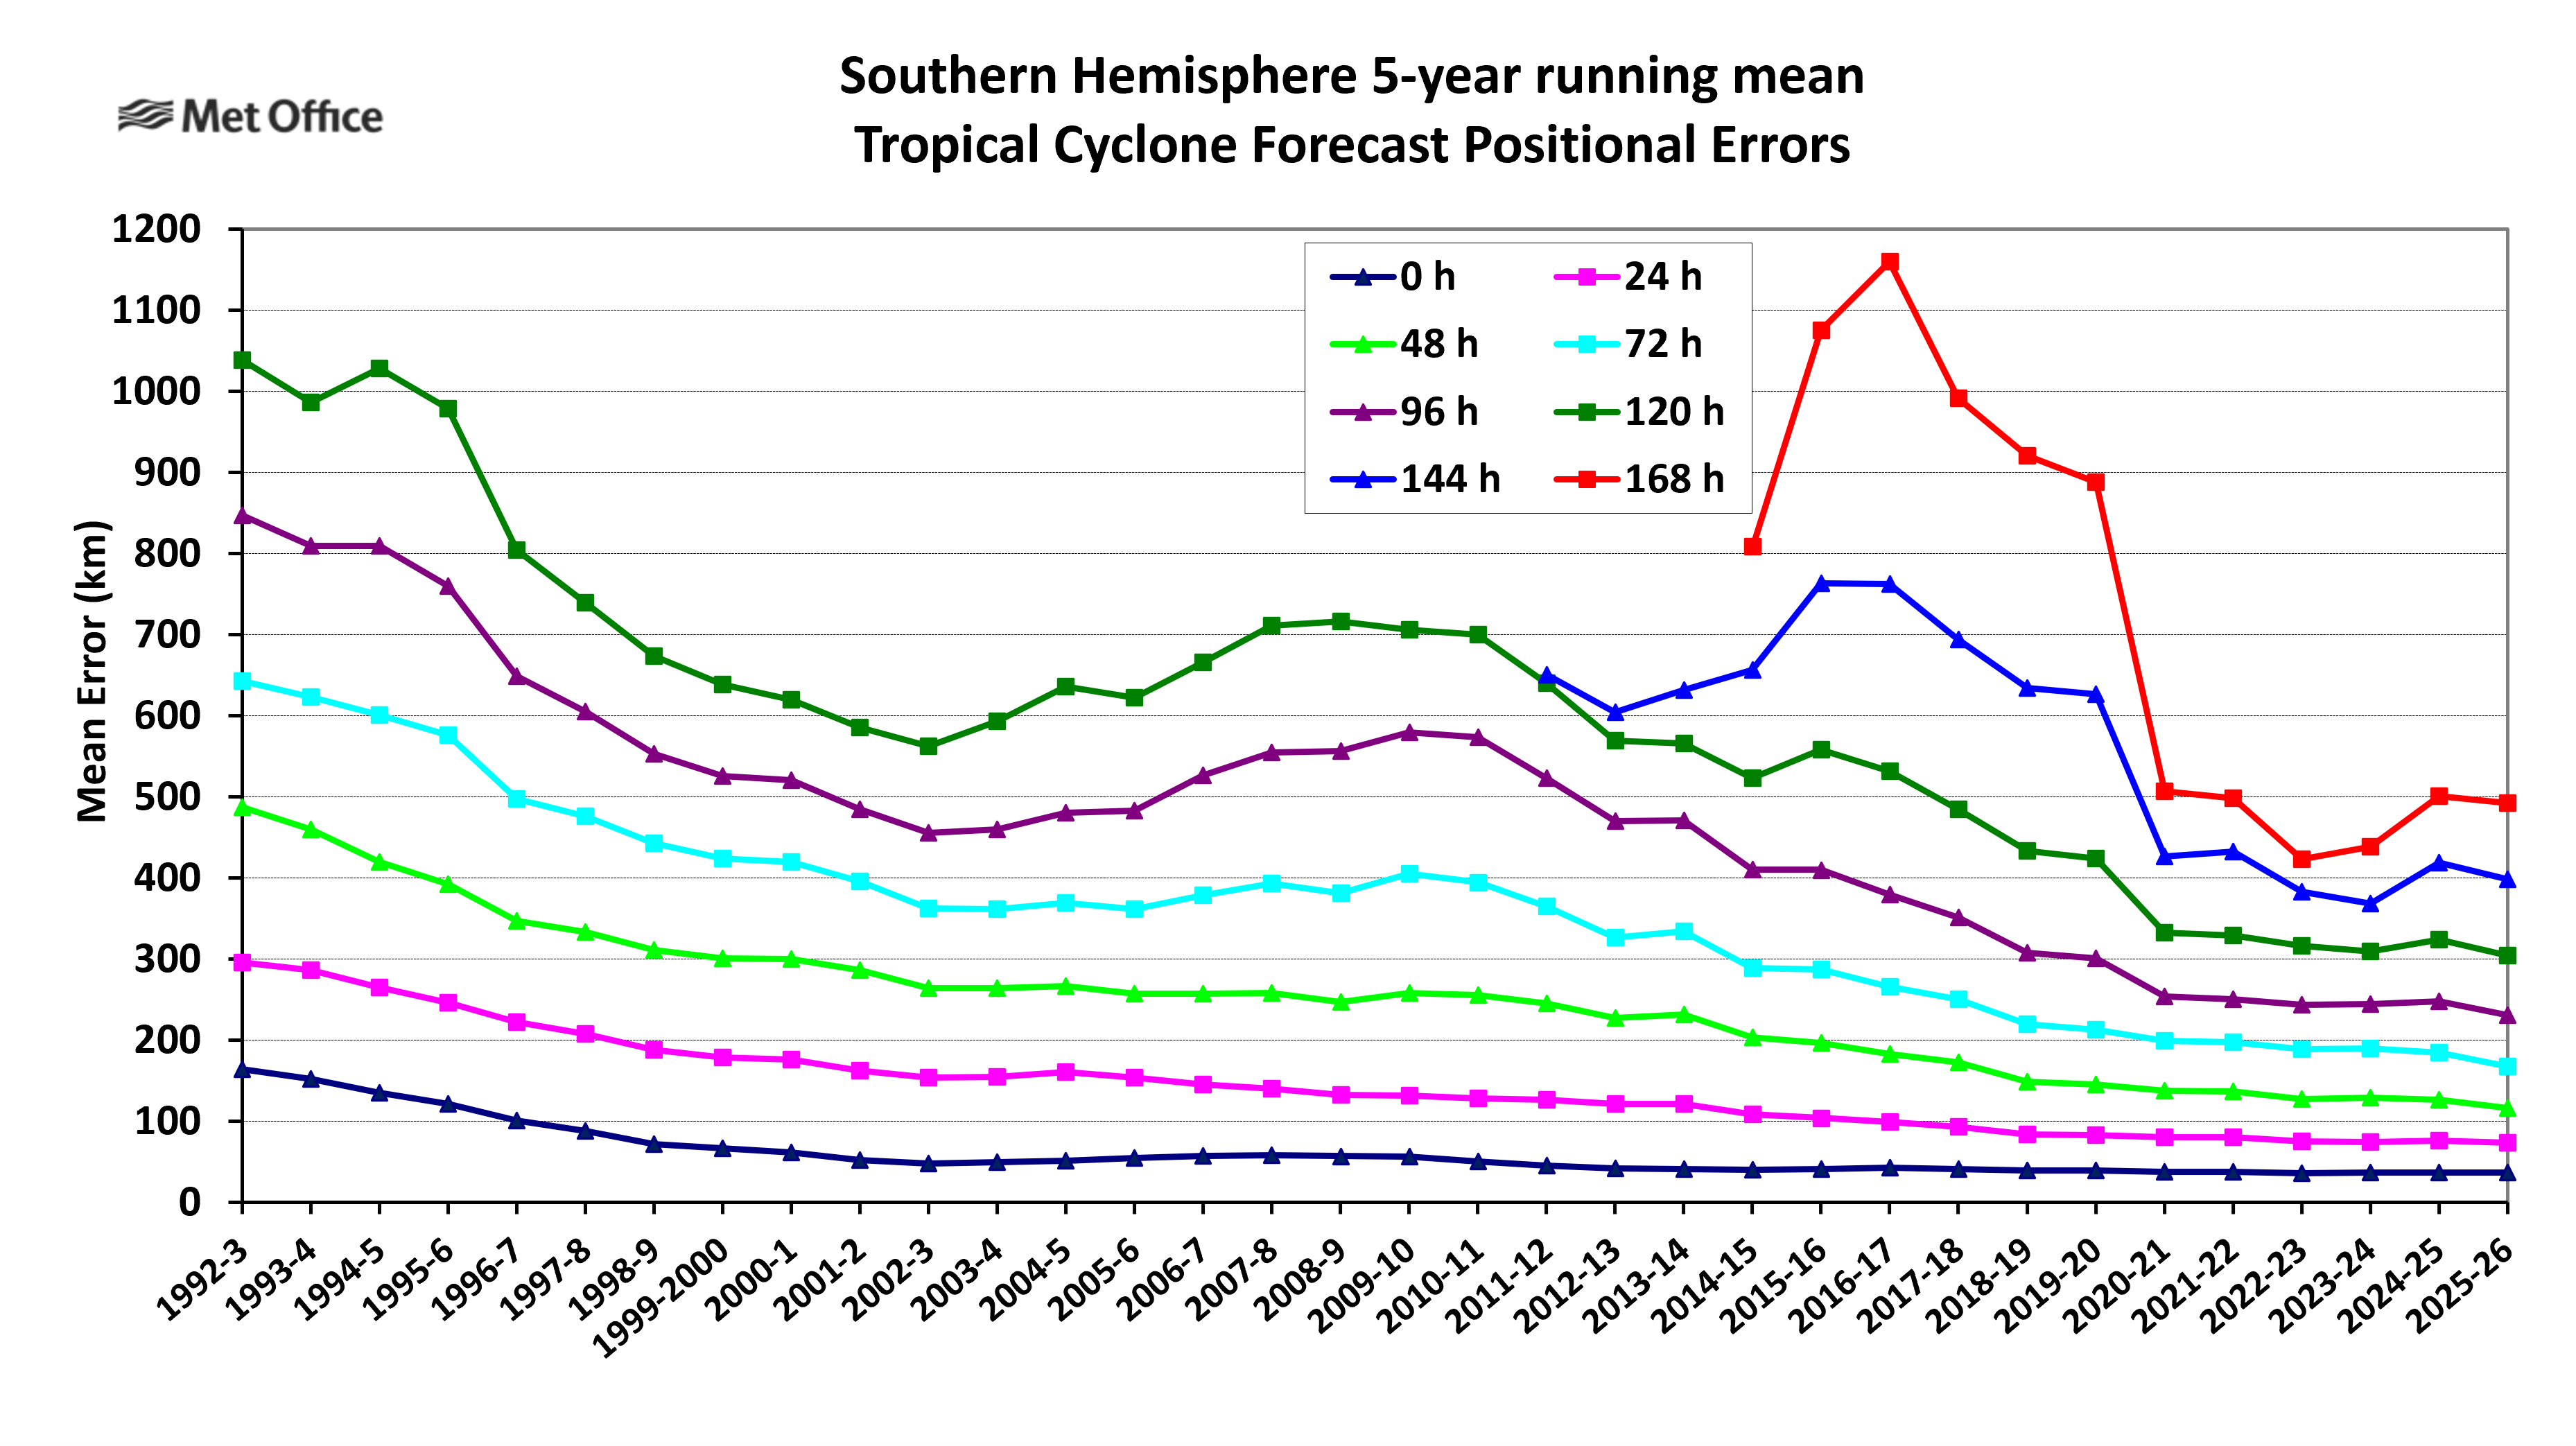
The five-year running mean of track forecast errors saw a reduction at all lead times.
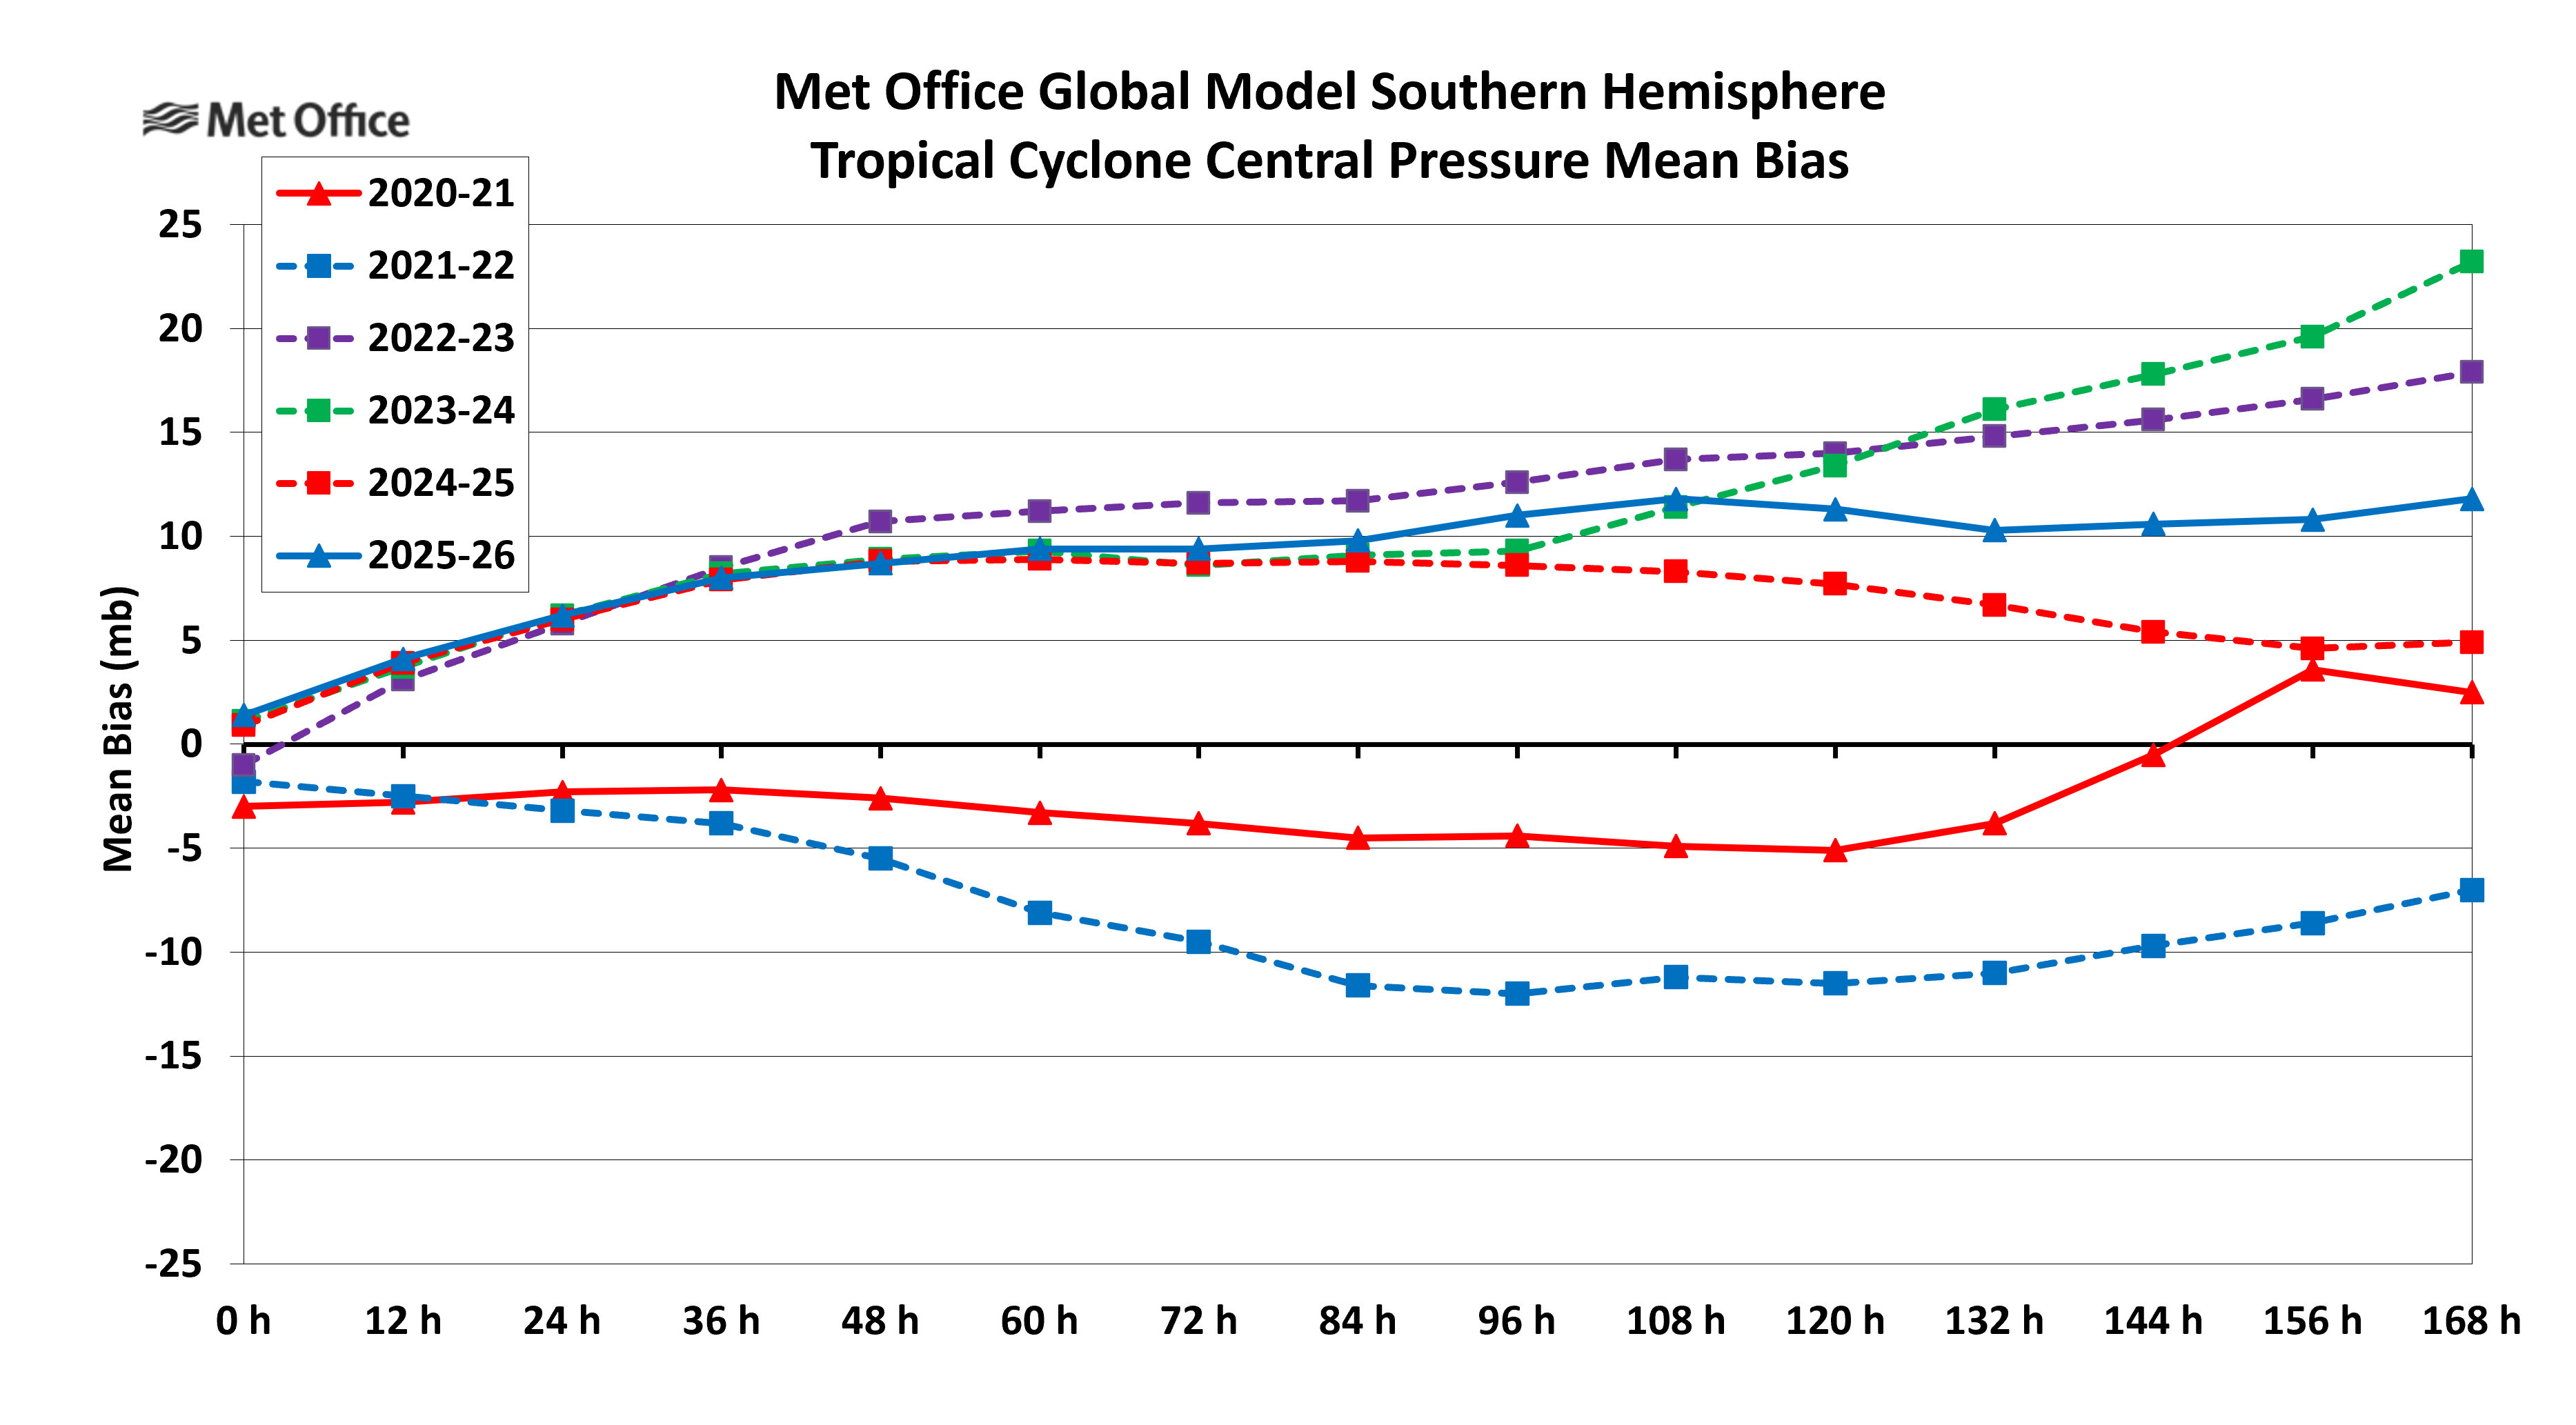
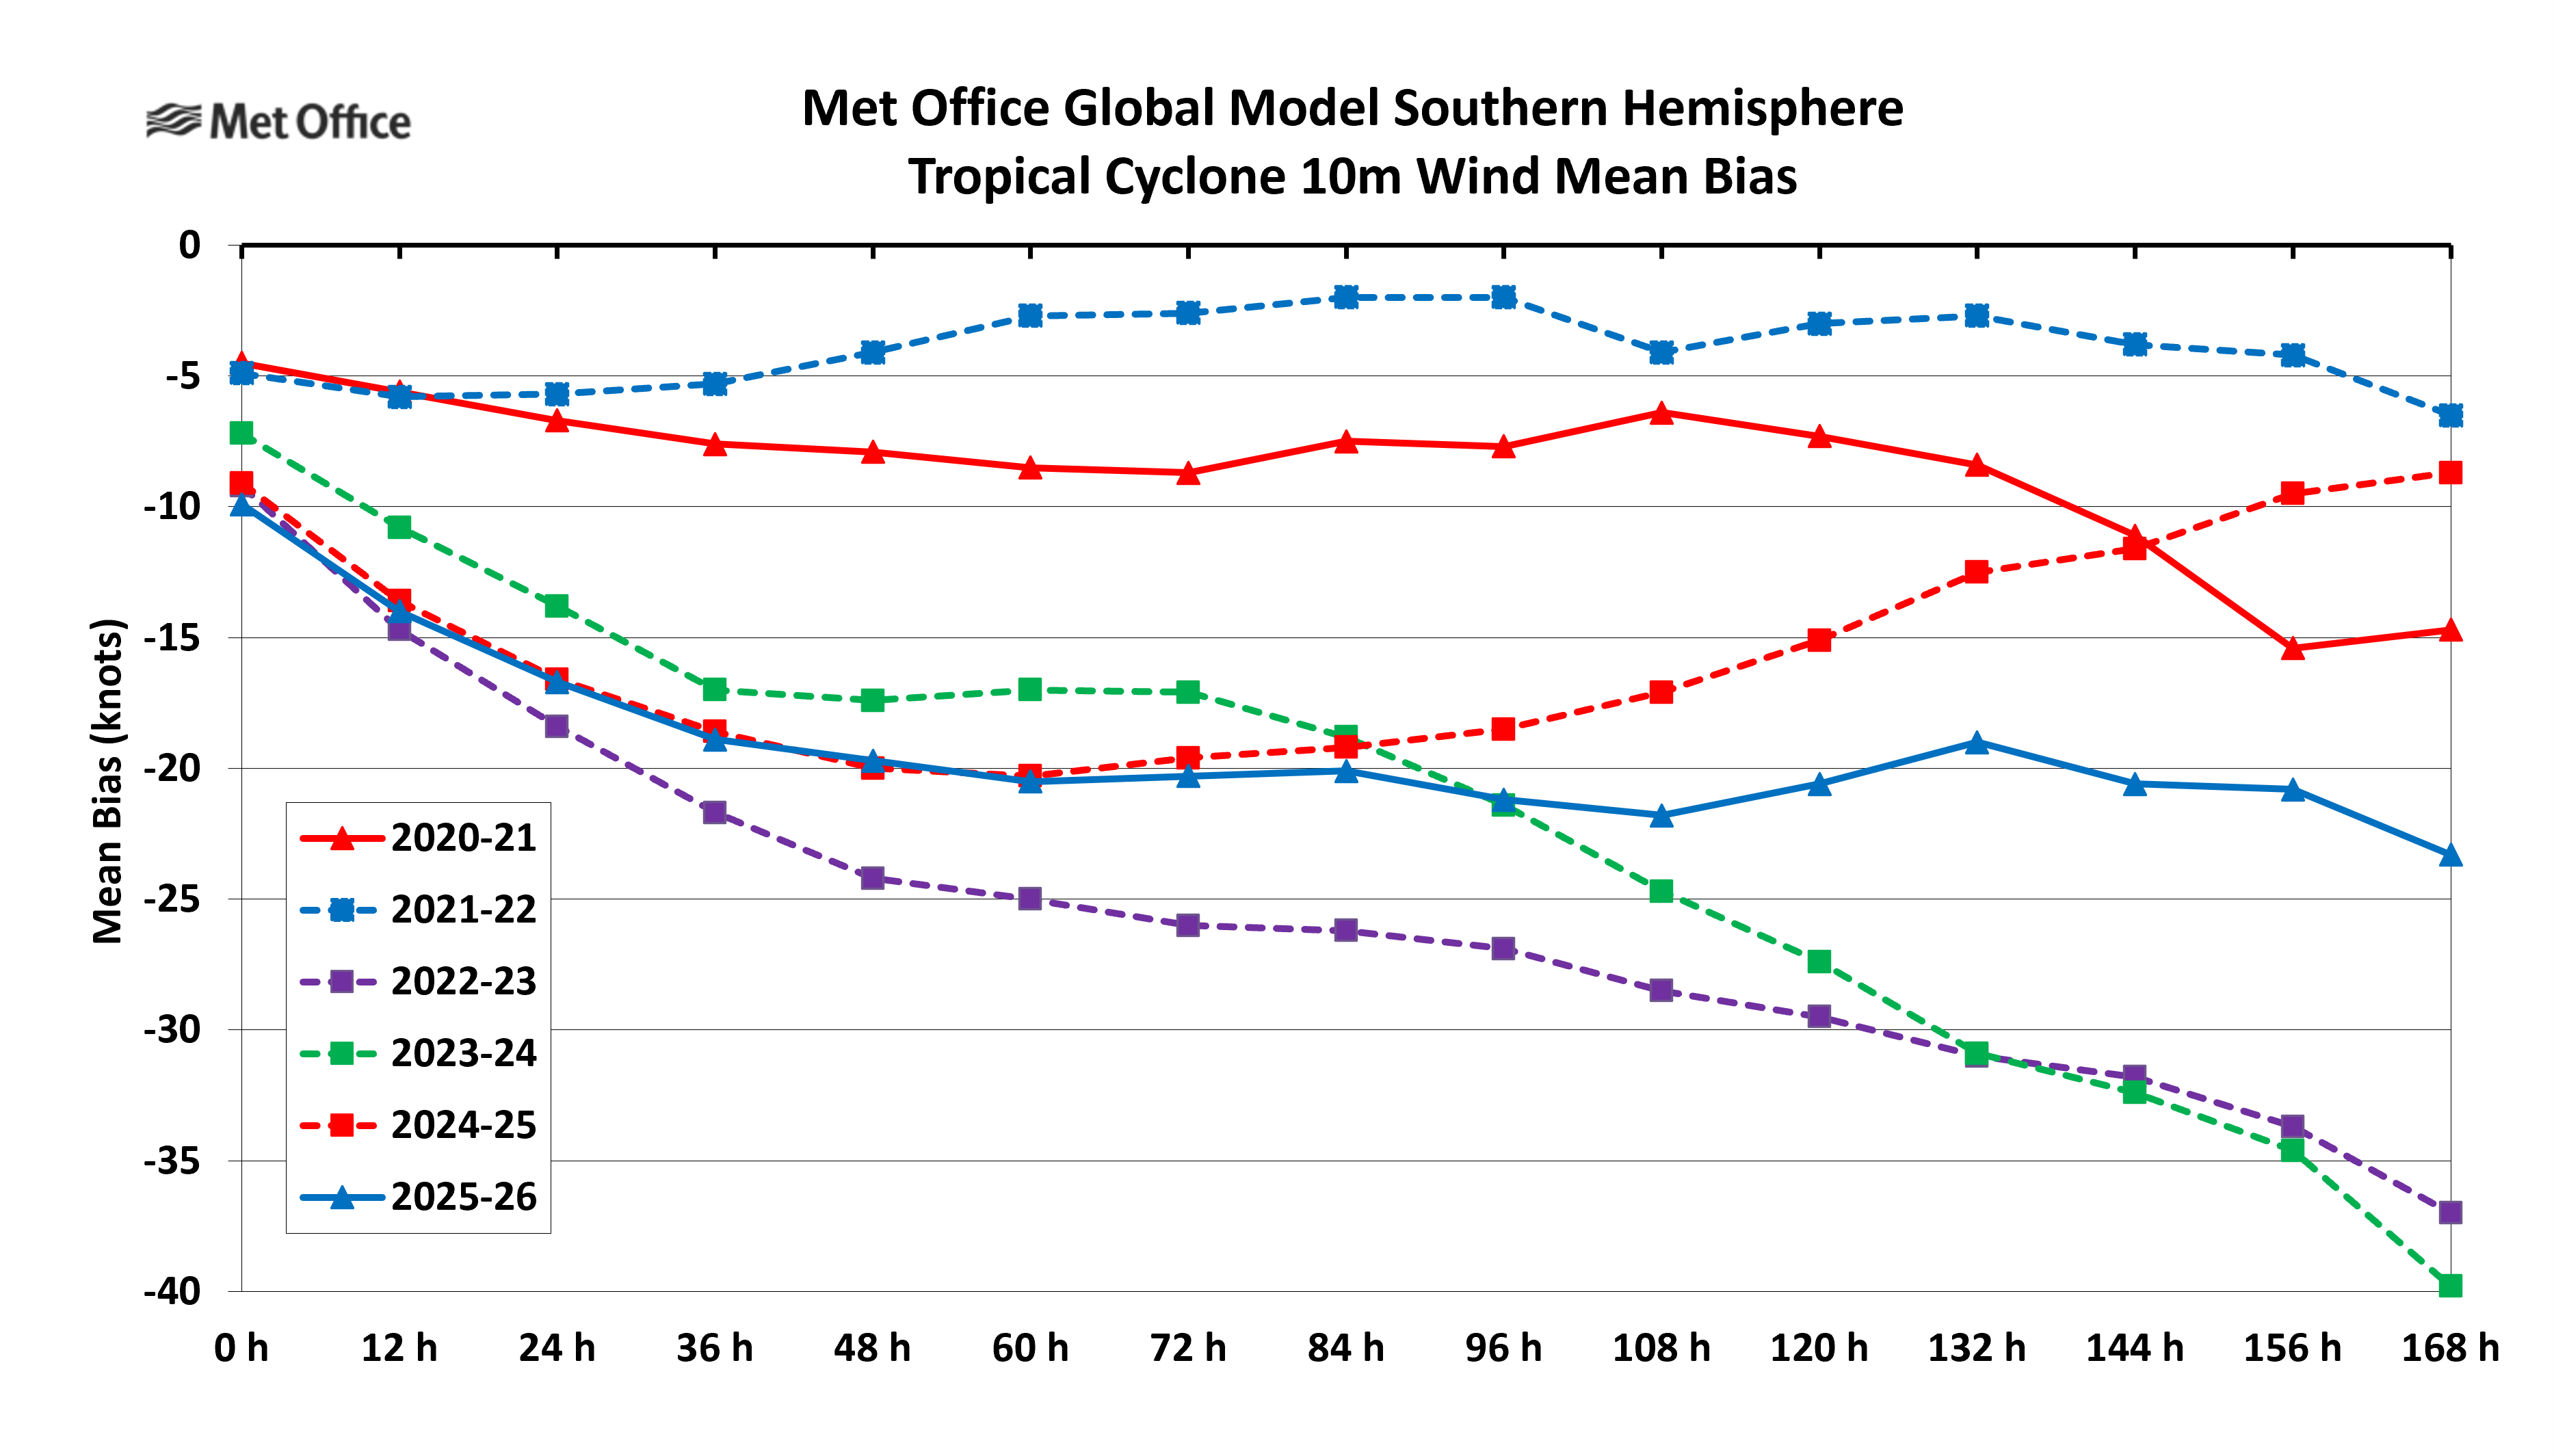
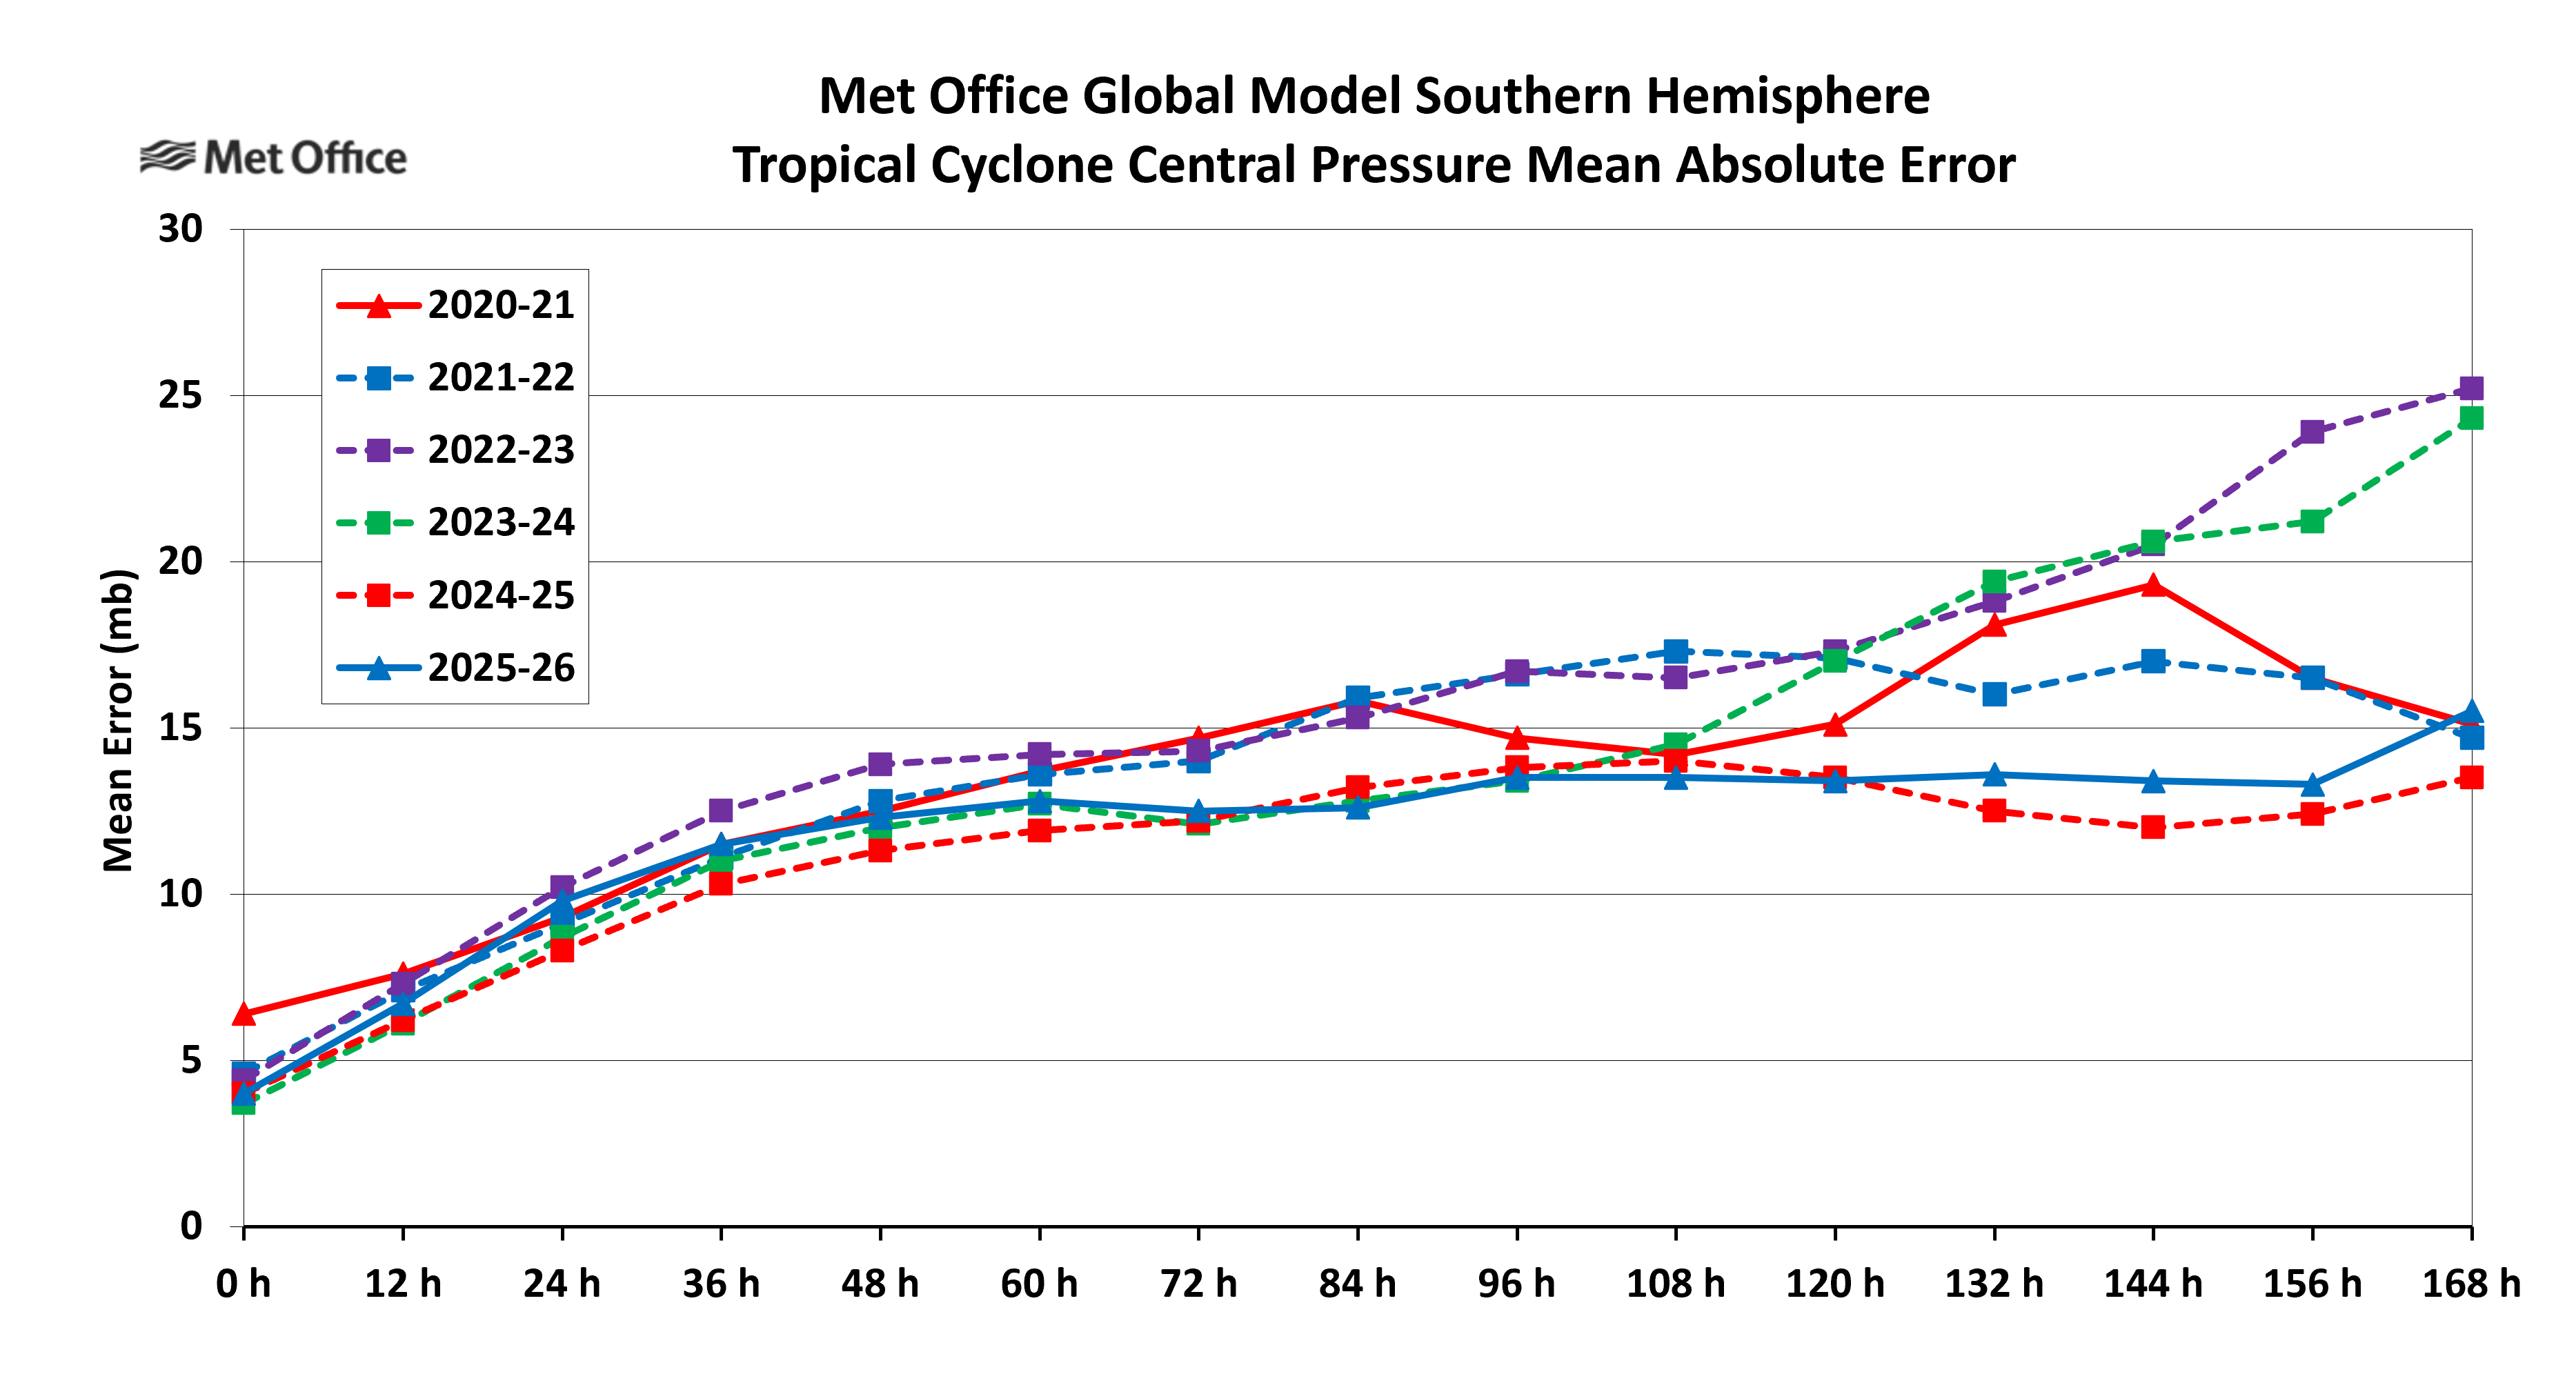
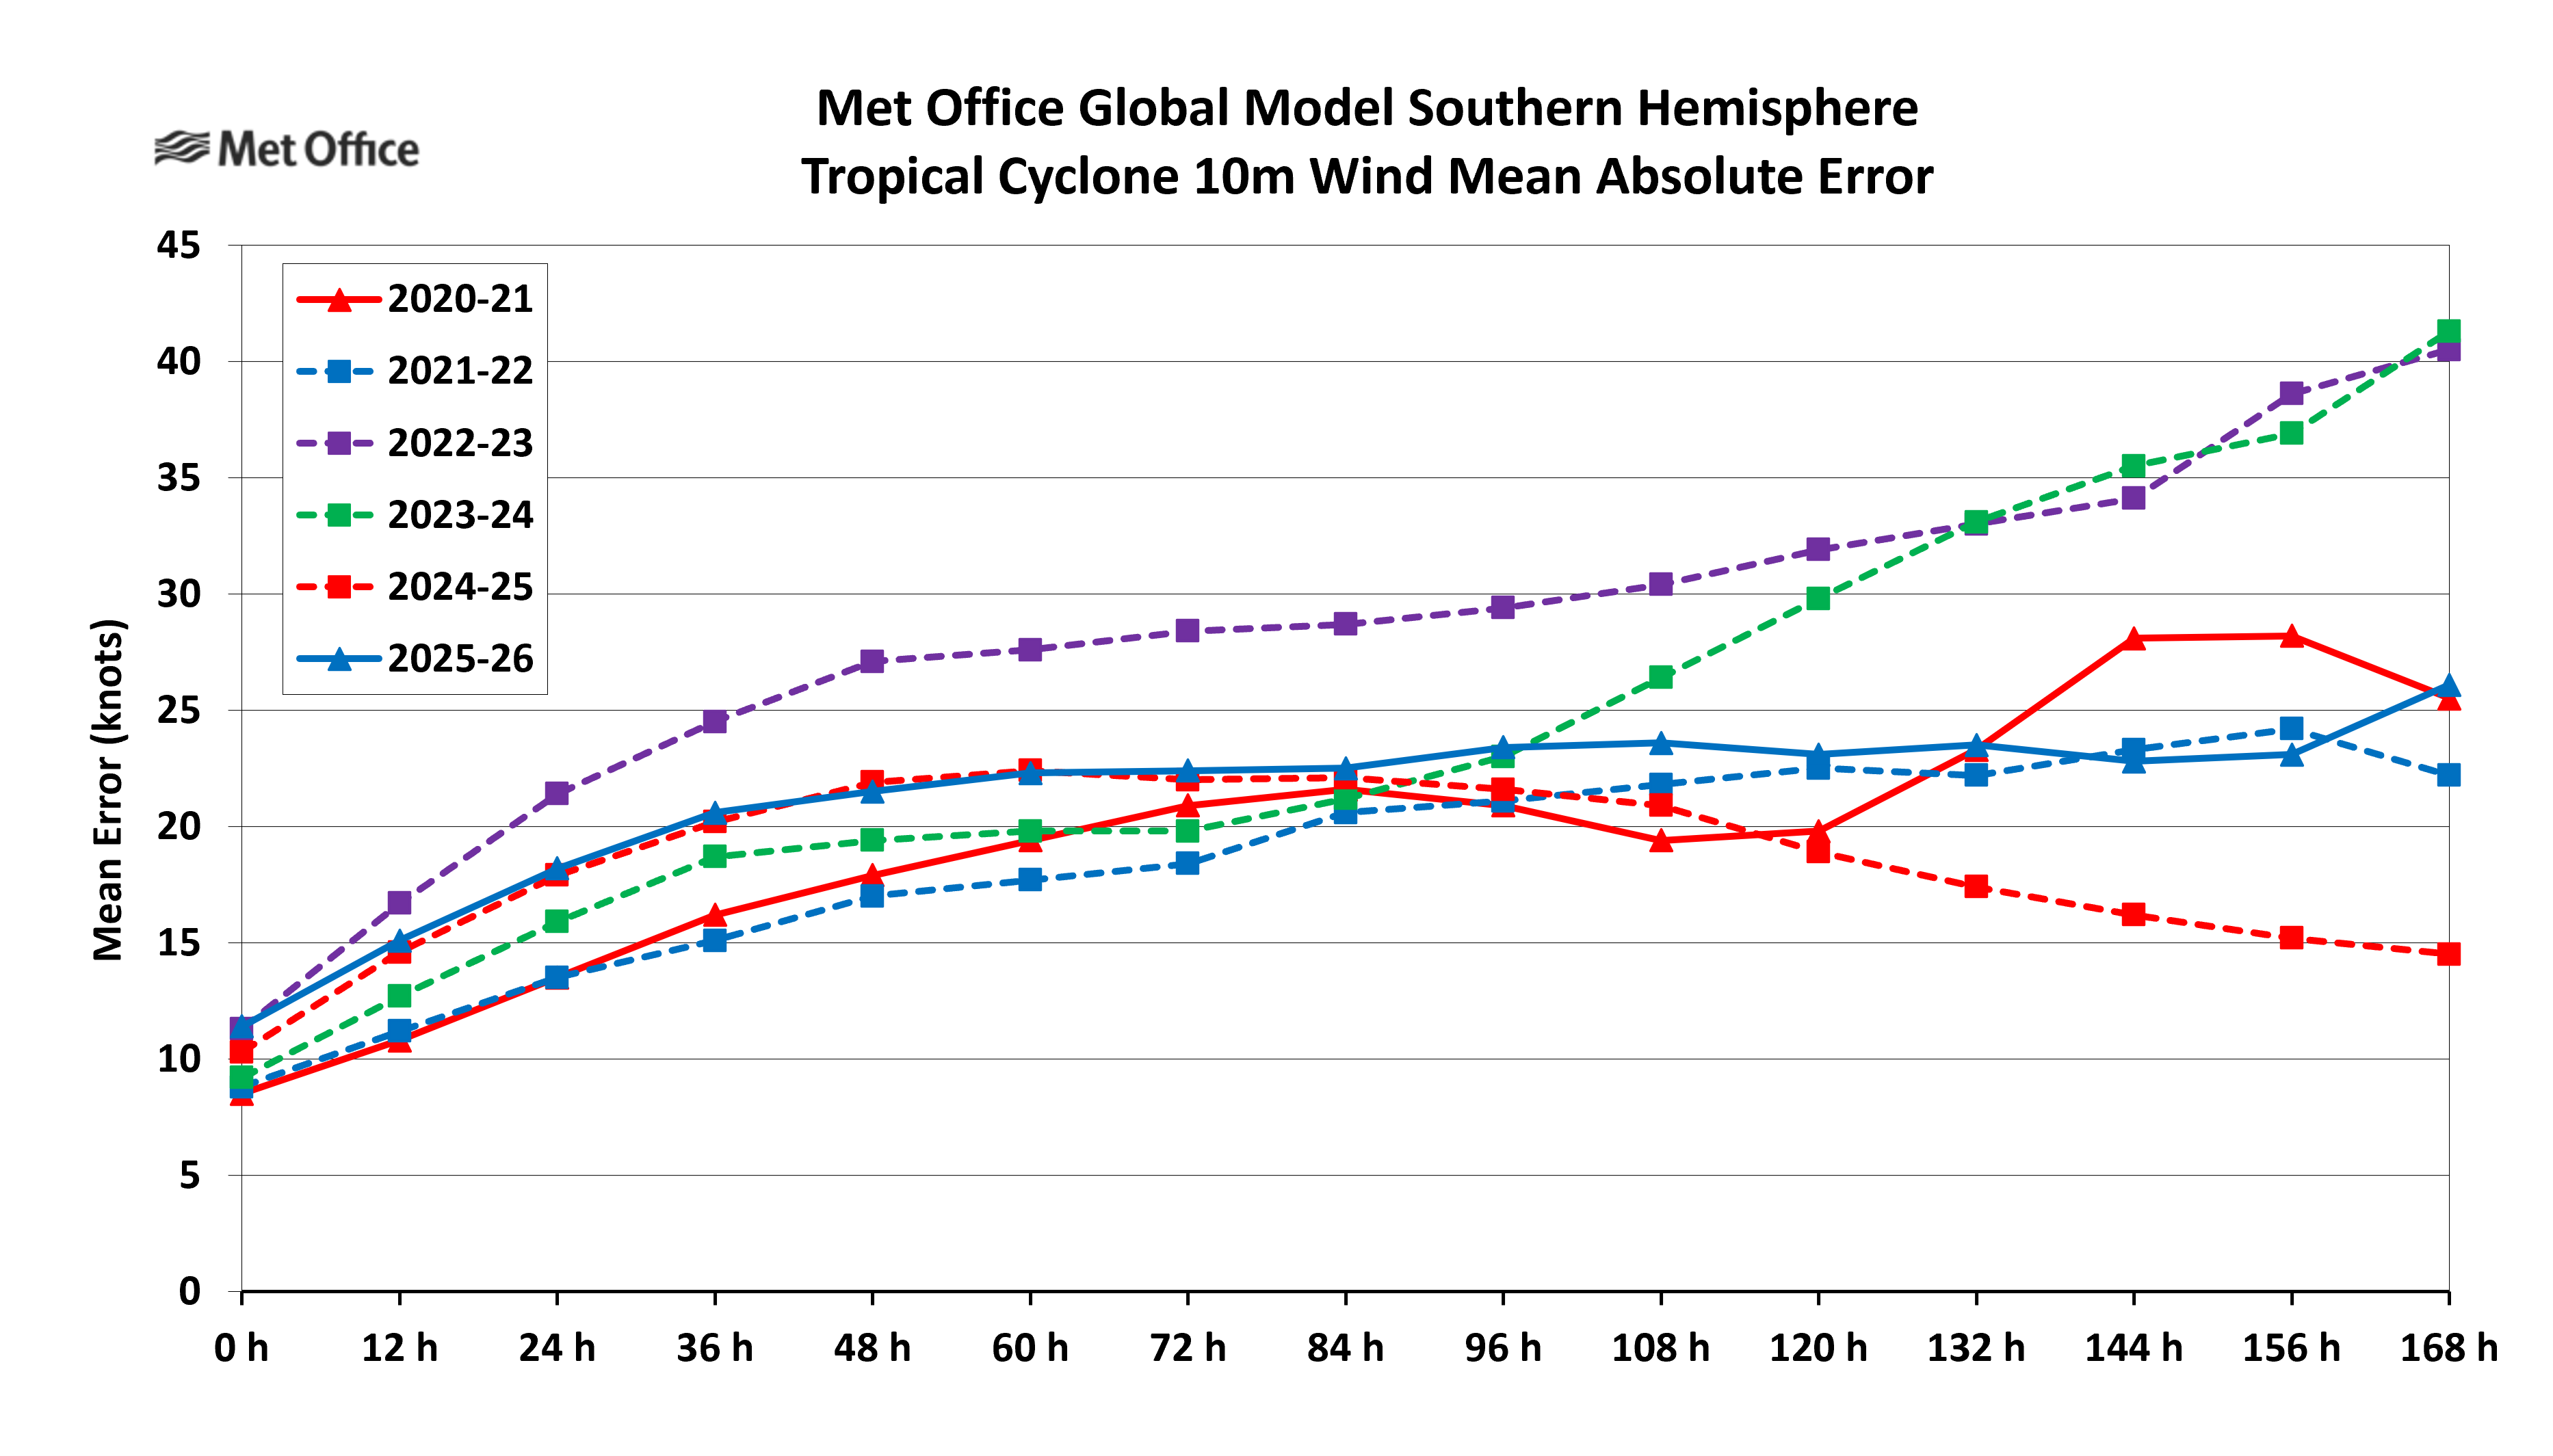
The central pressure bias shows a weak bias in forecasts. It was similar to the last few seasons. The 10m wind bias was negative also indicates a weak bias in forecast intensity. Mean absolute errors for central pressure and 10m winds were similar to recent years.
Further tropical cyclone information
The Met Office tropical cyclone web pages contain information on tropical cyclone forecasting at the Met Office. Summaries of tropical cyclone activity and forecasts are made at the end of each season, together with observed and forecast track information, track and intensity prediction error statistics, lists of names and real-time tropical cyclone forecast guidance.
For further information on tropical cyclone forecasting at the Met Office please email us.