
2025 is double-record breaker: UK’s warmest and sunniest year on record
2025 has broken historical climate records, with provisional Met Office figures showing it has been both the warmest and sunniest year on record for the UK.
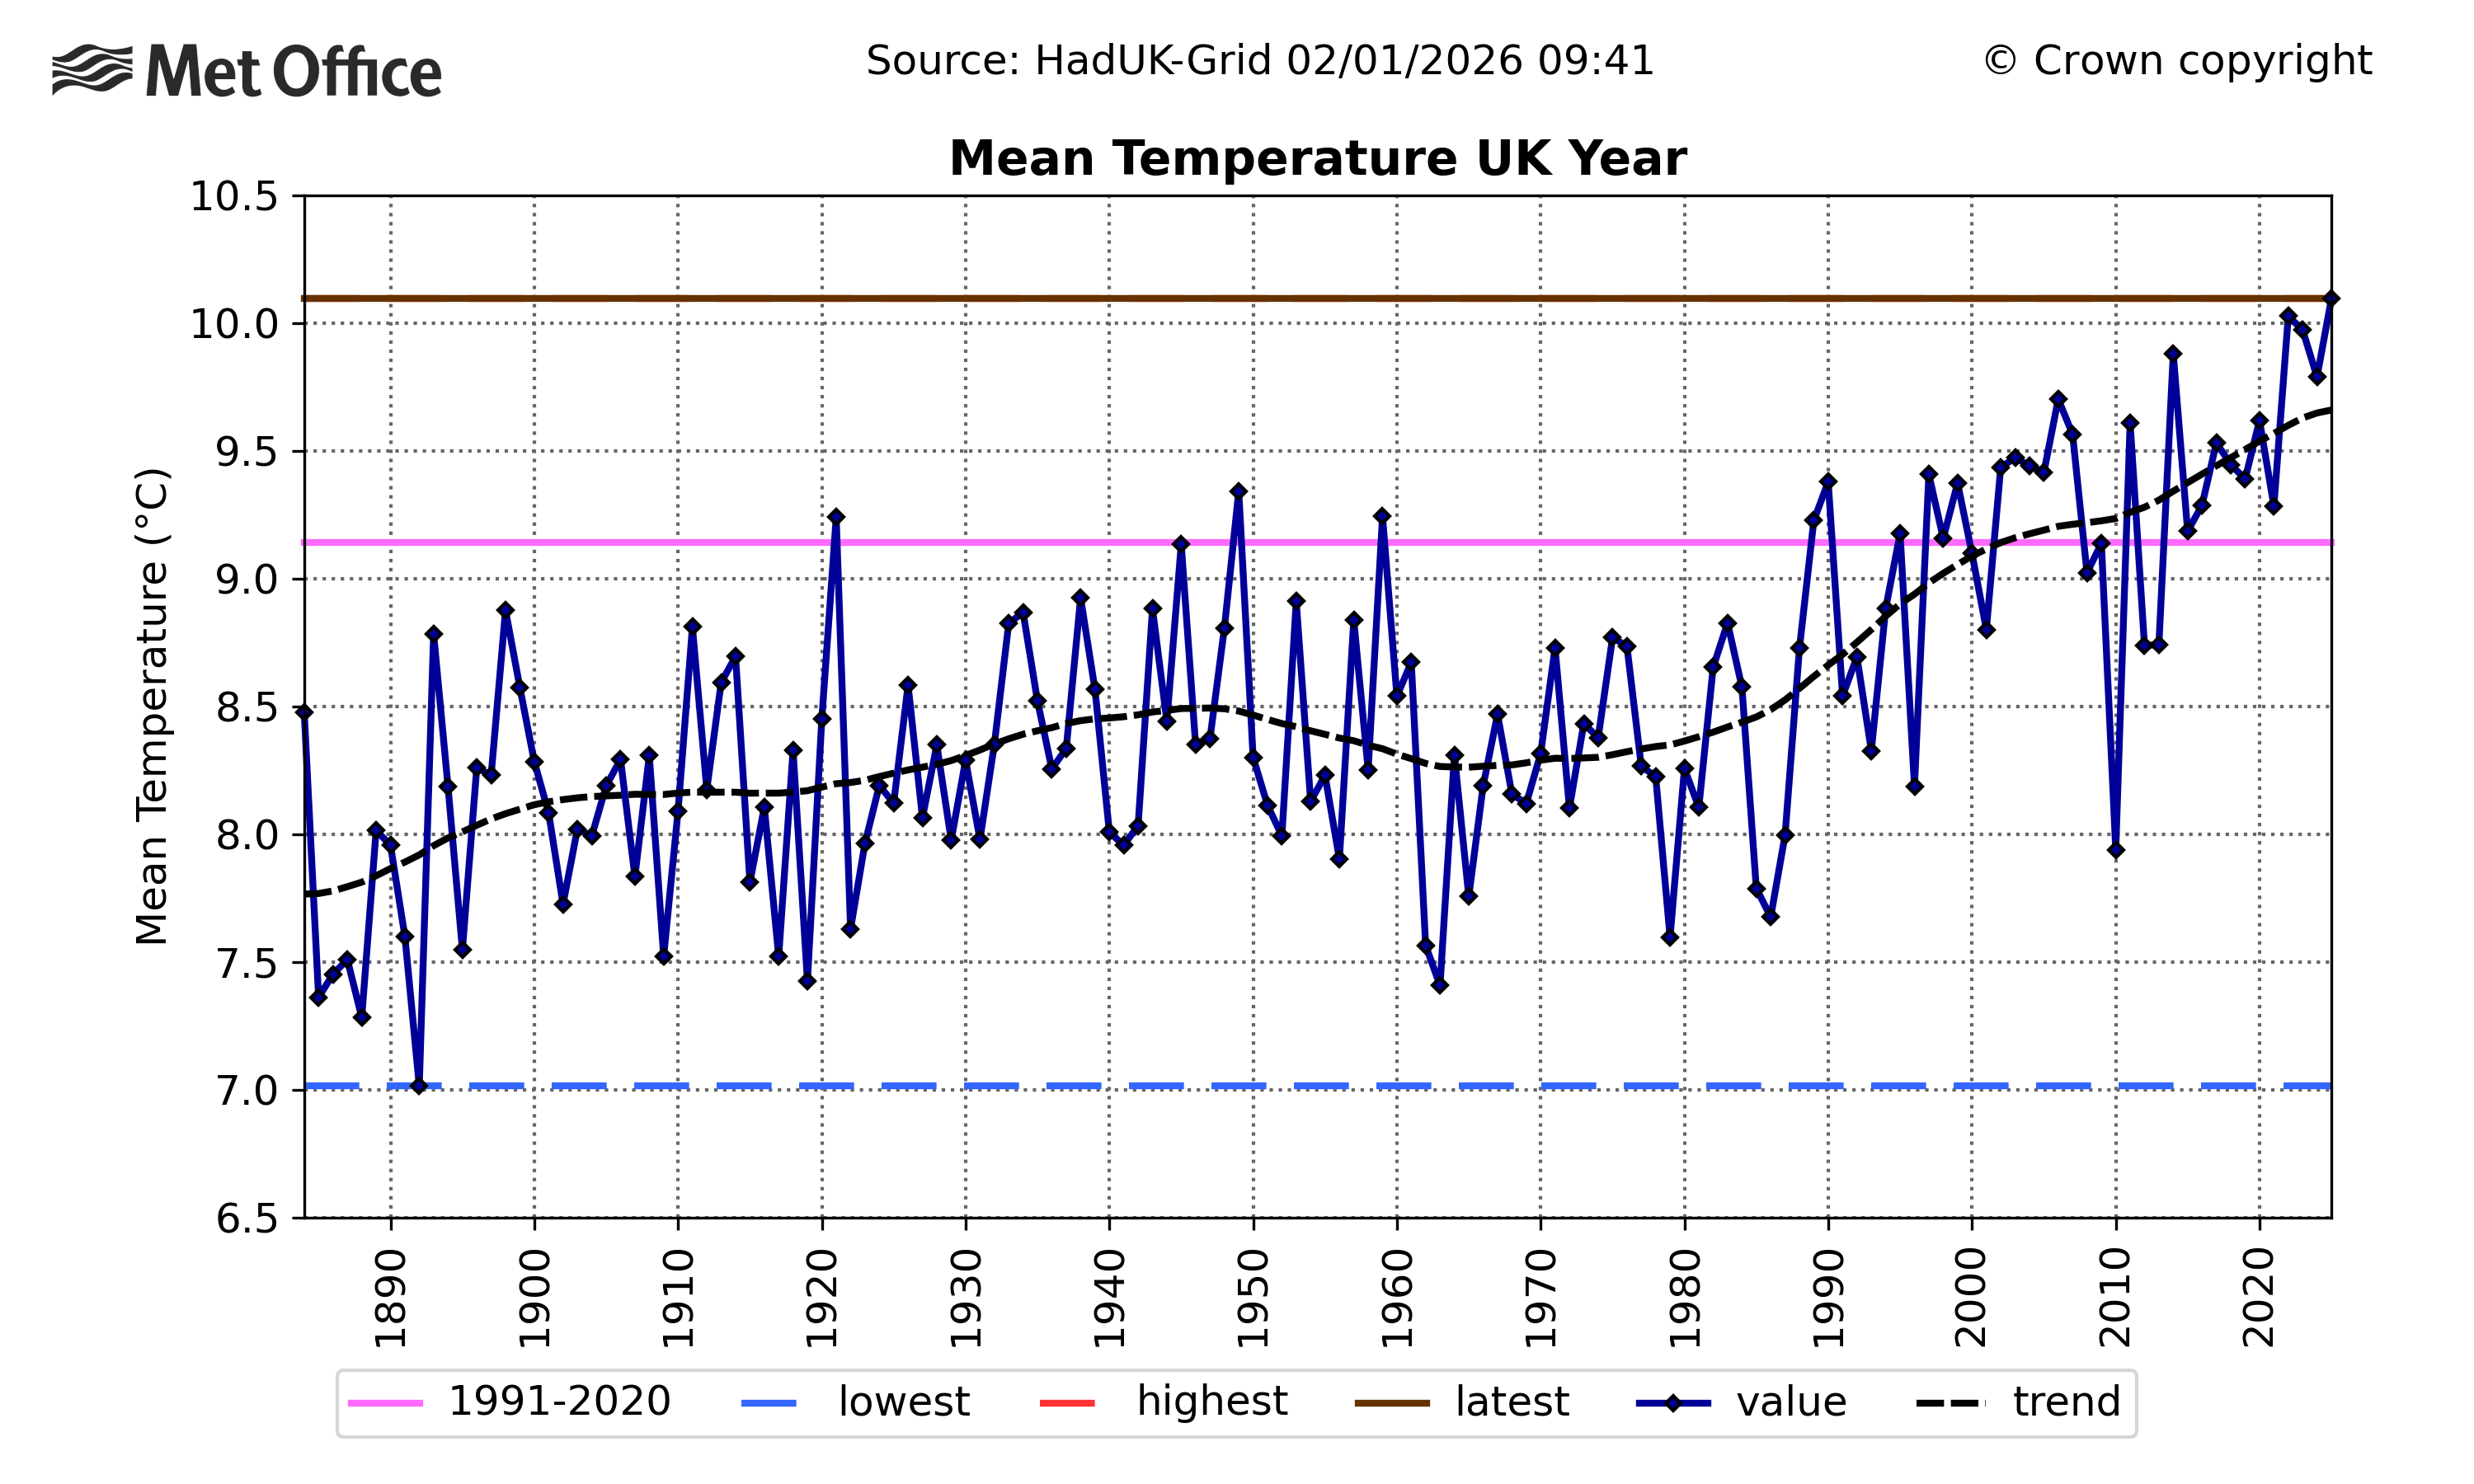
Recording a mean temperature of 10.09°C, 2025 now joins 2022 and 2023 in the top three warmest years since 1884.
This is an increasingly clear demonstration of the impacts of climate change on UK temperatures. This has been underpinned by a rapid attribution study by the Met Office, which shows that human-induced climate change has made the UK’s record-breaking annual temperature of 2025 approximately 260 times more likely.
It is also only the second year in this series where the UK’s annual mean temperature has exceeded 10.0°C.
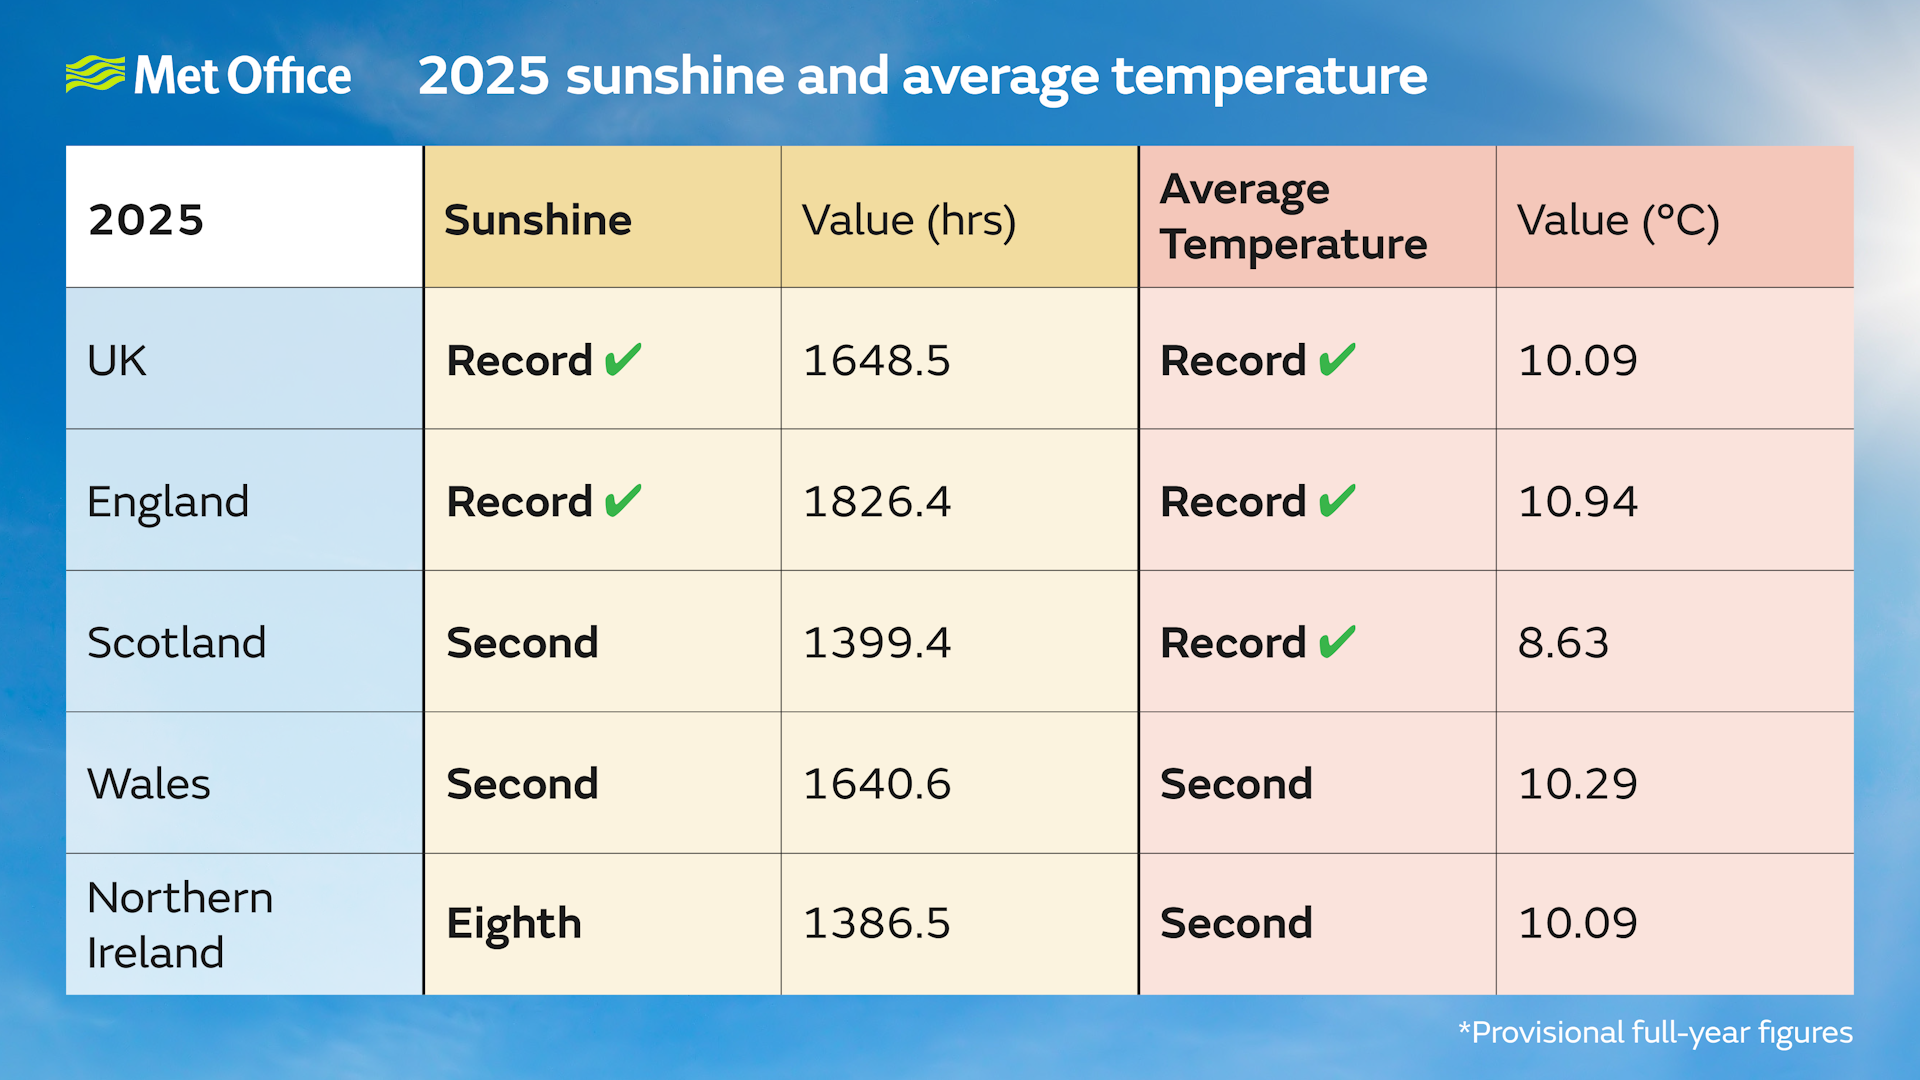
As previously confirmed, 2025 also goes down as the sunniest year since the series began in 1910, recording 1648.5 hours of sunshine across the UK – 61.4 hours more than the previous record set in 2003.
But 2025 was also notable for rainfall, or lack thereof at times during the year, with the UK experiencing its driest spring since 1974. This shortfall has been eased by above average rainfall in recent months, with the UK’s annual total levelling out at 1041.2mm (90% of the average annual rainfall).
Warmest year on record
Four of the UK’s last five years now appear in the top five warmest years since 1884 and all of the top ten warmest years will now have occurred in the last two decades.
The UK’s top five warmest years
2025 10.09°C
2022 10.03°C
2023 9.97°C
2014 9.88°C
2024 9.79°C
Head of climate attribution at the Met Office, Dr Mark McCarthy, said: “2025 was the warmest year on record for the UK, surpassing the previous record set in 2022, in a series dating back to 1884.
“We’re increasingly seeing UK temperatures break new ground in our changing climate, as demonstrated by a new highest UK mean temperature record just three years after the last record.
“This very warm year is in line with expected consequences of human-induced climate change. Although it doesn’t mean every year will be the warmest on record, it is clear from our weather observations and climate models that human-induced global warming is impacting the UK’s climate.”
Since the start of the 21st Century, a new record has been set for UK annual mean temperature no less than six times – in 2002, 2003, 2006, 2014, 2022 and now 2025.
2025 across the UK
Along with the UK, both England and Scotland recorded their warmest years on record, with Wales and Northern Ireland seeing their second warmest since 1884.
Spring and Summer 2025 were also the UK’s warmest on record, with Winter 24/25 and Autumn 2025 recording above-average temperatures.
Met Office Scientist Dr Emily Carlisle said: “While many will remember the long warm spring and summer of 2025, what has been noteworthy this year has been the consistent heat throughout the year, with every month except January and September warmer than average.
“In the six months from March to August, every month was at least 1°C above the 1991-2020 average. This resulted in the warmest spring and the warmest summer we have seen in this series.
“Meteorologically, the warmth has been driven largely by persistent high-pressure systems bringing prolonged dry, sunny conditions, alongside above-average sea temperatures around the UK. These factors have combined to keep temperatures consistently higher than normal for much of the year.”
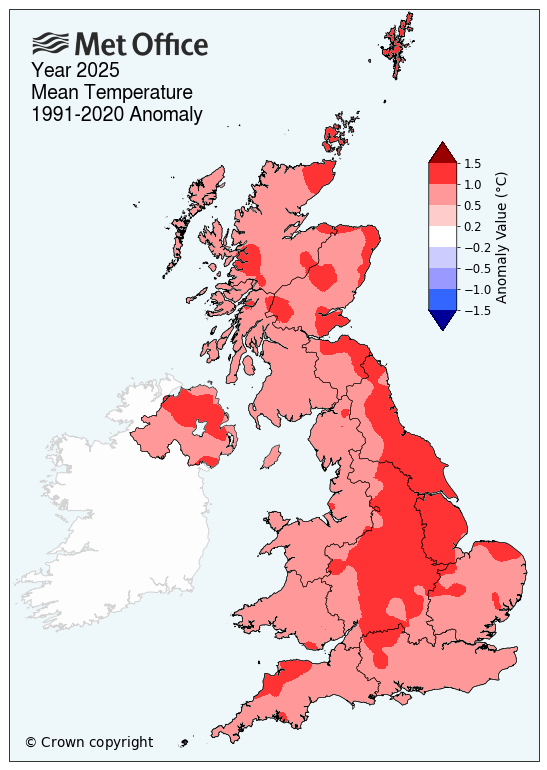
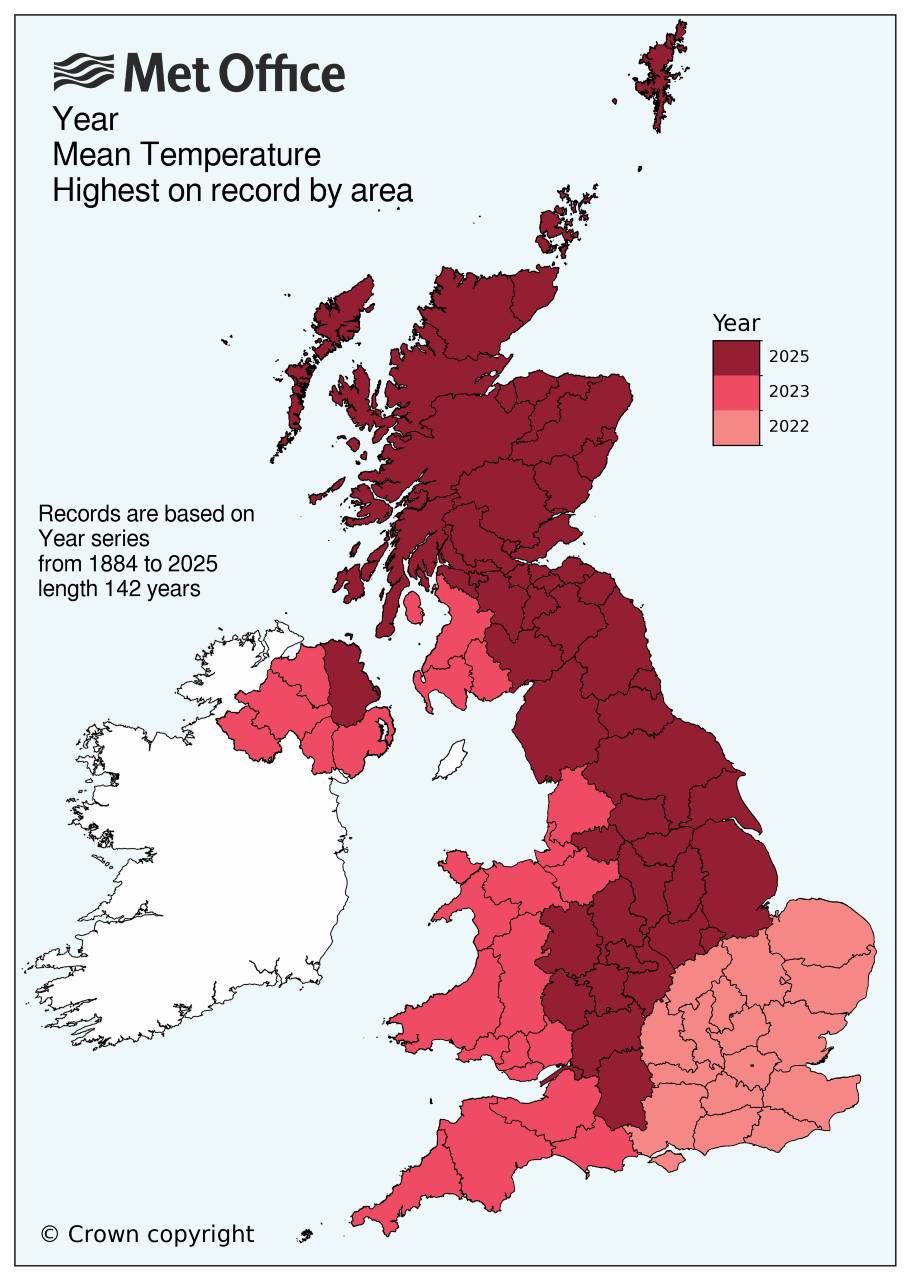
At a regional level, the map below shows that 2025 has been the warmest year on record for the majority of the UK, with every county having had its warmest year in the last three years.
The highest temperature of 2025 was 35.8°C at Faversham in July. Although 2003, 2019 and 2022 have all seen temperatures exceed 38°C (with 2022 exceeding 40°C), 2025 has still concluded warmer due to the longevity of above-average temperatures.
2025 is also the warmest year on record in the 364-year Central England temperature series from 1659, the world’s longest instrumental record of temperature.
An attribution study conducted by the Met Office estimates that human-induced climate change has made the UK’s record-breaking annual temperature of 2025 approximately 260 times more likely. Annual mean temperature for the UK at or above 2025 levels is estimated to occur around 1 in every 3 years on average in our current climate. This means that while this year has set a new record, our rapidly changing climate could also experience much warmer years in the near-future.
Analysis by Met Office climate scientists has also shown that a summer as hot or hotter than 2025 is now 70 times more likely than it would be in a ‘natural’ climate with no human caused greenhouse gas emissions.
Below-average rainfall after a very dry start
Aside from the record-breaking temperatures, one of the most notable discussion points for 2025 was the dry conditions throughout spring and summer.
The first five months of 2025 saw below average rainfall, and only four months of the year saw rainfall above average. Spring concluded as the UK sixth driest and England’s second driest spring since 1836. Summer too brought below-average rainfall, although not enough to trouble any records.
The period from March to August (meteorological spring and summer combined), saw less than 50% of average rainfall fairly widely across southern and central England, with some areas below 40%.
The below graph shows daily rainfall amounts across the UK for 2025 against the 1991-2020 averaging period. It shows Storm Amy on 3 October as the wettest day of the year. 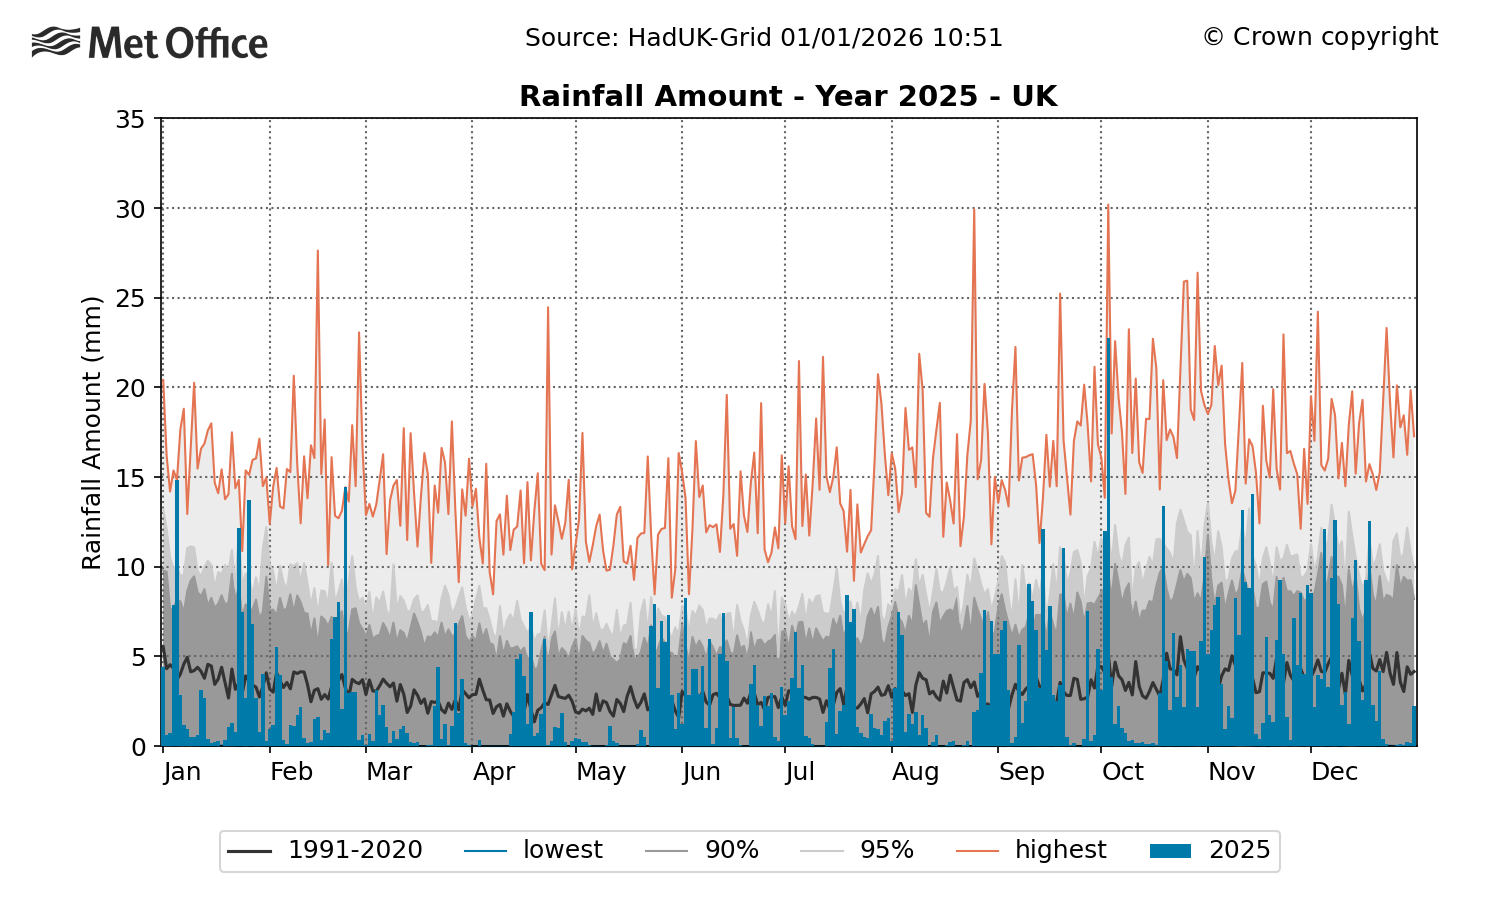
A wetter-than-average September, November and December however, has meant that overall, the UK concludes 2025 with 90% of its long-term meteorological average rainfall for the year.
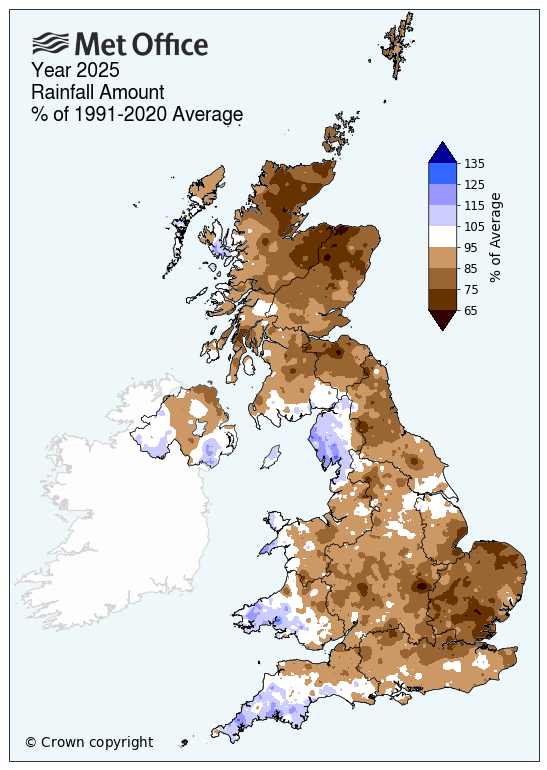
All nations have also provisionally recorded below average rainfall for the year, although Northern Ireland and Wales only just with 97% of the average annual rainfall in each.
There are of course regional differences, and some western regions had a wetter than average year. For example, Cornwall was wet compared to the long-term average, recording 110% of its annual average rainfall compared to Banffshire, which recorded just 69% - its driest year on record.
Although conditions have improved recently in many regions due to wetter weather, parts of Sussex remain in official drought status. Much of the country is now in recovery. Helen Wakeham, Director of Water at the Environment Agency, said: “The dry weather through last spring and summer saw widespread drought, which had impacts on our wildlife, our rivers, our canals, and farmers’ harvests.
“This lack of water also caused real pressure on our public water supplies, with many reservoirs reaching worryingly low levels and hosepipe bans for nearly ten million people.
“Climate change means we will see more extremes of droughts and floods, and we could be in for a difficult time again this year if we have a repeat of 2025.
“Despite the recent rain, our reservoir and groundwater levels in eastern and southeast England are still currently lower than we would expect for this time of year. Therefore, we would urge people to continue to help by using a little less water, especially while our environment recovers from the impact of the recent drought.”
Wales saw a particularly wet autumn (37% more rainfall than average) and early winter period, with persistent intense rainfall causing flooding and repeated rainfall warnings.
Jeremy Parr, Head of Flood and Incident Risk Management at Natural Resources Wales said: “2025 has been a year of stark extremes for Wales. We’ve experienced a summer marked by prolonged dry spells and environmental drought, water resource pressures, and wildfires, which later gave way to an autumn and early winter of relentless rainfall and severe flooding, significantly impacting communities across South West and South East Wales in particular.
“This contrast is clearly demonstrated at our Ebbw river gauging station in Aberbeeg, Blaenau Gwent, where December recorded the highest flows since records began in the early 1970s, just five months after August saw one of the lowest flows ever measured.
“These contrasts are not isolated events - they are clear signs of a changing climate. More frequent and more severe weather is the reality we face, and with that comes the likelihood of greater impacts in the years ahead.”
UK’s sunniest year on record too
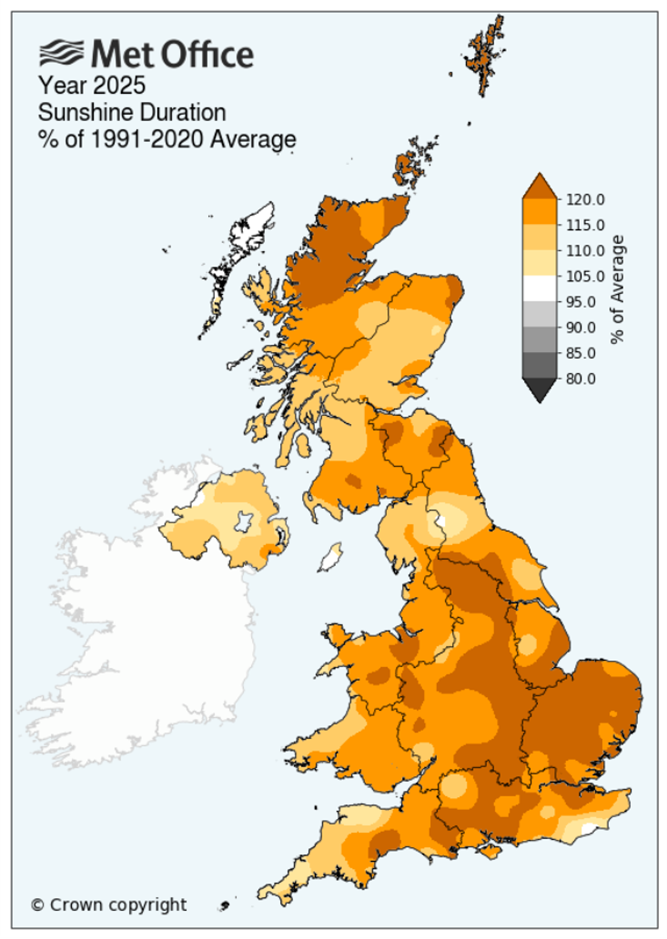
2025 has been the sunniest year on record for the UK, according to provisional Met Office statistics. The UK recorded 1648.5 hours of sunshine across the year, surpassing the previous sunniest year set in 2003 by 61.4 hours, in a series which dates back to 1910.
England had its sunniest year on record, with Wales and Scotland their second, and Northern Ireland its eighth.
January started the year on a sunny note, before below-average sunshine figures in February helped develop a duller meteorological winter (24/25) than average.
Spring outshone all the seasons with the sunniest spring on record, and the fourth sunniest season on record, beaten by just three summers (1911, 1976 and 1995). Summer was also sunnier than average whilst autumn saw below-average sunshine amounts. Sunny spells in late spring and early summer can particularly boost annual sunshine statistics due to the longer days.
At weather station level, Magilligan, County Londonderry, recorded 301.3 hours of sunshine in May 2025, the highest monthly sunshine total ever recorded in Northern Ireland for any month.
The below graph shows just how exceptional this spring’s sunshine was.
What's the annual sunshine trend?
The latest UK State of the Climate Report highlights how the UK has generally become sunnier since the 1980s. The cause of this trend is uncertain, and it may simply be down to natural variability, though reduced aerosols could be a factor. Climate projections currently show no definitive evidence of a future trend in sunshine amounts due to climate change.
Recent years show this natural variability well, with 2024 the dullest year since 1998, in contrast to 2025 which will now go down as the UK’s sunniest year on record.
Exceptionally high sea surface temperatures too
Sea surface temperatures in waters surrounding the UK were exceptionally high during 2025, with widespread and persistent marine heatwave conditions developing unusually early in the year and continuing through much of the year.
Dr Ségolène Berthou, an air-sea interaction specialist at the Met Office said: "Provisional data shows that the seas surrounding the UK were consistently amongst the warmest on record during 2025, experiencing sea-surface marine heatwave conditions relative to a 1982-2012 reference period for almost the entire year.
“The consistent high temperatures were unprecedented, with an exceptional spring leading to the ocean warming almost a month ahead of what would be seen in an average year. Record sunshine over the UK contributed to maintaining the marine heatwave conditions over the whole year. These high sea-surface temperatures are likely to have contributed to increasing land temperatures in spring and summer, by reducing the cooling effect of sea breezes and light winds."
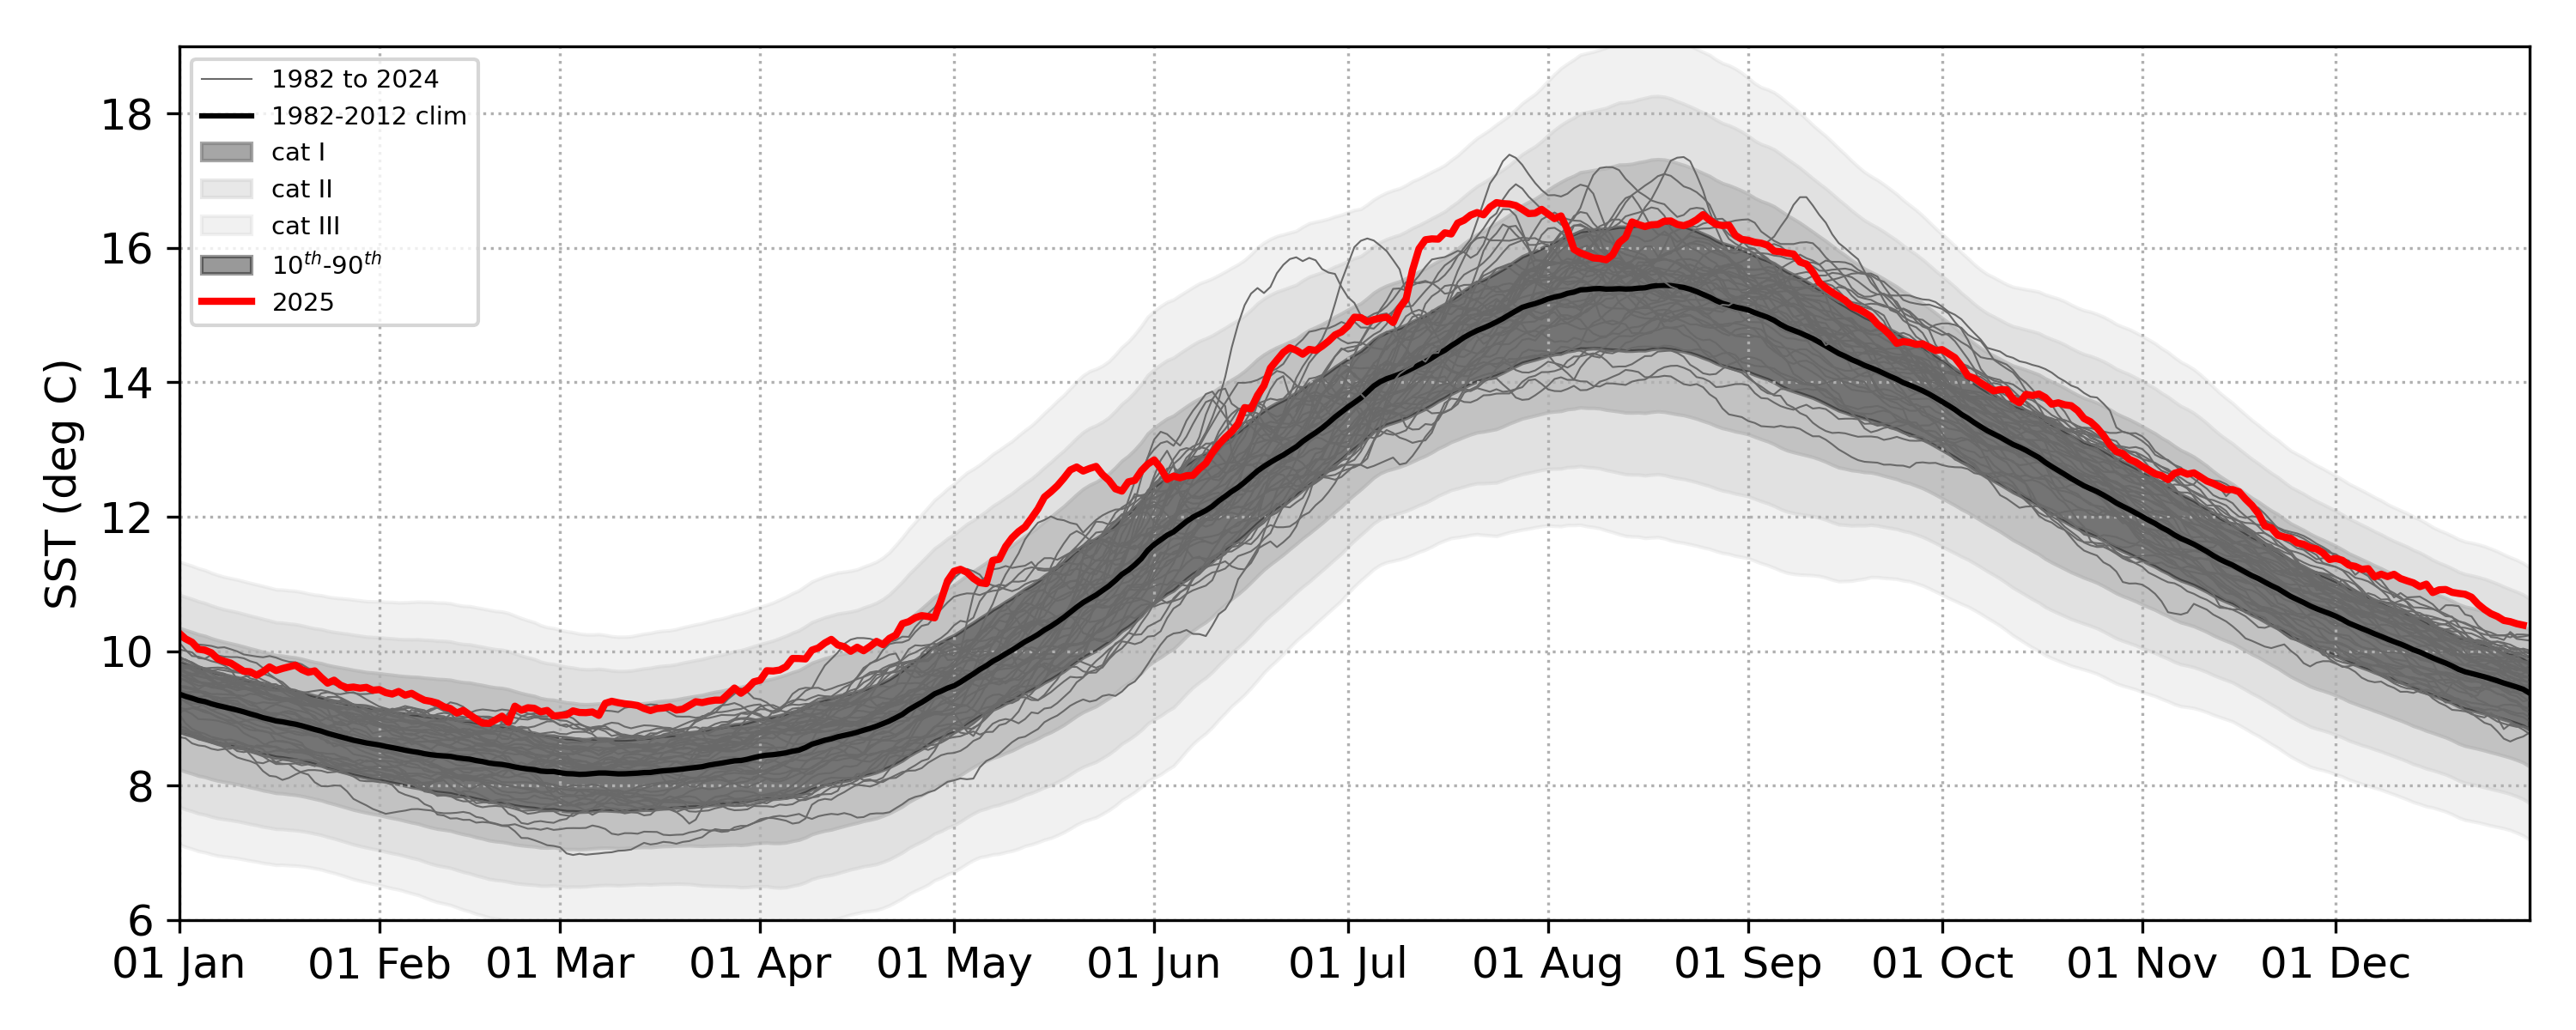
Sea surface temperature from the Operational Sea Surface Temperature and Sea Ice Analysis (OSTIA) for each year between 1982 and 2025, mean climatology for 1982–2012, Shading: 10th–90th centiles, Category I, Category II, Category III marine heatwaves/cold spells using Hobday et al. 2018 definition averaged over the seas surrounding the UK and Ireland.
Four named storms
A total of four storms were named by the western Europe naming group in 2025, with the first of the year Storm Éowyn.
Storm Éowyn was the most powerful windstorm in the UK for over a decade, particularly affecting Northern Ireland and Scotland’s Central Belt. Storm Floris then came in August, and was notable for its strength during the summer months, affecting northern Scotland with gusts up to 82mph. Storm Amy was the first named storm of the 2025/26 season in October, bringing very strong winds and heavy rain to northern and western areas. And Storm Bram finished off the year in December, bringing strong winds and very heavy rain to northern and western parts of the UK.
|
Provisional 2025 stats |
Mean temp (°C) |
Rainfall (mm/%) |
Sunshine (hours/ %) |
|||
|
Actual |
91/20 anom |
Actual |
91/20 anom |
Actual |
91/20 anom |
|
|
UK |
10.09 | 0.95 | 1041.2 | 90 | 1648.5 | 118 |
|
England |
10.94 | 0.98 | 789.1 | 91 | 1826.4 | 119 |
|
Wales |
10.29 | 0.88 | 1419.3 | 97 | 1640.6 | 117 |
|
Scotland |
8.63 | 0.94 | 1346.8 | 86 | 1399.4 | 117 |
|
Northern Ireland |
10.09 | 0.96 | 1116.0 | 97 | 1386.5 | 110 |
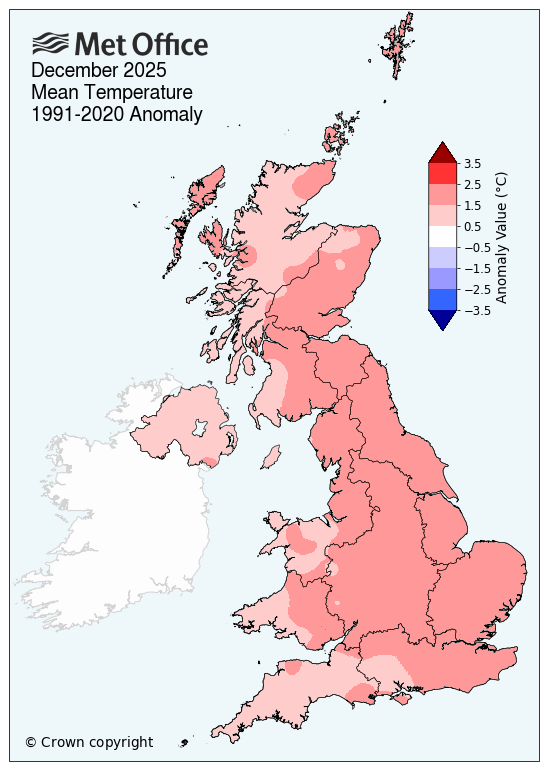
December 2025: Provisional statistics
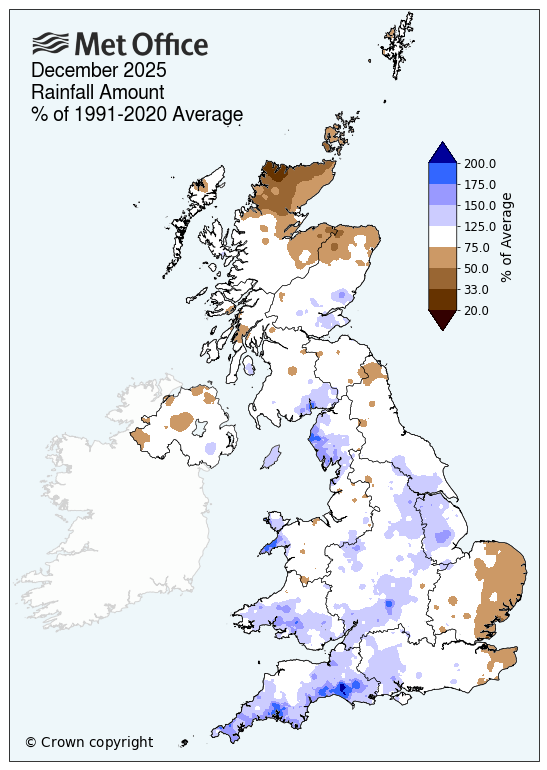
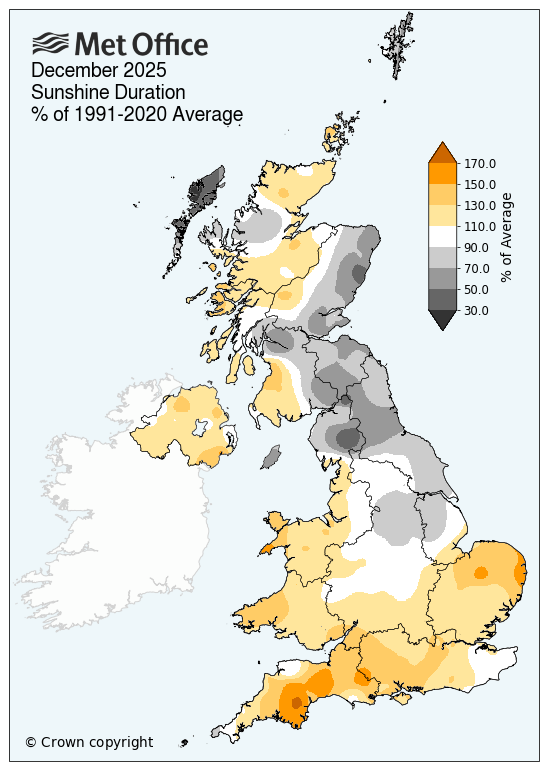
The final month of the year has concluded with just over average rainfall, warmer than average temperatures and above average sunshine for the UK.
The UK provisional mean temperature was 5.8°C – which is 1.6°C above the long-term meteorological average.
Unsettled conditions persisted for the first few weeks of December and by the 16th, the UK had provisionally recorded 75% of its average monthly rainfall. Several counties, including West Glamorgan and Cornwall had recorded over 100% of their average December rainfall.
The second half of December was drier however, resulting in only slightly above average rainfall for the month overall (101%). England and Wales were both wetter than average – 114% and 115% respectively.
Sunshine overall was above average at 108% for the UK, with Wales and southwest England particularly sunny (126% of average for Wales). There was also a clear north/south divide in England, with the north recording 85% of its December average and the south 123% in comparison.
Read: The year in weather: 2025
How do we know when records are broken?
The answer lies in a Met Office dataset that's been quietly mapping our weather history for around the last two centuries.
|
Provisional Dec 2025 stats |
Mean temp (°C) |
Rainfall (mm/%) |
Sunshine (hours/ %) |
|||
|
Actual |
91/20 anom |
Actual |
91/20 anom |
Actual |
91/20 anom |
|
|
UK |
5.8 | 1.6 | 128.9 | 101 | 46.1 | 108 |
|
England |
6.5 | 1.8 | 105.4 | 114 | 56.6 | 111 |
|
Wales |
6.3 | 1.5 | 202.7 | 115 | 52.1 | 126 |
|
Scotland |
4.6 | 1.6 | 153.2 | 88 | 27.1 | 91 |
|
Northern Ireland |
5.9 | 1.2 | 101.0 | 83 | 45.2 | 119 |