
April showers in shorter supply, but sunshine plentiful for many
Provisional Met Office statistics show that April 2026 was drier, warmer and sunnier than average across the UK, although conditions varied by region.
The UK saw its seventh warmest April on record and its fourth sunniest.
April saw an unsettled start, with a mixture of spring showers, colder spells and brief warmer interludes. The first week of the month also saw Storm Dave, the fourth named storm of the season, bringing very strong winds, snow and heavy rain to parts of Northern Ireland and Scotland. As the month progressed, high pressure became increasingly dominant, leading to longer spells of settled weather, clearer skies and warmer temperatures for many.
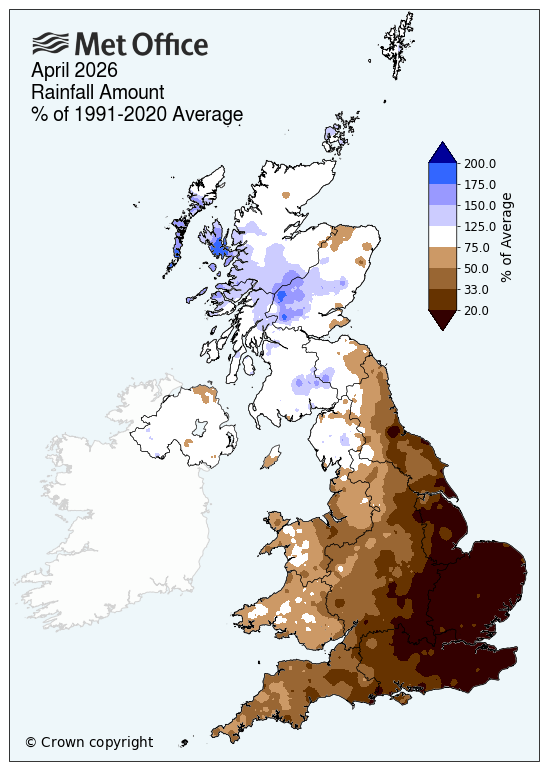
Rainfall: sharp regional contrasts, despite a drier month overall
Despite some heavy rainfall early in the month, overall rainfall was 23% below the long-term meteorological average for the UK. England was particularly dry, recording just 38% of its average April rainfall, while Scotland was the only UK nation to see above‑average rainfall.
Marked regional contrasts were evident. Northern England recorded 56% of its average rainfall for the month, compared to just 27% across southern England. The southeast of England was the driest part of the UK, with East Anglia seeing just 4.0mm of rainfall, which is just 10% of its average April total. This makes April 2026 the third driest April on record for East Anglia in a series dating back to 1836, although it did not exceed the record low of 1.0 mm set in 2007.
Several counties experienced one of their driest Aprils on record, including Cambridgeshire (second driest), Norfolk (third driest), Bedfordshire (fourth driest), Essex (fifth driest) and Kent, Hertfordshire, Northamptonshire and Greater London all seeing their sixth driest.
In contrast, parts of north‑west Scotland, including the Western Isles and Inverness‑shire, experienced above‑average rainfall, particularly during the first half of the month.
Met Office Scientist, Dr Emily Carlisle, said: “The overall dry signal this April masks some pronounced regional differences. Persistent high pressure frequently kept rain‑bearing systems away from southern and eastern parts of England, leading to notably low rainfall totals in areas such as East Anglia. At the same time, parts of north-west Scotland remained more exposed to Atlantic systems, particularly during the first half of the month, resulting in above‑average rainfall there. These patterns are a good example of how the same month can look very different depending on where you are in the UK.”
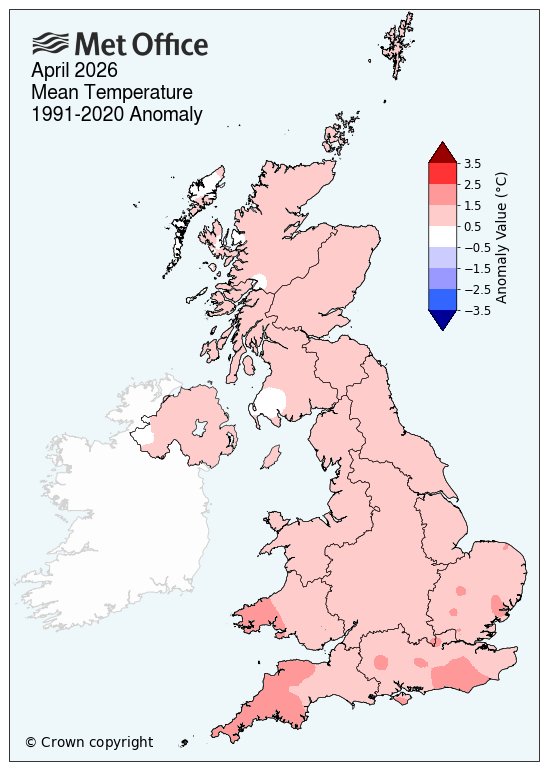
Temperature: seventh warmest April on record for the UK
April was also notably mild. Mean temperatures were above average across the UK and all four nations, with the UK recording its seventh warmest April on record in a series beginning in 1884. England and Wales experienced their sixth warmest April, reflecting the impact of frequent settled spells later in the month.
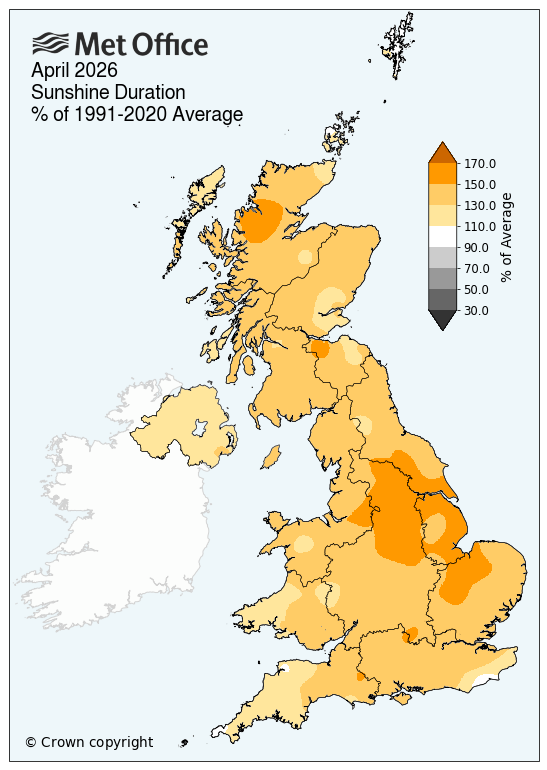
Sunshine: fourth sunniest April on record for the UK
Sunshine totals were similarly elevated. The UK and all four nations recorded above‑average sunshine, with the UK experiencing its fourth sunniest April since 1910, only surpassed by sunnier Aprils in 2020, 2021 and 2025.
April 2026 ranked as England’s third sunniest, Scotland’s sixth and Wales’s eight sunniest on record.
How does spring so far compare with last year's record-breaking spring
Many will remember spring 2025 as the warmest and sunniest on record for the UK, but it was also extremely dry, ranking as the sixth driest spring since 1836. While April 2026 has been drier than average, meteorological spring 2026 to date (March and April), has already recorded more rainfall than the whole of spring 2025, with 141.6mm recorded so far compared to 128.3 mm across the entire spring last year.
At this point in the season, the UK is trending slightly cooler than last year’s record‑breaking spring, but temperatures remain around 1°C above the long‑term average. Sunshine levels are also above average, although not reaching those seen at the same point last year. With one month of meteorological spring still to come, these provisional statistics may change.
Provisional April 2026 statistics
|
|
Mean temp (°C) |
|
Rainfall (mm/%) |
|
Sunshine |
|
|---|---|---|---|---|---|---|
|
|
Actual |
1991/2020 anomaly |
Actual |
1991/2020 anomaly |
Actual |
1991/2020 anomaly |
|
UK |
9.0 |
1.1 |
55.0 |
77 |
215.2 |
139 |
|
England |
10.0 |
1.3 |
21.3 |
38 |
232.4 |
142 |
|
Wales |
9.3 |
1.2 |
55.5 |
63 |
209.5 |
133 |
|
Scotland |
7.4 |
0.8 |
108.8 |
117 |
194.3 |
137 |
|
N. Ireland |
8.6 |
0.7 |
68.0 |
92 |
178.1 |
120 |
Where does the monthly data come from?
The Met Office’s monthly climate statistics use HadUK‑Grid data to work out county, regional and UK‑wide averages. The dataset takes weather observations from across the country and interpolates them across the UK onto a 1km x 1km grid, covering every part of the UK. Some of these records stretch all the way back to 1836, meaning almost 200 years of weather data.
READ MORE: How do we know when weather records are broken?
READ MORE: What is HadUK-Grid?