
Summer 2026 provisionally hottest on record for the UK
The season’s mean temperature was made around 130 times more likely due to human-induced climate change.
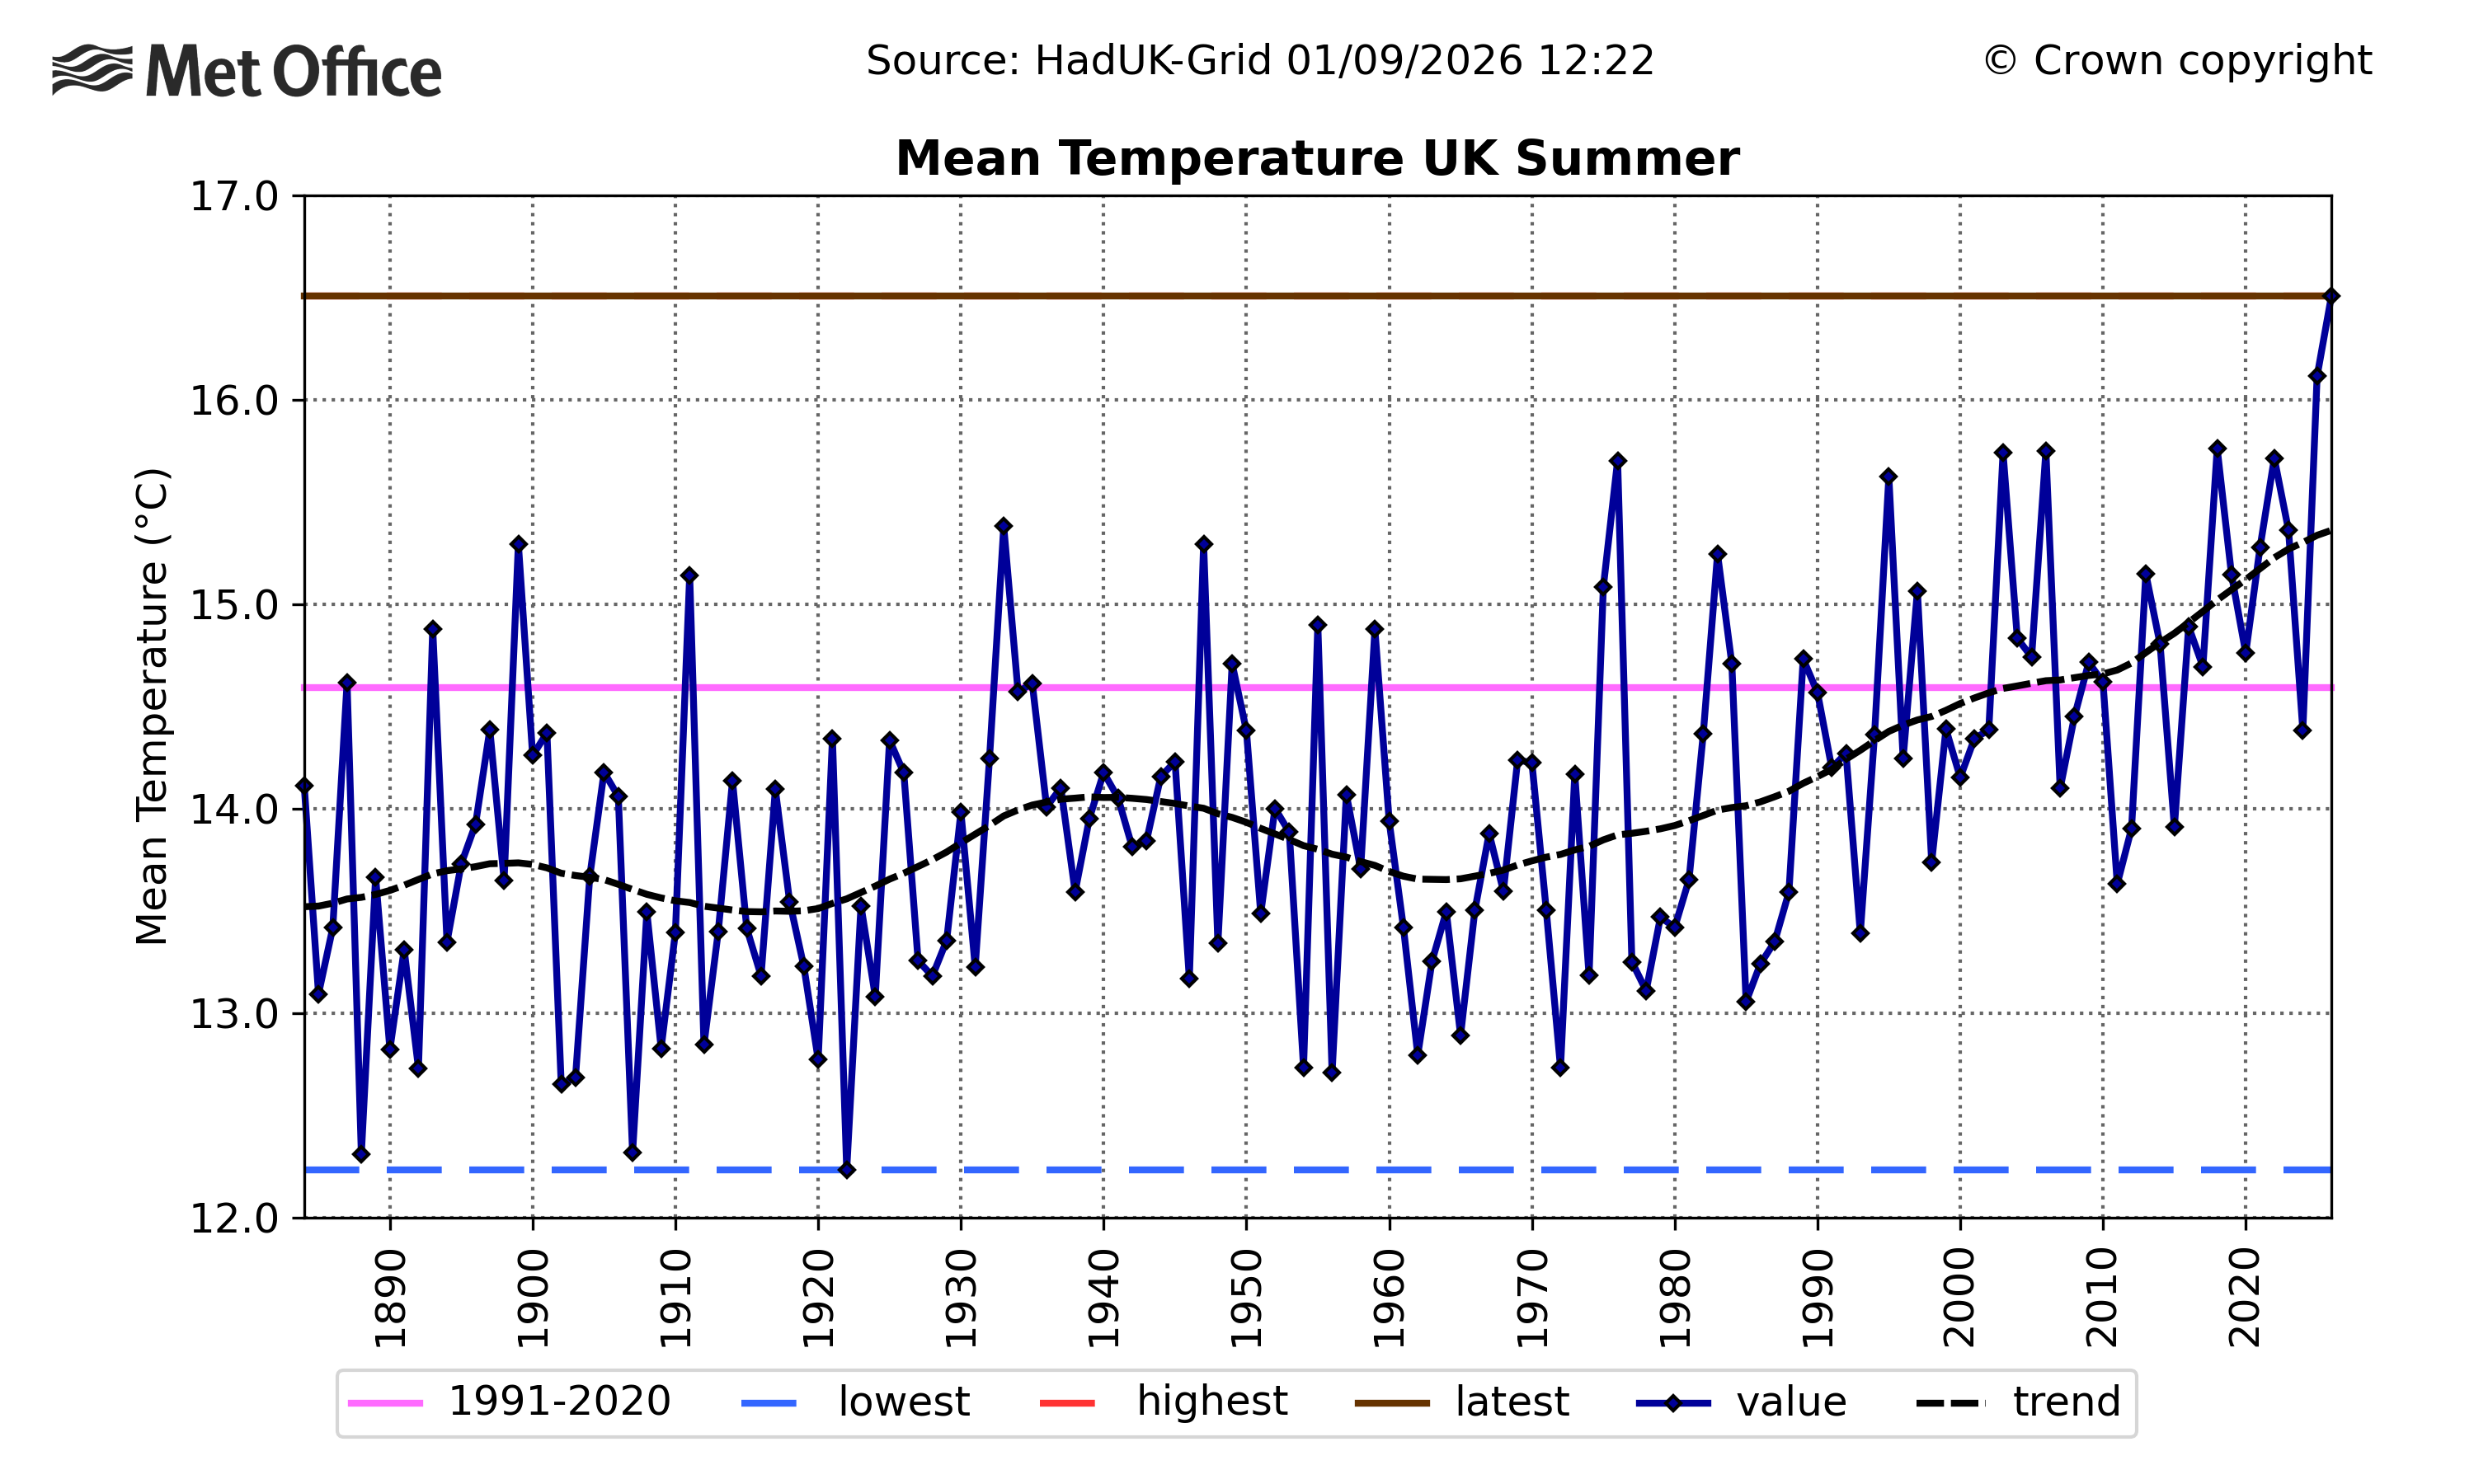
An average mean temperature of 16.5°C puts this summer as provisionally the warmest on record, as well as the warmest season for the UK in a series which goes back to 1884.
It was also one of the sunniest summers on record (dating back to 1910) for some places, with the season being very dry for many, though late season rain helped steer places away from seasonal rainfall records.
Dr Amy Doherty, who leads the National Climate Information Centre at the Met Office said: “The conditions we’ve seen this summer have broken UK climate records once again. These records are now breaking with increasing frequency, reflecting the influence of human-induced climate change on the temperatures we’re experiencing in the UK.
“Particularly notable is how much we’ve exceeded the previous summer mean temperature record, set just last year. The figures also knock the infamous summer of 1976 down to seventh for average summer mean temperature, with the top five warmest summers all occurring since 2003.”
Summer 2026 into the record books
Warmth was never far from the headlines this summer, which followed on the heels of a notable record-breaking heatwave in late spring.
The UK started meteorological summer with the second warmest June on record, swiftly followed by the second warmest July.
While late-August unsettled weather helped ease the temperature figures for that month, the consistency of the warmth through the season has resulted in a new UK summer mean temperature record provisionally being set.
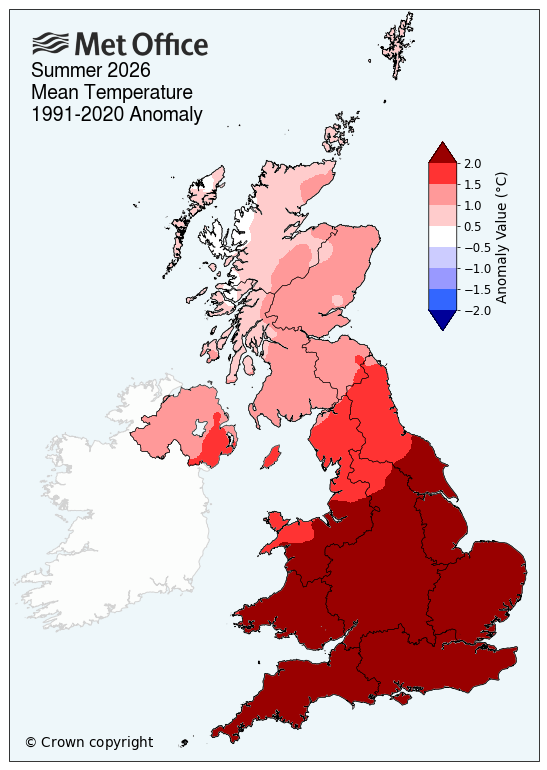
England, Wales and Northern Ireland also broke their respective mean temperature records for summer, while Scotland reported its joint-sixth warmest summer on record.
The five warmest UK summers on record are now:
- 2026: 16.5°C
- 2025: 16.1°C
- 2018: 15.7°C
- 2006: 15.7°C
- 2003: 15.7°C
The infamous summer of 1976 now sits as the seventh warmest on record with respect to mean temperature.
If you look solely at average daytime maximum temperatures through the season, 2026 is also the warmest on record, surpassing the record set in 1976.
Daily temperatures peaked in the season at 38.2°C at Hartpury College on 13 August [Updated 17 September 2026 following newly received data from a manual site at Hartpury College], though it was Lingwood in Norfolk that set a new daily temperature record for the month of June when it reached 38.0°C. In total 54 Met Office weather stations broke their all-time daily maximum temperature record this summer.
The role of climate change
A rapid climate attribution study conducted by Met Office scientists has shown the record-breaking summer was made around 130 times more likely because of human-induced climate change. The rapid analysis used peer-reviewed methods described in this technical report.
By analysing two large ensembles of computer simulations, with one removing human influence on greenhouse gas concentrations, it is possible to assess the influence human induced climate change has had on an event.
Head of Climate Attribution at the Met Office, Dr Mark McCarthy, said: “The summer of 2026 has been remarkable and is an example of the extremes we can expect to see more frequently as a consequence of human induced climate change.
“Our analysis shows a summer like the one we’ve just experienced is now around 130 times more likely because of climate change. In a climate unaffected by human emissions of greenhouse gases, a summer like this would be exceptionally unlikely, i.e. 1 in over 1,000 years. In our current climate, which is changing because of the effect of burning of fossil fuels, we should now expect this to be roughly a 1 in 9 year event."
“The attribution study we conducted at the end of summer 2025, which at the time was record breaking, found that we could experience even hotter summers in our current climate. Just a year later we’re already seeing this play out, with the 2026 summer average temperature 0.40°C higher than 2025, a significant margin for a seasonal temperature.”
The rapid analysis found the estimated return period for a summer like 2026 in a natural climate to be 1,148 years. Note that for an event that extreme the return period estimates carry large uncertainty.
Climate projections indicate that UK summers will continue to become hotter, a trend already evident in the observations.
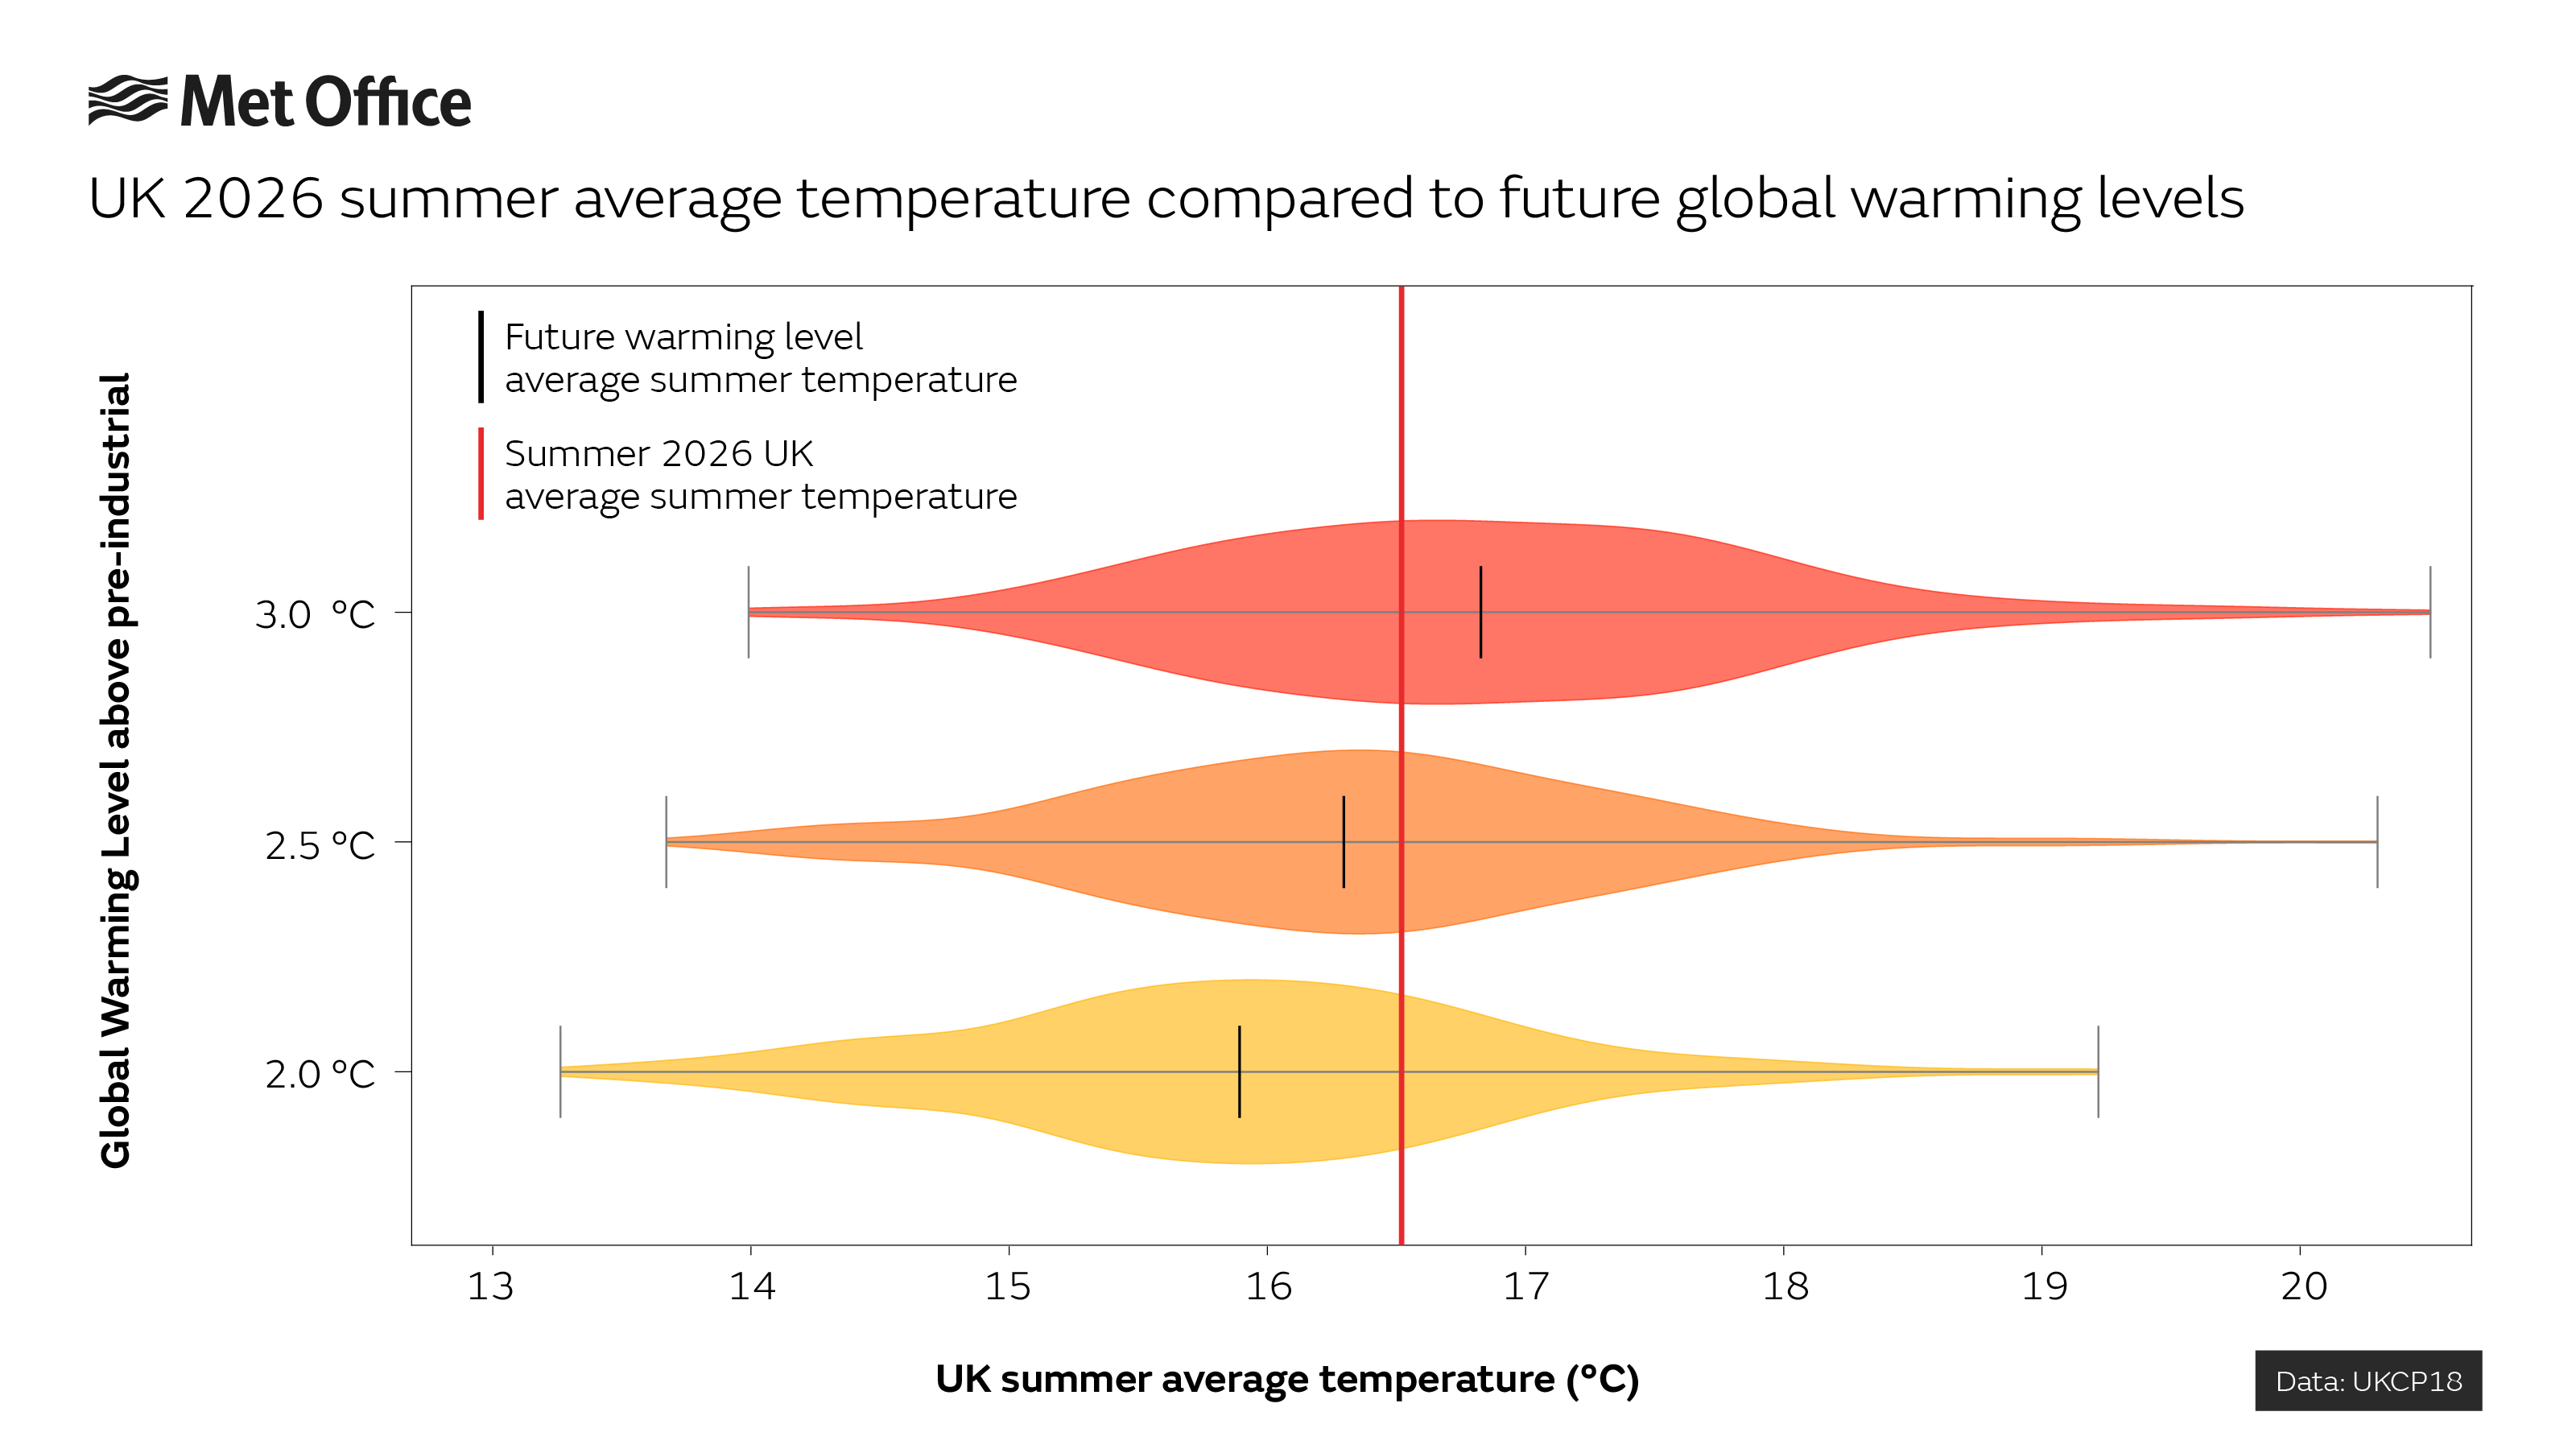
This warming trend is expected to continue as the global average temperature increases in response to emissions of greenhouse gases. Met Office climate projections scientists have also analysed this summer against global climate change projections.
Met Office Climate Scientist, Dr James Pope, said: “When looking at the summer we’ve just experienced in relation to our climate projections, we can see that summer 2026 would be around average for a UK summer in a world 2.5 - 3°C warmer than the pre-industrial period. If emissions of greenhouse gases are reduced and global warming is limited to 2°C this summer would still be a very hot summer. However, in a world that has warmed by 4°C due to continued emissions, summer 2026 would be considered cool or below average."
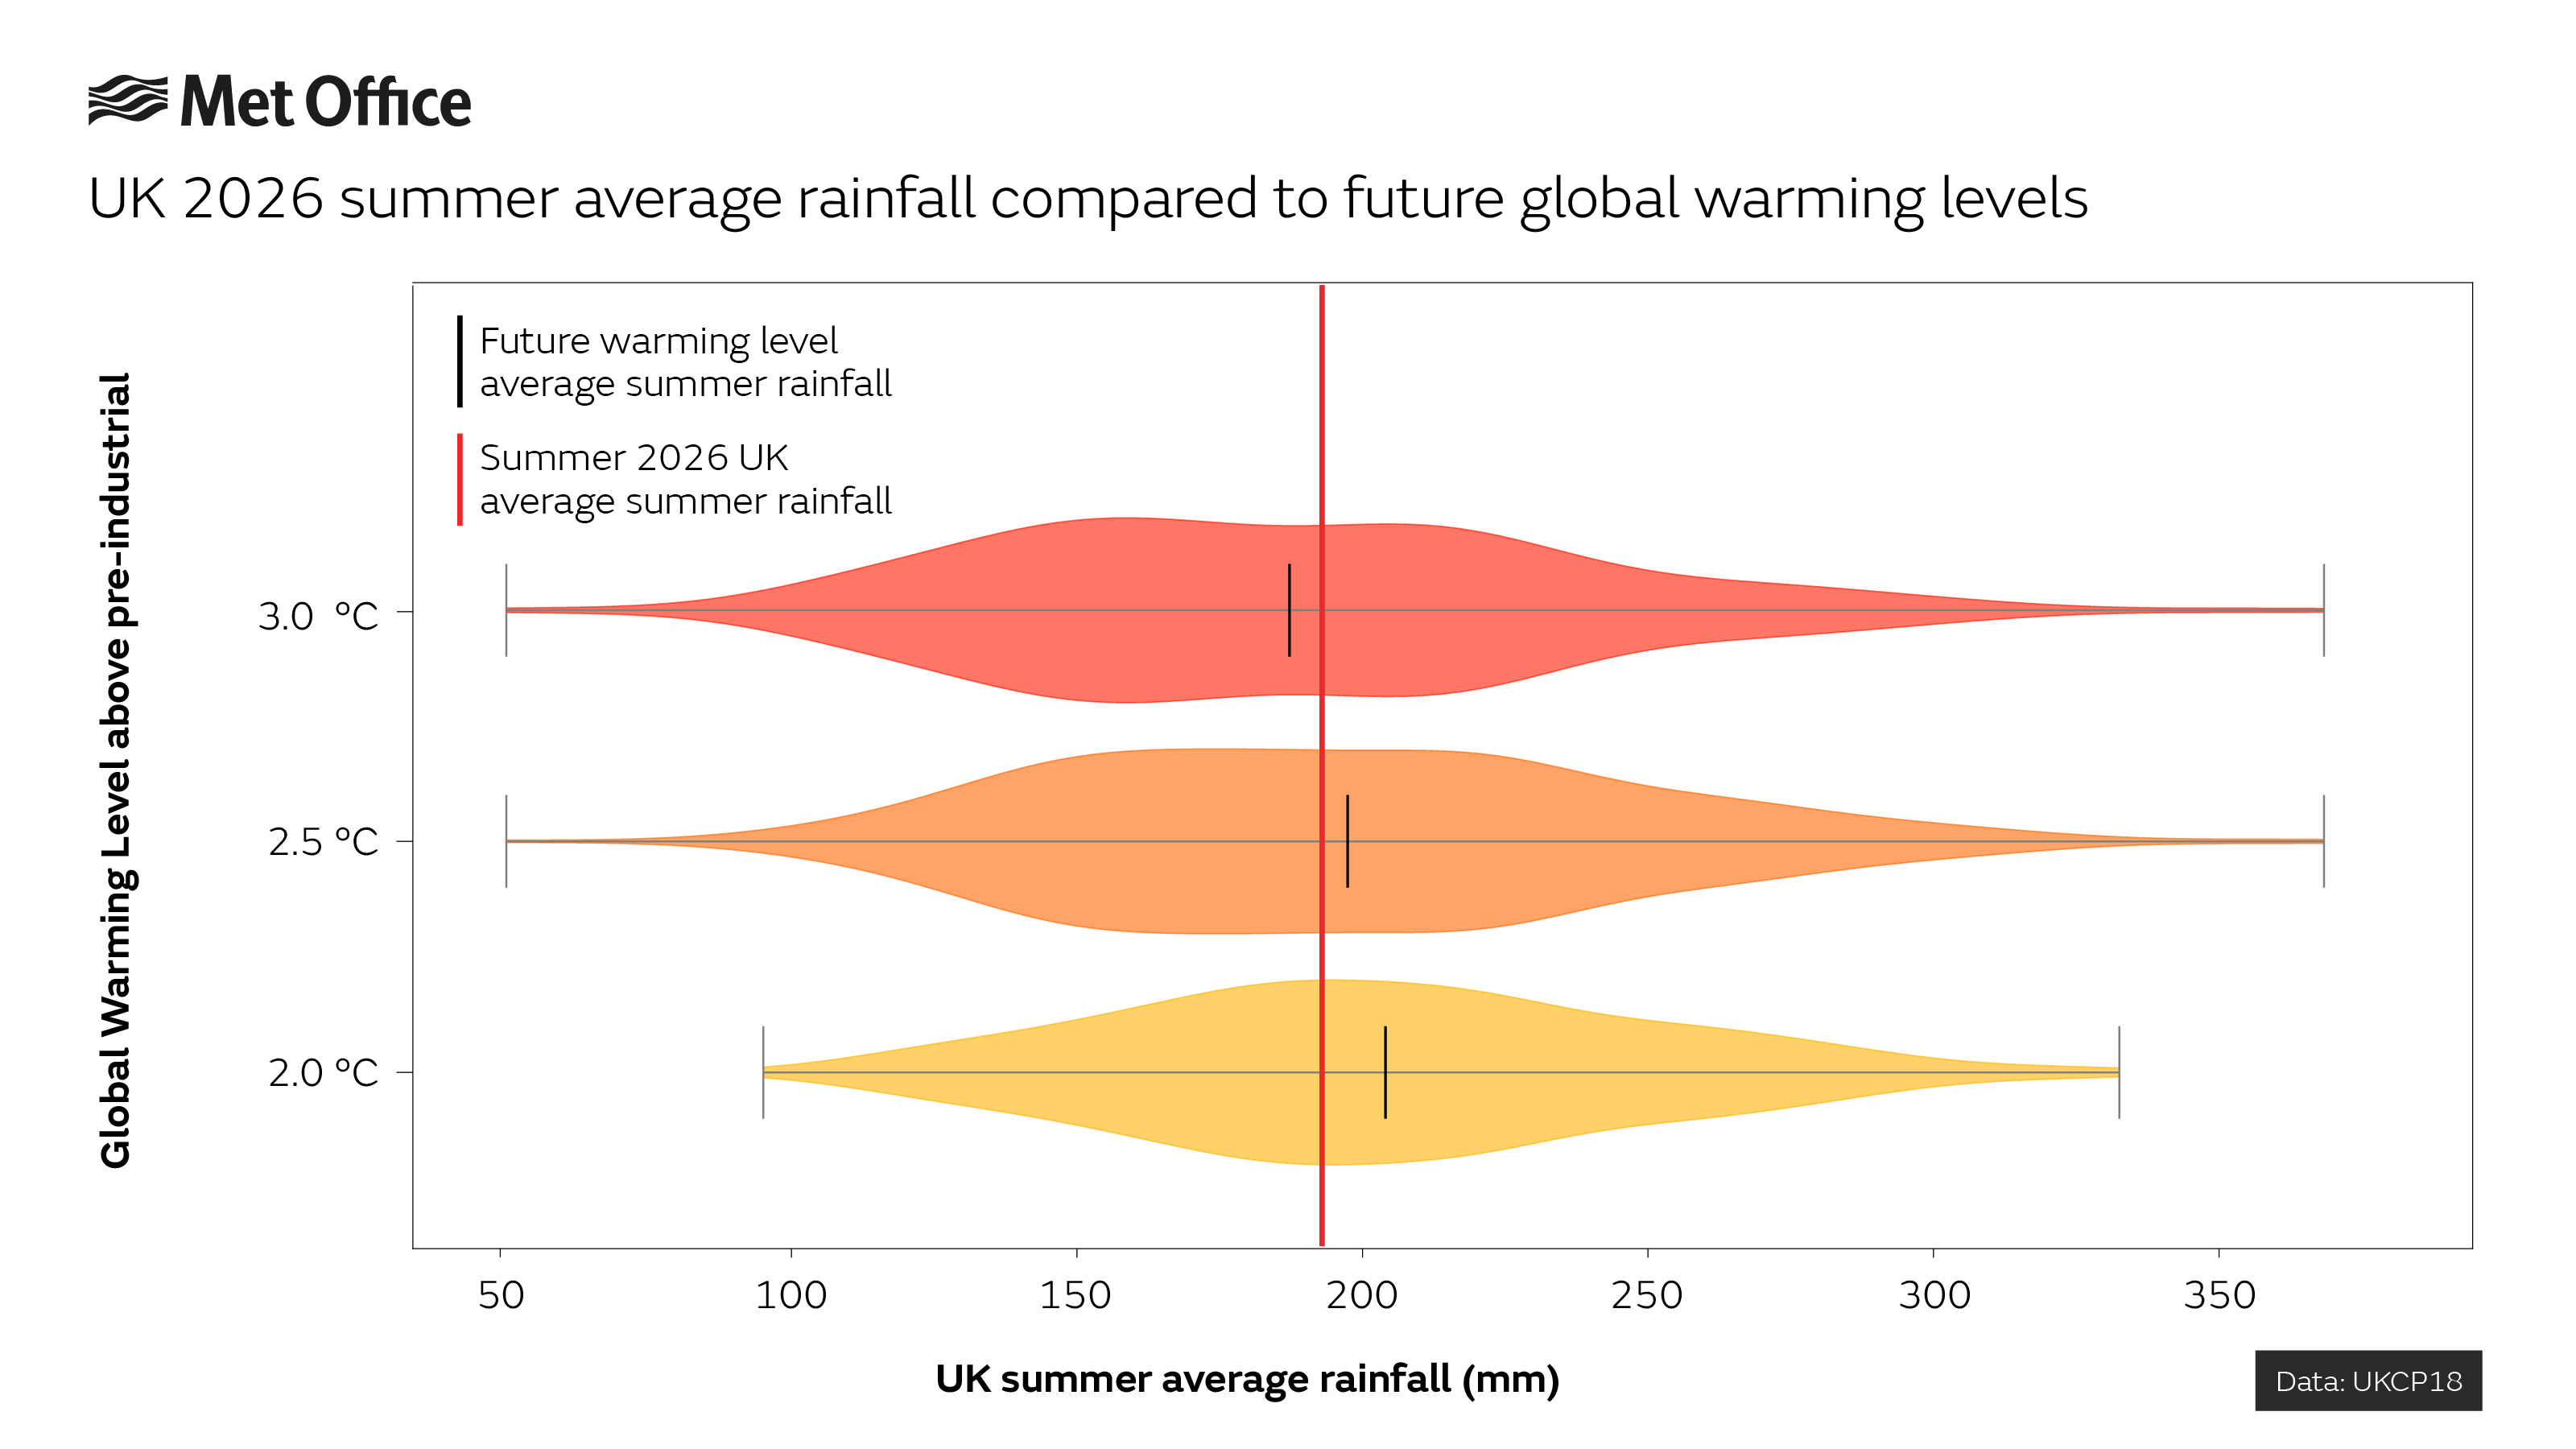
Dr Pope added: “This summer will also be remembered for how dry it has been, particularly in the south in July. Looking at climate projections for rainfall, this summer fits closely to what we would expect an average summer to look like in the UK under 3°C of global warming, as we expect summers to become both hotter and drier in the future.”
Dry season and drought for some
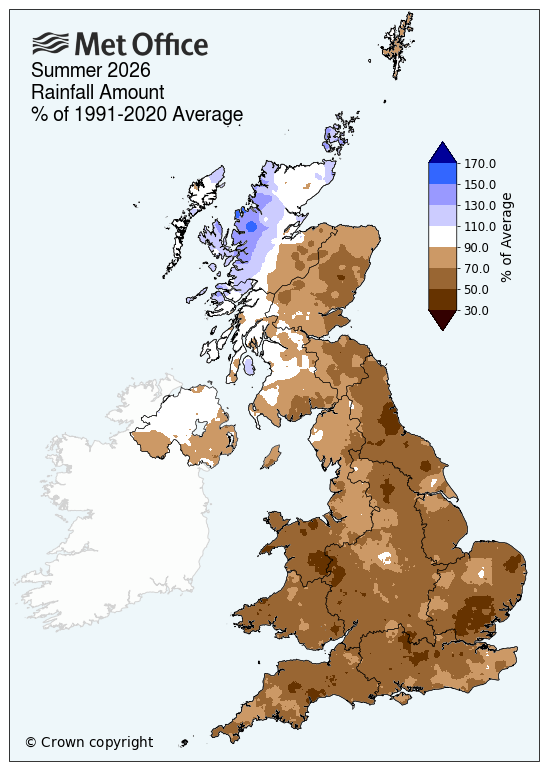
Despite the late-season rain and thunderstorms for some, it did little to make a dent in the overall dryness of summer compared to average.
The UK’s third driest July on record – with England seeing its driest July on record – was notable, but late August rainfall has pushed summer rainfall totals away from any national records, though rainfall amounts do remain below average.
High pressure brought sunshine for many
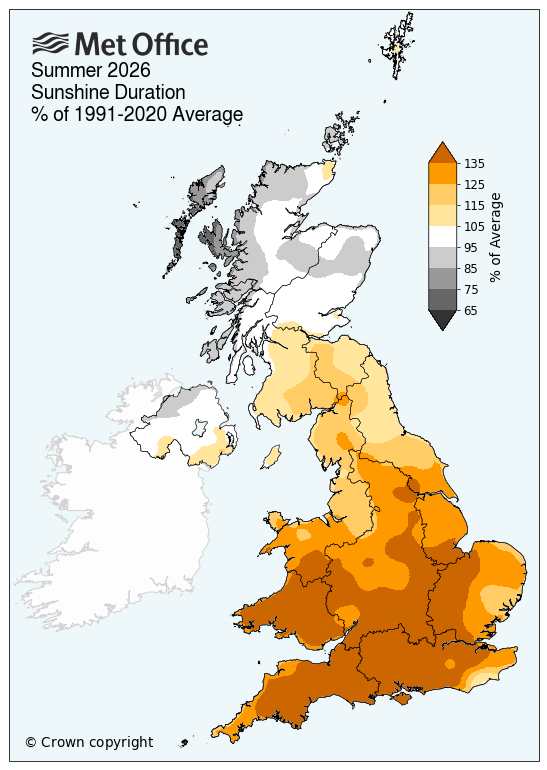
With high pressure helping to develop the warmth of recent months, sunshine has also been in abundance for many areas.
The UK had its sixth sunniest summer on record, with 621.9 hours of sunshine. England and Wales had their respective second sunniest summers on record. Scotland, however, had closer to its average amount of sunshine.
A UK weather station recorded more than 400 hours of sunshine in a calendar month for the first time when Preston Cove House recorded 409.2hrs in July 2026.
St Athan in South Glamorgan set a new Welsh monthly sunshine record with 360.6hrs.
Provisional Summer 2026 statistics
|
Provisional Summer 26 stats |
Mean temp (°C) |
Rainfall (mm/%) |
Sunshine (hours/ %) |
|||
|
|
Actual |
91/20 anomaly |
Actual |
91/20 anomaly |
Actual |
91/20 anomaly |
|
UK |
16.5 |
1.9 |
195.4 |
77 |
621.9 |
123 |
|
England |
18.2 |
2.5 |
132.9 |
64 |
752.2 |
133 |
|
Wales |
16.9 |
2.2 |
179.5 |
59 |
699.4 |
136 |
|
Scotland |
13.8 |
1.0 |
295.0 |
93 |
418.5 |
99 |
|
Northern Ireland |
15.4 |
1.4 |
246.8 |
91 |
424.0 |
100 |
August
Much like the summer as a whole, August saw a month of two halves between north and south of the UK.
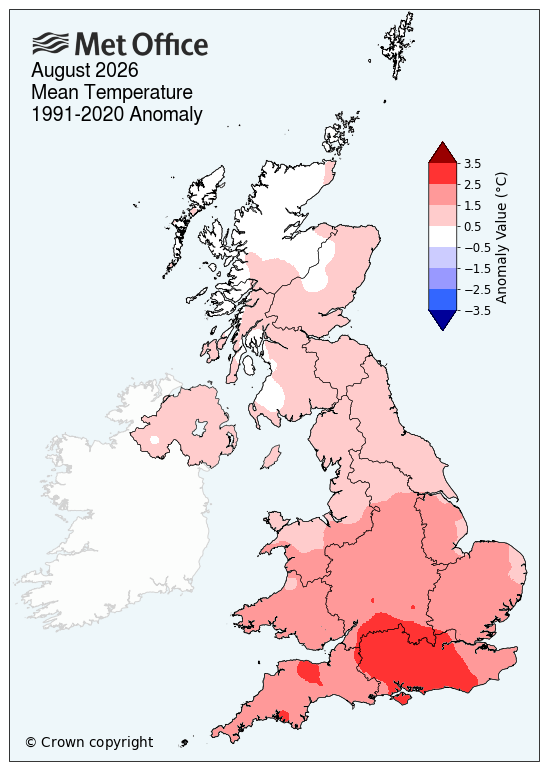
All nations recorded above average mean temperatures for the month, with England the highest above the long term average (1.9°C) and Scotland the closest to average (0.5°C). Mean temperatures were particularly high in the south of England where seven counties broke their August average monthly temperature record including Oxfordshire, East Sussex, Berkshire, West Sussex, Hampshire and Surrey.
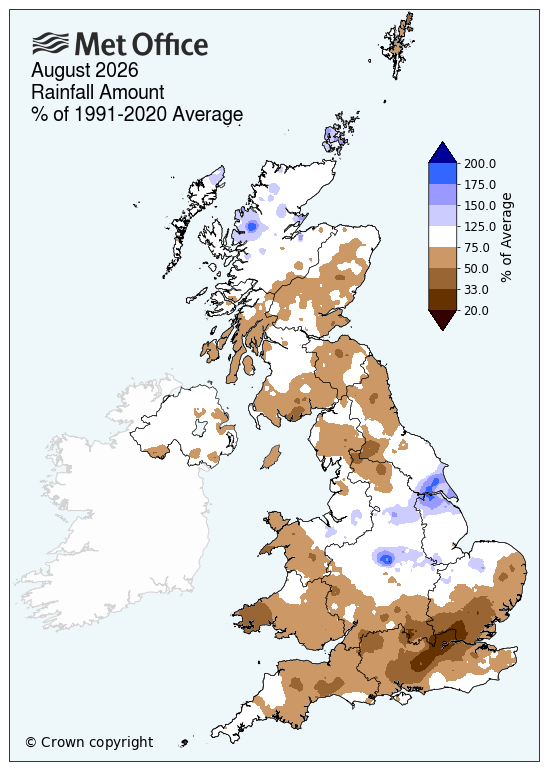
Wide areas of the UK experienced drier than average conditions through much of the month, though intense downpours towards the end of August pushed some areas closer to average. Even with this late month rain, some areas still saw below average rainfall, particularly in Wales and southern England.
Sunshine hours have been split across the UK. The south has generally seen above average sunshine hours, northern England and Wales around average and Northern Ireland and Scotland have recorded below average sunshine hours for the month.
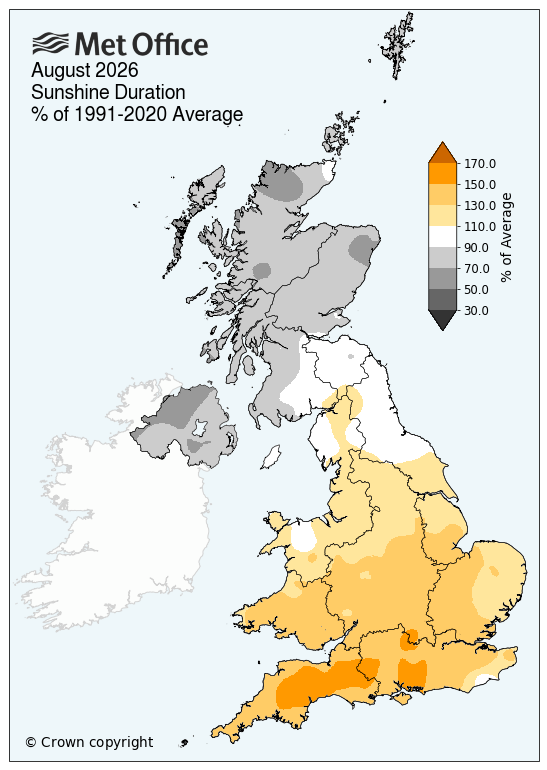
Provisional August 2026 statistics
|
Provisional August 26 stats |
Mean temp (°C) |
Rainfall (mm/%) |
Sunshine (hours/ %) |
|||
|
|
Actual |
91/20 anomaly |
Actual |
91/20 anomaly |
Actual |
91/20 anomaly |
|
UK |
16.5 |
1.4 |
75.8 |
81 |
184.8 |
114 |
|
England |
18.2 |
1.9 |
58.5 |
78 |
236.3 |
131 |
|
Wales |
16.8 |
1.7 |
72.4 |
65 |
205.8 |
129 |
|
Scotland |
13.8 |
0.5 |
104.3 |
87 |
108.8 |
81 |
|
Northern Ireland |
15.2 |
0.7 |
84.3 |
85 |
96.8 |
71 |
Where does the monthly and seasonal data come from?
The Met Office’s monthly climate statistics use HadUK‑Grid data to work out county, regional and UK‑wide averages. The dataset takes weather observations from across the country and interpolates them across the UK onto a 1km x 1km grid, covering every part of the UK. Some of these records stretch all the way back to 1836, meaning we have almost 200 years of data to put today’s changing climate into context.