
La Niña cools 2018 chance of being record year
Author: Press Office
10:09 (UTC) on Thu 21 Dec 2017
The Met Office global temperature forecast suggests that 2018 will be another very warm year globally but is unlikely to be a new record due to a moderate La Niña in the Pacific.
The Met Office forecasts the global average temperature for 2018 to be between 0.88 °C and 1.12 °C, with a central estimate of 1.00 °C, above the pre-industrial average period from 1850–1900. This corresponds to an increase of between 0.28 °C and 0.52 °C, and a central estimate of 0.40 °C above the 1981–2010 long term average of 14.3 °C.
Professor Adam Scaife, head of long-range prediction at the Met Office, said: “2018 will be very warm globally but is unlikely to exceed the recent record, set in 2016.”
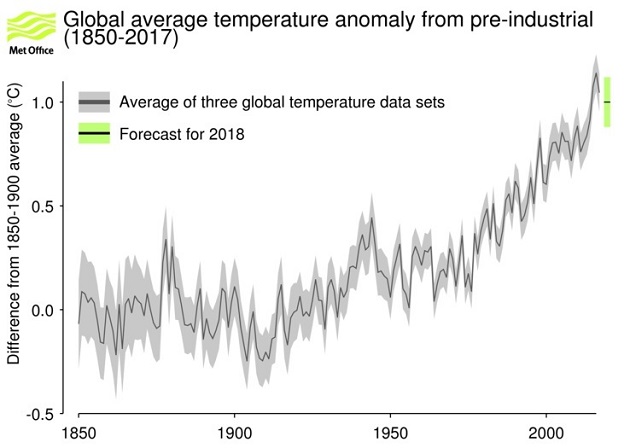
Graph showing global average temperature relative to the 1850–1900 baseline. The grey line and shading shows the 95% uncertainty range. The forecast value for 2018 and its uncertainty range are shown in green and black.
The 2018 forecast is based on the key drivers of the global climate, but it doesn’t include unpredictable incidents such as a large volcanic eruption which would cause a temporary cooling. Professor Scaife added: “For example, Bali’s Mount Agung, which has recently experienced modest eruptions, could cause a temporary but significant drop in global temperatures if it undergoes a major eruption in the coming year.”
The Met Office's forecast for the 2017 global mean temperature agrees closely with the latest observations of global temperature so far this year. Data from Jan-Sep 2017 shows the global mean temperature is 1.05 °C above pre-industrial levels.
The forecast for 2018, including the range of uncertainties, again places the coming year amongst the warmest years on record: 16 of the 17 warmest years on record have now occurred since the year 2000.
Dr Doug Smith, Met Office research fellow, said: “For 2018, the global temperature will remain high, but the current La Niña conditions suggest that average temperatures will be around 0.1 degrees lower than we would otherwise expect in 2018.”
Latest figures for WMO global average temperature anomaly (+/- 0.1 °C) compared to: |
|||
Year |
1850–1900 pre-industrial baseline °C |
1961–1990 average °C
|
1981–2010 average °C |
|
2017 |
1.05 |
0.75 |
0.44 |
|
2016 |
1.14 |
0.84 |
0.53 |
|
2015 |
1.08 |
0.77 |
0.46 |
|
2014 |
0.92 |
0.61 |
0.30 |
|
2013 |
0.84 |
0.54 |
0.23 |
|
2012 |
0.80 |
0.50 |
0.19 |
|
2011 |
0.76 |
0.46 |
0.15 |
|
2010 |
0.89 |
0.58 |
0.27 |
|
2009 |
0.83 |
0.52 |
0.21 |
|
2008 |
0.72 |
0.41 |
0.10 |
|
2007 |
0.81 |
0.51 |
0.20 |
|
2006 |
0.81 |
0.51 |
0.20 |
|
2005 |
0.86 |
0.55 |
0.25 |
|
2004 |
0.75 |
0.45 |
0.14 |
|
2003 |
0.81 |
0.50 |
0.19 |
|
2002 |
0.80 |
0.50 |
0.19 |
|
2001 |
0.74 |
0.43 |
0.13 |
|
2000 |
0.61 |
0.30 |
-0.01 |
|
1999 |
0.61 |
0.31 |
0.00 |
|
1998 |
0.83 |
0.52 |
0.21 |
|
1997 |
0.69 |
0.38 |
0.08 |