Climate change continues to be evident across UK
Author: Press Office
00:01 (UTC+1) on Thu 29 Jul 2021
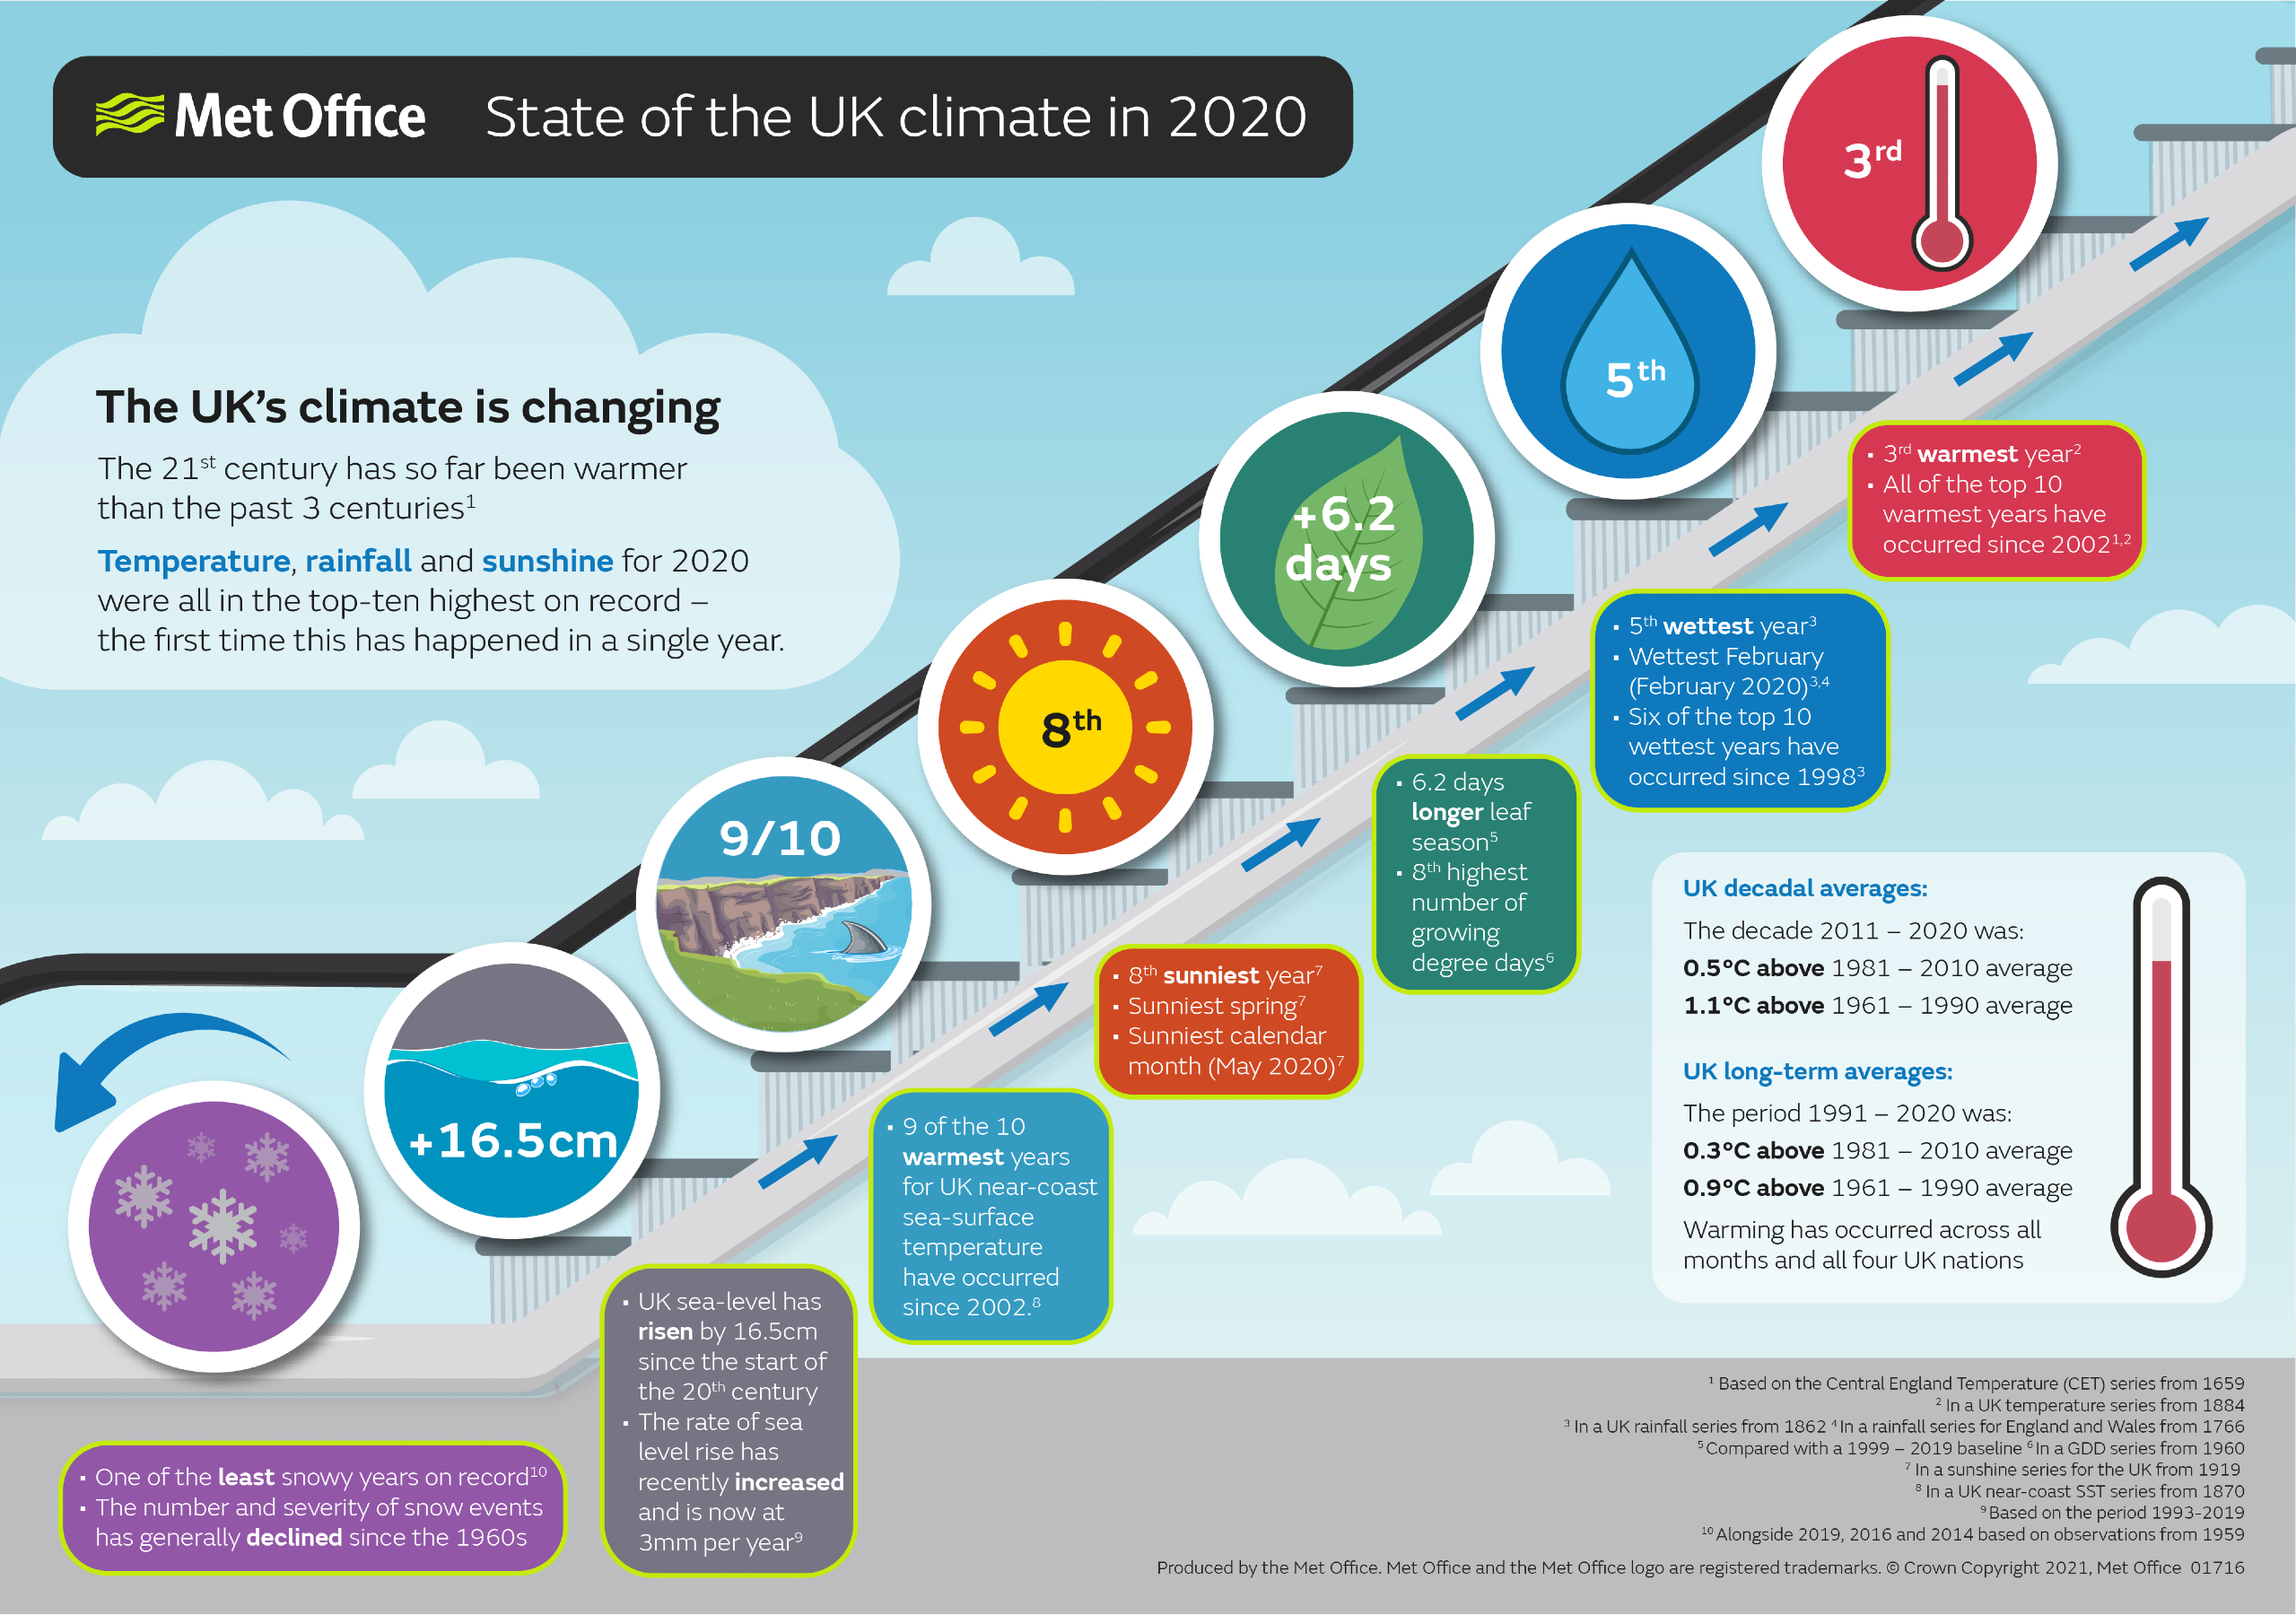
The UK’s climate has continued to warm, with 2020 the first year to have temperature, rain and sunshine rankings all in the top 10.
The latest analysis of the UK climate, State of the UK Climate 2020 published in The Royal Meteorological Society’s ‘International Journal of Climatology’, has shown that climate change is already being felt across the UK. All of the top-ten warmest years for the UK in records back to 1884 have occurred since 2002, and, for central England, the 21st century so far has been warmer than the previous three centuries.
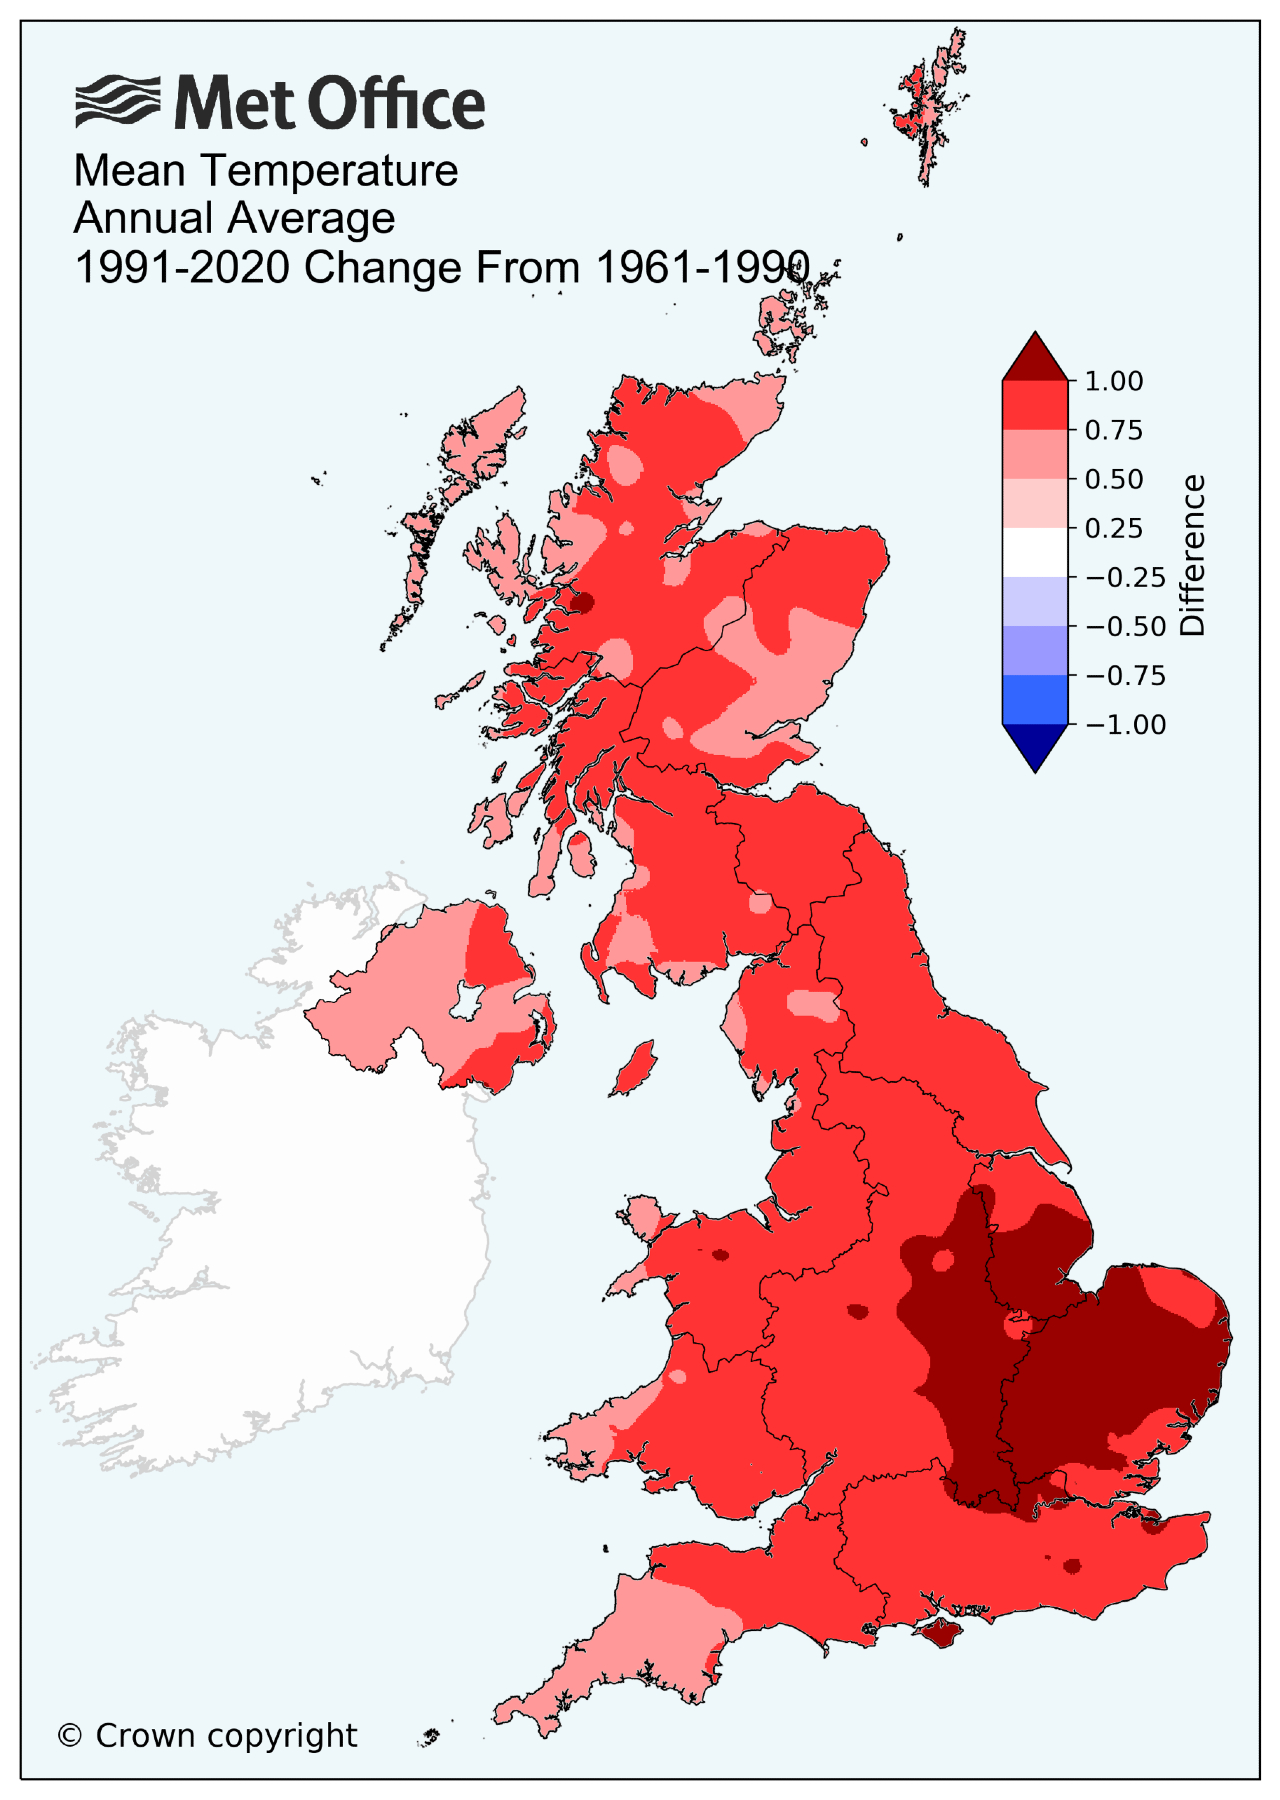
The last 30-year period (1991-2020) has been 0.9°C warmer than the preceding 30 years (1961-1990). The warming trend is evident across all months and all countries in the UK.
The greatest warming compared to 1961-1990 has been across the east Midlands and East Anglia where average annual temperatures have increased by more than 1°C, with the least warming around western coastal fringes and parts of Northern Ireland and Scotland.
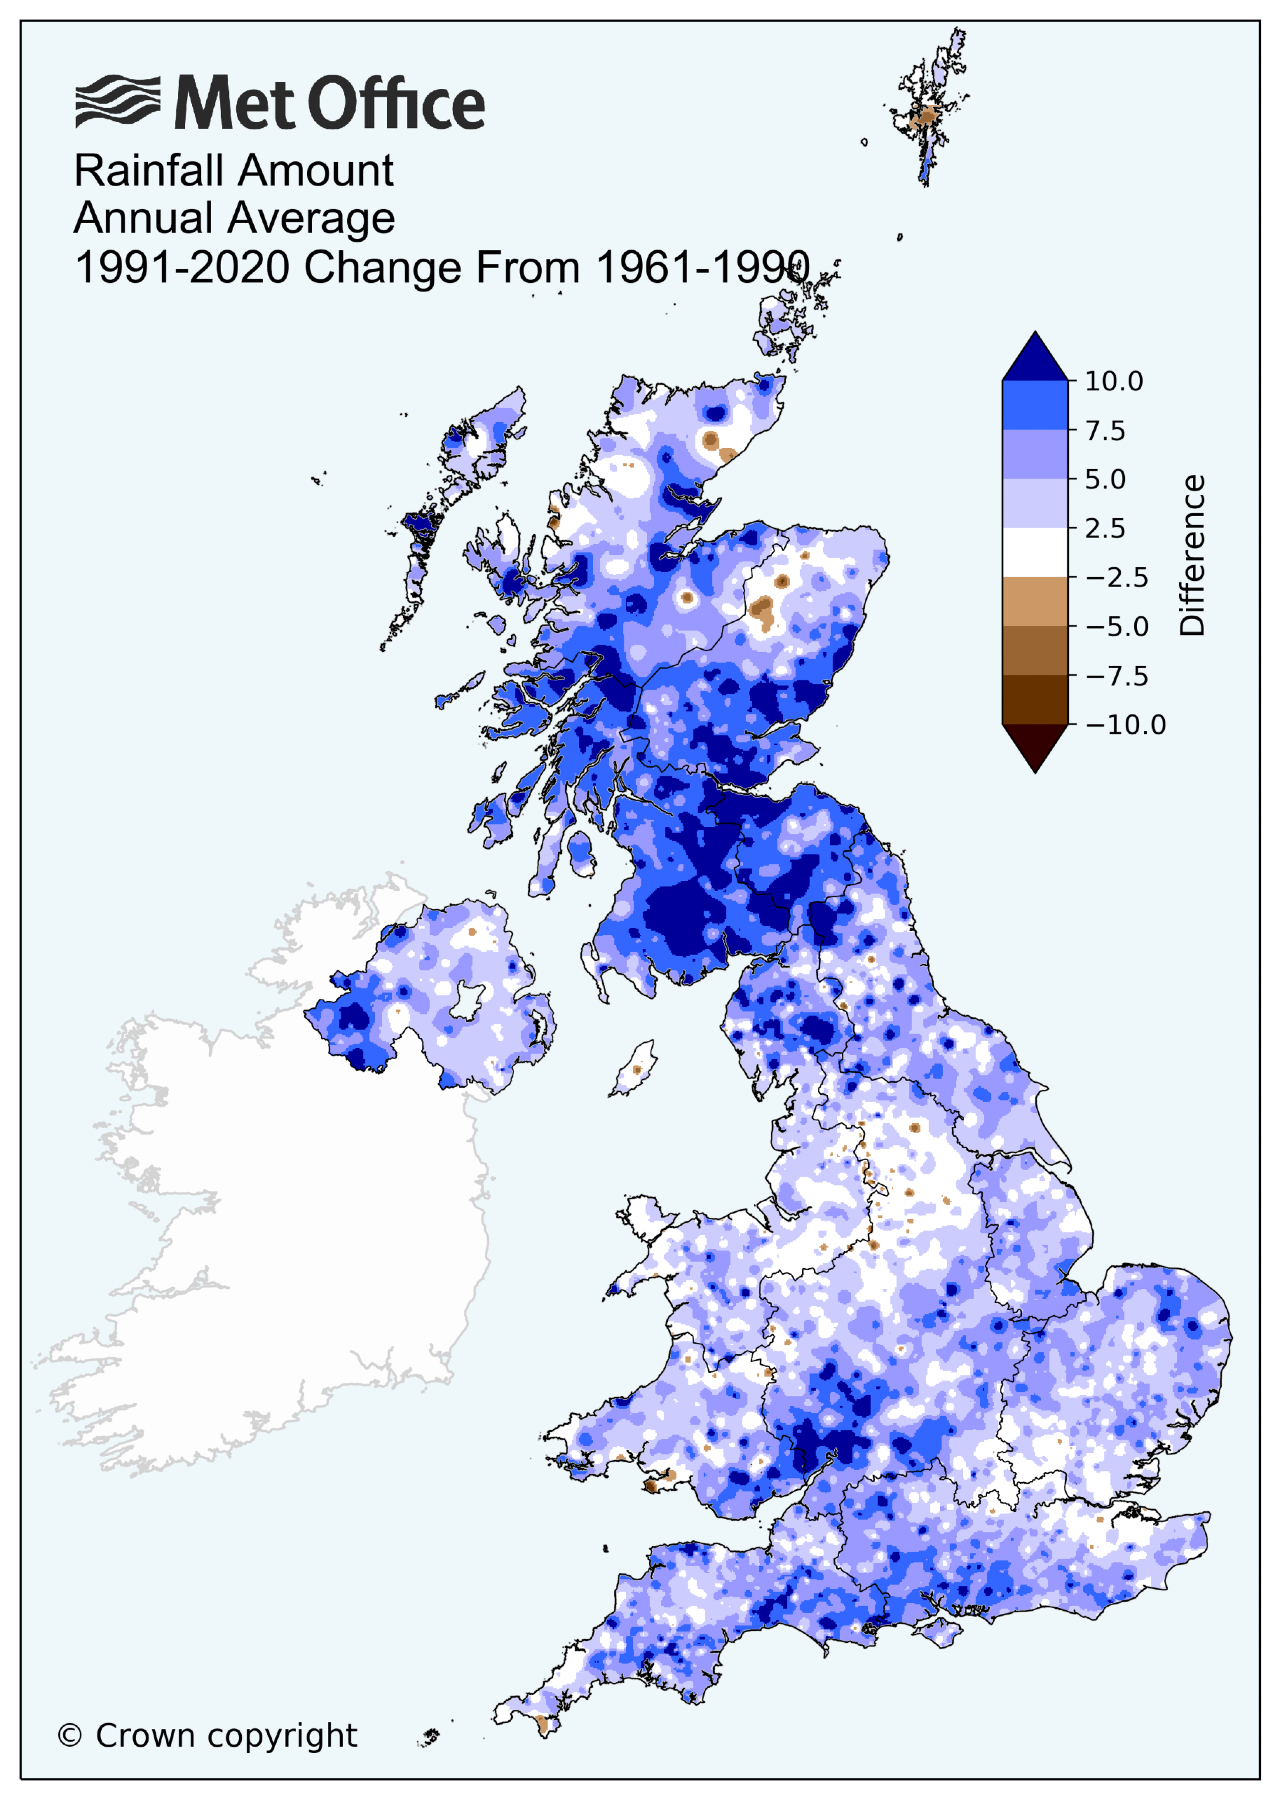
As well as increased temperatures, the UK has been on average 6% wetter over the last 30 years (1991-2020) than the preceding 30 years (1961-1990). Six of the ten wettest years for the UK in a series from 1862 have occurred since 1998.
2020 was the first year that the annual values for rainfall, temperature and sunshine were all in the top ten in the same year. 2020 was third warmest, fifth wettest and eighth sunniest on record for the UK.
 Lead author and Senior Climate Scientist at the Met Office, Mike Kendon, said: “2020 was another notable year for the UK climate, with records broken for daily rainfall and monthly sunshine hours. Average temperatures for the UK continue to climb, with nearly a degree of warming when comparing the most recent 30 years with the preceding 30-year period. Last year saw some significant weather extremes including severe flooding from heavy rainfall in February and a major heatwave in early August.”
Storms Ciara and Dennis, hitting the UK only one week apart, were part of the UK’s wettest February on record, and brought devastating flooding affecting many homes and businesses. Most of the UK received more than twice the February long-term average rainfall, with 300% quite widely in the north and west, and over 400% in parts of the Pennines.
The UK has had its wettest February in 2020, December in 2015, April and June in 2012 and November in 2009 – five out of 12 months – in little over a decade.
It was a dry and exceptionally sunny spring in 2020, especially across the southern half of the UK with over 150% of normal sunshine across England and Wales. The UK recorded 626 hours, 144% of the 1981-2010 long-term average. This was the UK’s sunniest spring on record by a very wide margin, and remarkably also sunnier than all but three summers in UK sunshine series from 1919. May 2020 was England’s driest calendar month since August 1995, with the dry weather making conditions difficult for farmers and growers.
Other notable weather extremes from 2020 include 8 further named storms (in addition to Ciara and Dennis), the UK’s third warmest day on record with 37.8°C recorded at Heathrow on 31 July, the southern England heatwave in August, extreme rain fall in Norfolk on 16th August and exceptionally heavy widespread rainfall on 3 October making this the UK’s wettest day on record.
Prof Liz Bentley, Chief Executive of the Royal Meteorological Society, said: “We recognise the importance of this annual report, published in our International Journal of Climatology, for climate monitoring and collating observations in the UK. This rich legacy of observational data in the UK, stretching as far back as the 17th century, is extremely valuable for ongoing work in climate science, highlighting our changing climate in the UK and our understanding of climate trends, variations and extremes.
“Publishing this data and updates to the trends in an international, peer reviewed journal offers scrutiny and validation of the work, ensures there is a permanent record of the report and increases the reach of this important work that can be cited in other scientific studies. The report can help to update government, businesses, scientists and the public about changes in our climate and the impacts. I’d like to take this opportunity to congratulate and thank the authors who compiled this report.”
The average sea-surface temperature in 2020 for near-coast waters around the UK was 11.9°C, 0.5°C above the 1981-2010 long-term average. This was the eighth-warmest year for UK near-coast sea-surface temperatures in records dating back to 1870.
In the most recent decade (2011-2020) sea-surface temperatures have been 0.7°C warmer than the 1961–1990 average, and nine of the ten warmest years in near-coast sea-surface temperatures have occurred since 2002.
Sea level rise has accelerated in the UK over recent years. The rate of sea level rise has been 1.5mm/yr from the start of the 20th century, however, for the period 1993-2019 it has increased to over 3mm/yr.
Professor Ed Hill, Director the UK’s National Oceanography Centre, the organisation which manages the global database of average sea levels from tide gauges around the world, commented: “Based on five long‐running stations dating back to the beginning of the 20th century, UK sea level has risen by nearly 2 cm per decade over the 60 years to 2018 and an immediate consequence will be higher extreme sea levels during high tides and storms which cause flooding. It’s encouraging to see that investments are being made to prioritise upgrading five sea level index sites. This will enable the UK to contribute to accurate scientific measurements tracking global sea levels and variability.”
These climate variables all have an impact on UK wildlife, with 2020 seeing notably early first leaf dates and also earlier bare tree dates across the UK of four common shrub/tree species: Elder, Hawthorn, Silver Birch and Pedunculate Oak. Elder first leaf was the earliest in its series (15.9 days earlier than the 1999-2019 baseline), occurring in late February. Oak first leaf was also the earliest in its series (8.9 days earlier than the baseline). The early first leaf dates were associated with generally mild conditions through January and February and some notable warmth and sunshine in April.
Professor Tim Sparks, Nature’s Calendar founder and contributing author from the Woodland Trust, said: “Nature's Calendar has now coordinated data collection for over 20 years, and can combine that with records going back to the 18th century. These clearly show how responsive nature has been to a changing climate, and are a clear indicator of future change to our natural environment."
UK 2020 climate extremes
|
Extreme |
Observation |
Date |
Station |
|
Highest daily maximum temperature (09-09 GMT) |
37.8°C |
31 July |
Heathrow, Greater London |
|
Lowest daily minimum temperature (09-09 GMT) |
-10.2°C |
13 February
30 December |
Braemar, Aberdeenshire & Dalwhinnie, Inverness-shire |
|
Lowest daily maximum temperature (09-09 GMT) |
-1.9°C |
30 December |
Carlisle, Cumbria |
|
Highest daily minimum temperature (09-09 GMT) |
22.3°C |
8 August
|
Langdon Bay, Kent |
|
Lowest grass minimum temperature (09-09 GMT) |
-12.7°C |
31 December |
Aboyne, Aberdeenshire |
|
Highest daily rainfall (09-09 GMT) |
239.9mm |
16 August |
East Wretham, Norfolk |
|
Greatest snow depth (09 GMT) |
23cm |
24 February |
Copley, County Durham |
|
Highest daily sunshine |
16.8hr |
16 June |
Fair Isle, Shetland |
|
Highest gust speed |
92Kt 106mph |
27 December |
Needles Old Battery, Isle of Wight |
|
Highest gust speed (mountain) |
115Kt 132mph |
3 February |
Cairngorm Summit, Inverness-shire |