
Observing weather around the UK can be a complex process. But could public observations provide an extra layer of detail? That’s the subject of a recent innovative research project by Met Office scientists.
Homing-in on heat
Met Office scientists have built a new dataset that provides a snapshot of the temperatures experienced in the UK in recent years (2013-2024). This new dataset, called Crowd-Grid, leverages quality-controlled public observations to improve our understanding of the local detail in heatwaves and cold spells, and how it varies across urban and rural areas. This improved understanding can then inform decisions aimed at reducing the impact on the UK population of future heatwave events, for example.
Weather stations directly observe the weather at an individual point, but there are not weather stations everywhere. So for many years it has been standard practice for climatologists to also provide an estimate of weather that is spatially complete, by interpolating the station information to a regular grid. Crowd-Grid is such a dataset, providing daily temperatures on a 1km x 1km grid that covers the UK.
This new dataset has been designed to complement the longstanding HadUK-Grid, which will continue to be informed solely by data collected from official Met Office weather stations with calibrated sensors that meet strict national and international standards. Whereas HadUK-Grid is ideal for monitoring long-term changes in climate, Crowd-Grid offers insight into the temperatures people are already experiencing in everyday life, including on streets and near buildings.
Providing well-informed local detail
Met Office scientist Tim Mitchell has been part of the team working on the Hadley Centre Climate Programme-funded project. He said: “Crowd-Grid is designed as a complementary dataset for the Met Office, including public observations of temperature to better capture those local details that may not be well represented solely by the HadUK-Grid.
“For example, we all remember the day the UK reached 40°C for the first time. But the night before was also exceptionally hot, and the UK record for daily minimum temperature was broken, reaching 26.8°C at a Met Office station at Shirburn Model Farm in Oxfordshire (19.7.2022).
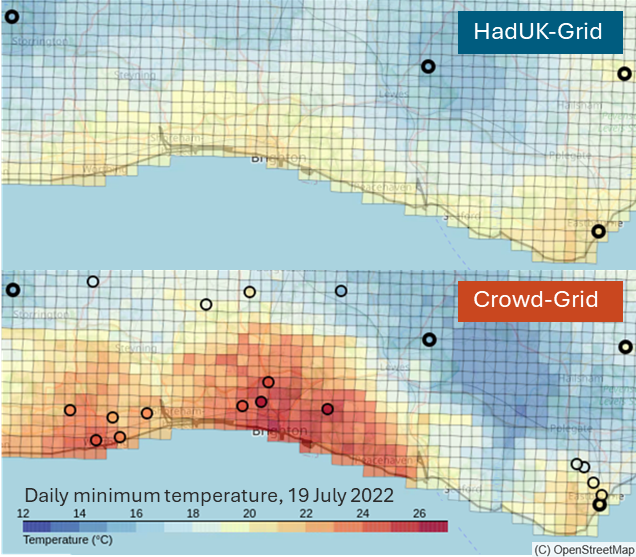
“The greatest heat that night was relatively localised. It would be unrealistic to expect to observe every hotspot using only the official Met Office sites (bold circles). But the additional observations (thin circles) have allowed us to identify areas of heat like this one in Brighton, that would have otherwise escaped notice.”
These spatial details may be valuable for local authorities and others who are making decisions about how to adapt to recent and future climate change. The Crowd-Grid team has also created Recent Heat Packs that provide information about the temperatures experienced recently in each local authority area.
These Recent Heat Packs complement existing information available via the Local Authority Climate Service (LACS), which provides local authorities with easy access to tailored information on climate change to support local adaptation planning.
Tim explained that local authorities could use these in a number of ways. He said: “Some may use a Recent Heat Pack as part of a wider briefing about climate, or for raising awareness about extreme heat. Others might use their Recent Heat Pack to understand how different parts of their area respond to heatwaves, to inform their decisions on infrastructure, health planning, or climate adaptation strategies.
“Seeing the temperatures you have experienced recently helps to put projections of future heatwaves into perspective.”
Quality controlled observations
Crowd-Grid provides a snapshot of a recent UK climate (2013-2024), and the additional data is from public observations collated via the Met Office Weather Observation Website (WOW) and highways agencies, including Transport Scotland, National Highways and the Department for Infrastructure in Northern Ireland. A rigorous quality control process ensures suspect data is rejected, though this is a different process than that applied to official Met Office observations.
Met Office scientist Matthew Fry, a specialist in crowdsourced observations, is part of the team. He said: “We use state-of-the-art software developed by our colleagues at the Norwegian Meteorological Institute specifically for the quality control of crowdsourced observations. This software is in daily operational use in Norway, allowing them to add valuable local detail about temperatures to their weather forecasts. We have expanded how this open-source code is used, by building a recent climate dataset. This is a practical example of the benefits gained from knowledge-sharing across borders.”
Crowd-Grid does have a higher level of uncertainty attached to its values than HadUK-Grid due to the non-standard nature of the additional observation sites and sensors.
Matthew explained: “Crowd-Grid portrays the temperatures we experience across a wider range of local environments than HadUK-Grid – not just grassy fields and parks but also gardens, streets and industrial estates. Each value in Crowd-Grid has to represent the greater variety of temperatures experienced across these settings.”
The value of Crowd-Grid is in its enhanced local detail. This addresses some frequent requests from LACS users for more information about recent climate, and for more local detail. The Recent Heat Factsheets and LACS bring together recent observations with future climate projections.
Tim explained the significance of the new dataset and how it complements the existing HadUK-Grid. He said: “Crowd-Grid is too short as a dataset to measure long-term climate change, but it can provide a depth of detail for recent severe weather events that can be useful for future planning.
“It’s primarily about understanding local detail during heatwaves or cold spells, how differently those may be experienced in urban and rural environments. Ultimately we want to inform decision making as best we can.”
HadUK-Grid
Crowd-Grid is a different, though complementary, dataset to the existing HadUK-Grid, which only includes data from official observation sites, maintained to strict national and international standards.
HadUK-Grid takes quality controlled observations from a standard climate observing network across the UK and interpolates them to a 1km x 1km grid, ensuring continuity of data at a fine resolution around the country.
This dataset is one of the definitive sources of weather and climate information in the UK, stretching back to 1836 for some metrics, and is one of the ways the Met Office can authoritatively compare observations with previous months and years, and is how we know when a month has been its wettest, or a season its sunniest, as well as a range of other variables.
The long time series available in HadUK-Grid allows identification of trends in UK climate, whereas Crowd-Grid does not. However, Crowd-Grid can provide increased local detail that could better inform planners.
Future potential
Crowd-Grid and the Recent Heat Packs are available as a prototype via the CEDA archive. The work to establish the prototype has been funded by the Hadley Centre Climate Programme (HCCP). It is hoped that these outputs will be developed into an operational climate service that can inform local decisions, and to support the UK’s ongoing adaptation to climate change.