Extreme heat is becoming an increasing challenge for cities around the world. Urban areas tend to trap warmth, making heatwaves more intense and potentially hazardous to the people who live, work, and travel through them.
As climate change raises the likelihood of severe heat events, improving the way we forecast heat stress is essential for public safety, planning, and resilience.
A new modelling approach developed by researchers at the Met Office and partner institutions, known as UCanWBGT, aims to do exactly that. By capturing how heat behaves inside an “urban street canyon” (a street flanked by buildings), this innovative method allows heat stress to be calculated more accurately within weather and climate models.
In this article, we explore what urban heat stress is, how UCanWBGT works, and why it represents a step forward in understanding the risks from extreme heat in our towns and cities.
What is heat stress?
Heat stress describes how the human body experiences heat, taking into account more than just air temperature. Four main meteorological factors influence it:
-
Air temperature
-
Humidity
-
Wind speed
-
Radiation (both sunlight and heat emitted from surfaces)
Various indices are used to quantify heat stress, but one of the most widely applied is wet bulb globe temperature (WBGT). Unlike standard temperature, WBGT captures the combined effect of temperature, humidity, radiation, and wind, making it especially useful for outdoor activities such as sport, construction, and military training.
However, calculating WBGT accurately in a city is challenging. Urban areas are complex environments where buildings shade streets, reflect sunlight, and trap heat. These effects can significantly change local conditions, and can be missed by simple models that calculate WBGT over a flat surface. This is where UCanWBGT comes in.
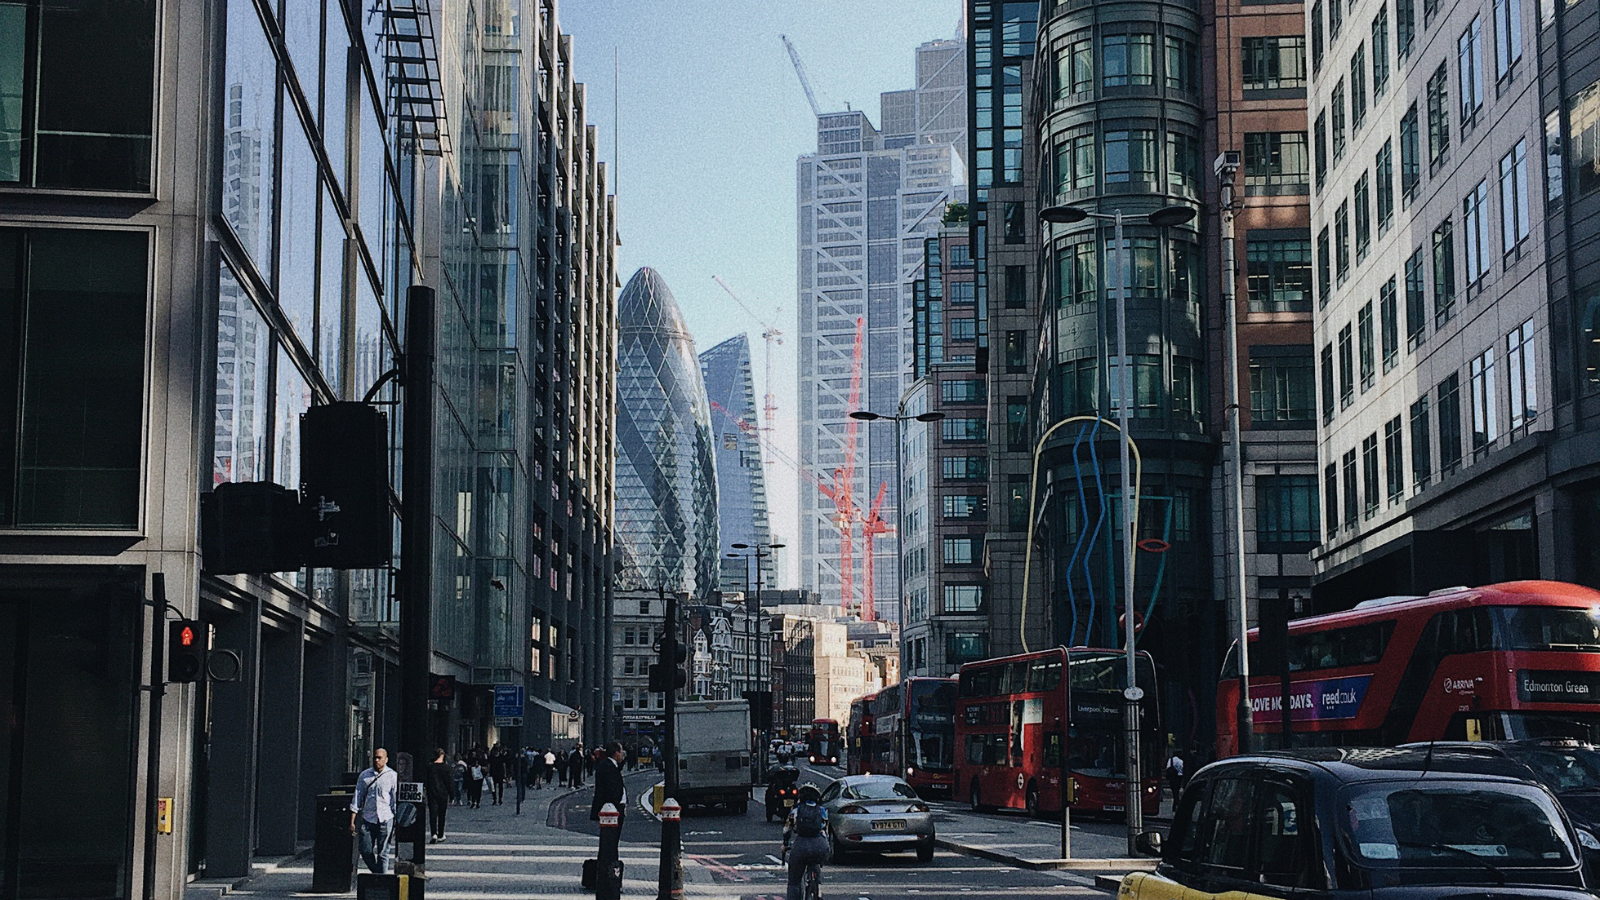
Why urban street canyons matter
Most city streets behave like miniature canyons: tall buildings on each side create a confined space that alters the way heat and radiation move. For example:
-
Buildings may block direct sunlight for parts of the day.
-
Walls and road surfaces reflect sunlight and emit longwave radiation.
-
Narrower streets experience stronger shading and potentially more heat trapping.
-
Wind flow is modified by urban geometry, influencing how heat is dispersed.
These combined effects mean two people standing only a few metres apart, one in direct sun, one in shade, may experience very different levels of heat stress.
UCanWBGT captures this complexity by modelling radiation inside an infinitely long, straight canyon. While simplified, this setup closely represents many real-world streets and allows heat stress to be predicted using analytical (rather than computationally heavy) equations.
How UCanWBGT works
At its core, UCanWBGT calculates how much radiant energy reaches a small black globe placed in the canyon. This represents a black-globe thermometer, which is a standard instrument used in the measurement of WBGT.
The model calculates WBGT in several steps:
1. Calculate the radiation reaching the globe
This includes:
-
Direct sunlight (if the Sun is visible from the globe’s location)
-
Diffuse sunlight reflected from walls, road surfaces, and the sky
-
Longwave radiation emitted from warm walls and roads
The model accounts for whether walls or the road are shaded, how reflective they are, and how much of each surface the globe “sees”.
2. Compute the mean radiant temperature
This value represents the combined effect of all incoming radiation.
3. Estimate the black-globe temperature
Using wind speed and the radiant temperature, the model determines how hot a black globe would become in those conditions.
4. Combine the results into WBGT
Air temperature, humidity, and the black-globe temperature are brought together using standard empirical equations for heat stress.
Because the method uses analytical and empirical formulas rather than intensive numerical techniques, it is quick enough to be incorporated into operational weather and climate models.
How well does it work?
To test UCanWBGT, researchers applied it to high-resolution weather model output for Paris during a September 2023 heatwave. They compared the results with real measurements from black-globe thermometers placed in six different street canyons across the city.
The model performed well, capturing:
-
the daily rise and fall of heat stress
-
the timing of transitions between shaded and sunlit conditions
-
differences between narrow and wide streets
-
enhanced warming at night due to heat emitted by canyon walls
Where discrepancies occurred, they were mostly linked to forecast errors in temperature, humidity, or wind speed—inputs that any WBGT model depends on.
The study also revealed how sensitive heat stress is to street geometry. Increasing building height, for example, extends periods of shading and reduces daytime WBGT. Conversely, using a flat-surface approximation (ignoring buildings entirely) can overestimate heat stress by up to 4°C in the day and underestimate it by around 1.5°C at night.
A practical example: the Paris 2024 Olympic marathon
To demonstrate a real-world application, researchers used UCanWBGT to estimate heat stress along the marathon route for the Paris 2024 Olympics. By calculating WBGT at 100-metre intervals along the course, they identified:
-
periods of the day when heat stress was dangerously high
-
parts of the route where shading from buildings or trees helped reduce risk
-
how start times could be optimised to minimise exposure to high WBGT
For instance, on some days, delaying the start by just one hour could mean the difference between “moderate” and “high” risk for runners.
This kind of analysis could support more informed decision making for event organisers, emergency planners, or public health authorities.
Why this matters
As cities grow and heatwaves become more frequent, tools like UCanWBGT can help us better understand—and forecast, the impacts of extreme heat. By recognising the importance of urban geometry, the model provides more realistic estimates of heat stress in built-up areas, supporting:
-
safer sporting events
-
better public health advice
-
improved understanding of urban heat risk
-
more accurate climate change projections
-
design of cooler, more resilient cities
Senior research scientist, Jon Shonk, said: "Heatwaves are a growing concern in a warmer climate, especially in urban areas where people are most impacted. UCanWBGT allows human heat stress to be determined in a city street environment in both weather forecasts and climate projections. Heat stress predictions with UCanWBGT can be made over whole cities or for specific locations and indeed for specific events -- for example, sporting events or outdoor gatherings in summer. It can also be used to provide day-to-day heat stress forecasts for general activity in city centres."
Urban heat is not just about temperature, it’s about how people experience their environment. With UCanWBGT, weather and climate models can now capture this with greater clarity, helping to protect lives and support planning in a warming world.
You can find the latest forecast on our website, on YouTube, by following us on X and Facebook, as well as on our mobile app which is available for iPhone from the App store and for Android from the Google Play store.