Mauna Loa carbon dioxide forecast for 2022
Forecast of the annual rise in atmospheric carbon dioxide concentration measured at Mauna Loa, Hawaii for 2022
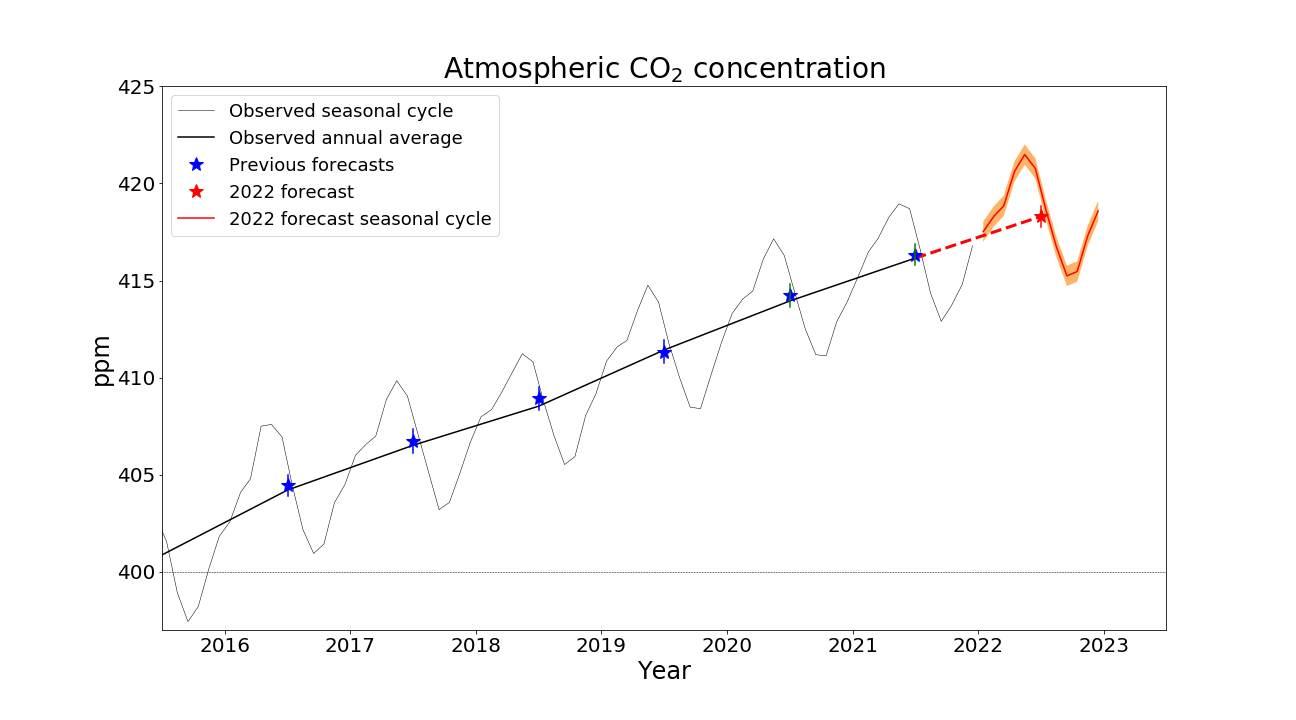
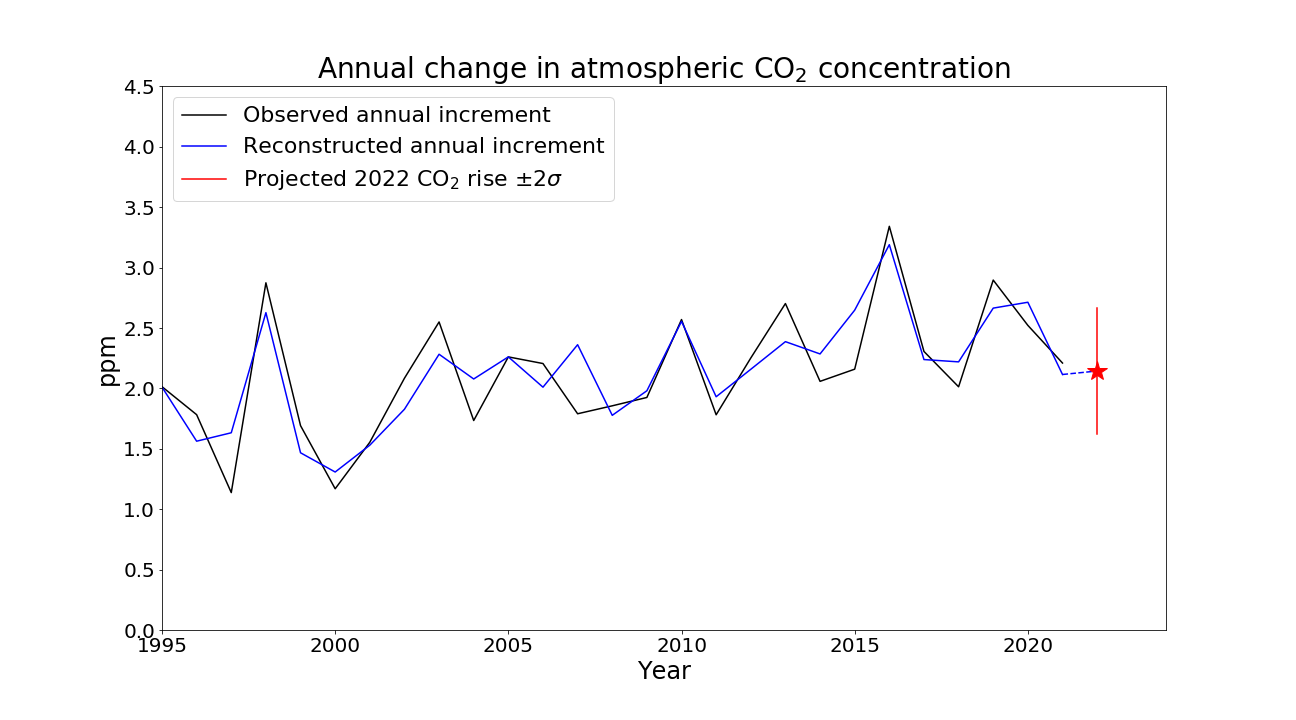
Table 1. Annual emissions and the resulting mean CO2 increment for 2021-2022 calculated with and without La Niña sea surface temperatures (SSTs). The increment is shown both in parts per million (ppm) and gigatonnes of carbon (GtC) to allow comparison with the emissions.
| Annual emissions | Annual CO2 increment with La Niña SSTs | Annual CO2 increment with neutral SSTs |
|---|---|---|
| 10.68 GtC | 2.14 ppm (4.55 GtC) | 2.38 ppm (5.06 GtC) |
We also predict the maximum and minimum monthly values in the seasonal cycle of CO2 concentrations at Mauna Loa. Each year, the CO2 at Mauna Loa increases in the first 5 months, peaks in or around May, then declines for the next 4 months due to the uptake of CO2 by land ecosystems in the northern hemisphere growing season. Following a minimum, which is usually in September, atmospheric CO2 then increases again as autumn and winter leaf-fall and decay cause a release of CO2 back to the atmosphere. In 2022, we predict this seasonal cycle to peak at a monthly mean value of 421.5 ± 0.5 ppm in May (Figure 1, Table 2). This will be the first time in the Keeling Curve record that monthly CO2 levels have exceeded 420 ppm, and from comparison with reconstructions of past CO2 levels from isotopes of carbon and boron in marine sediments, this will be the highest atmospheric CO2 concentration for over 2 million years.
CO2 will then return to a minimum monthly value of 415.2 ± 0.5 ppm in September before rising again.
Table 2. Forecast monthly average CO2 concentrations at Mauna Loa in 2021. The 2 standard deviations uncertainty is ± 0.5 ppm
| Month | Forecast CO2 concentration (ppm) |
|---|---|
| January | 417.5 |
| February | 418.3 |
| March | 418.8 |
| April | 420.6 |
| May | 421.5 |
| June | 420.8 |
| July | 418.7 |
| August | 416.7 |
| September | 415.2 |
| October | 415.4 |
| November | 417.3 |
| December | 418.6 |
This 50% increase above pre-industrial is of symbolic importance because it represents half-way towards "doubled CO2", a standard level of climate forcing used for quantifying the response of global temperatures to human-caused increases in greenhouse gases. Although "halfway to doubled CO2" is not of any physical significance, it can nevertheless be considered a milestone that highlights how much humans have already altered the composition of the global atmosphere and increased the amount of a gas that warms the global climate.
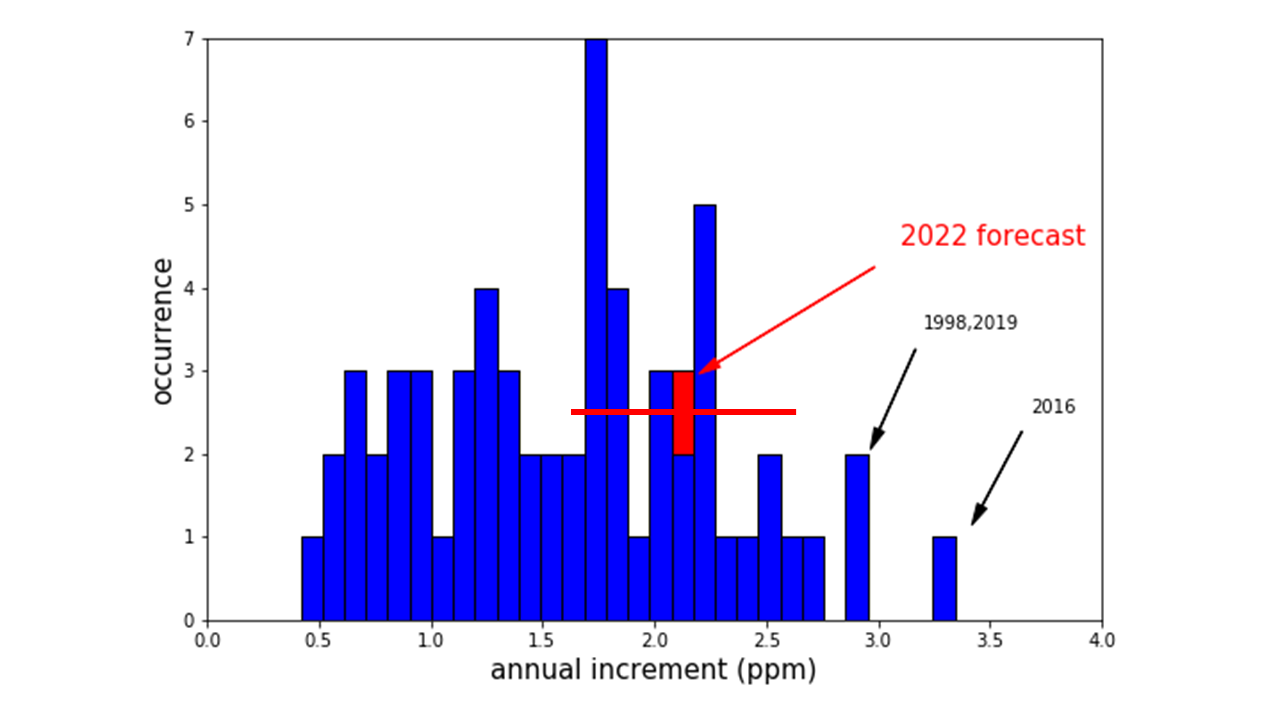
Figure 3. The central estimate of the forecast annual CO2 increment for 2021-2022 in the context of the frequency distribution of the observed annual increment for each year in the Mauna Loa record. The horizontal red bar shows the forecast uncertainty range of ± 0.52 ppm.
Table 3. Decadal average CO2 rises in the Mauna Loa record
| Decade |
Average CO2 rise (ppm per year) |
|---|---|
| 1960s | 0.86 |
| 1970s | 1.22 |
| 1980s | 1.58 |
| 1990s | 1.55 |
| 2000s | 1.91 |
| 2010s | 2.41 |
Comparison with CO2 trajectory consistent with limiting global warming to 1.5°C
The long-term rise in atmospheric CO2 will depend on the rate of anthropogenic emissions. The Paris Agreement commits nations to reducing CO2 emissions as a central part of pursuing efforts to limit the rise in global temperatures to 1.5°C above pre-industrial levels. To illustrate a CO2 concentration trajectory consistent with this goal, the SSP1-1.9 scenario is assessed by the IPCC as limiting warming to 1.5°C in the long term (in the central estimate). This scenario can therefore provide a benchmark against which the observed atmospheric CO2 rise can be compared as part of assessing progress towards the Paris Agreement goal.
If atmospheric CO2 concentrations are to follow those in the SSP1-1.9 scenario, the rate of rise will need to slow rapidly over the next 2 decades and come to a halt in the early 2040s (Figure 4). The average CO2 rise over the 2020s would need to be similar to that forecast here for 2022 (Table 4), but since this year's slower rise is assisted by La Niña conditions which will be temporary, maintaining the low rate of CO2 rise over several years would require immediate and substantial reductions in global CO2 emissions.
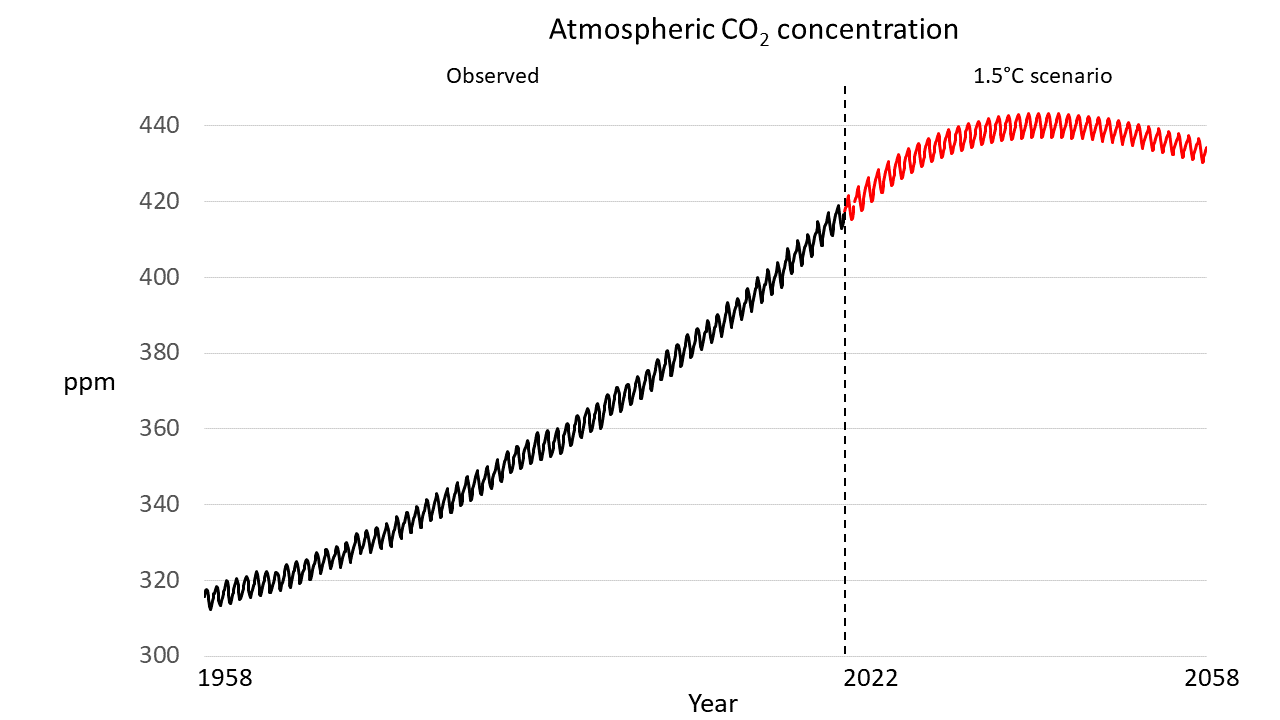
Figure 4. Monthly CO2 concentrations from observations up to 2021 (black) and a future projection consistent with limiting global warming to 1.5°C (red). Observations are the Keeling Curve record at Mauna Loa, from the Scripps Institution for Oceanography, UC San Diego, which began in March 1958. Values for 2022 are the Met Office forecast. From 2023 onwards, monthly values are calculated from the annual mean concentrations in the SSP1-1.9 scenario, with an illustrative seasonal cycle imposed which continues the amplitude seen in recent years. The end date of 2058 is chosen to provide an illustration of a century of CO2 concentrations from the start date of the Keeling Curve record.
For atmospheric CO2 to stop rising completely in the early 2040s as in SSP1-1.9, global CO2 emissions would need to continue to fall rapidly to levels low enough to be balanced by natural carbon sinks. The subsequent decline in atmospheric CO2 concentrations in SSP1-1.9 would require anthropogenic emissions to decline further to zero in approximately the middle of the century, or at least "net zero" whereby any remaining emissions are balanced by direct anthropogenic removal of CO2 from the atmosphere. While SSP1-1.9 is not the only scenario consistent with limiting global warming to 1.5°C, and the compatible emissions pathways are subject to uncertainties in carbon cycle feedbacks, the need for CO2 emissions to reach net zero around mid-century in order to limit global warming to 1.5°C is well-established.
Table 4. Decadal average CO2 rises in the SSP1-1.9 scenario
| Decade |
Average CO2 rise (ppm per year) |
|---|---|
| 2020s | 2.1 |
| 2030s | 0.8 |
|
2040s |
-0.2 |
| 2050s | -0.6 |
Verification of previous CO2 forecasts
The technique used to make this forecast was also used to make forecasts ahead of time for 2016, 2017, 2018, 2019, 2020 and 2021. In 2020 we also issued an updated forecast once it became clear that the response to the Covid-19 pandemic would cause global CO2 emissions to be much smaller than expected that year.
Our usual methodology uses a statistical relationship between the annual CO2 rise, human-caused emissions and changes in sea surface temperature (SST) in the equatorial Pacific Ocean as a measure of the strength of the dominant pattern of natural climate variability that is known to affect the strength of carbon sinks. We use an average of SSTs from ocean observations in recent months and seasonal forecasts for the coming months.
From 2016 to 2019, our forecasts included the assumption that the emissions in the coming year would be the same as the previous year, as normally the year-by-year changes in emissions are not large enough to affect the forecast substantially. Our original forecast for 2020 also made this assumption, while our revised 2020 forecast included an adjustment based on projected emissions profiles across the year applied to an atmospheric transport model. Our forecast for 2021 assumed that global emissions would be the same as 2019, having already returned to near those levels at the end of 2020.
Table 5 compares the 2021 forecasts of annual average CO2 rise and annual CO2 concentrations with measurements at Mauna Loa, along with forecasts and observations from previous years. As with previous years, the 2021 forecast agreed with observations within the forecast uncertainty (2 standard deviations).
Table 5. Summary of forecast and observed CO2 concentrations and rises for 2016, 2017, 2018, 2019, 2020 and 2021. For 2020, both the original forecast and the updated forecast accounting for the Covid-related emissions reductions are shown.
| Year | Forecast CO2 increase from previous year (ppm) | Observed CO2 increase from previous year (ppm) | Forecast annual mean CO2 concentration (ppm) | Observed annual mean CO2 concentrations (ppm) |
|---|---|---|---|---|
| 2021 | 2.29 ± 0.55 | 2.10 | 416.3 ± 0.6 | 416.1 |
| 2020 (updated) | 2.48 ± 0.57 | 2.52 | 414.0 ± 0.6 | 414.0 |
|
2020 (original) |
2.74 ± 0.57 | 2.52 | 414.2 ± 0.6 | 414.0 |
| 2019 | 2.74 ± 0.58 | 2.90 | 411.3 ± 0.6 | 411.5 |
| 2018 | 2.29 ± 0.59 | 2.00 | 408.9 ± 0.6 | 408.6 |
| 2017 | 2.46 ± 0.61 | 2.31 | 406.8 ± 0.6 | 406.6 |
| 2016 | 3.15 ± 0.53 | 3.39 | 404.5 ± 0.6 | 404.3 |
Figure 5 and Table 6 compare the 2021 forecast with observations for each month. In our forecast we had assigned the same uncertainty to monthly and annual values, but this ignores the role of within-year impacts such as periods of fire activity in areas not typically affected by ENSO, or anomalous wind directions at the measurement site at Mauna Loa. Quantification of these additional sources of uncertainty at monthly levels are a topic of ongoing research. and our stated uncertainty on the monthly averages will therefore be an underestimate.
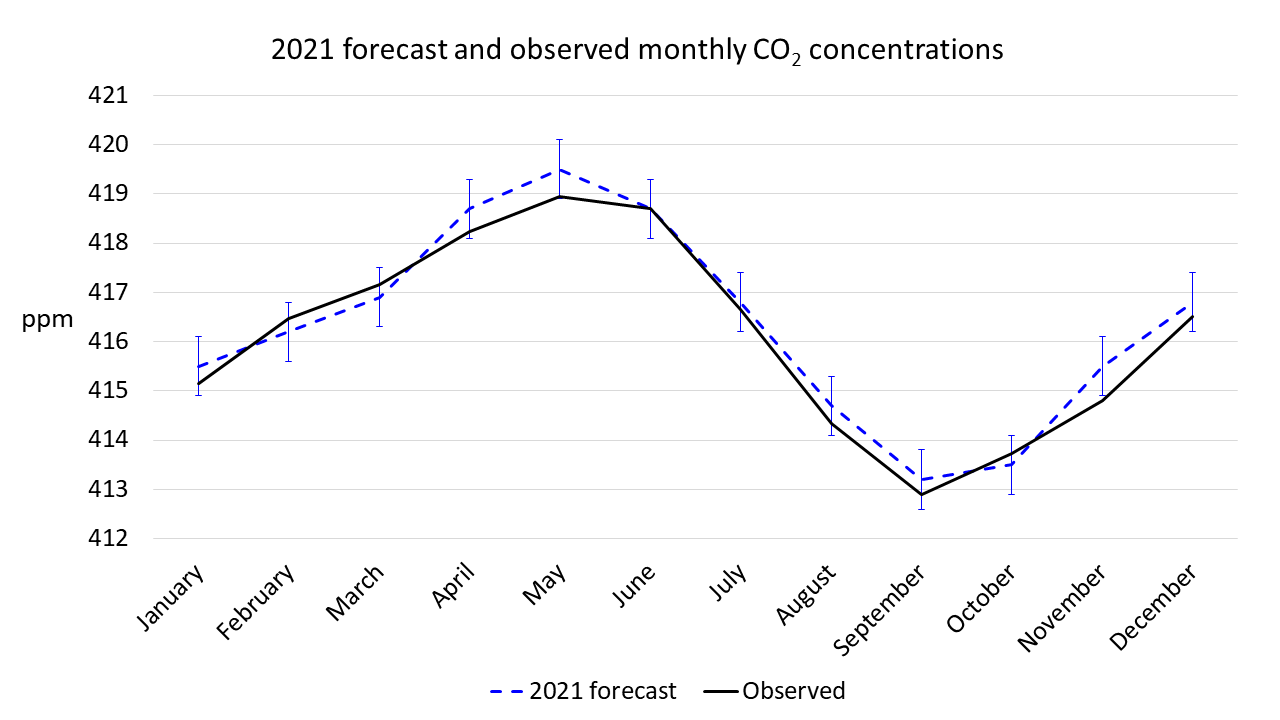
Figure 5. Comparison of Met Office forecasts of monthly CO2 concentrations in 2021 at Mauna Loa (dashed blue line) with measurements for 2021 (solid black line) from the Scripps Institution for Oceanography UC San Diego. The vertical blue lines show the forecast uncertainty range (2 standard deviations).
Table 6. Forecast and observed monthly average CO2 concentrations at Mauna Loa over 2021. The uncertainty in the forecast values was ±0.6 ppm. Observed monthly averages for January to September are those published by the Scripps Institution for Oceanography at UC San Diego.
| Month | Forecast (ppm) | Observations (ppm) |
|---|---|---|
| January | 415.5 | 415.2 |
| February | 416.2 | 416.5 |
| March | 416.9 | 417.2 |
| April | 418.7 | 418.2 |
| May | 419.5 | 419.0 |
| June | 418.7 | 418.7 |
| July | 416.8 | 416.7 |
| August | 414.7 | 414.3 |
| September | 413.2 | 412.9 |
| October | 413.5 | 413.6 |
| November | 415.5 | 414.8 |
| December | 416.8 | 416.4 |
Contributions of anthropogenic emissions and varying natural carbon sinks to the CO2 rise
Long-term increases in observed CO2 are entirely the result of human-caused emissions of carbon dioxide into the atmosphere – more than enough CO2 has been emitted by fossil fuel burning, cement production and deforestation to account for the increase measured in the atmosphere. Although CO2 concentrations have now increased by about 50% since the industrial revolution, this increase would have been almost twice as large if some CO2 had not been removed from the atmosphere through being absorbed by plants and the oceans.
These natural sinks of carbon vary in strength from year to year as a result of short-term fluctuations in climate, principally through El Niño Southern Oscillation (ENSO) cycles in the Tropical Pacific Ocean. The annual CO2 rise is faster during El Niño conditions and slower during La Niña conditions. The Met Office CO2 forecast therefore takes account of both anthropogenic emissions and the impacts of climate variability on natural carbon sinks. So far, including the effect of ENSO variability has in all years brought the central value of the CO2 rise forecast closer to the observations than when considering anthropogenic emissions alone (Figure 6).
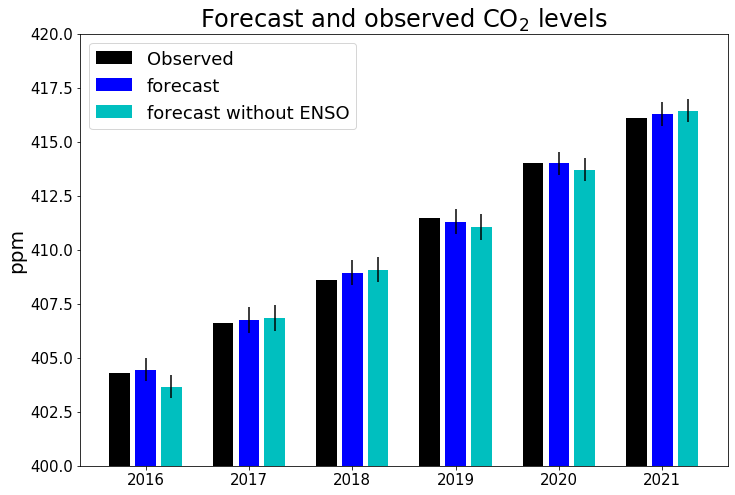
Figure 6. Observed (black) and forecast (dark blue) annual average CO2 concentrations for 2016, 2017, 2018, 2019, 2020 and 2021, and re-forecast values based on emissions alone, without the effects of ENSO (light blue). Thin black lines show the forecast uncertainty range (2 standard deviations).
Note: definitions of annual CO2 rise, increment and growth rate
We define the annual CO2 rise or annual increment for a particular year as the difference in annual average concentration for that calendar year and that of the previous calendar year. This is different to the definition of annual 'growth rate' as published by NOAA which is the average change across an individual calendar year.
Acknowledgement: The Met Office thanks Matthew Jones for assistance with data processing
Published 12th January 2022. Updated 11th February 2022 with confirmed observed value of Mauna Loa CO2 for October, November and December 2021.