Future changes in British Isles weather patterns
December 2021 – New research from the Met Office investigates future changes in British Isles weather patterns using the UK Climate Projections (UKCP).
A new study from Pope et al. shows that in winter the British Isles can expect an increase in the occurrence of westerly storm events, and a decrease in settled and colder conditions. This indicates a shift towards warmer, wetter winter conditions. In summer, the opposite is projected, with an increase in dry and warm settled conditions associated with warmer summer weather and a decrease in westerly conditions and large-scale frontal precipitation. This indicates a shift towards hotter, drier summer conditions. These results are consistent with the headline messages from the UK Climate Projections and are based on combining the set of 30 Met Office weather patterns and an ensemble of climate models from the UK Climate Projections. While the results summarised here align with the UKCP headline findings, the use of the weather patterns allows for a regional analysis to be undertaken in sectors such as flood management, agriculture and public health.
Warmer, wetter winters
During the winter (Figure 1), the results indicate that there is an increase in the occurrence of weather patterns associated with stormy westerly low-pressure conditions. These weather patterns currently bring large-scale frontal precipitation to the British Isles and milder air from the Atlantic. The results also indicate a decrease in the duration of these patterns, meaning that when they occur, they occur for a shorter period of time. This is considered to indicate that in a winter, we could expect to see a greater number of individual westerly stormy events. By contrast, weather patterns associated with settled conditions and also those associated with easterly flow, decrease in both occurrence and duration. This indicates that the likelihood of calm, dry conditions or cold conditions (associated with easterly flow) are decreased in winter, and when they do occur they last for a shorter length of time.
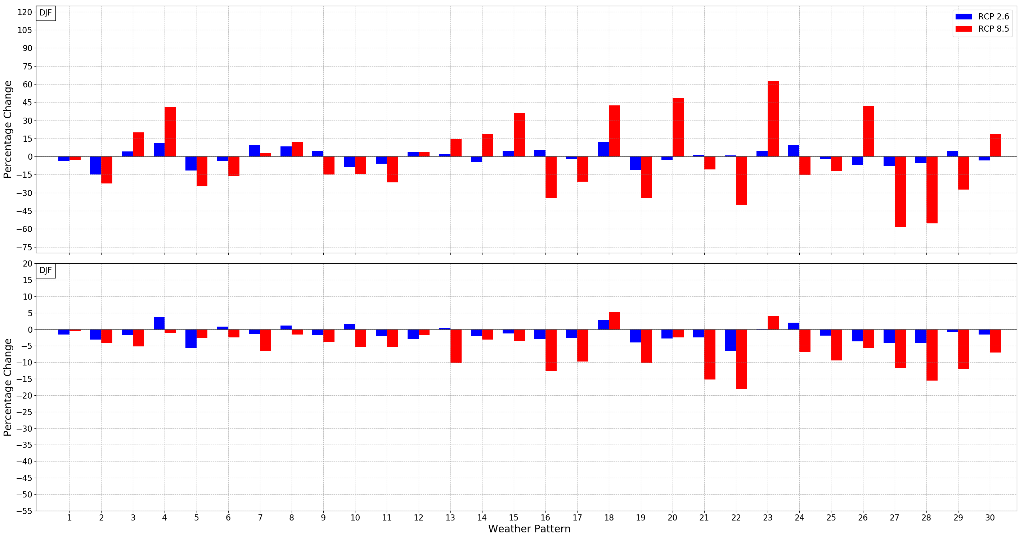
Figure 1. Percentage change in winter (DJF) frequency (occurrence) of each weather pattern (top) and persistence (duration) for the high emissions (RCP 8.5) and low emissions scenario (RCP 2.6) for the PPE-15 members of UKCP Global.
Hotter, drier summers
During summer (Figure 2), the results indicate an increase in the occurrence of weather patterns associated with dry and warmer conditions over the UK. A selection of these patterns also shows an increase in their duration indicating the potential for the development of blocking events in the summer. By contrast there is a decrease in the occurrence and duration of the stormy westerly patterns, indicating a reduction in the occurrence of large-scale frontal precipitation in the summer. These changes in summer weather patterns see increases in patterns that are (1) associated with drought conditions (Richardson et al., 2017) with less flow from the Atlantic, and (2) an increase in poor air quality (e.g. Fenech et al., 2019).
For both the winter and summer responses, there is the same broad response when looking at the low emissions scenario, however the response is much smaller for nearly all patterns.
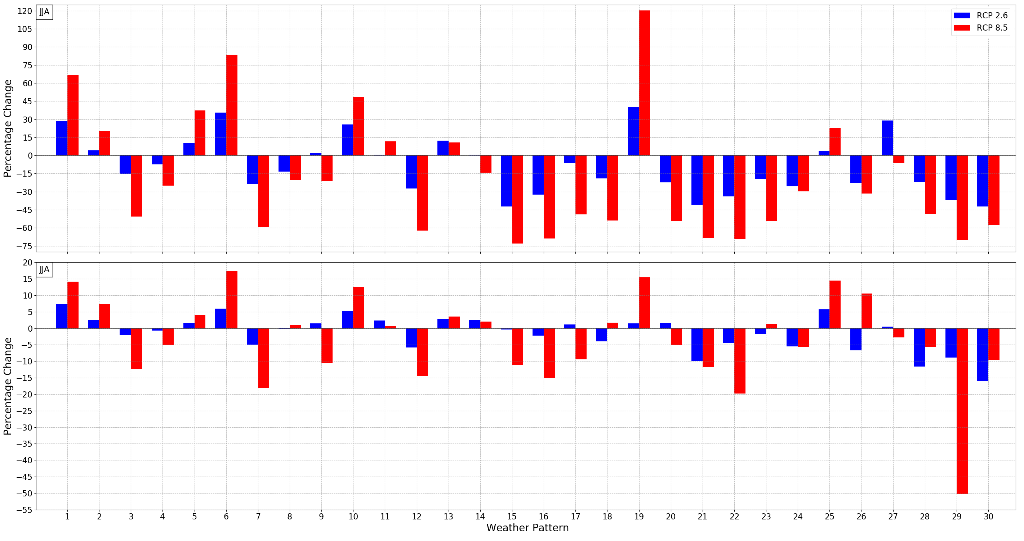
Figure 2. Percentage change in summer (JJA) frequency (occurrence) of each weather pattern (top) and persistence (duration) for the high emissions (RCP 8.5) and low emissions scenario (RCP 2.6) for the PPE-15 members of UKCP Global.
Combining weather analysis tools and climate projections
A number of sectors are considering their needs to adapt to future changes in climate, and to do this they require climate information on a finer spatial scale than is traditionally produced from global climate models. While it is possible to run climate models at higher resolution, down to a scale of a couple of kilometres (rather than the ~60 km scale of global models); these simulations require an immense amount of computer power and time. This limits the number of simulations that can be performed to explore the uncertainty in these future projections.
A number of tools are available in the analysis of weather trends which focus on large-scale metrics and utilise the information in global climate models. An example is the set of 30 Met Office weather patterns used in this new research. Developed by Neal et al. (2016), these patterns represent the broad range of mean sea level pressure (MSLP) conditions experienced over the North Atlantic-European domain which drive the weather that experienced in the British Isles. They are used in the operational medium-range (one to two-week) probabilistic forecast guidance tools, whereby ensemble forecast members are objectively assigned to the closest matching weather pattern definitions. The same principles were used to apply the weather patterns to the UKCP Global model ensemble.
Daily MSLP fields were taken from each member of the UKCP Global ensemble for two emissions scenarios (the high emissions scenario RCP 8.5 and the low emissions scenario RCP 2.6) were assigned a weather pattern (one pattern per day), utilising the same methodology used by the operational tool. The results for the end of the 21st Century are presented as changes to a historical baseline from the 20th Century, calculating the change in occurrence (frequency) and the duration (persistence) of each weather pattern.
Applications of this work
While the results summarised here align with the UKCP headline findings, the use of the weather patterns allows for a regional analysis to be undertaken. By assessing historical relationships between impactful weather events and the associated weather pattern, it is possible to determine which specific weather patterns are of interest to a locality and how it is projected to change in the future. The results above are a summary of work that has applications for understanding future impacts from flooding (fluvial and coastal), heatwaves, and climate-health impacts amongst others.
Detailed methodology
The 2018 UK Climate Projections (UKCP) represent a broad suite of projections combining probabilistic projections, marine projections and three climate model ensembles at different resolutions: Global (60 km), Regional (12 km) and Local (2.2 km). Here we use UKCP Global, a 28-member ensemble consisting of a 15-member perturbed physics ensemble (the PPE-15) and 13 members from phase 5 of the Coupled Model Intercomparison Project (the CMIP5-13). All ensemble members were run from 1st December 1899 to 30th November 2099, with the Earth’s surface divided up into 60 km squares. All 28 UKCP Global members were run for a high emissions scenario (RCP 8.5) and the PPE-15 was also run at a low emissions scenario (RCP 2.6). Daily MSLP fields were assigned a weather pattern (one pattern per day), utilising the same methodology used by the operational tool; based on the pattern having the smallest difference in the distance between the location of pressure centres.
The results were determined as the percentage change between the late 21st Century Period (2071-2099) and the baseline period (1900-2010). Two metrics were assessed, the frequency (or occurrence) of each weather pattern and the persistence (or duration) of each weather pattern. Frequency was calculated by counting the number of days in each period a weather pattern occurred and converting this to a percentage. Persistence was calculated by dividing the number of days a pattern occurred in a period by the number of occurrences of that pattern (where an occurrence is a block of that pattern, irrespective of the number of days). The persistence of each pattern in each period was then converted into a percentage.
References
- Fenech et al. (2019) Meteorological drivers and mortality associated with O3 and PM2.5 air pollution episodes in the UK in 2006. https://doi.org/10.1016/j.atmosenv.2019.06.030
- Neal et al. (2016) A flexible approach to defining weather patterns and their application in weather forecasting over Europe. https://doi.org/10.1002/met.1563
- Pope et al. (2021) Investigation of future climate change over the British Isles using weather patterns. https://doi.org/10.1007%2Fs00382-021-06031-0
- Richardson et al. (2017) A new precipitation and drought climatology based on weather patterns. https://doi.org/10.1002/joc.5199