Dull and mild February brings wet winter to a close
The Met Office has released its provisional statistics for Winter 2025/26 and February 2026, revealing a season characterised by persistent wet weather and stark regional rainfall contrasts.
February then brought some of the lowest sunshine totals on record for all four UK nations, alongside some exceptionally mild conditions.
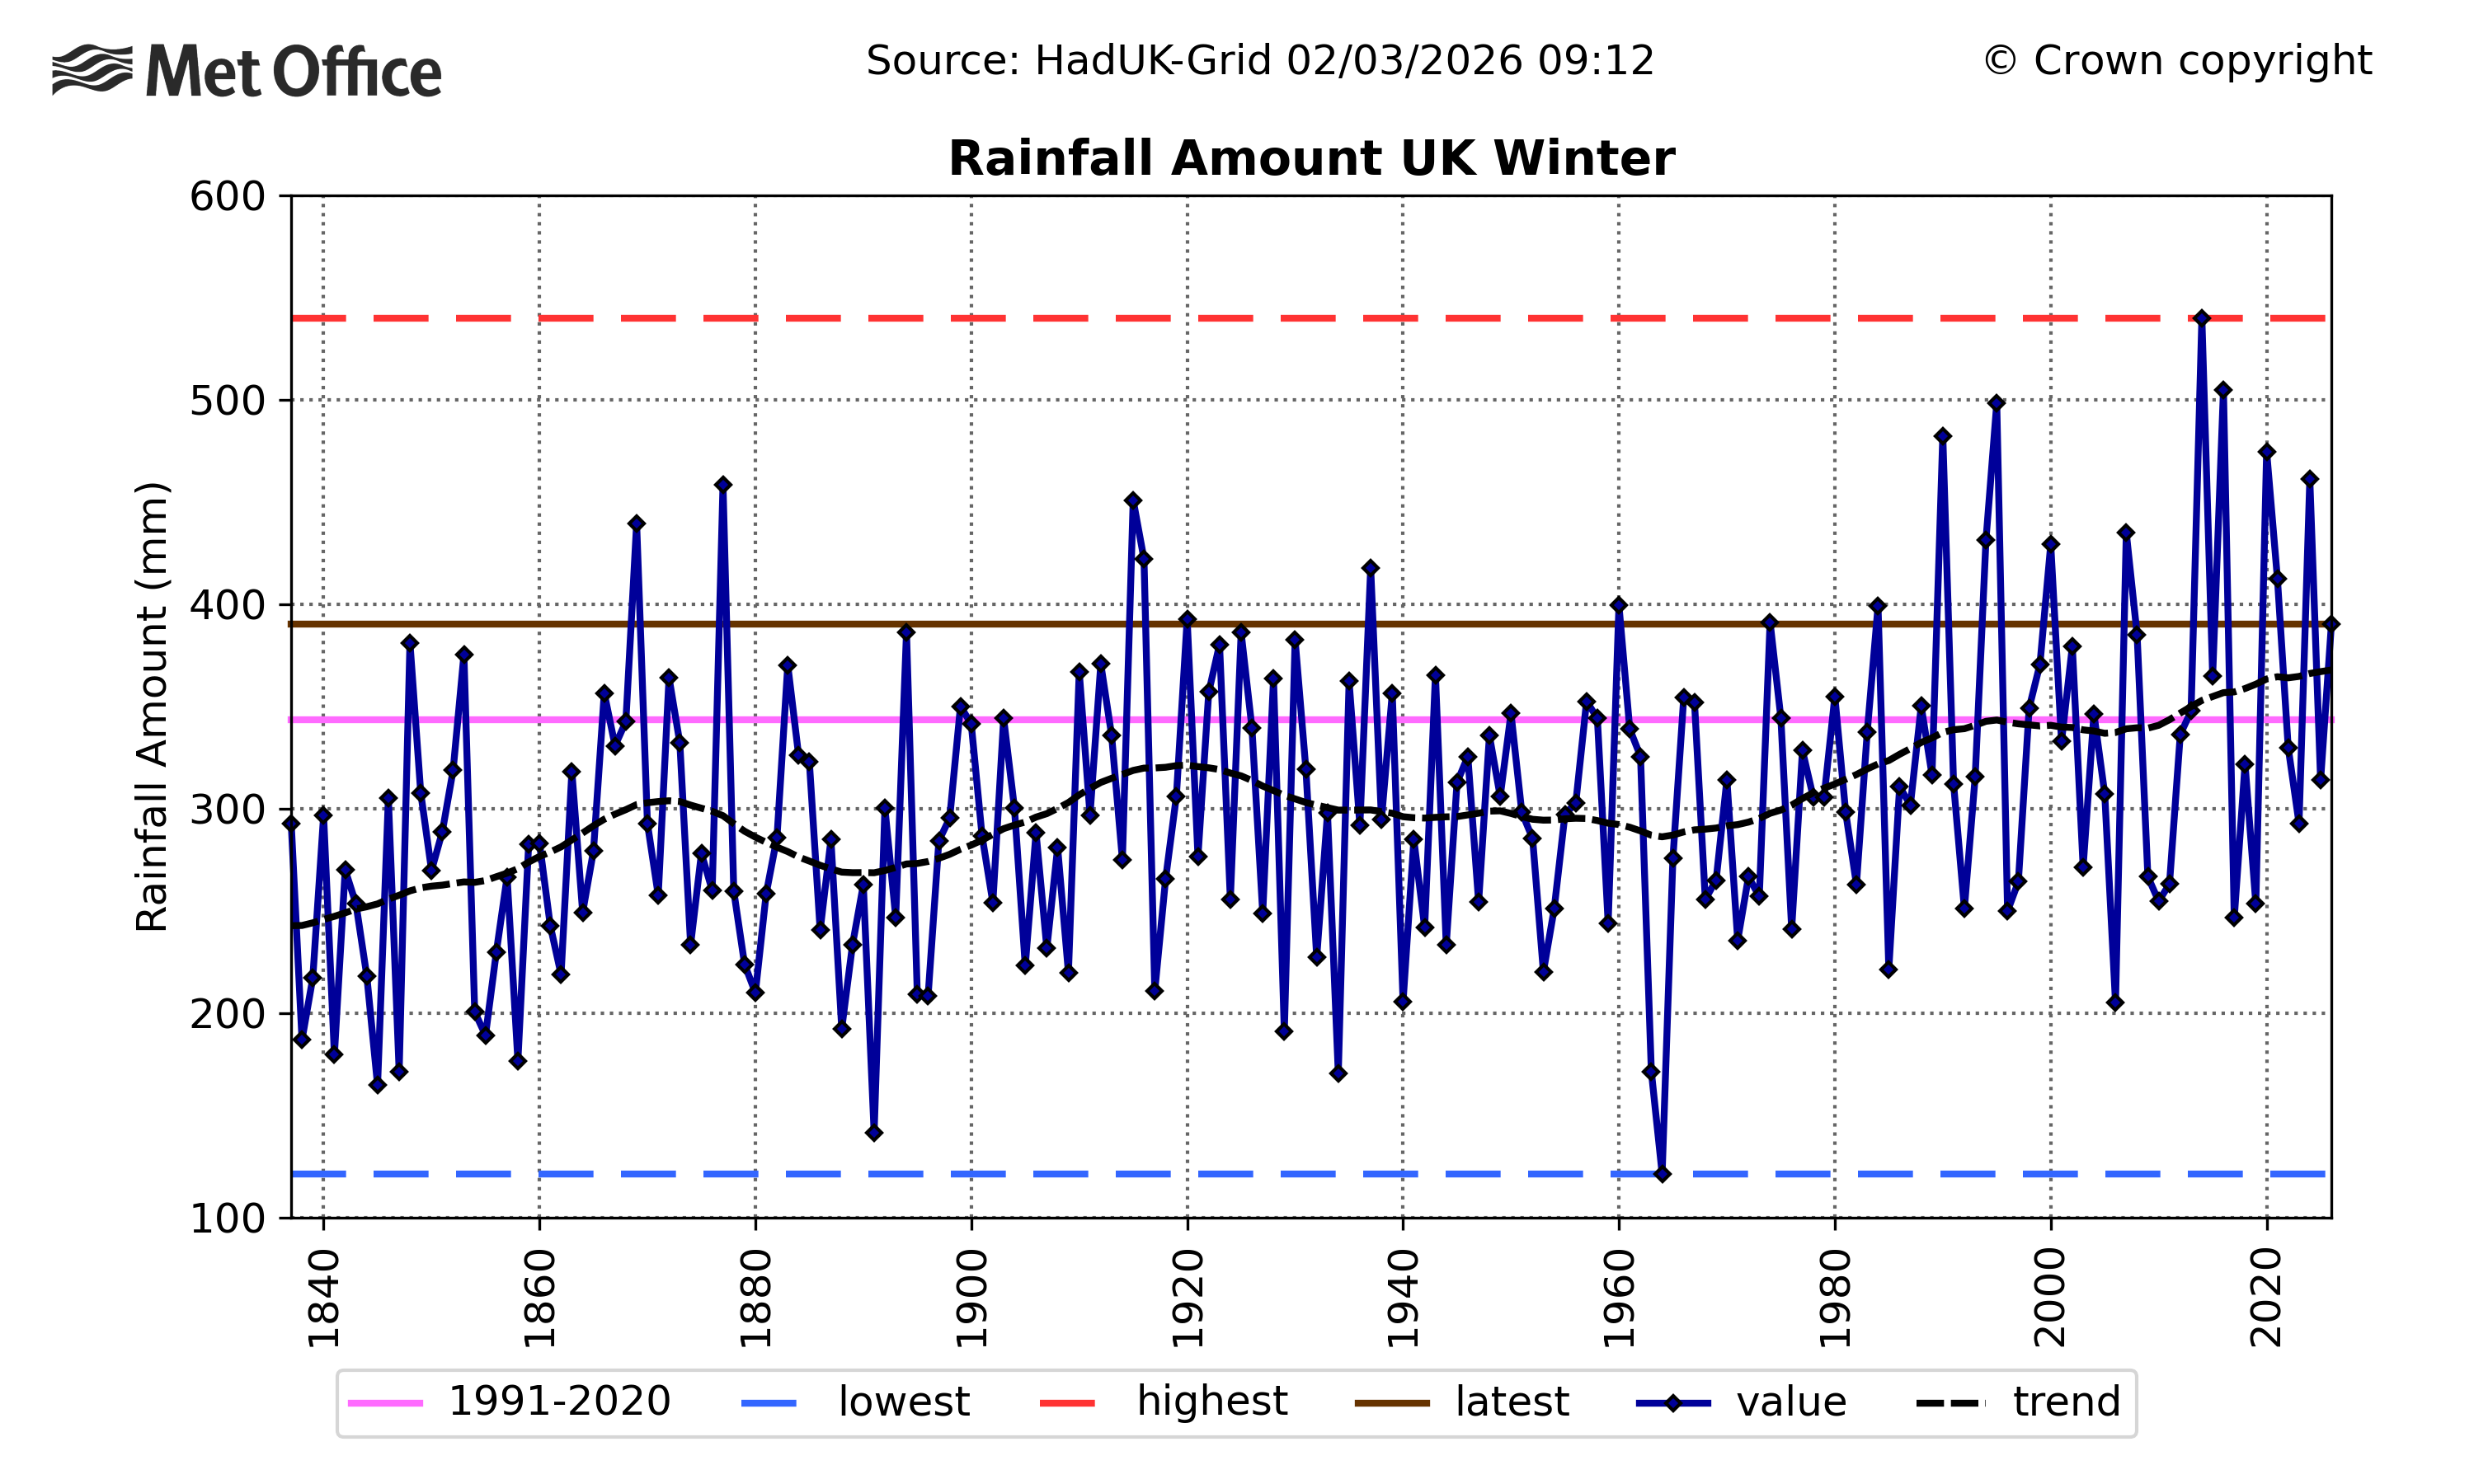
Winter rainfall among the wettest on record
This winter ranks among the wettest on record (since the series began in 1836) for some parts of the UK:
- England experienced its eighth wettest winter.
- Northern Ireland recorded its ninth wettest, and its wettest for ten years.
- Southern England saw its fourth wettest winter – its wettest in over a decade.
- The West Midlands, Cornwall and Leicestershire all experienced their wettest winter on record.
Several other counties - including Dorset and Warwickshire, which recorded their second wettest winter - fell within their top ten wettest winters since 1836, highlighting the widespread nature of the persistent rainfall.
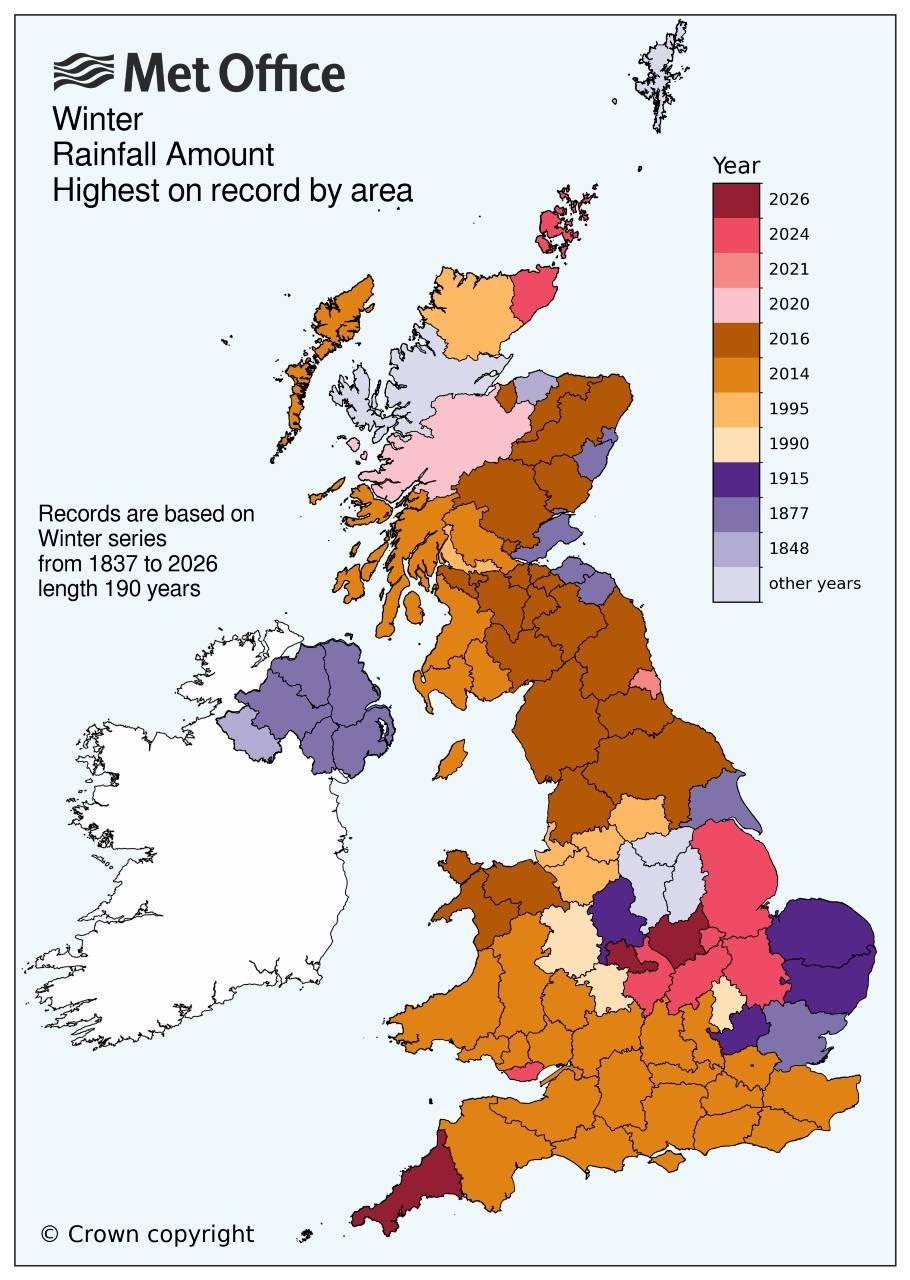
This map shows how Winter 25/26 ranks for rainfall from 1837-2026 by county.
![]()
This map shows winter rainfall records by county from 1837 and in which year they occurred.
This winter was wetter than average across the UK, with the nation recording 13% more rainfall than the long-term meteorological average (LTA) for the season. However, the headline figure hides substantial regional differences:
-
England: 42% above its winter LTA
-
Northern Ireland: 27% above its winter LTA
-
Wales: 20% above its winter LTA
-
Scotland: 14% below its winter LTA
The wet conditions were particularly pronounced across southern and central England, where saturated ground from early season rainfall left areas more sensitive to impacts from further wet weather.
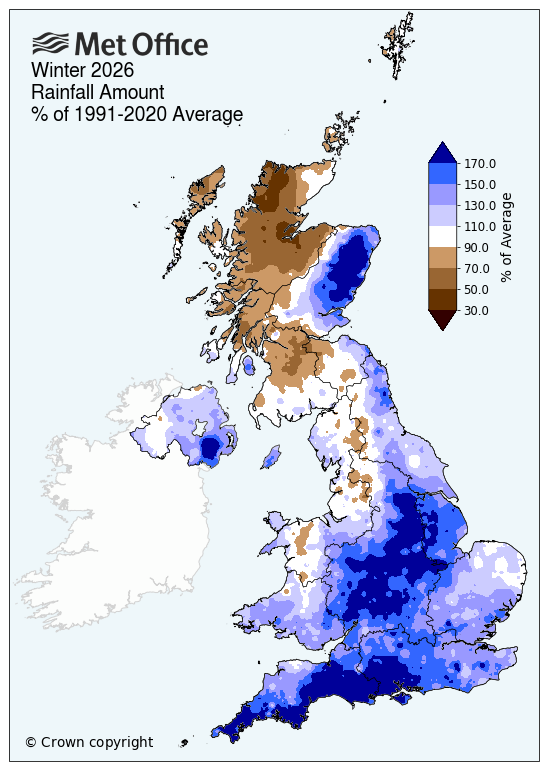
A north/south divide is evident across England, with rainfall totals 17% and 58% above the long-term average respectively.
In Scotland, the contrast is equally marked. Eastern areas experienced 21% above their seasonal average rainfall, whilst northern areas saw 31% below and western areas 14% below LTA.
READ: Why has it been so wet this winter?
The role of climate change
While this winter’s weather has been heavily influenced by natural variability and atmospheric patterns, climate change provides important context.
A warmer atmosphere can hold more moisture, approximately 7% more for every degree Celsius of warming. This means that when it does rain, downpours can be heavier and more intense. This characteristic is already being observed in the UK and globally, with rainfall totals on the wettest days increasing over recent decades.
Climate change is also associated with a trend towards wetter winters in the UK. Winters are expected to feature more days with significant rainfall, particularly in western regions.
Attribution studies across the UK and Europe have linked several record-breaking rainfall events to the influence of human-induced climate change. While no single weather event is caused solely by climate change, the background warming of the atmosphere is loading the dice, making extreme rainfall more likely and making wet winters increasingly common in the long term.
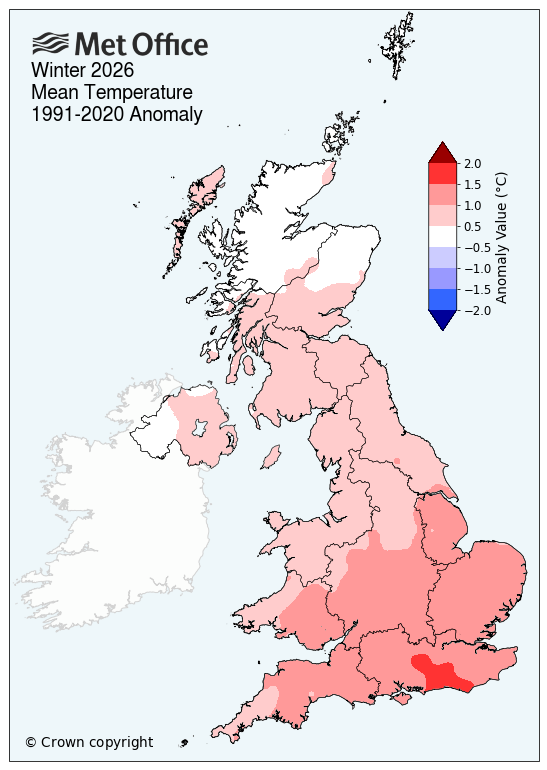
Southern England’s eighth warmest winter on record
Mean temperatures across the UK were above the seasonal long-term average, with England recording the highest national mean at 5.7°C. Southern England saw particularly high average temperatures – its eighth warmest since the series began in 1884 – with several counties also ranking in their top ten warmest winters on record.
Winter drew to a close with temperatures above 18°C on 25 February – a contrast to the much cooler temperatures experienced in January.
READ: Contextualising February’s warm spell: A notably mild end to winter
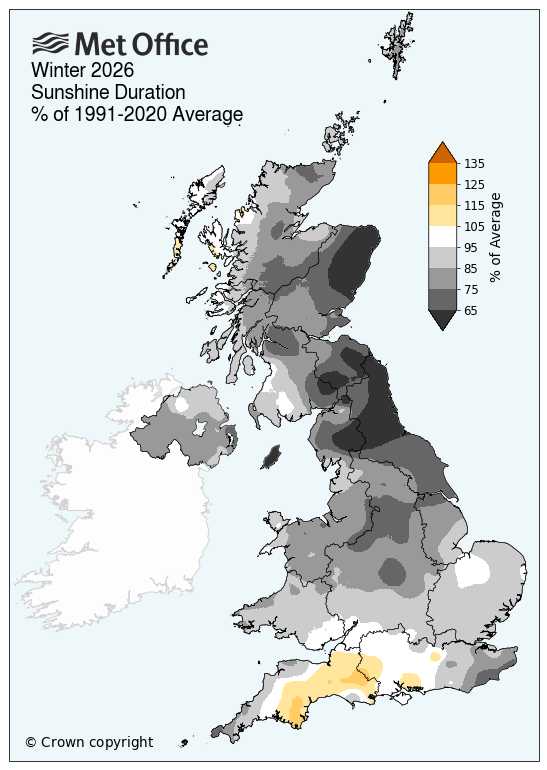
A notably dull season – especially for Scotland
Sunshine was in short supply this winter. The UK recorded just 84% of its average sunshine hours, with Scotland most affected, experiencing its tenth dullest winter since 1910.
|
Provisional Winter 25/26 stats |
Mean temp (°C) |
Rainfall (mm/%) |
Sunshine (hours/ %) |
|||
|
Actual |
91/20 anom |
Actual |
91/20 anom |
Actual |
91/20 anom |
|
|
UK |
4.94 | 0.85 | 390.1 | 113 | 135.3 | 84 |
|
England |
5.69 | 1.11 | 342.1 | 142 | 157.8 | 86 |
|
Wales |
5.52 | 0.94 | 540.9 | 120 | 137.4 | 87 |
|
Scotland |
3.49 | 0.47 | 424.9 |
86
|
99.7 | 78 |
|
Northern Ireland |
5.15 | 0.52 | 415.9 | 127 | 122.5 | 83 |
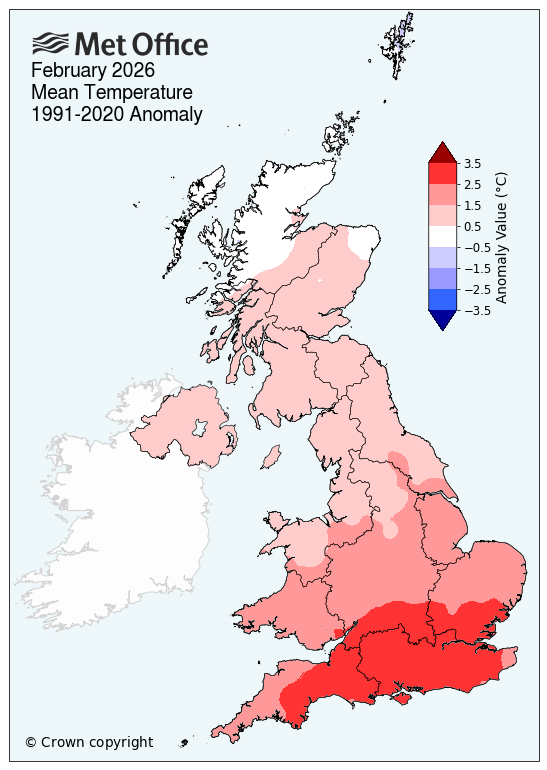
February 2026: ninth warmest and fourth dullest for the UK
The UK, and all four nations recorded above average mean temperatures during February. The month ranks among the warmest on record (since the series began in 1884) for mean temperature for some parts of the UK.
-
UK: Ninth warmest February on record
-
England: Fourth warmest
-
Wales: Sixth warmest
-
Southern England: Third warmest
Notably, 21 counties recorded their highest February minimum temperature on record, highlighting unusually mild nights.
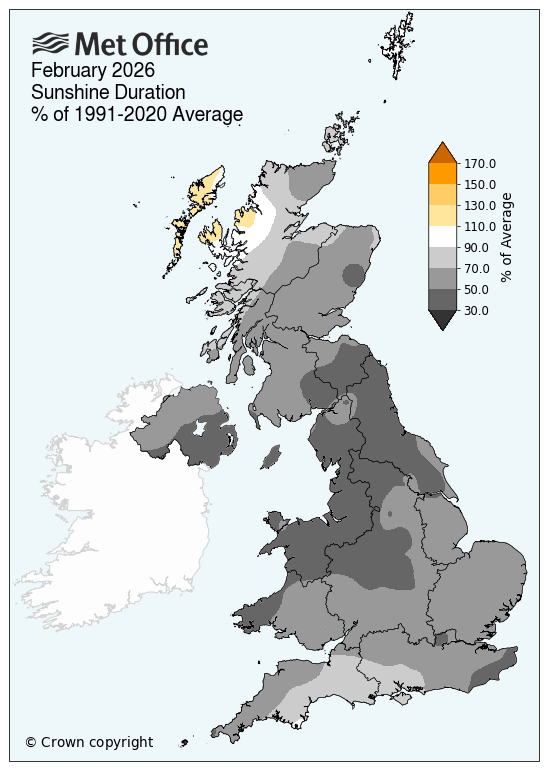
One of the dullest Februarys ever recorded
Sunshine was in short supply for many this February, with records dating back to 1910.
-
UK: Fourth dullest
-
Wales: Dullest February on record
-
Northern Ireland: Fifth dullest
-
Scotland: Seventh dullest
-
England: Seventh dullest
Every UK nation ranked within its top ten dullest Februarys on record, reflecting the dominance of cloud-bearing Atlantic systems and very limited high-pressure influence.
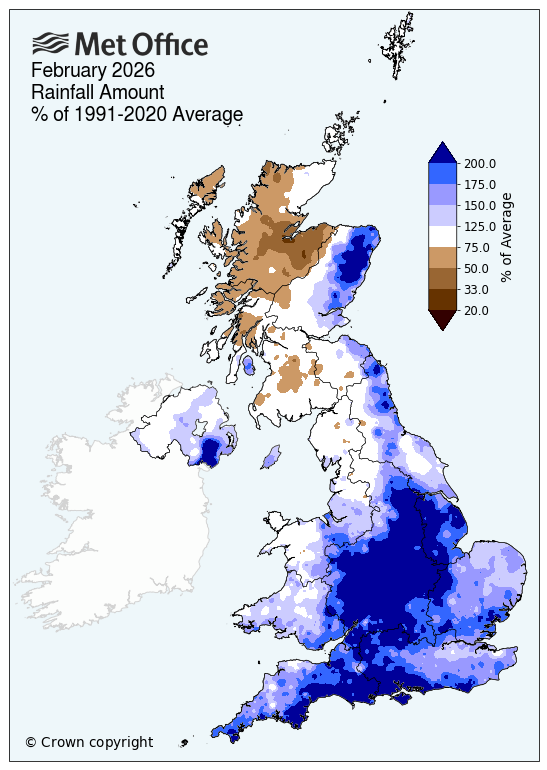
Above-average rainfall, with strong regional differences
February saw a continuation of the wet conditions that dominated January, with unsettled weather bringing persistent rain for the first three weeks.
For the UK, February was 23% wetter than average, and the picture varied regionally:
-
England: 70% above its February LTA
-
Northern Ireland: 30% above its February LTA
-
Wales: 35% above its February LTA
-
Scotland: 17% below its February LTA
Worcestershire experienced its wettest February ever recorded (since 1836) and several other counties ranked within their top ten wettest.
Met Office Science Manager Dr Amy Doherty said: “February’s mild and notably dull conditions have brought a winter of considerable contrasts to a close. While February itself stood out for its exceptionally low sunshine and above average temperatures, the broader winter picture shows just how varied conditions have been around the UK.
“Some southern and central areas of the UK experienced persistent rainfall, leading to saturated ground and several areas recording one of their wettest winters on record. In contrast, parts of northern and western Scotland were markedly drier, which is notable given these areas are typically among the wettest in the UK.
“This year, it was eastern Scotland that saw above average rainfall, highlighting an unusual reversal of the pattern normally expected, and demonstrating the strong regional differences that can develop within a season.
“Taken together, the winter and February figures highlight the influence of a predominantly Atlantic weather pattern and the pronounced variability that can characterise the UK climate.”
What about the weather as we start meteorological spring?
The beginning of March marks a contrast in weather type from the end of winter. Tony Wisson is a deputy chief forecaster with the Met Office. He said: “This week is the start of meteorological spring, and the forecast is set to reflect the seasonal shift. Over the next few days, the conditions are likely to become noticeably more settled, offering a welcome change from recent unsettled weather. We will see a band of rain cross the country on Thursday, and spells of rain or showers may continue to come and go across Northern Ireland and western Scotland over the coming days. We’re looking at a slightly warmer week, with highs of up to 19°C on Thursday.”
How do we know when records are broken?
The answer lies in a Met Office dataset that's been quietly mapping our weather history for around the last two centuries.
|
Provisional Feb 2026 stats |
Mean temp (°C) |
Rainfall (mm/%) |
Sunshine (hours/ %) |
|||
|
Actual |
91/20 anom |
Actual |
91/20 anom |
Actual |
91/20 anom |
|
|
UK |
5.6 | 1.5 | 118.6 | 123 | 41.6 | 58 |
|
England |
6.7 | 2.1 | 112.5 | 170 | 43.0 | 55 |
|
Wales |
6.2 | 1.8 | 162.6 | 135 | 35.1 | 51 |
|
Scotland |
3.7 | 0.6 | 116.5 | 83 | 42.5 | 67 |
|
Northern Ireland |
5.5 | 0.8 | 119.4 | 130 | 33.7 | 50 |