
Warmest spring on record for England and Wales – third warmest for UK
Spring 2026 was warm, dry and sunny for the UK.
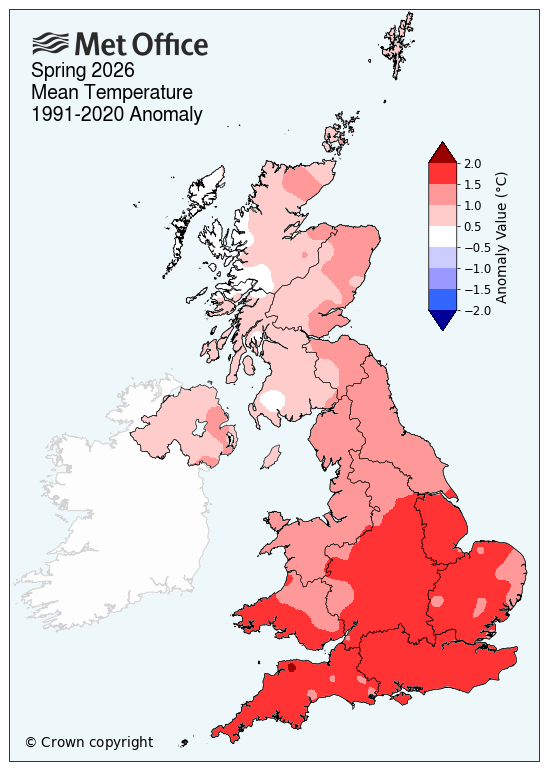
An exceptionally early and record-breaking spell of heat at the end of May helped to secure the warmest spring on record for England and Wales, and the third warmest for the UK, for mean temperature.
The late-May heatwave saw six consecutive days above 30°C in some areas, with both the spring and May maximum temperature station records exceeded by more than 2°C, highlighting an exceptional end to the season.
Provisional Met Office statistics show the season saw:
- UK’s third warmest on record for mean temperature
- England’s warmest on record for mean temperature
- Wales’s warmest on record for mean temperature
- Northern Ireland’s joint sixth warmest on record for mean temperature
- Scotland’s eighth warmest on record for mean temperature
All three months of meteorological spring - March, April and May - ranked within the UK’s top ten warmest since the series began in 1884. The season unfolded month by month, beginning with a joint tenth warmest March on record for the UK, followed by the seventh warmest April and then a May that finished up as the joint third warmest on record.
England’s mean temperature of 10.41°C surpassed last year’s record of 10.23°C, meaning the three warmest springs on record for England now stand as 2026, 2025 and 2024. Nine of the ten warmest springs in England since 1884 have now occurred since 2007.
The graph below shows spring's mean temperature in England since 1884.

Forty counties experienced their warmest spring for mean temperature since 1884.

Mean maximum temperatures were especially high, with the UK recording its third highest spring mean maximum temperature, while mean minimum overnight temperatures were also well-above average, making it the UK’s fifth highest spring mean minimum temperature on record.
Met Office Scientist Dr Emily Carlisle said: “This spring highlights both the natural variability of the UK’s weather and the longer-term warming we are observing. While conditions varied through the season, all three months of meteorological spring recorded mean temperatures within the UK’s top ten warmest on record.
“While we expect fluctuations from year to year, this spring shows some of the changes we're seeing in our weather patterns, with more extreme conditions becoming more frequent. The fact that nine of the ten warmest springs in England have occurred since 2007 illustrates this ongoing shift in the UK’s climate.”
Below-average rainfall, with marked regional contrasts
Spring rainfall was 14% below the long-term meteorological average for the UK, but the statistics mask strong regional differences.
England recorded 65% of its average spring rainfall, with a pronounced north-south split: Northern England saw 90% of average rainfall, compared to just 50% in Southern England.
Several counties in the southeast and east of England saw just over a third of their average seasonal rainfall, including Suffolk (33%), Kent (33%), Essex (34%) and Cambridgeshire (35%), City of London (36%).
Commenting on the very dry spring in some areas, Helen Wakeham, Environment Agency Director of Water and Chair of the National Drought Group, said: “No parts of England are currently in drought, but the risk increases the longer it remains hot and dry. The recent heatwave has seen significant peaks in demand for water, while river flows have fallen due to the very dry spring, and reservoir levels are reducing.
“We continue to closely track the situation and have convened a National Drought Group meeting in the coming weeks, so we are prepared if the dry conditions remain. We must continue to adapt to our changing climate and all be wise with our water use.”
Helen Plant from The Agriculture and Horticulture Development Board (AHDB) said: “The notably warm spring and stark variation in rainfall are increasingly being reflected in crops potential. As highlighted in AHDB’s latest crop development report, the drier conditions in April and into May have already led to a decline in winter cereal condition scores, with the proportion of crops rated good or excellent falling. In the driest parts of England, such as the East and South East, limited rainfall has reduced soil moisture reserves and many spring crops have struggled to get going.
The return of wetter weather at the third week of May helped those crops that got it. However, soil moisture remained low in many fields and last week’s heatwave also increased the stress for crops, with visible leaf rolling in wheat crops.
There is a risk to yield potential if rainfall does not improve in the weeks ahead. Farm profitability is already under pressure after the past couple of years of extreme weather and low prices, alongside rising costs.”
Scotland was the only UK nation to finish spring wetter than average, with the Western Isles recording their seventh wettest spring on record and Ross and Cromarty its tenth.

The seasonal pattern marks a notable contrast with winter, with rainfall anomalies showing a near reversal of the pattern seen during Winter 2025/26.

Widespread sunshine across the UK
Sunshine totals were also above average for the UK and all four nations, adding to the predominantly warm and settled nature of the season.
The UK recorded its fourth sunniest spring since records began in 1910, while England saw its third, Wales its joint eighth and Scotland their ninth.
Although this spring was notable for its warmth and sunshine, spring 2025 remains the warmest and sunniest spring on record for the UK.

Provisional Spring 2026 statistics
|
Provisional Spring 26 stats |
Mean temp (°C) |
Rainfall (mm/%) |
Sunshine (hours/ %) |
|||
|
|
Actual |
91/20 anomaly |
Actual |
91/20 anomaly |
Actual |
91/20 anomaly |
|
UK |
9.33 |
1.25 |
196.6 |
86 |
548.4 |
120 |
|
England |
10.41 |
1.54 |
112.0 |
65 |
605.2 |
126 |
|
Wales |
9.73 |
1.43 |
220.5 |
79 |
539.6 |
118 |
|
Scotland |
7.46 |
0.80 |
327.0 |
107 |
469.8 |
112 |
|
Northern Ireland |
9.06 |
0.92 |
221.4 |
94 |
468.2 |
108 |
May – a month of contrasting conditions
May began unsettled, cloudy and cool, with temperatures running around 1.4°C below average by mid-month. Frequent outbreaks of rain, some hail and even frost were recorded in places. Conditions then changed rapidly, as high pressure became dominant and temperatures rose quickly into a significant late-May heatwave.
This period of heat culminated in exceptional and record-breaking temperatures. On 25 May, the UK’s spring and May temperature record was provisionally broken when 34.8°C was recorded at Kew Gardens, exceeding the previous record of 32.8°C. That record was broken again on 26 May, when 35.1°C was recorded at Kew Gardens, with Heathrow also reaching 35.0°C.
The graph below shows the fluctuation in mean temperature during the month.

Provisional figures show May 2026 finished as the joint third warmest May in the UK for mean temperature, with England recording its second warmest May, Wales its joint third and Northern Ireland its joint tenth warmest. Scotland did not see mean temperatures within the top ten on record.

Southern England recorded its warmest May on record for mean temperature, and 27 counties saw their warmest May season since 1884.
Average maximum daily temperatures were also especially high due to the late-May heat, with England recording its highest May mean maximum temperature on record, and 29 counties recording their highest mean maximum temperature. Overnight temperatures were also well-above average, making it the UK’s joint sixth highest May average minimum temperature on record.
Met Office Scientist Dr Emily Carlisle said: “May was a month of two distinct phases. After a relatively cool and unsettled start, conditions changed quickly, with high pressure allowing temperatures to rise sharply into an exceptional late-month heatwave.
“This led to temperatures reaching levels not previously recorded during May, with long-standing May records broken in several locations.
“While individual weather events are influenced by natural variability, our climate attribution studies show that the likelihood of exceeding UK May temperature records has increased significantly as the climate warms, meaning such extremes are now becoming more likely.”
May heat and climate change
A climate attribution study published last summer by Met Office scientists found that the chances of surpassing the May temperature record have been increasing as our climate changes as a consequence of human greenhouse gas emissions.
The study found that breaking the 32.8°C May record is around three times more likely now in our current climate than it would have been in a natural climate not impacted by greenhouse gas emissions. What was around a 1-in-100 year event is now around a 1-in-33 year event.
You can read the full research in the Royal Meteorological Society’s Journal ‘Weather’.
In addition to daily station temperatures, the influence of climate change can also be observed in mean temperatures for the UK as a whole over the month of May. According to the HadUK-Grid dataset, with data back to 1884, the mean UK temperature for May has been tending to increase over recent decades, albeit with year-to-year variability.

UK Mean temperature for May from 1884 to 2026. The brown line shows the 2026 value and the red dashed line shows 2024, which is currently the highest on record.
Below-average rainfall across all UK nations
Rainfall was below average in all four nations in May, although no top ten records have been surpassed. A clear regional contrast can be seen when looking at England, with the south seeing just 59% of average, compared to 99% in the north.

Near-average sunshine overall
The UK recorded just above average sunshine during the month, with England the sunniest of the nations and both Scotland and Northern Ireland seeing below average sunshine compared to the long-term meteorological average.

Provisional May 2026 statistics
|
Provisional May 26 stats |
Mean temp (°C) |
Rainfall (mm/%) |
Sunshine (hours/ %) |
|||
|
|
Actual |
91/20 anomaly |
Actual |
91/20 anomaly |
Actual |
91/20 anomaly |
|
UK |
12.0 |
1.3 |
55.1 |
78 |
200.9 |
105 |
|
England |
13.4 |
1.8 |
42.3 |
74 |
229.3 |
115 |
|
Wales |
12.4 |
1.5 |
69.9 |
80 |
201.0 |
105 |
|
Scotland |
9.6 |
0.5 |
69.6 |
78 |
157.7 |
87 |
|
Northern Ireland |
11.7 |
1.2 |
71.5 |
97 |
174.9 |
95 |
Where does the monthly data come from?
The Met Office’s monthly climate statistics use HadUK‑Grid data to work out county, regional and UK‑wide averages. The dataset takes weather observations from across the country and interpolates them across the UK onto a 1km x 1km grid, covering every part of the UK. Some of these records stretch all the way back to 1836, meaning almost 200 years of weather data.
READ MORE: How do we know when weather records are broken?
READ MORE: What is HadUK-Grid?