

North Atlantic tropical storm seasonal forecast 2023
Tropical storm seasonal forecast for the June to November period issued in May 2023
This forecast was issued on 26 May 2023. An updated seasonal forecast has since been issued in early August. Please see the link below for details.
Forecast for June to November 2023
Issued 26 May 2023
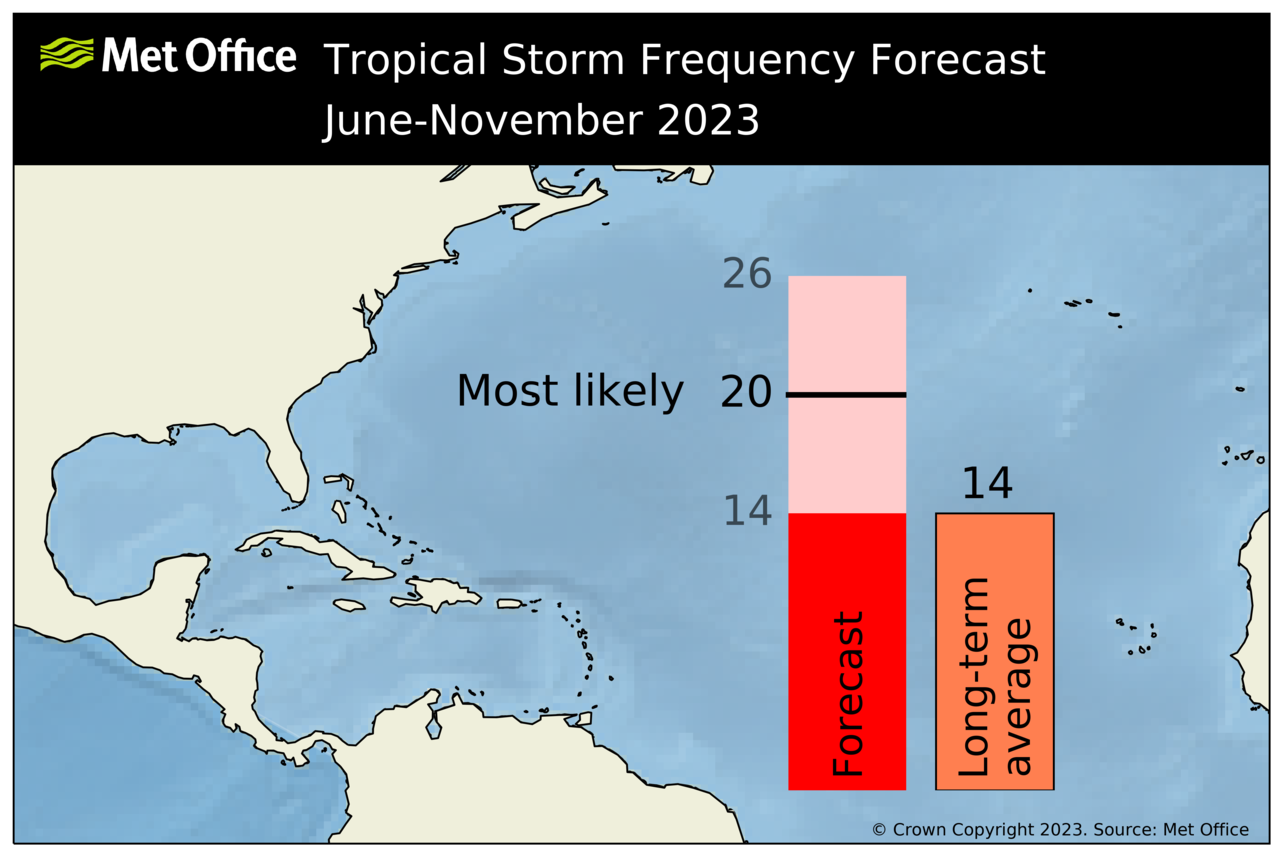
The most likely number of named tropical storms (winds of at least 39 mph) predicted to occur in the North Atlantic during the June to November period is 20, with a 70% chance that the number will be in the range 14 to 26. The 1991-2020 long-term average is 14.
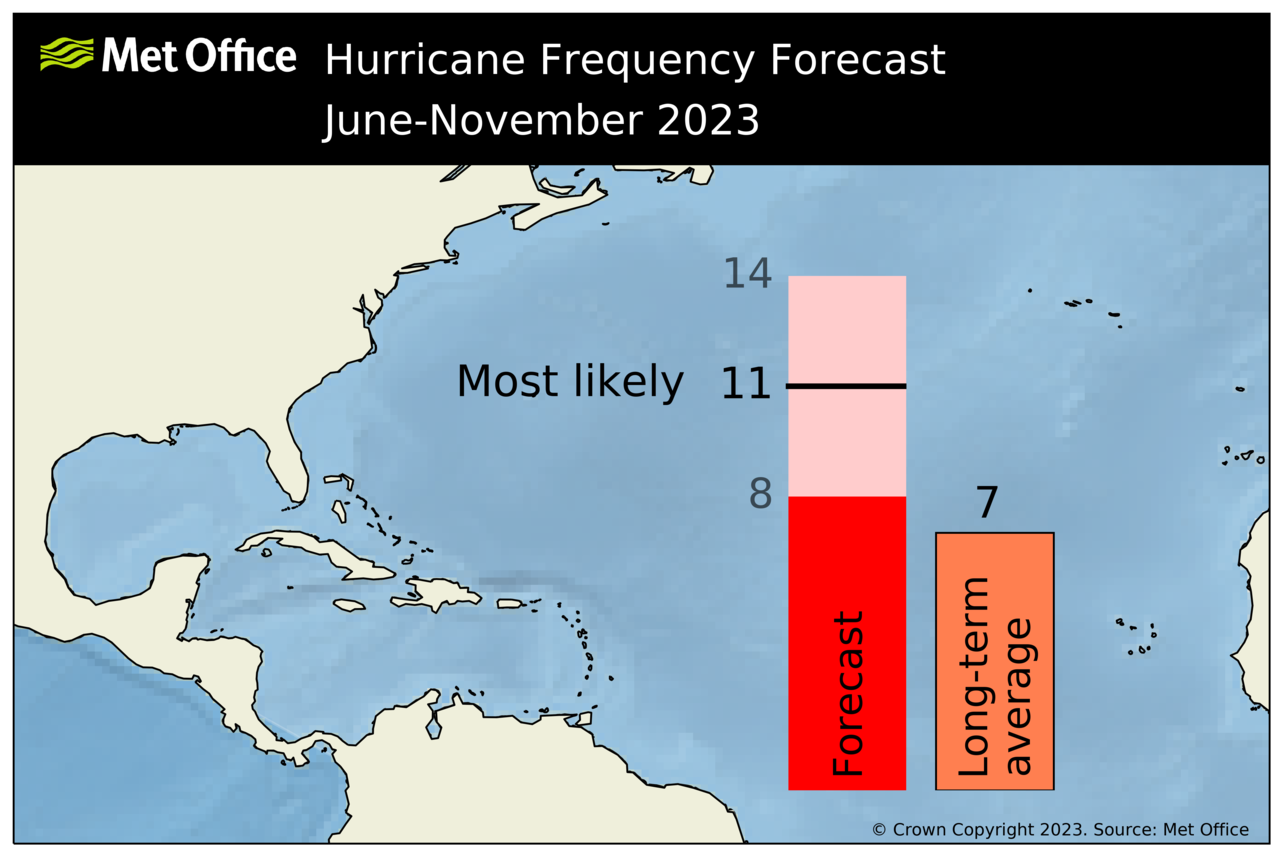
The most likely number of hurricanes (winds of at least 74 mph) predicted to occur in the North Atlantic during the June to November period is 11, with a 70% chance that the number will be in the range 8 to 14. The 1991-2020 long-term average is 7.
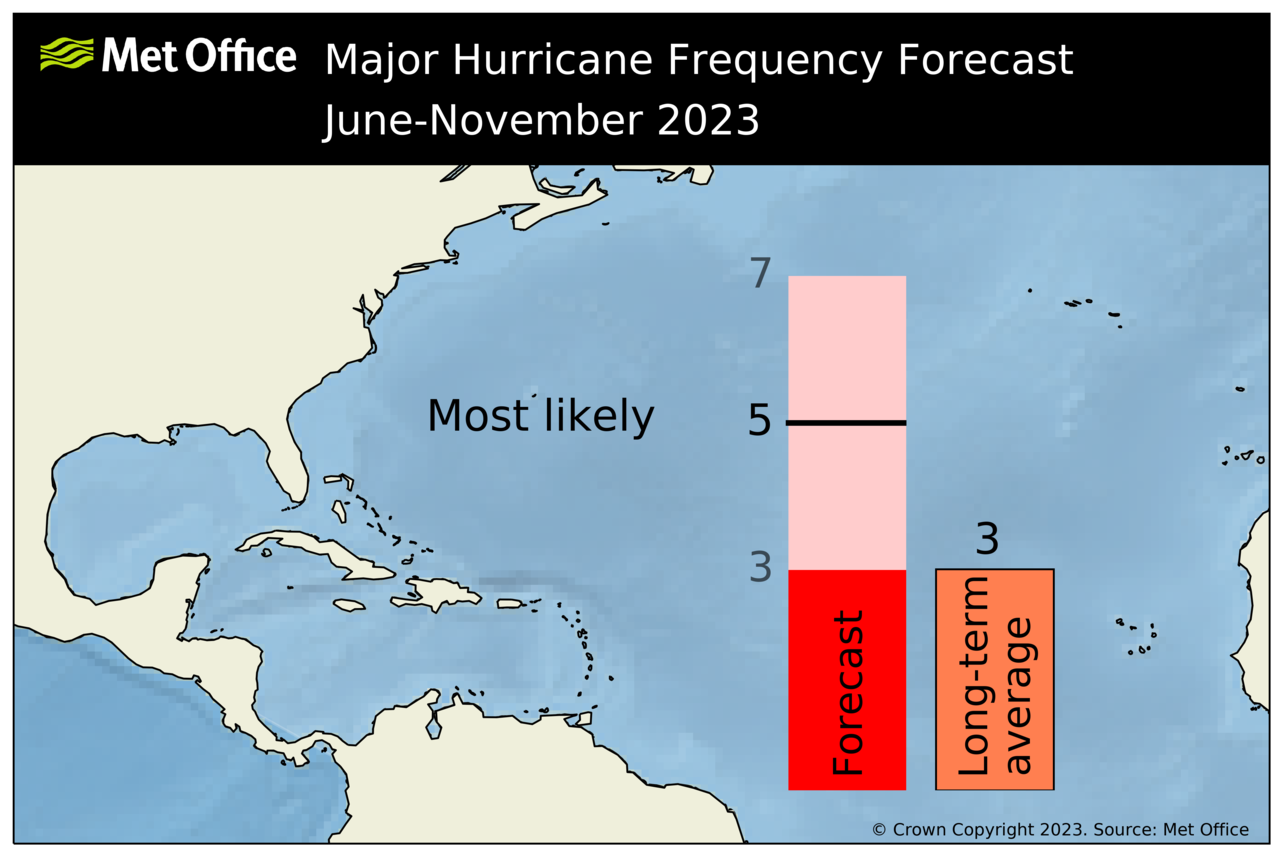
The most likely number of major hurricanes (winds of at least 111 mph) predicted to occur in the North Atlantic during the June to November period is 5, with a 70% chance that the number will be in the range 3 to 7. The 1991-2020 long-term average is 3.
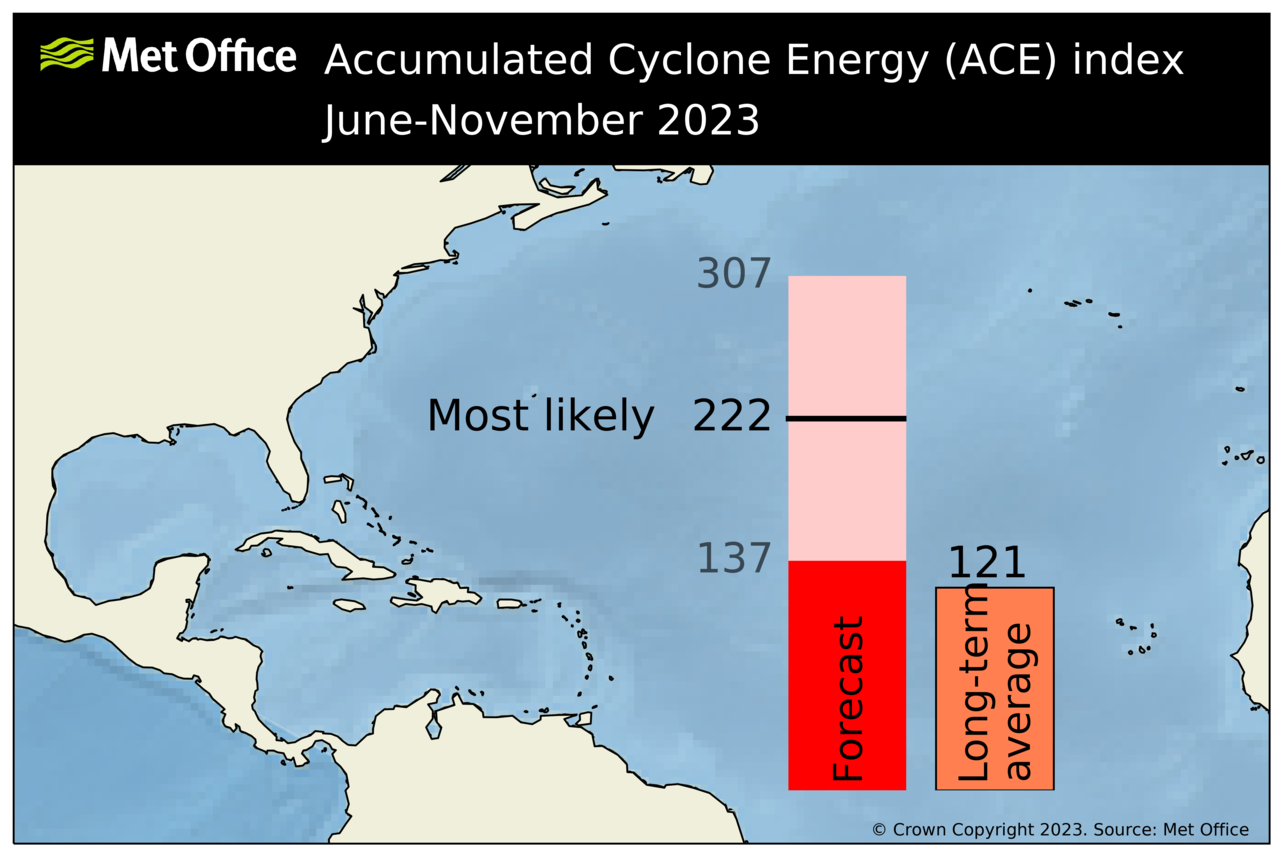
An ACE index of 222 is predicted as the most likely value, with a 70% chance that the index will be in the range 137 to 307. The 1991-2020 average is 121.
Note: The unnamed subtropical storm which occurred in January 2023 fell outside the period covered by this prediction (June-November).
Background
'Tropical cyclone' is the generic term for a low-pressure system over tropical or subtropical waters, with intense convective activity (e.g. thunderstorms) and winds circulating in an anticlockwise direction in the northern hemisphere (clockwise in the southern hemisphere). A tropical storm is a tropical cyclone with mean wind speeds of at least 39 mph. The terms hurricane and typhoon are region-specific names for strong tropical cyclones with wind speeds of at least 74 mph. For further details about tropical cyclones see Met Office tropical cyclone facts.
The North Atlantic tropical storm season usually runs from June to November. The degree of activity over the whole season varies from year to year and is measured in several ways.
-
Total number of tropical storms. The number of named tropical cyclones with winds of at least 39 mph observed over the season. This is the best known measure of the level of storm activity. In this forecast the number of tropical storms also includes those that reach hurricane and major hurricane strength (see below).
-
Total number of hurricanes. The number of tropical cyclones that reach sustained winds of at least 74 mph.
-
Total number of major hurricanes. The number of tropical cyclones that reach sustained winds of at least 111 mph.
-
The Accumulated Cyclone Energy (ACE) index. A measure of the collective intensity and duration of all named tropical storms, hurricanes and major hurricanes during the season.
The table below shows the number of tropical storms, hurricanes, major hurricanes and ACE index observed in recent years.
| Year | Tropical storms | Hurricanes | Major hurricanes | ACE index |
|---|---|---|---|---|
| 2013 | 13 | 2 | 0 | 31 |
| 2014 | 8 | 6 | 2 | 65 |
| 2015 | 10 | 4 | 2 | 58 |
| 2016 | 14 | 6 | 4 | 131 |
| 2017 | 16 | 10 | 6 | 225 |
| 2018 | 14 | 8 | 2 | 127 |
| 2019 | 17 | 6 | 3 | 129 |
| 2020 | 28 | 13 | 7 | 179 |
| 2021 | 20 | 7 | 4 | 144 |
| 2022 | 14 | 8 | 2 | 95 |
Historical Forecasts
At the start of each North Atlantic season the Met Office forecasts the number of tropical storms, hurricanes, major hurricanes and ACE index. Seasonal forecasts of tropical storm activity have been issued annually since 2007. See our previous seasonal tropical storm forecasts issued in either May or June for 2007, 2008, 2009, 2010 , 2011, 2012, 2013, 2014, 2015, 2016, 2017, 2018, 2019, 2020, 2021 and 2022.
Method
The forecast is made using information from the Met Office seasonal prediction system, GloSea6, which is an ensemble prediction system based on a fully coupled ocean-atmosphere general circulation model (GCM). This system simulates the ocean-atmosphere processes and interactions that determine tropical storm development. Multiple forecasts are made (using ensemble forecasting methods) to allow estimation of the range of likely outcomes. The ensemble is then used to produce a best estimate (or most likely) predicted value (the ensemble mean) and forecast range (using the spread in the ensemble outcomes). Further details on the forecast method can be found in Camp et al. (2015).
Skill
Recent studies have shown that dynamical models have considerable skill predicting the number of tropical storms - for example successfully predicting the change from the exceptionally active season of 2005 to the below-normal activity of the 2006 season. In 2017, the Met Office seasonal forecast system successfully predicted the above-average activity that was observed in the North Atlantic, including the high frequency of tropical cyclone tracks around the northeast Caribbean (Camp et al., 2018). Full details of the skill to predict tropical storm activity around the world has previously been documented by Camp et al. (2015) and for real-time forecasts in Klotzbach et al. (2019).
Factors Influencing the Current Seasonal Forecast
There is a strong signal in our forecasts for El Niño to develop and persist through the peak of the Atlantic hurricane season (August to October 2023). This would normally be expected to increase vertical wind shear across the tropical North Atlantic, suppressing tropical storm activity. However, as shown above, the 2023 forecast predicts most likely high tropical storm activity in the Atlantic. There are several factors which are likely counteracting the influence of El Niño resulting in this forecast of high activity, including:
- Vertical wind shear through the troposphere over the tropical Atlantic is predicted to be lower than previously seen during El Niño events.
- Sea surface temperatures are predicted to remain well above average across the tropical North Atlantic during the whole hurricane season.
Current El Niño forecasts suggest that the transition from neutral to El Niño conditions is likely to take place over the next few months. However, the speed of transition, its intensity and the time it takes to influence Atlantic hurricane activity will all have a direct bearing on the season ahead with the upper end of the Met Office forecast providing a reasonable worst-case scenario.
Stakeholders are advised to follow the advice and analysis of the official World Meteorological Organisation Regional Specialised Meteorological Centre for the Atlantic region, the US National Hurricane Center (NHC), during upcoming hurricane season. NHC provides forecasts for all active tropical cyclones and the likelihood of storm formation up to seven days ahead in the Atlantic based on a consensus from all major forecast centres.
Verification
The table below shows the seasonal forecast values issued on 26 May 2023 for the June-November 2023 period together with the end of season observed values. This season the observed number of tropical storms, major hurricanes and ACE Index were all within the 70% forecast range, whilst the observed number of hurricanes was just outside the 70% forecast range.
| Most likely number | 70% forecast range | Observed number | |
|---|---|---|---|
| Tropical storms | 20 | 14-26 | 19 * |
| Hurricanes | 11 | 8-14 | 7 |
| Major hurricanes | 5 | 3-7 | 3 |
| ACE Index | 222 | 137-307 | 144 * |
* The unnamed storm which formed in January 2023 was not included since it occurred outside the June-November forecast period.
A public forecast for the June to November 2024 period in the Atlantic will be issued in May 2024.
References
Camp, J., Roberts, M., MacLachlan, C., Wallace, E., Hermanson, L., Brookshaw, A., Arribas, A., Scaife, A. A., (2015). Seasonal Forecasting of Tropical Storms Using the Met Office GloSea5 Seasonal Forecast System. Q.J.R. Meteorol. Soc, 141: 2206-2219.
Camp, J., Scaife, A. A., Heming, J. (2018). Predictability of the 2017 North Atlantic hurricane season. Atmos Sci Lett. 2018; 19:e813.
Klotzbach, P. et al. (2019). Seasonal Tropical Cyclone Forecasting. Tropical Cyclone Research and Review, 8 (3), 134-149.
To view PDF documents you will need to download Adobe Reader