

Briefing on the Arctic sea ice minimum and Antarctic sea ice maximum – September 2023
Alex West and Ed Blockley
Summary
- Arctic sea ice has likely reached its seasonal minimum. At 4.23 million sq km, this is the 6th lowest in the satellite record (since 1979).
- Extent at minimum was very low on the Pacific side of the Arctic but nearer average on the Atlantic side.
- Antarctic sea ice extent remains exceptionally low, and may have reached its seasonal maximum unusually early, on 12th September. At 16.96 million sq km, this would be the lowest maximum Antarctic ice extent on record (since 1979) by a very wide margin.
Arctic sea ice minimum
On 19th September Arctic sea ice reached its minimum for the year, at 4.23 million sq km (Figure 1). This is the 6th lowest minimum in the satellite record since 1979, after 2012 (the lowest at 3.39 million sq km), 2020, 2007, 2016 and 2019. It is 1.99 million sq km below the 1981-2010 average minimum sea ice extent, but quite close to the long-term linear trend (Figure 2).
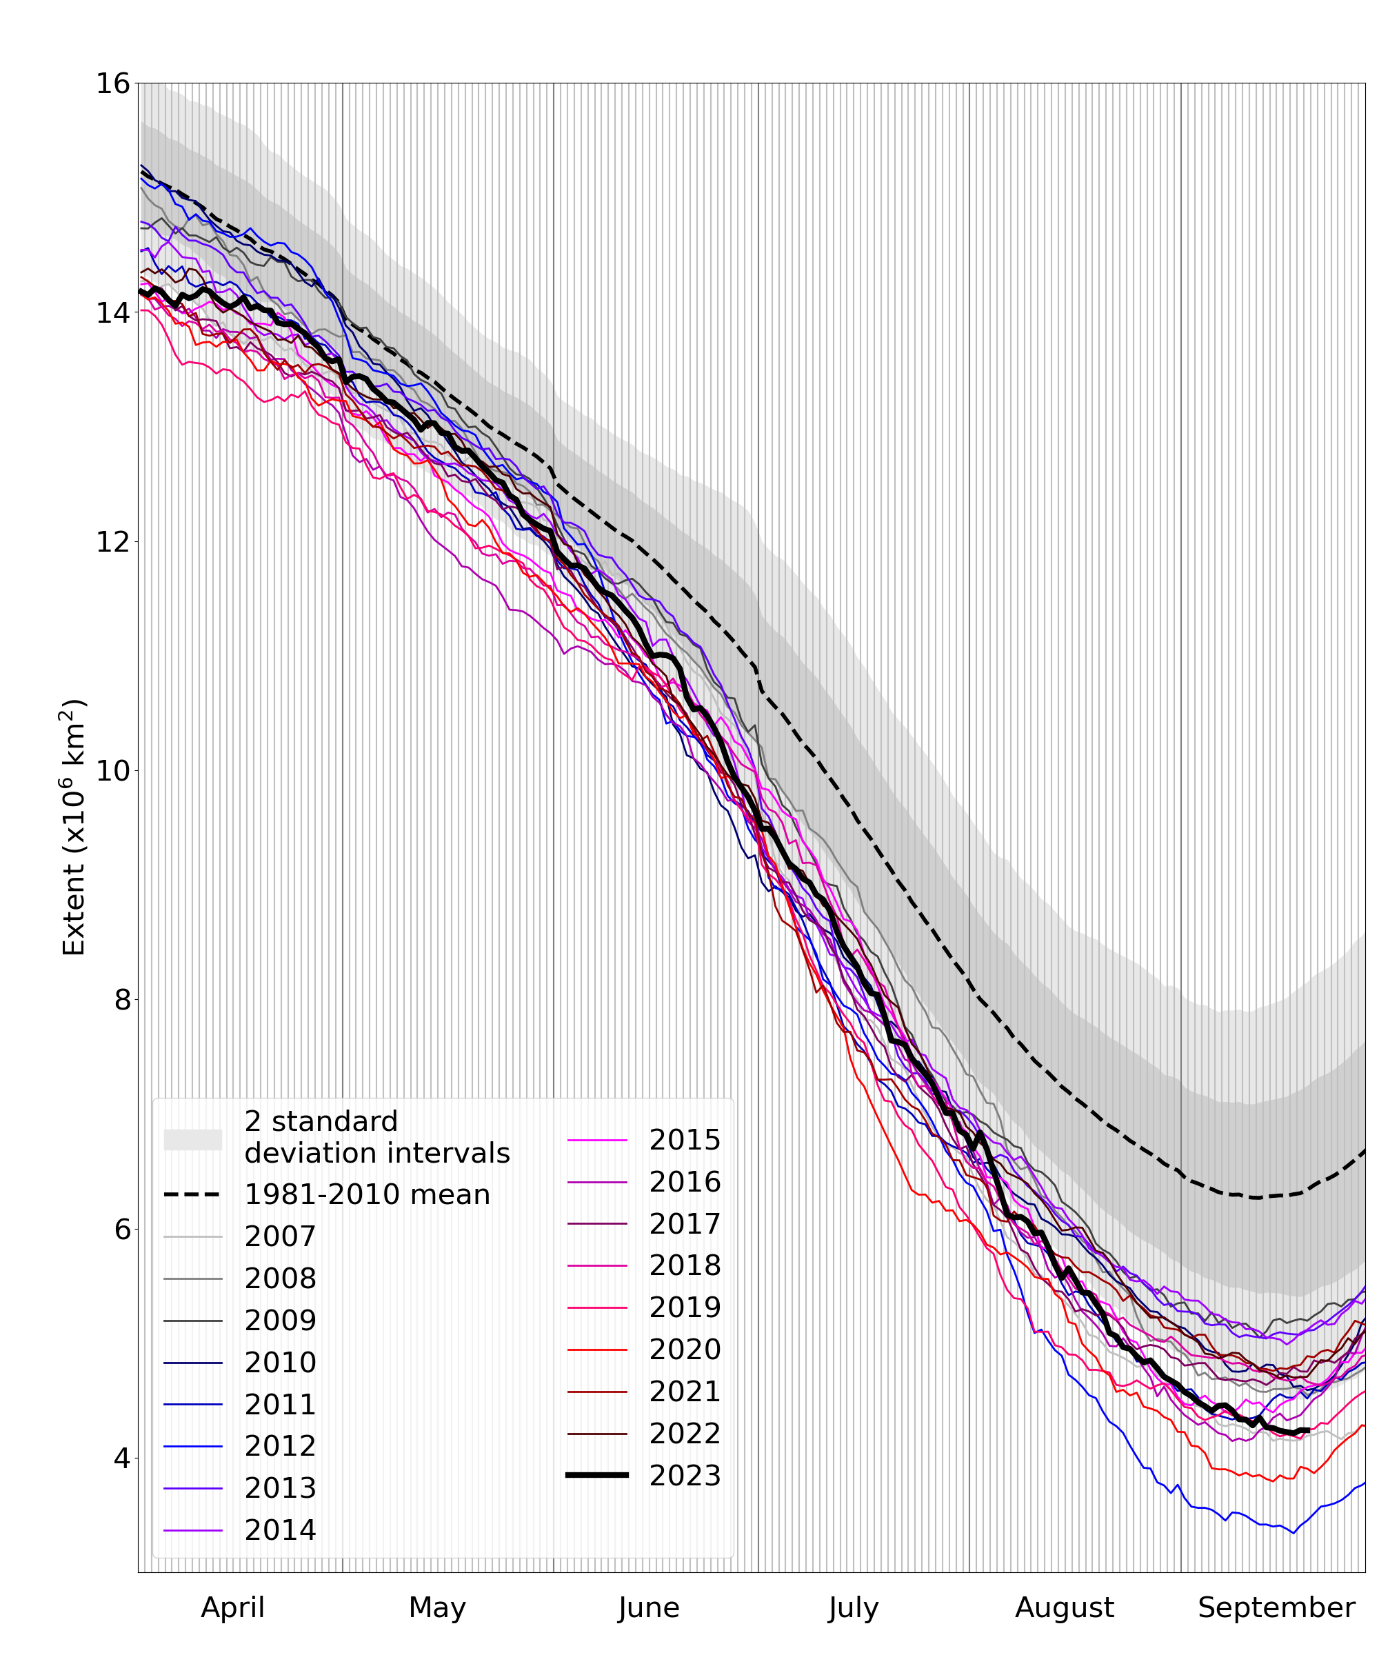
Figure 1. Daily Arctic sea ice extent for 2023, compared with recent years and the 1981-2010 average, with +/- 1 and 2 standard deviation intervals indicated by the shaded areas. Data are from the National Snow and Ice Data Center (NSIDC).
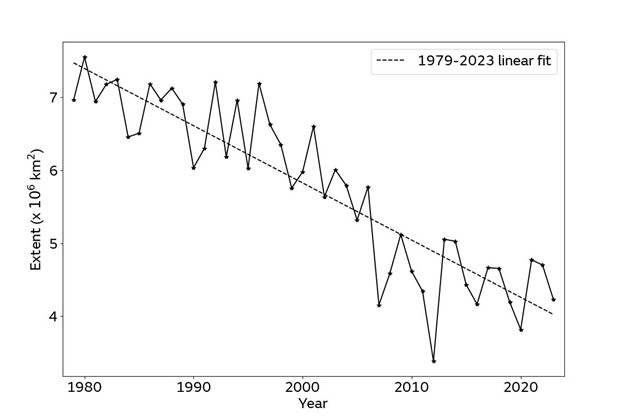
Figure 2. Arctic sea ice minima from 1979 to 2023 according to the NSIDC Sea Ice Index (Fetterer et al., 2017). The minimum sea ice extent is taken to be the lowest 5-day average.
Regional conditions
Extent was exceptionally below average in the Beaufort, Chukchi and East Siberian Seas on the Pacific side of the Arctic: throughout most of this region, the ice edge at minimum extent was more than 7 degrees of latitude further north than the 1981-2010 average (about 500 miles, or 800 km). Extent was much nearer average on the Atlantic side of the Arctic, in the Laptev, Kara and Barents Seas and in the Fram Strait (Figure 3).
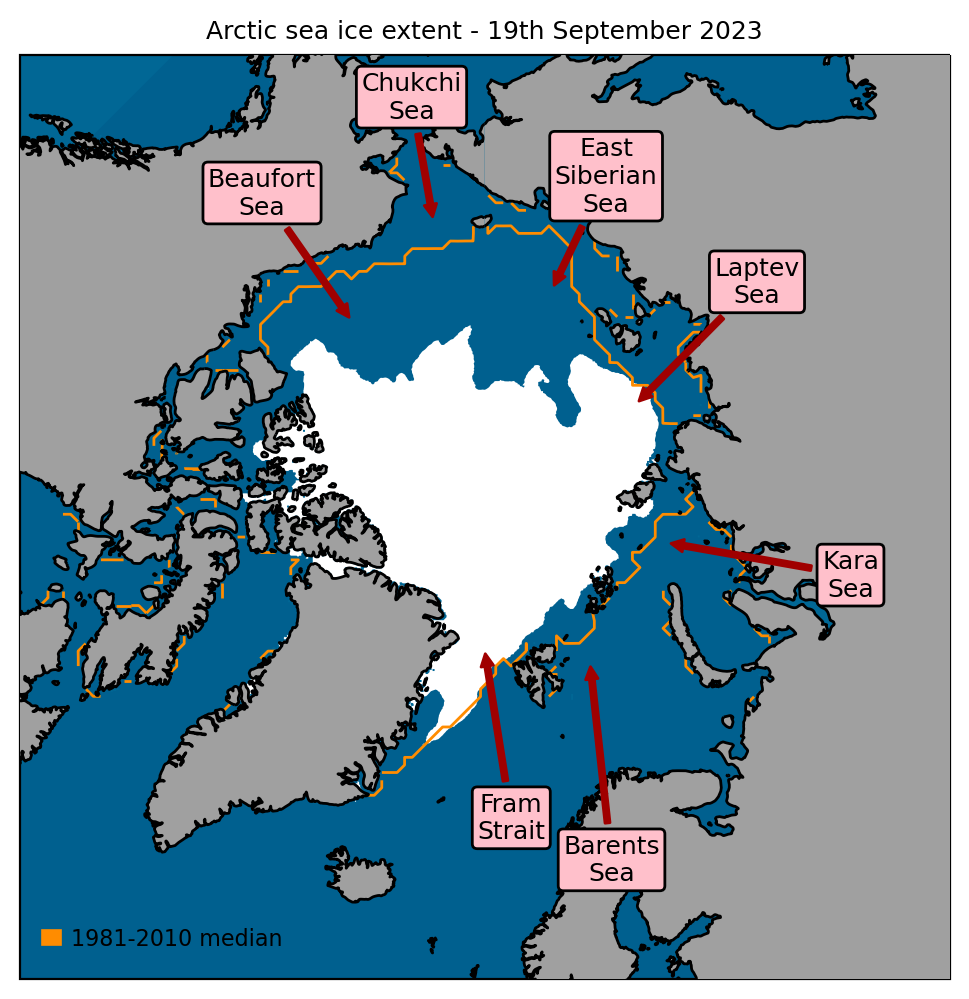
Figure 3. Minimum sea ice extent (19th September 2023), with 1981-2010 average extent for this date indicated in orange. Data are from EUMETSAT OSI-SAF (Tonboe et al., 2017).
Antarctic sea ice maximum
On 10th September, Antarctic sea ice likely recorded its seasonal maximum extent, of 16.96 million sq km. This represents the lowest maximum of the satellite era by a very wide margin, the next lowest having been 17.88 million sq km in 1986. It was also unusually early, being two weeks earlier than the long-term median date of 24th September: in the satellite record since 1979, only five years have recorded an earlier maximum.
Antarctic sea ice has been at exceptionally low levels since June 2023, but sea ice growth speeded up somewhat relative to average towards the end of August (Figure 4). On 24th August, the Antarctic sea ice extent anomaly fell below 2 million sq km for the first time since 6th June, becoming as small as 1.39 million sq km on 7th September. However, since 12th September ice extent has fallen somewhat, and the anomaly as of 24th September has climbed back up to 1.89 million sq km.
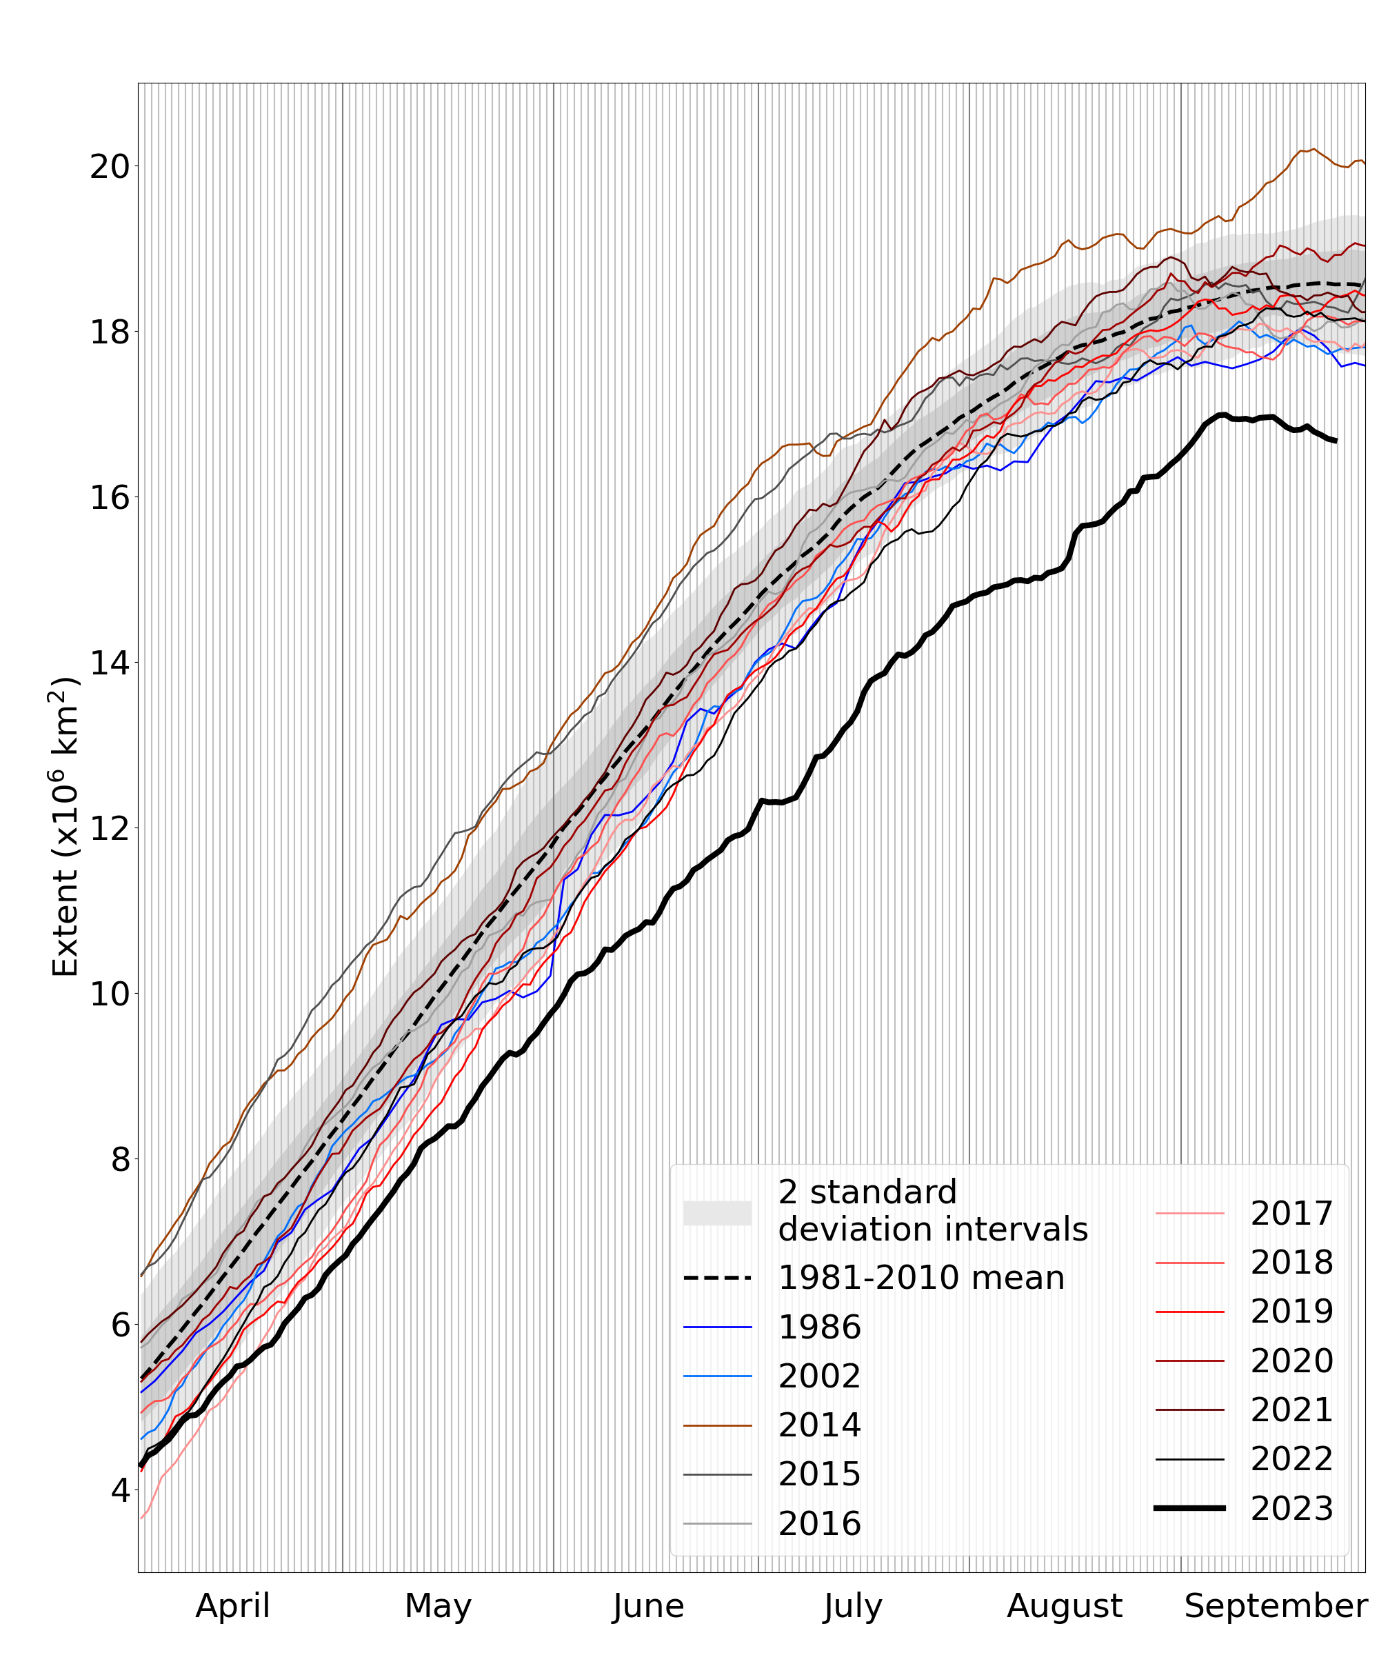
Figure 4. Daily Antarctic sea ice extent for 2023, compared with recent years, some historic low-ice years, and the 1981-2010 average, with +/- 1 and 2 standard deviation intervals indicated by the shaded areas. Data are from the National Snow and Ice Data Center (NSIDC).
References
Fetterer, F., K. Knowles, W.N. Meier, M. Savoie and A.K. Windnagel (2017) Sea Ice Index, Version 3. Boulder, Colorado USA. National Snow and Ice Data Center. https://doi.org/10.7265/N5K072F8. Date Accessed: 03-07-2023.
Tonboe, R., J. Lavelle, R.-H. Pfeiffer and E. Howe (2017) OSI SAF Global Sea Ice Concentration. Product OSI-401-b. Version 1.6. September 2017, Available at: https://osi-saf.eumetsat.int/products/osi-401-b