

Climate change questions
Climate change is a complicated topic, and lots of people still have questions. Here, we answer the climate change questions we get asked the most, and how we know climate change is happening.
We understand more and more about climate change every day, as thousands of scientists all over the world study its causes and effects.
The evidence is clear: climate change is happening, and the major cause is burning fossil fuels like oil, gas and coal.
This page looks at some of the most common questions we get asked about climate change, and the latest research that helps us answer them.
Contents
- Has the climate changed naturally before?
- Is it true that the climate wasn't stable before the Industrial Revolution?
- Do rises in carbon dioxide follow rises in temperature in prehistory?
- If carbon dioxide is a trace gas in our atmosphere, why does it matter?
- If we add more and more carbon dioxide to the atmosphere, will it have less of an effect over time?
- Are human emissions of carbon dioxide lower than natural emissions? If they are, do we have a small effect?
- Are there any natural forces that explain the rise in global temperatures?
- Is climate change a result of the Sun getting hotter recently?
- What about El Niño events? Haven’t they caused the recent warming?
- Don’t climate models have huge uncertainties in their results?
- Have any climate projections come true?
- Hasn’t global warming stopped?
- Weren’t there warnings of global cooling years ago?
- Won’t more CO2 in the air help plant growth?
- Won’t warming the planet bring benefits overall?
- Is Antarctic sea ice decreasing?
- Do all scientists agree that climate change is happening?
- Does climate data get changed after it is measured?
- If more weather stations are in cities, is that why they record higher temperatures?
Has the climate changed naturally before?
Yes, the climate has been changing since the earliest history of the Earth, long before humans ever existed. For example, during the time of dinosaurs (about 66 to 230 million years ago), Earth’s climate was several degrees warmer on average, allowing forests to grow in Antarctica.
We also know more recent geological periods have had high temperatures. Temperatures during the Eemian period (about 115,000 to 130,000 years ago) may have been a few degrees warmer than the pre-industrial period of human history (Snyder, 2016). Temperatures were warm enough for hippopotamus and water buffalo to live in central Europe and the British Isles (van Kolfschoten, 2016).
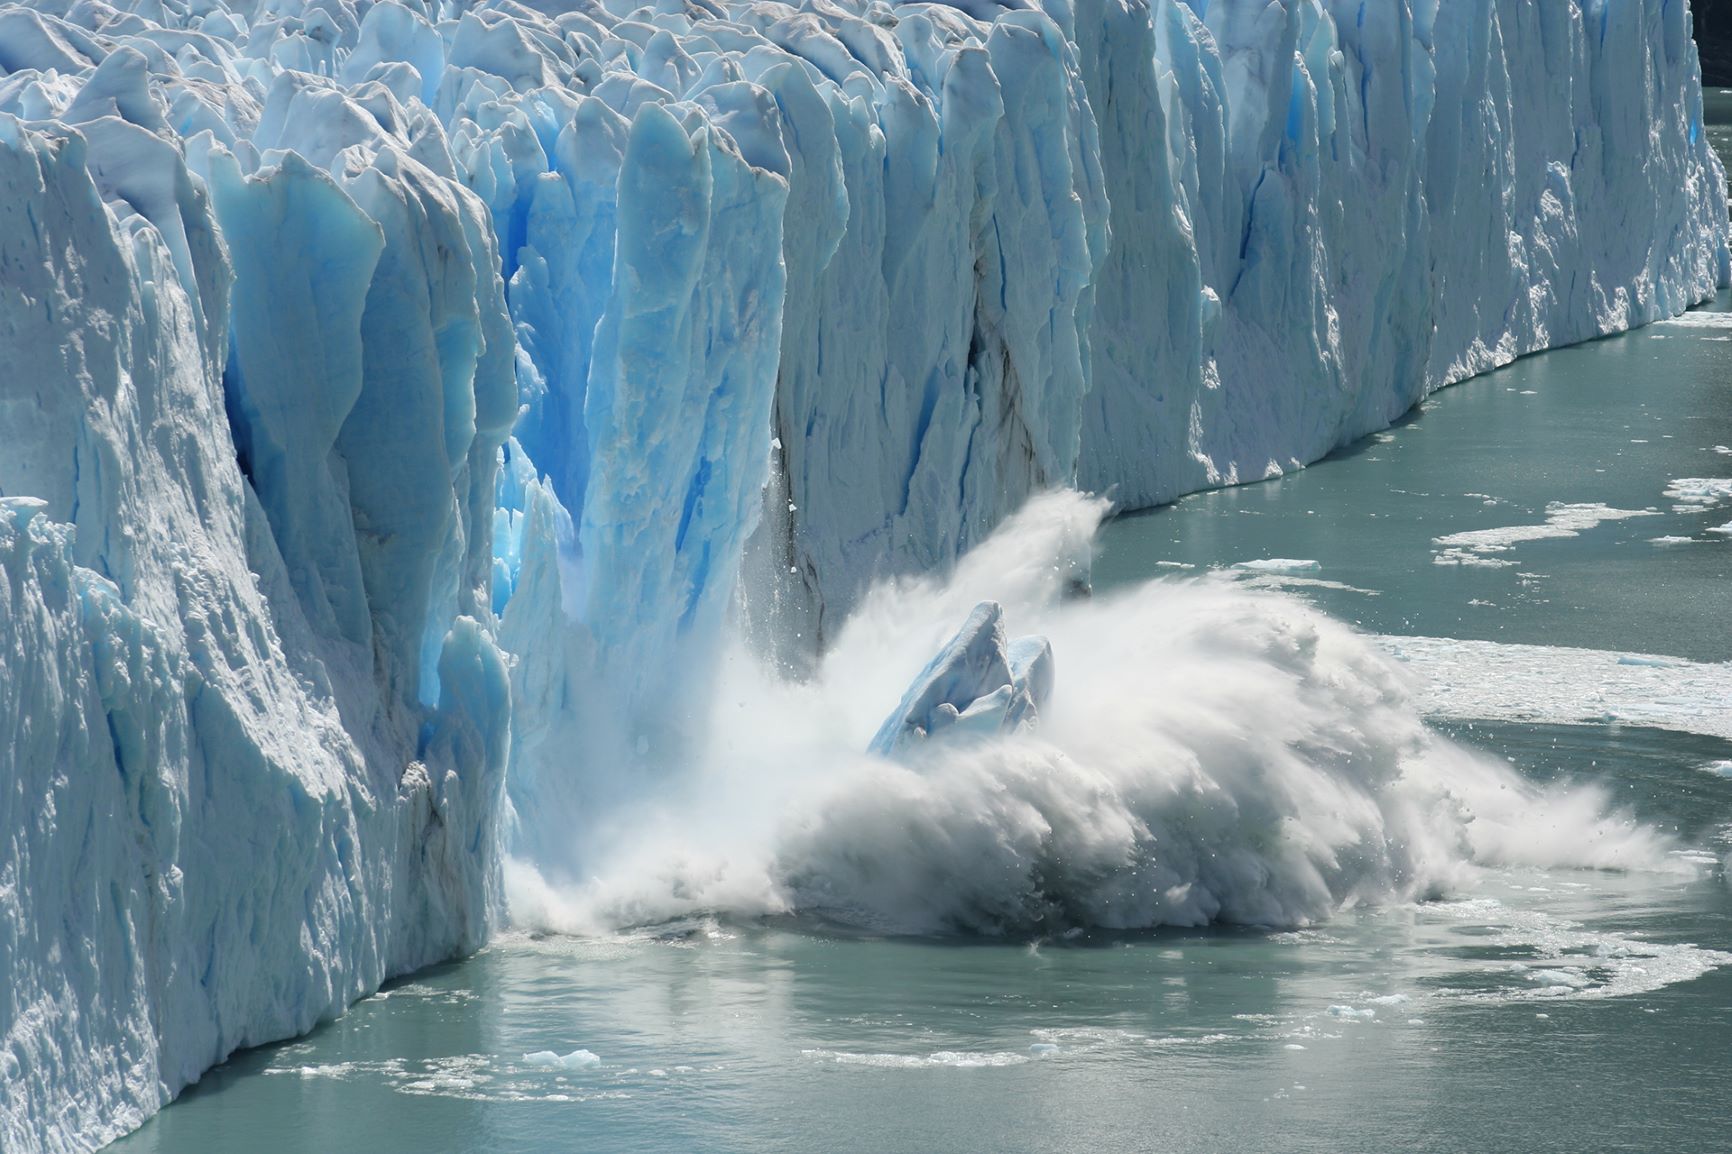
One of the key differences between this natural climate change and what we see today is the speed and rate of change. After previous glacial periods (cold phases where ice sheets covered much of northern Europe), the Earth warmed at a rate of between 4 and 7 °C over 5,000 to 10,000 years (NASA; Clark et al., 2016).
Today, though, we have seen more than 1 °C of warming over the past 160 years. Most of this warming has taken place in the last 50 years. This warming is many times faster than the natural warming that followed glacial periods.
One thing that natural and modern climate change have in common is the link between warming and carbon dioxide (CO2) emissions. Carbon dioxide levels are rising rapidly today, but this has also happened naturally in Earth’s history.
Unusually intense periods of volcanic activity, which release enormous levels of carbon dioxide into the atmosphere, have been linked to several mass extinction events in the history of life on Earth (Wignall, 2001). The only difference with today’s climate change is that humans are causing this release of carbon dioxide, not natural forces.
It is true that the climate has changed in the past, and global temperatures have been much hotter. But the speed at which climate change is happening today means it is still likely to have a severe impact on the Earth, and the effects of human activity are clear.
Is it true that the climate wasn’t stable before the Industrial Revolution?
People often suggest that periods of warming and cooling show that the global climate wasn’t stable before the Industrial Revolution. Examples include the ‘Roman Warm Period’, the ‘Medieval Warm Period’ and the ‘Little Ice Age’.
The difference is that these events were regional, and only affected parts of the world. This is an important distinction, because what we see today is a period where most of the globe is warming at the same time.
The Roman and Medieval warm periods only affected the North Atlantic region. During the Little Ice Age, the coldest temperatures were in different regions at different times:
- The coldest temperatures in the central and eastern Pacific Ocean happened in the 1400s
- The coldest temperatures in northwestern Europe and southeastern North America happened in the 1600s
- The coldest temperatures elsewhere were in the 1800s.
This differs from what we see today, where global temperatures are rising at the same time.
The stability of the global climate is something that scientists have studied in great detail. One study showed the relative stability of global temperatures over the last 11,000 years, followed by a sharp increase in global temperatures during recent decades (Kaufman et al., 2020). This proves the distinction between periods of regional temperature change in the last 2,000 years, and the global climate change we are seeing today.
Do carbon dioxide levels and temperatures always rise and fall in sync?
Sometimes, rises in atmospheric carbon dioxide concentrations have happened after temperature rises, but only in specific places and periods.
One place where this has happened is Antarctica, following the last Ice Age, around 11,500 years ago. Here, we would expect to see this happen, because changes in the Earth’s orbit (known as Milankovitch cycles) caused the temperature to rise, not carbon dioxide levels.
Recent studies suggest that any lag in carbon dioxide levels may be small, or limited to Antarctica. This is because there is an uneven distribution of warming around the world (Shakun et al., 2012; Parrenin et al., 2013; Beeman et al., 2019). Many early studies on post-Ice Age warming only used Antarctic ice cores, hiding how small this pattern may be.
Some warm phases during the last Ice Age, such as the Eemian, had higher temperatures than today, but lower carbon dioxide levels (Brovkin et al. 2016). This differs from what we see today. The difference is that modern temperatures are not in balance with the carbon dioxide in our atmosphere yet – they haven't caught up.
If carbon dioxide is a trace gas in our atmosphere, why does it matter?
Yes, carbon dioxide is not a large part of our atmosphere, but even trace gases can have a large effect.
The current carbon dioxide concentration in the atmosphere is around 410 parts per million (ppm), roughly the same as two drops in a bathtub full of water. Even though there is a very low concentration, it can still have a large effect.
For example, the ozone layer protects us from many of the damaging effects of ultraviolet radiation from the Sun. It does this despite being a tiny part of our atmosphere. The concentration of ozone in the ozone layer is only 10 to 15 parts per million, far less than the concentration of carbon dioxide in the atmosphere.
Another reason trace amounts of carbon dioxide can have a large effect is because it can build up easily in the atmosphere. Carbon dioxide has a ‘long residence time’, which means it stays in the atmosphere for a long time – much longer than water vapour, for example.
Water vapour is a greenhouse gas too, but it leaves our atmosphere in the water cycle as rain and precipitation in about 9 days (van der Ent & Tuinenberg, 2017). Carbon dioxide, however, can remain in the atmosphere for anywhere between 5 and 200 years. The time it stays in the atmosphere depends on the removal mechanism, before a carbon sink absorbs it.
This longer residence time means that carbon dioxide builds at a greater level as emissions increase. Human emissions of carbon dioxide have disrupted the natural balance between emissions and absorption, which existed before the industrial revolution. This has led to a steep increase in the concentration of carbon dioxide in the atmosphere.
Natural absorption simply can’t keep up with the rate of carbon dioxide emission. Then, carbon dioxide’s long residence time means that it continues to build up, increasing the effect it has on global temperatures.
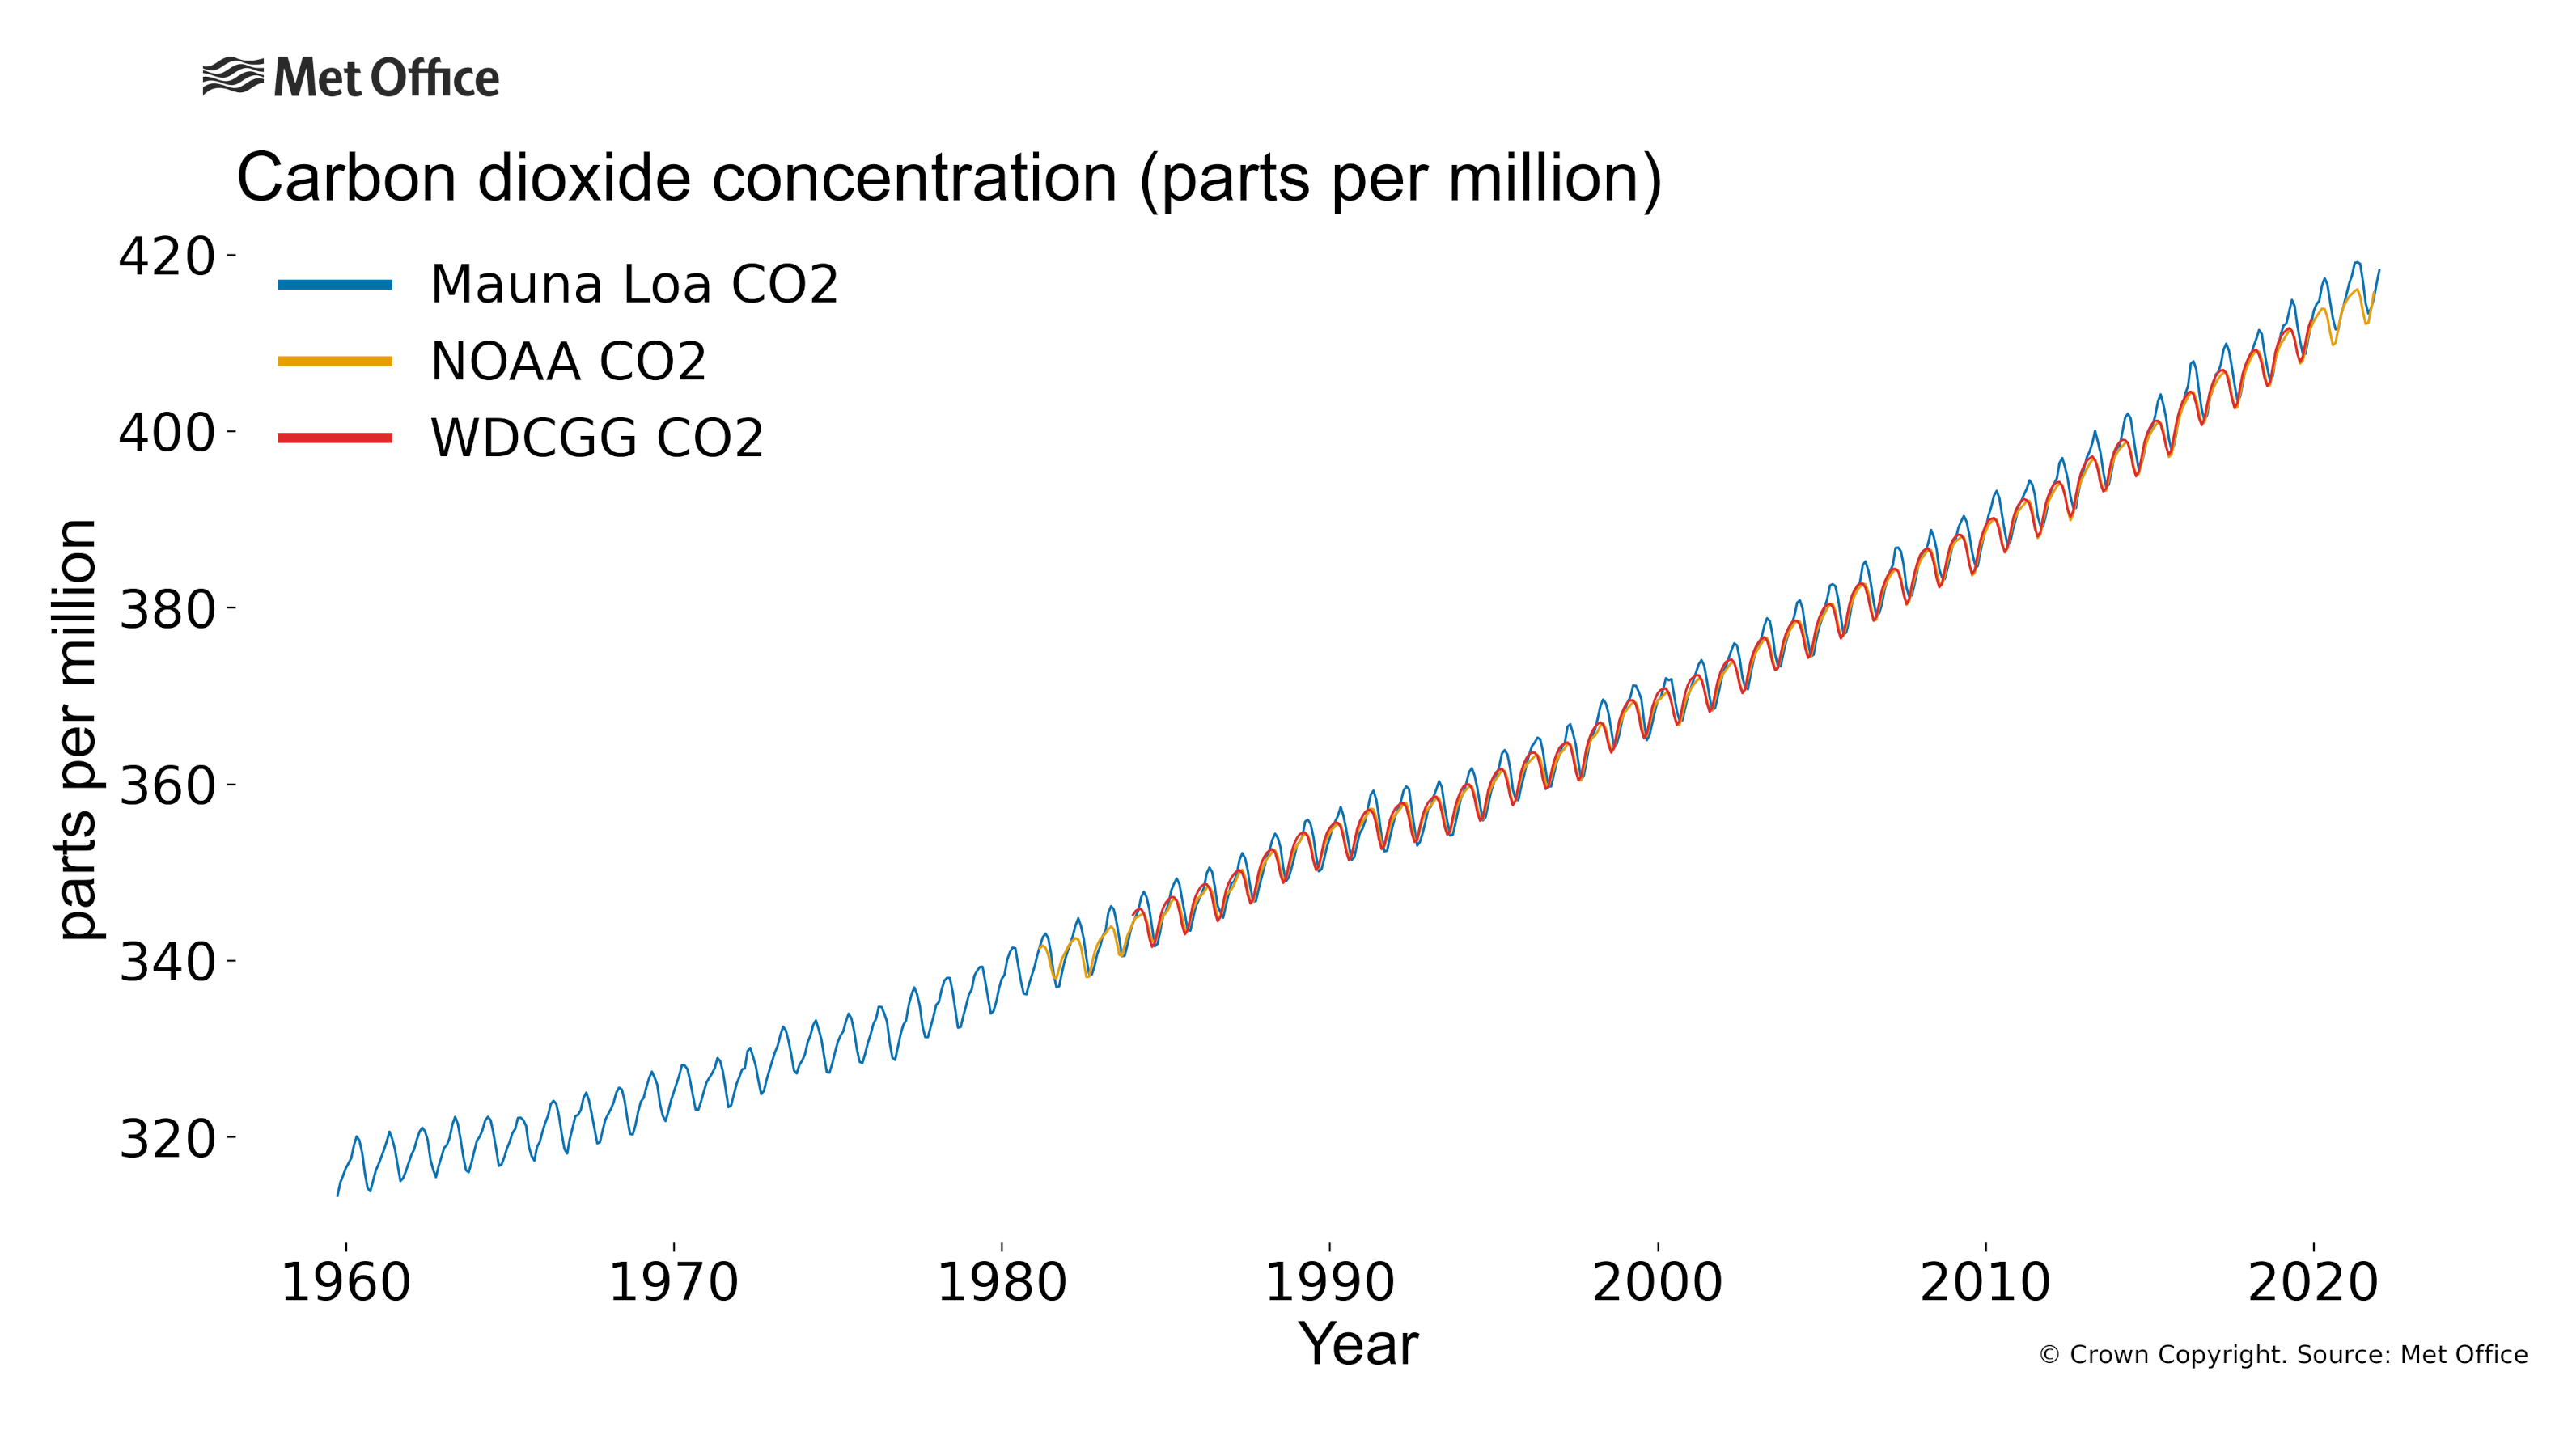
This graph shows the rising level of carbon dioxide in our atmosphere since 1960.
If we add more and more carbon dioxide to the atmosphere, will it have less of an effect over time?
Yes, the effect of rising carbon dioxide on global temperatures reduces as concentration increases. We call this a logarithmic relationship, which happens because there is a saturation effect and it becomes increasingly difficult for carbon dioxide to influence the climate.
It’s important to remember that we build this model into our projections. We understand the relationship between atmospheric carbon dioxide concentrations and their effects (as radiative forcing). There is a formula for this relationship, seen in the Third Assessment Report from the Intergovernmental Panel on Climate Change (IPCC), first published in 2001.
In short, we know that more and more carbon dioxide will have less of an effect over time, but there can still be significant effects on the world before then.
Are human emissions of carbon dioxide lower than natural emissions? If they are, do we have a small effect?
Land and ocean ecosystems are large sources of carbon dioxide, as well as large sinks that absorb it. We see this in the annual cycle of atmospheric carbon dioxide. Carbon dioxide is at its lowest during the northern hemisphere’s late summer, as vegetation grows and absorbs it.
During the pre-industrial period, these sources and sinks of carbon dioxide were in balance, so levels were stable for centuries. In the modern era, humans have added carbon dioxide to the atmosphere, which has tipped this balance. The land and ocean ecosystems only absorb half of the additional carbon dioxide we have released. This has caused atmospheric carbon dioxide levels to increase from 278 parts per million in 1850 to over 400 parts per million today.
Are there any natural forces that explain the rise in global temperatures?
There are many factors that affect the climate, including ‘internal variability’ (natural variations over time) and ‘external forcings’ (influences on top of natural variation).
For example, ocean variability is a natural event, where heat moves around the climate system over short and long periods. This movement can cause a short-term change or fluctuation in global temperatures. The problem is that natural forces do not account for the sustained rise in global temperatures we have seen in recent decades.
External forcings cause an energy imbalance. They affect the balance between energy that enters and leaves our climate system. Some examples of external forcings include:
- solar activity
- the Earth’s orbit
- concentration of greenhouse gases.
All of these could cause long-term warming, but only the forcings connected to human activity fit the characteristics and patterns of recent warming.
Changes in Earth’s orbit have altered the climate before, but are too slow to cause recent warming.
If more heat entered the climate system from the Sun, the entire atmosphere would warm up, but this is not what we are seeing. Instead, we see that the lower layers of the atmosphere are warming, while the upper layers are cooling. This matches what we would expect if greenhouse gases were the cause, since they trap heat in the lower atmosphere.
Volcanoes emit greenhouse gases, but their emissions are far smaller than those of human activity. They are not enough to cause the level of warming we’ve seen.
When we look at carbon dioxide in the atmosphere, we see more of it every year coming from the burning of fossil fuels. Oxygen levels are also decreasing, which suggests more burning is taking place.
To put it simply, greenhouse gas emissions from human activity are the only thing that fit the pattern and characteristics of warming we have seen.
Is climate change a result of the Sun getting hotter recently?
It would make sense for the climate to change if the Sun got hotter, but we have seen no evidence to suggest this is happening.
When we consider the Sun’s input into the Earth’s climate, we define it as solar irradiance, usually Total Solar Irradiance (TSI). This is a measure of how much energy from the Sun per second would hit a 1 metre square surface, at the same distance as the Earth is from the Sun. We measure TSI in Watts per square metre (W m-2). Basically, we use this to measure the amount of energy that the Sun adds to our climate system.
Datasets used by the Intergovernmental Panel on Climate Change (IPCC) show that there has been a small increase in TSI, which means more energy warming the climate between 1750 and 2011. However, this has only been 0.05 W m-2 – far smaller than the effect that humans have had on the climate.
TSI has actually been on a minor downward trend since the 1980s – the same time that global temperatures have been increasing. This shows that an increase in energy from the Sun is not the cause of modern climate change.
What about El Niño events? Haven’t they caused the recent warming?
El Niño events are the warm sea surface temperature phase of the El Niño Southern Oscillation (ENSO), with the cold phase being known as La Niña. ENSO involves changing patterns of atmospheric pressure and ocean temperatures in the equatorial Pacific. Events typically occur every 2 to 7 years and last for two or three seasons.
As well as altering regional weather patterns, ENSO also influences global temperatures and makes some years slightly warmer or colder than others. However, the influence of this natural climate variability is only temporary and shows no long-term trend. This is in stark contrast to the sustained, long-term increase we have seen in global temperatures. You can find data on ENSO variability on our Climate Dashboard.
All major parts of the climate system are warming, including the oceans. This cannot be caused by an internal variation such as ENSO which simply moves existing heat around.
Don’t climate models have huge uncertainties in their results?
It’s been said that ‘All models are wrong but some are useful’. It’s important to understand which aspects of the climate our models can represent really well, and which parts are harder to get right. This understanding allows us to use what models tell us appropriately, or where we need to interpret them more cautiously. We also need to use climate models alongside other information – for example, when looking at a projection model trend, we might also look at what the historical weather observations tell us and think about what our physical understanding of the climate tells us.
Climate models are constantly being developed and improved. Modern models include more atmospheric processes, make fewer approximations and achieve higher and higher resolution than older versions, among other improvements. The complexity of the climate, particularly feedbacks between different processes, means there will probably always be room for improvement. However, by making sure we have a good understanding of the strengths and weaknesses of climate models we can use them alongside other information to give us an idea of the overall climate trend and its likely effects. This provides really valuable information for thinking about the kinds of climate change and impacts we might need to adapt to and try to avert through mitigation policies.
Have any climate projections come true?
Yes, even climate models from over 40 years ago made accurate predictions about future warming.
Now that enough time has passed, we can compare those projections with observations of what we see today. Scientists looked at 17 global surface temperature projections from studies between 1970 and 2007 (Hausfather et al. 2019), to see how accurate they were. They found temperatures were “pretty much right on where models have predicted” (Science).
We are always improving our climate models, which build upon this success, and continue to make accurate projections.
Hasn’t global warming stopped?
There have been several claims that global warming has stopped, often looking at different time periods as proof. The claims often have similar issues, however.
A lot of media attention was given to a so-called ‘slowdown’ or ‘hiatus’ in global temperature rise between 1998 and 2013. Subsequent analysis has suggested several possible reasons for this but also demonstrated that it was a short-term event; the long-term rise in global temperatures has continued since.
1998 was the hottest year on record up to that time, thanks to a particularly strong El Niño effect. This raises global temperature in the short term. There followed a period of lower global temperatures, as would be expected if 1998 was particularly hot.
Claims of a ‘hiatus’ almost always use 1998 as a starting point because 1997 and 1999 were cooler. Starting with either of them would have revealed the warming trend. 2014, 2015 and 2016 were all significantly hotter years than 1998, again revealing the overall warming trend. The years since have continued to be among the hottest recorded. Even those years with a temporary cooling influence from La Niña, such as 2022, are now much warmer than all years before 2015, even those that had been boosted by a warm influence from El Niño.
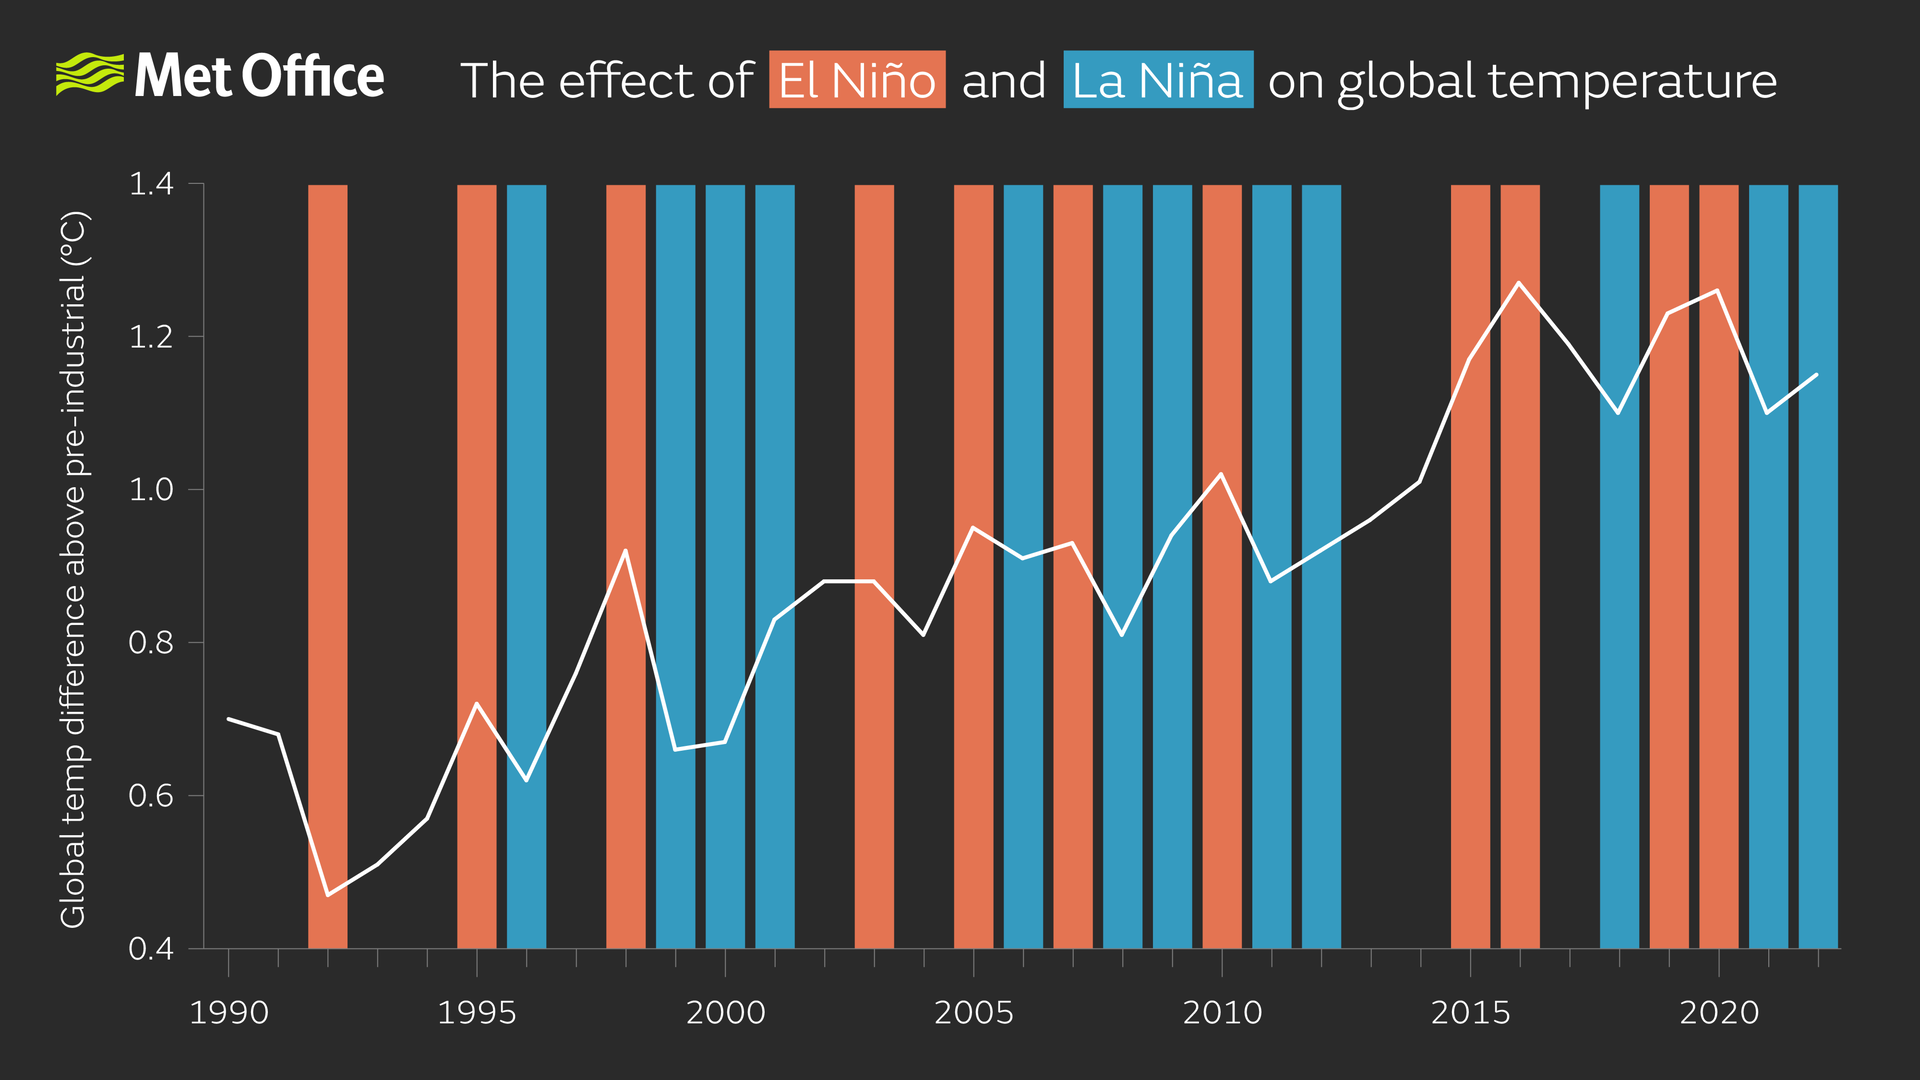
This graph shows global temperatures since 1990 with El Niño and La Niña years marked.
Studies have since shown that the supposed ‘slowdown’ in global warming was probably due to natural variability in the climate with additional cooling caused by small volcanic eruptions and changes in aerosols. It has also been linked to greater heat uptake by the oceans. Short-term events like this can be superimposed on a long-term trend, but they do not necessarily affect or disprove that overall trend.
More recently, claims have been made that global warming stopped in 2016. This is the hottest year in the instrumental record so far, again thanks to a strong El Niño. It would be expected that subsequent years would be cooler, nearer the average trend, exactly like the years following 1998. These claims have not attracted the same media attention as before, perhaps thanks to the questions having already been answered following the earlier ‘hiatus’.
Weren’t there warnings of global cooling years ago?
During the 1970s there were some scientific studies and numerous media reports warning of global cooling and a new Ice Age. There was some scientific basis for this view initially, but it became apparent that global temperature increase was more likely in the long term, which has turned out to be true.
By the early 1970s global temperatures had been falling slowly since the 1940s. Studies revealed this was largely due to increasing levels of atmospheric aerosols produced by human activity. These affect sunlight entering the atmosphere, lowering global temperatures. Greenhouse gases like carbon dioxide, which warm the Earth, were also being emitted, and there was some scientific debate as to which effect would be stronger.
The adoption of air pollution legislation around the world in the late 1970s ultimately made this debate unnecessary. Aerosols can have negative effects on human health and the environment, leading many governments to limit their emissions. As they do not remain in the atmosphere long, their cooling effect quickly diminished.
Peterson et al. (2008) carried out a survey of the papers published at this time and found that far more papers suggested global warming than cooling. They also had many more citations, indicating how many other scientists used them in their own work.
The majority of the scientific community clearly favoured warming as the most likely future trend, but the majority of media reports from the time focussed on global cooling. This gives a misleading impression of scientific opinion and wrongly suggests scientists have changed their minds since. This is not the case; global cooling was once considered by the scientific community but did not turn out to fit the observed data and trends.
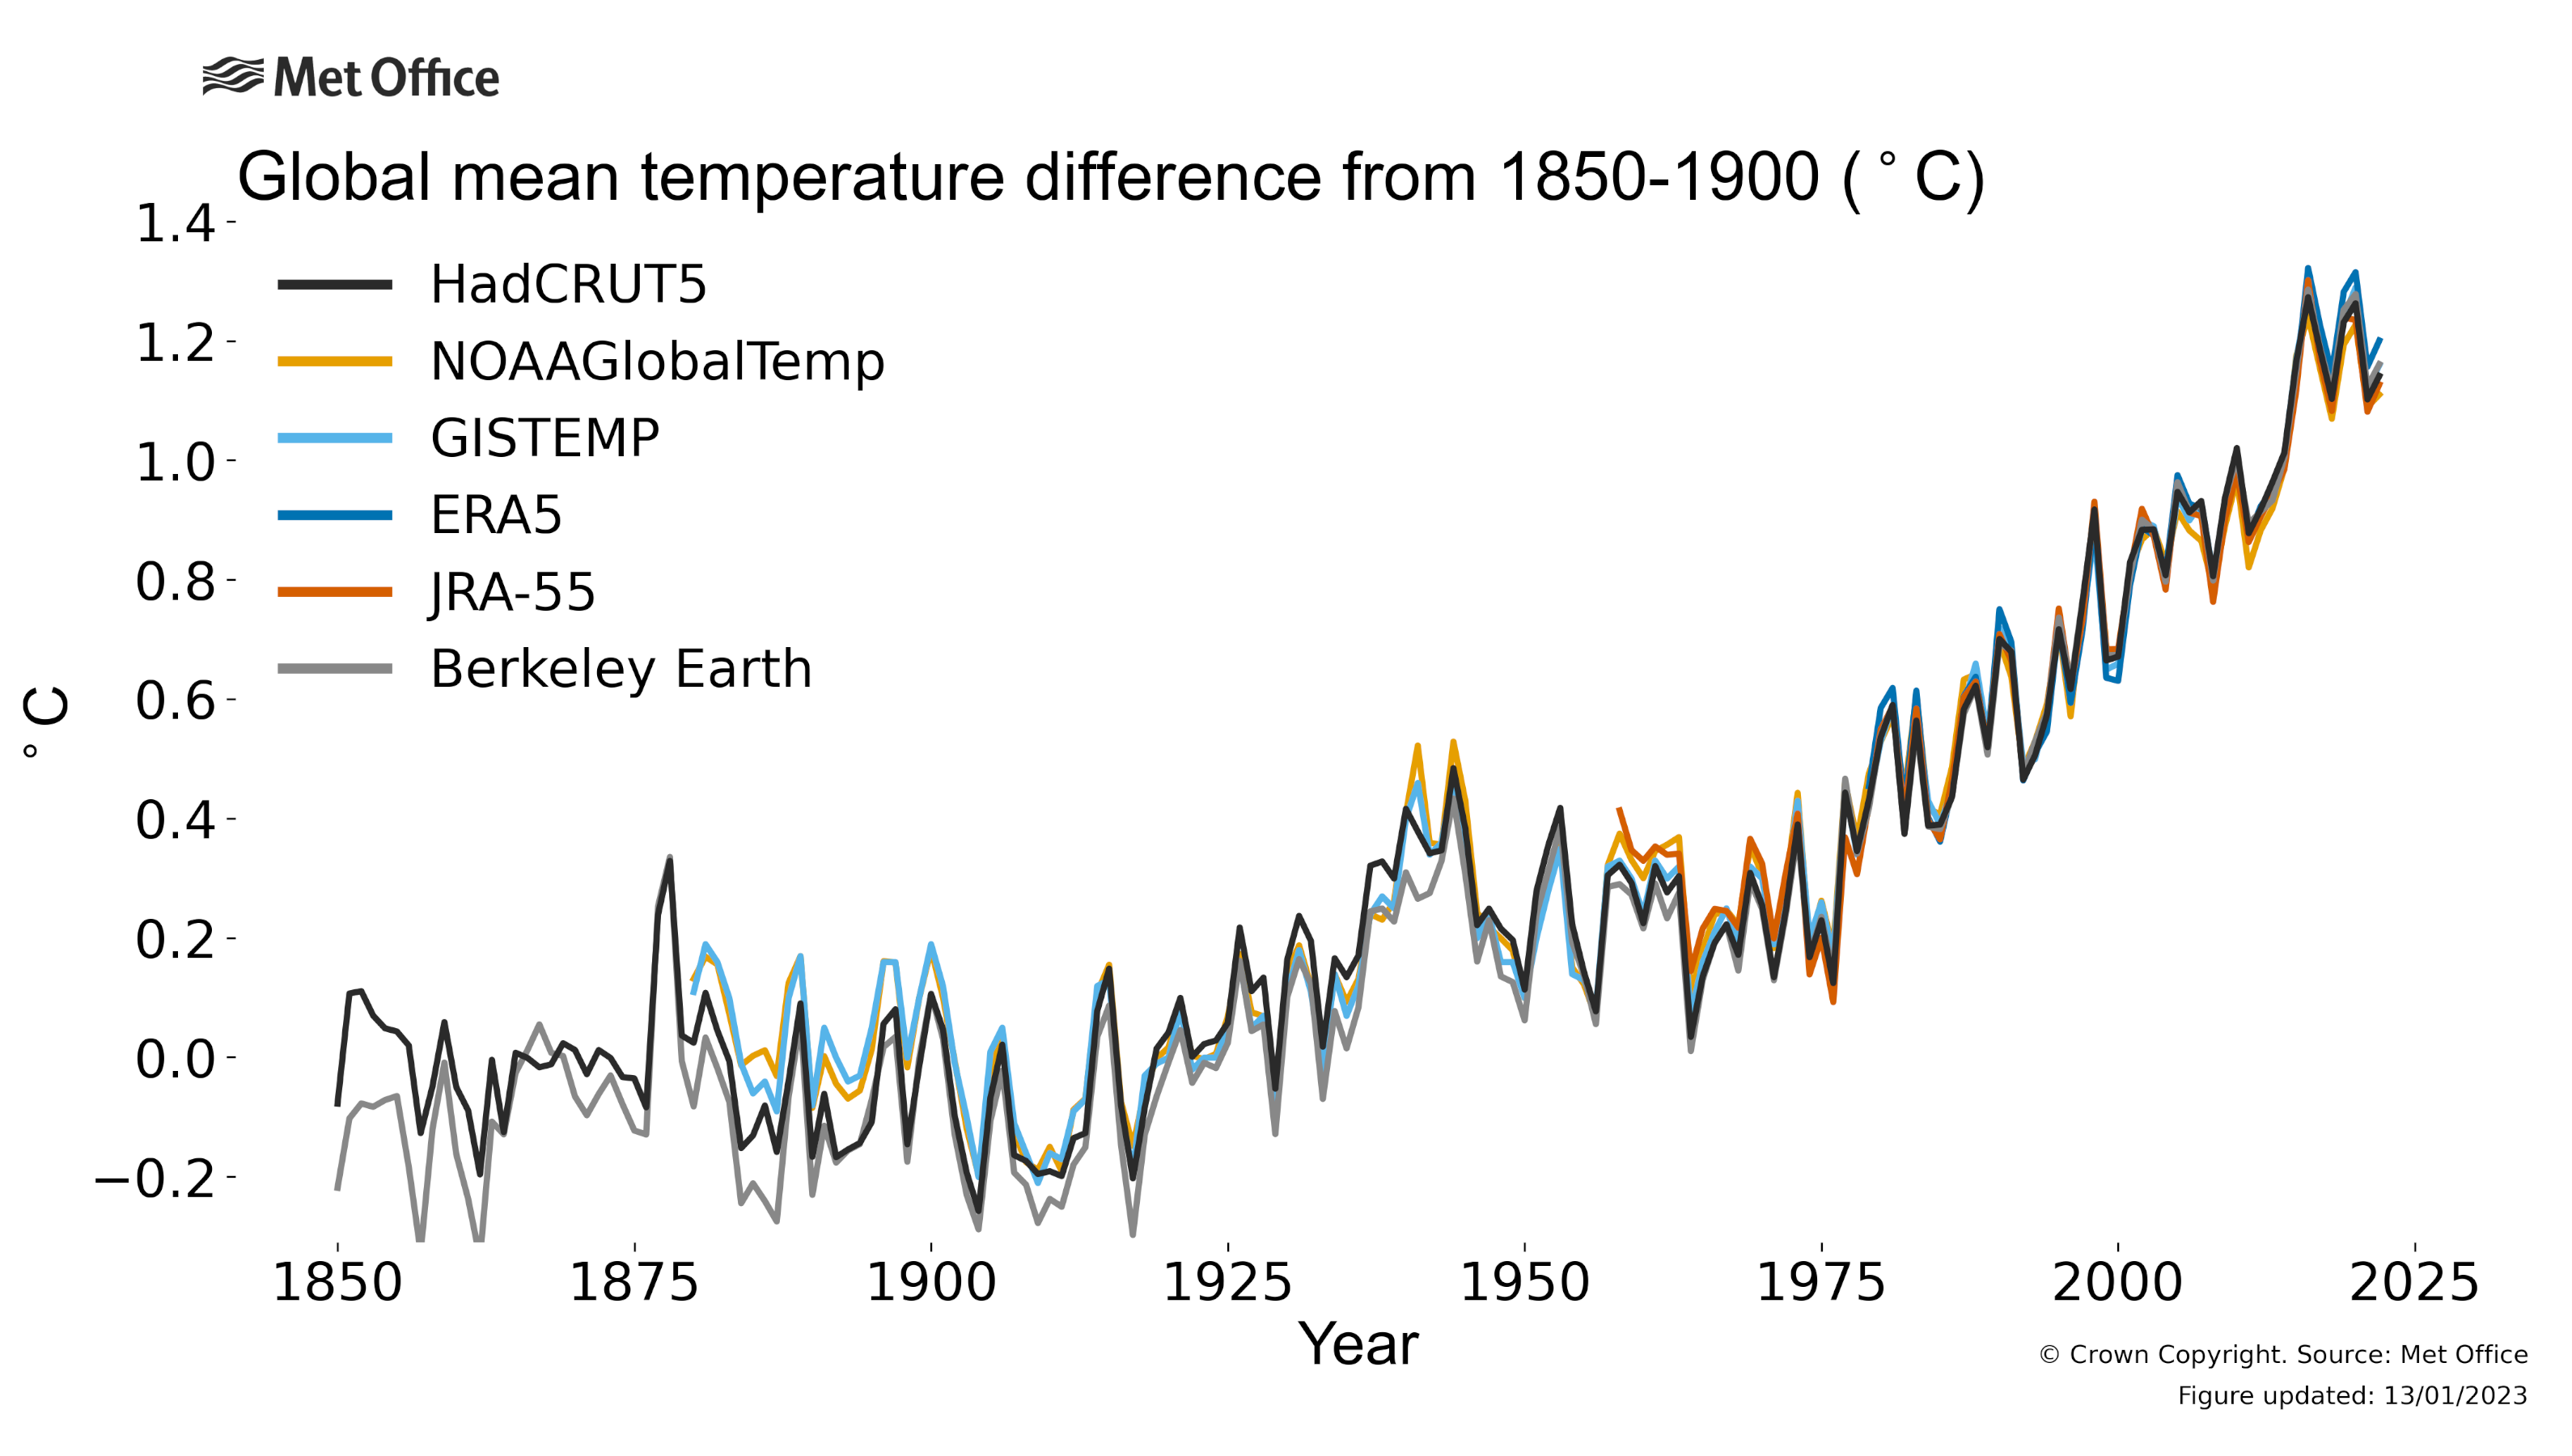
This plot shows the global temperature change from 1850 to 2022, compared to an estimated 1850-1900 baseline average temperature.
Won’t more CO2 in the air help plant growth?
Not always, and less so in the long term. Plants use CO2 in photosynthesis to manufacture food and many species can grow better when more CO2 is available to them as long as there are no other limiting factors. However, the reality is that other limiting factors do exist, including the role of CO2 as a greenhouse gas causing warming temperatures. Some farmers will pump CO2 into their greenhouses under controlled conditions, increasing yield and shortening growing time. For example, this agricultural use amounted to several megatonnes per year in the Netherlands in 2019 (IEA, 2019), and is expected to reach 100-200 kilotonnes per year in the UK by 2030 (Alberici et al., 2017).
The problem with applying this to crops in fields or to wild plants is that there are many more environmental factors to consider which plants growing in greenhouses are shielded from, including the effects of climate change.
More CO2 will only enhance the growth of plants when they have enough water and other nutrients they require. The increased heat that climate change will bring can also impact plants, affecting how well they can grow in certain areas. This effect will be greater in a warmer world. Different plants also respond to increased CO2 in different ways depending on which type of photosynthesis they use.
Several NASA reports (such as this 2016 report and this more recent one) are often raised when the question of CO2-enhanced plant growth is mentioned. Satellites have shown that vegetation growth has increased in recent decades, largely due to increased CO2 levels. NASA themselves say, however, that this effect may be limited for the reasons described above, while any cooling effect from increased vegetation is “only about 10%-20% compared to the pace of global warming”. Indeed, one recent study suggests that greening may in fact have reversed around the year 2000, although this requires further research for confirmation (Chen et al., 2022). A recent greening trend would not be not proof that climate change is beneficial.
The IPCC AR6 report describes how increasing instances of heatwaves and drought events occurring together are already causing crop losses. Risks to crops will increase with the level of global warming. If a warming of 2°C is reached, many areas may become unable to grow many staple crops. Limiting the level of global warming will reduce the impact this could have, for example on food security.
Won’t warming the planet bring benefits overall?
There are some benefits to be found in certain locations at certain levels of warming. A low level of warming is likely to increase some crop yields in colder countries. Some countries are also seeing fewer cold-related health problems as winters become warmer, however the overall picture of this is mixed. Some countries are seeing stable or even increasing trends in cold-related health problems over time, even with ongoing warming (IPCC AR6 WGII, 7.2.4.1). For instance, one study found an increase in the frequency of cold extremes in Sweden, despite warming temperatures overall, contributing to a small increase in mortality in winter (Åström et al., 2013).
At the same time, other parts of the world would be suffering from drought or an increase in heat stress. A warmer world would also certainly lead to rising sea levels through melting of ice and expansion of ocean waters threatening hundreds of millions of people in coastal communities worldwide.
Many of these negative impacts become worse with additional warming, affecting more people and quickly overtaking any benefits some areas or industries might see. Climate change often acts as a stress multiplier, making existing problems more severe. This can impact everything from the natural world to people’s livelihoods and their health.
The IPCC AR6 report and Special Report on Warming of 1.5°C provide useful summaries of the impacts we can expect to see at different levels of warming.
Is Antarctic sea ice decreasing?
Antarctic sea ice extent is the area of the Southern Ocean with at least 15% sea ice coverage. Since 1979, satellites have been measuring sea ice extent around Antarctica. Up until 2007, Antarctic sea ice extent showed a very small increase, but since 2007 it has been highly variable. Extent from 2012-14 was very high, with three successive record maxima observed, but a sharp decline to below-average levels occurred in 2016. Average annual extent for 2023 was the lowest on record by a very large margin. Because of this very high variability, the long-term trend in Antarctic sea ice is still close to zero – although the trend for the last 15 years is now strongly negative.
So, why has Antarctic sea ice been so variable since 2007– and why was it previously not decreasing, unlike what was observed in the Arctic? Scientists think that this was partly due to increasing westerly winds in the Southern Ocean around Antarctica which moved the sea ice further north, allowing new ice to form near the Antarctic coast. These winds, it’s now thought, also began mixing warmer waters towards the surface. In 2016, the warm subsurface ocean layer could have mixed with the cold surface layer, causing the sudden drop in extent observed.
The earlier increase in Antarctic sea ice extent could also have been partly caused by a freshening of the ocean, arising from melting of the Antarctic sea ice shelves and increased rainfall (as a warmer atmosphere can hold more moisture). Because fresher water is less dense, this would have had a stabilising effect, delaying the warmer subsurface water from reaching the surface.
The causes of the extremely low Antarctic sea ice of 2023 aren’t yet clear, but it’s thought that an unusual atmospheric circulation pattern helped cause this, with more exchange of warm air from lower latitudes taking place. However, it can’t be ruled out that the ocean may again have played a part.
The exact contribution of anthropogenic global warming to the Antarctic sea ice decline since 2016 isn’t known. The variability since 2007 shows that the behaviour of Antarctic sea ice, and the way it interacts with the rest of the climate system, is very complex. Further extreme variability in either direction can’t be ruled out in the years ahead.
Do all scientists agree that climate change is happening?
This is a hard question to answer properly. Surveys of scientists working in climate generally suggest that over 90% agree that humans are causing modern climate change.
It’s important to remember that surveys can oversimplify things. This is a particular risk in climate science, where surveys can reduce very complex ideas or opinions down to a single number or percentage.
Another way of thinking about agreement and consensus in climate science is to look at the number of bodies and organisations that support our current understanding of climate change.
The Intergovernmental Panel on Climate Change's (IPCC) work looks at scientific research and evidence from all over the world, to give us the most accurate picture of if and how our climate is changing. Their Sixth Assessment Report cited over 14,000 scientific publications, from hundreds of different authors.
The scientific process demands we remain open to new findings and information. But today, there is clear support for our agreed position on climate change – it is happening and humans are the primary cause.
Does climate data change after it is measured?
We may make small changes to the data in our climate datasets after we have collected it. Some reasons we might need to do this include:
- changes to our methods
- adding new data
- quality control
The Met Office estimates regional climate data series by mapping observations onto a grid, then smoothing out any irregularities. We then use this to determine regional statistics. These statistics are sensitive to what stations can provide an observation, and how we map them onto the grid.
In January 2020, we released an updated version based on our new HadUK-Grid dataset. This update included some changes to our method, which meant slight changes to some of the existing data.
One of the other reasons data may change is because of quality control. We are constantly reviewing the historical archive, because older observations may not be as good or as accurate as modern observations. That’s why quality control can lead to updates and data revisions.
While we’re talking about historical observations, we are also continuing to digitise our records. As we do this, the analysis can change as we recover new and additional observation data.
We release a provisional set of data at the end of each calendar month, based on the best data available. However, we continue to review and add to the data to make sure it is accurate. This process can take a while, since we take additional observations from other observers and partners. We then revise the regional dataset when this process is complete.
You can read more about how we use observations in data assimilation and the importance of quality control here. Any changes we make to climate data are to improve the accuracy of that dataset, and make sure it is up-to-date. This process means we can have high confidence in our datasets, and how useful they are.
If more weather stations are in cities, is that why they record higher temperatures?
It’s true that the Urban Heat Island effect influences cities and other urban areas. The Urban Heat Island Effect is where built-up areas are hotter than neighbouring rural areas.
One reason for this is because concrete, bricks and tarmac absorb heat during the day. They then release it at night, which keeps average temperatures high in areas where they are lots of buildings and roads.
Air pollution from vehicles and other sources can also increase cloud cover and trap heat, which may form a ‘pollution dome’. These and other processes can lead to cities being several degrees warmer than their surroundings.
Sometimes, cities and towns may grow around climate monitoring stations that used to be more isolated. This can increase the temperatures we measure at those stations.
So, does this suggest that we can trace changes in climate back to the expansion of cities? It’s an important question to ask, and one that climate scientists have studied at length.
The balance of evidence strongly shows that global climate change causes these warming trends, not the expansion of cities. One crucial point that supports this is that we don’t just see rising temperatures in urban areas. We also see rising temperatures in rural locations, and the sea surface temperature of coastal waters in the UK.
The Urban Heat Island effect does not influence these observations, particularly sea surface temperatures, which show the same warming trend as our land station network. You can read more about this in our State of the UK Climate reports.