What do satellite pictures show?
They may only show a snapshot of the current weather, but they can tell us a lot about what to expect in the coming days
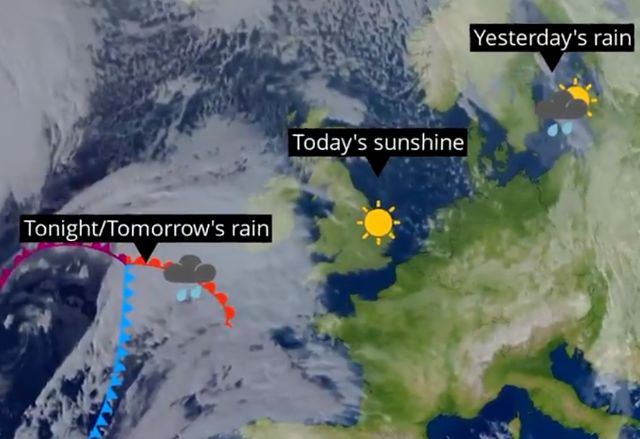
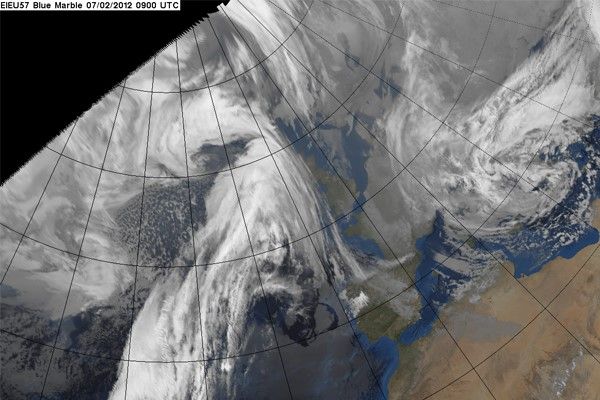
Looking out the window, we can only see a small section of the sky. This can reveal what the weather will be like in the next hour or so, but to look further ahead we must rely on images from space. Satellites essentially take a 'picture' of the earth, so that we can see what cloud is out there in the sky across a much bigger area. This helps us to check that the forecast is going as expected over the UK, but if they are put together in a sequence, they can help us track weather systems that are heading our way which may affect us in the coming days.
Tracking weather systems
For us in the UK, weather systems (which often bring wet and windy weather) usually form a few days ahead in the Atlantic, and then move eastwards towards the UK. Sometimes they can come from even further away such as the United States or Canada. We can watch them move on a sequence of satellite images, and meteorologists frequently use this up-to-date information in conjunction with forecast data. This can tell us how the weather system is developing before it reaches the UK. Sometimes it can weaken, sometimes it can become more intense, and this information is important as it can tell us whether to expect stronger winds and heavier rain, or very little rain and calmer winds by the time it arrives at the UK. We can also tell if it is going to skirt the UK completely and affect somewhere like Iceland or France instead. On some occasions, the weather system forms right over or very near to the UK, and this usually brings a lot more uncertainty to the forecast.
Identifying cloud types
This is important as we can use the satellite image to tell if there are shower clouds forming, if there is fog on the ground, or if the cloud is thin enough to allow the sun through and so on.
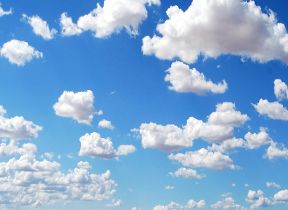
During the daytime, the satellite can take a photograph from space, called a visible satellite image. This is useful to see where the thicker cloud is, but it is harder to see the thin wispy cirrus cloud.
At night, it is too dark to take a photograph from space, but the satellite can take a thermal image of the globe, similar to what police might use to find a suspect at night. This is called an infrared satellite image. This is useful not only because you can ‘see’ at night, but also because you can see how high up the cloud is. The higher up in the atmosphere you go, the colder it gets, so the colder cloud will show up a brighter white on the thermal infrared image. This is the opposite to police images where the warmer objects (the person) show up white and colder objects show up black. The satellite images are inverted for meteorologists, only because it is more intuitive to see the clouds as white on the picture.
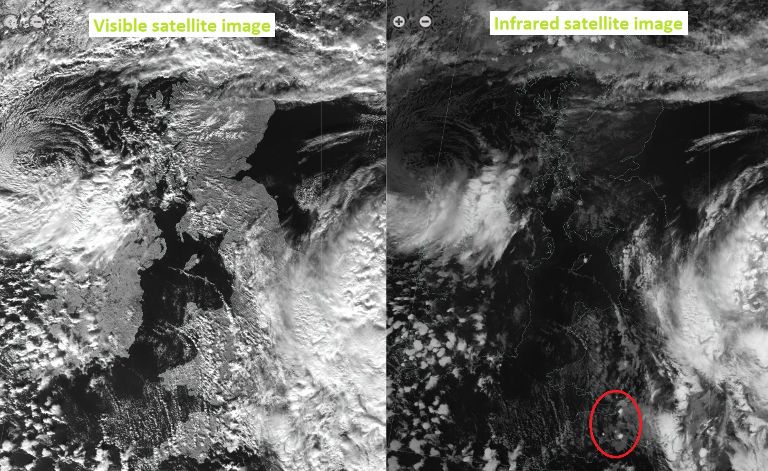
These two images were both taken during the daytime, so it is useful to compare them. For example, we can tell that some areas around Dorest and the Bristol area could get a heavy shower soon, because there are a few clouds showing bright white on the infrared image (circled). This means that the top of the cloud is very cold, so it is very high up. It is likely that these clouds have grown into cumulonimbus clouds, whereas the ones nearby (for example across Wales) are still relatively small.
Find out more
Satellites used by the Met Office
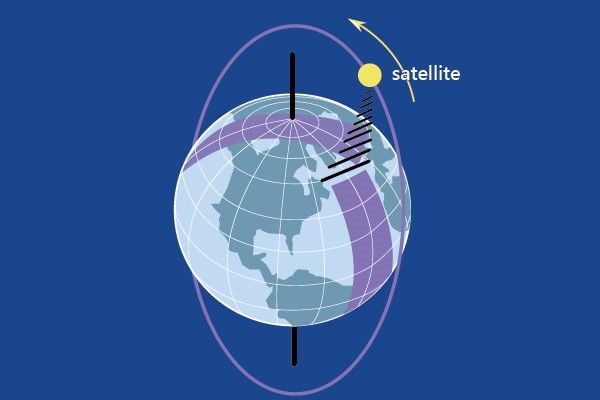
Meteorological satellites fall into two broad categories: geostationary and polar orbiting.
Geostationary satellites
Geostationary satellites, located over the equator at a height of 35,800 km, orbit the earth once every 24 hours. Spinning at the same rate as the earth they stay above the same spot all the time and provide an unbroken series of images of the atmosphere below. The Met Office contributes to the European operated geostationary satellite, Meteosat, ideally positioned over the Greenwich meridian to observe weather systems that affect the UK and the rest of Europe.
Polar orbiting satellites
By contrast, polar orbiting satellites at a typical height of 850 km are much closer to the earth allowing their instruments to make measurements at far greater resolution. Orbiting the earth about every 100 minutes, they scan wide swathes of the atmosphere as they sweep from pole to pole. Over the course of the day they view most parts of the earth at least twice. Their orbits are sun-synchronous, which means that they see that same part of the earth at the same local time each day. The Met Office contributes to the European polar orbiter, Metop, and makes use of data from similar satellites operated by US agency NOAA and others.
Satellite imagery
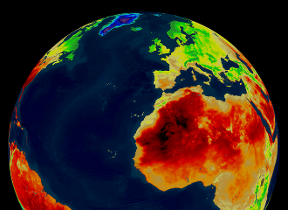
Since the first meteorological satellite TIROS was launched in 1960, satellite images have been used to give a picture of the weather as viewed from space and they have become a familiar sight on TV weather forecasts. Movie loops of images taken from geostationary satellites give a graphic impression of the movement of clouds. Viewed in the visible part of the spectrum, as the human eye would see from space, the shadows cast by the sunlight provide a three dimensional feel to the clouds, but only where there is daylight. To view the atmosphere at night, infrared imagery is needed. In this image the highest and coldest cloud tops appear white, while lower warmer clouds and the Earth's surface are in darker shades.
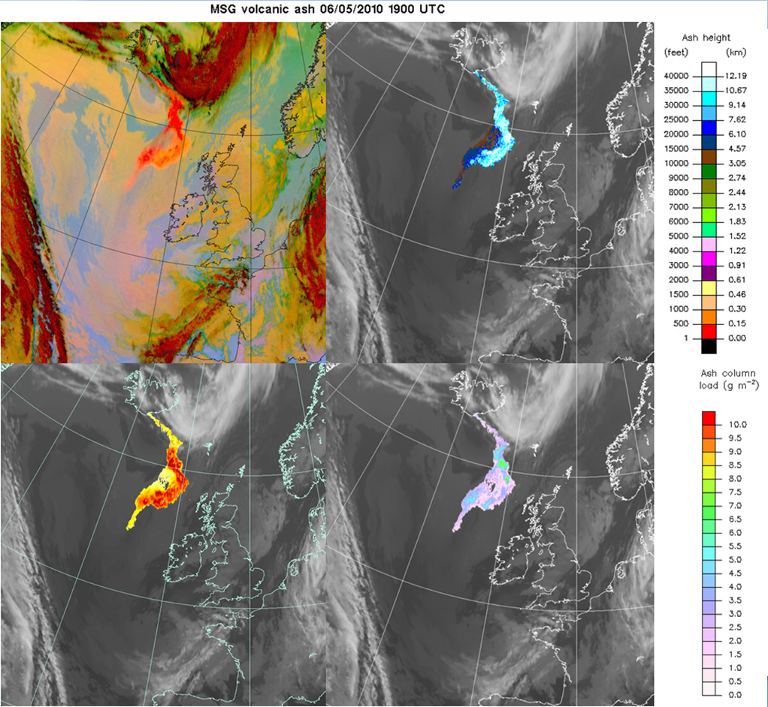
The imagery from both geostationary and polar orbiting satellites may be processed and analysed to provide a wealth of information about the atmosphere and the surface of the earth. Infrared imagery may be used to measure the coverage and temperature of clouds and identify those that are rain-bearing. The speed and direction of the wind can be inferred from the apparent motion of clouds between successive images. The temperature of the sea surface can be accurately measured from satellites as can the extent of sea ice near the poles and snow cover over land. Fog, dust storms, pollution and volcanic ash are other features that can be detected from space. Indeed imagery from satellites was a vital tool for monitoring the spread of the ash cloud from the Eyjafjallojökull volcano in Iceland in April 2010, and the black plume of toxic smoke from the Buncefield explosion north of London in December 2005.
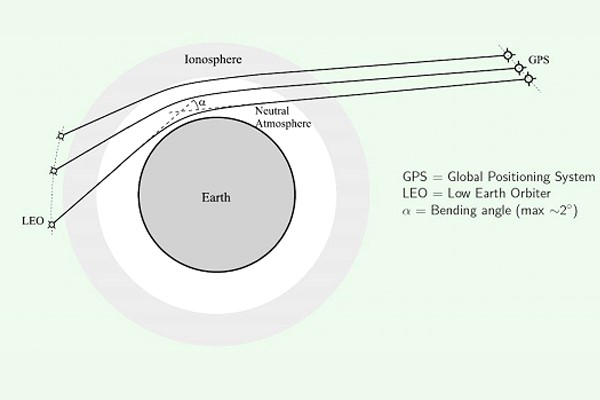
Global satellite navigation systems
The signals from global navigation satellites that help us navigate our way in a car have meteorological applications as well. Working on the same basic principles of commonly available GPS Satnav systems, the time of arrival at a ground station of a satellite signal passing through completely dry air can be calculated with immense accuracy. Water vapour in the atmosphere slows its arrival and the measured delay can be used to estimate the total water vapour content along the signal's path from the satellite. The data are particularly valuable for identifying areas of deep moist air that trigger thunderstorms on hot summer days.
Altimeters
Some satellites in low polar orbits carry an altimeter instrument that very accurately measures the distance between the satellite and the earth's surface immediately below its path. These measurements have several valuable applications, particularly over the oceans. The height of the ocean surface is dependent on many factors such as the physical properties of the ocean, oceanic tides, atmospheric pressure and local gravitational anomalies of the earth's crust. Areas of the ocean where the surface height is uniformly higher than average may be attributed to warm columns of water which expand as their temperatures rises. The distinctive pattern of warm water in the equatorial east Pacific known as el Nino and its cold counterpart, la Nina, may be easily tracked from altimeter data. Currents on at the ocean surface are driven by gradients in the height of the ocean surface in the same way that winds in the atmosphere are driven by gradients in surface pressure. The surface current may therefore be inferred from altimeter measurements in the same way that the wind may be inferred from measurements of pressure. The data are particularly useful in the Ocean models at the Met Office used for forecasting the temperature and movement of water at all levels in the ocean.
Other meteorological and oceanographic applications of altimeter data include measurement of wave height and wind speed at the ocean surface, the thickness and extent of sea ice, and the rate of rise in global sea level over the long term.
Doppler wind lidars
A lidar emits pulses of light from a laser and measures the properties of targets from the nature of returned signal. In the case of a Doppler wind lidar mounted on of low orbit meteorological satellite, the targets are atmospheric molecules, cloud droplets and aerosols. The measured Doppler shift is directly related to the wind speed along the line of sight of the lidar beam. If two or more lidar beams are used, pointing in different directions, both wind speed and direction can be obtained. Launch of the first demonstration satellite by the European Space Agency ESA occured in 2018 and provides global coverage of wind at various levels of the atmosphere.