2012 - a wet year
In 2012 the weather regularly made the news headlines and if you asked somebody to describe 2012 in a single word they would probably say 'wet'.
The statistics
For the UK as a whole 2012 was the second wettest year on record (with only 2000 being wetter). The UK rainfall record dates back to 1910. Four out of the top five wettest years have occurred since 2000 as the table below shows.
The top five wettest years in the UK
- 2000 - 1337.3 mm
- 2012 - 1330.7 mm
- 1954 - 1309.1 mm
- 2008 - 1295.0 mm
- 2002 - 1283.7 mm
The 1981-2010 rainfall average for the UK is 1154.0 mm.
If we look at the countries comprising the UK there was considerable variation. 2012 was the wettest ever year for England, the third wettest for Wales, 17th wettest for Scotland and only the 40th wettest for Northern Ireland. What makes 2012 all the more interesting is that the start of the year was drier than normal.
Image one on shows how the rainfall for each month of 2012 compares with the long term average. For example in March the UK had only 39% of the long-term average rainfall. January, February, March and May were drier months and many parts of the UK had hosepipe bans in force.
The summer brought a change to wetter than average weather. June stands out with 203% of the average rainfall for the UK and as much as 256% of the average rainfall for Wales.
The causes
The rainfall events of 2012 have led to a lot of questions being asked. Is the UK getting wetter? Are our weather patterns changing? Is climate change to blame? Evidence would also suggest that we are getting more rain in total and also it may be falling in more intense bursts. Weather is the day to day changing of the atmosphere and history has shown variations within our weather patterns do occur. Most people would probably perceive a 'normal' year as having a cold winter with some periods of frost and snow and a summer which brings some periods of settled weather. 2012 was by no means a 'normal' year. The jet stream (a band of winds high up in the atmosphere) tended to lie to the south of the UK through much of 2012 and as result low pressure systems bringing rain and strong winds were tracked across the UK from the Atlantic.
Image two above shows a typical weather chart for the year with active weather fronts affecting the UK. This chart is for 06.00 on 7 July. Can 2012 be put down to global warming?
The global temperature has risen by about 0.7 °C since pre-industrial times and a warmer atmosphere is able to hold more moisture. Image three shows the UK mean annual rainfall from 1910 to present. There are annual fluctuations within a general rising trend. Despite this trend we cannot draw any conclusions, as more research is necessary.
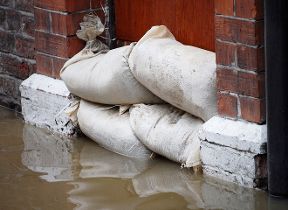
2012 brought numerous flooding events and the Environment Agency estimates that 1,000 flood warnings were issued in November and December. The significance of 2012 as a wet year is highlighted when we consider the dry start with widespread hosepipe bans and many areas experiencing drought conditions.