
What is climate change?
Climate change refers to a large-scale, long-term shift in the planet's weather patterns and average temperatures.
Climate change is the long-term shift in average weather patterns across the world. Since the mid-1800s, humans have contributed to the release of carbon dioxide and other greenhouse gases into the air. This causes global temperatures to rise, resulting in long-term changes to the climate.
Climate change evidence
How are humans changing the climate?
In the 11,000 years before the Industrial Revolution, the average temperature across the world was stable at around 14°C. The Industrial Revolution began in the mid-1800s when humans began to burn fossil fuels such as coal, oil, and gas for fuel.
Burning fossil fuels produces energy, but also releases greenhouse gases such as carbon dioxide, methane, and nitrous monoxide into the air. Over time, large quantities of these gases have built up in the atmosphere.
For example, the level of carbon dioxide in the atmosphere rose by 40% during the 20th and 21st century and is now over 400ppm (parts per million). In 2019, the level of carbon dioxide in the atmosphere was higher than at any time in at least 2 million years.
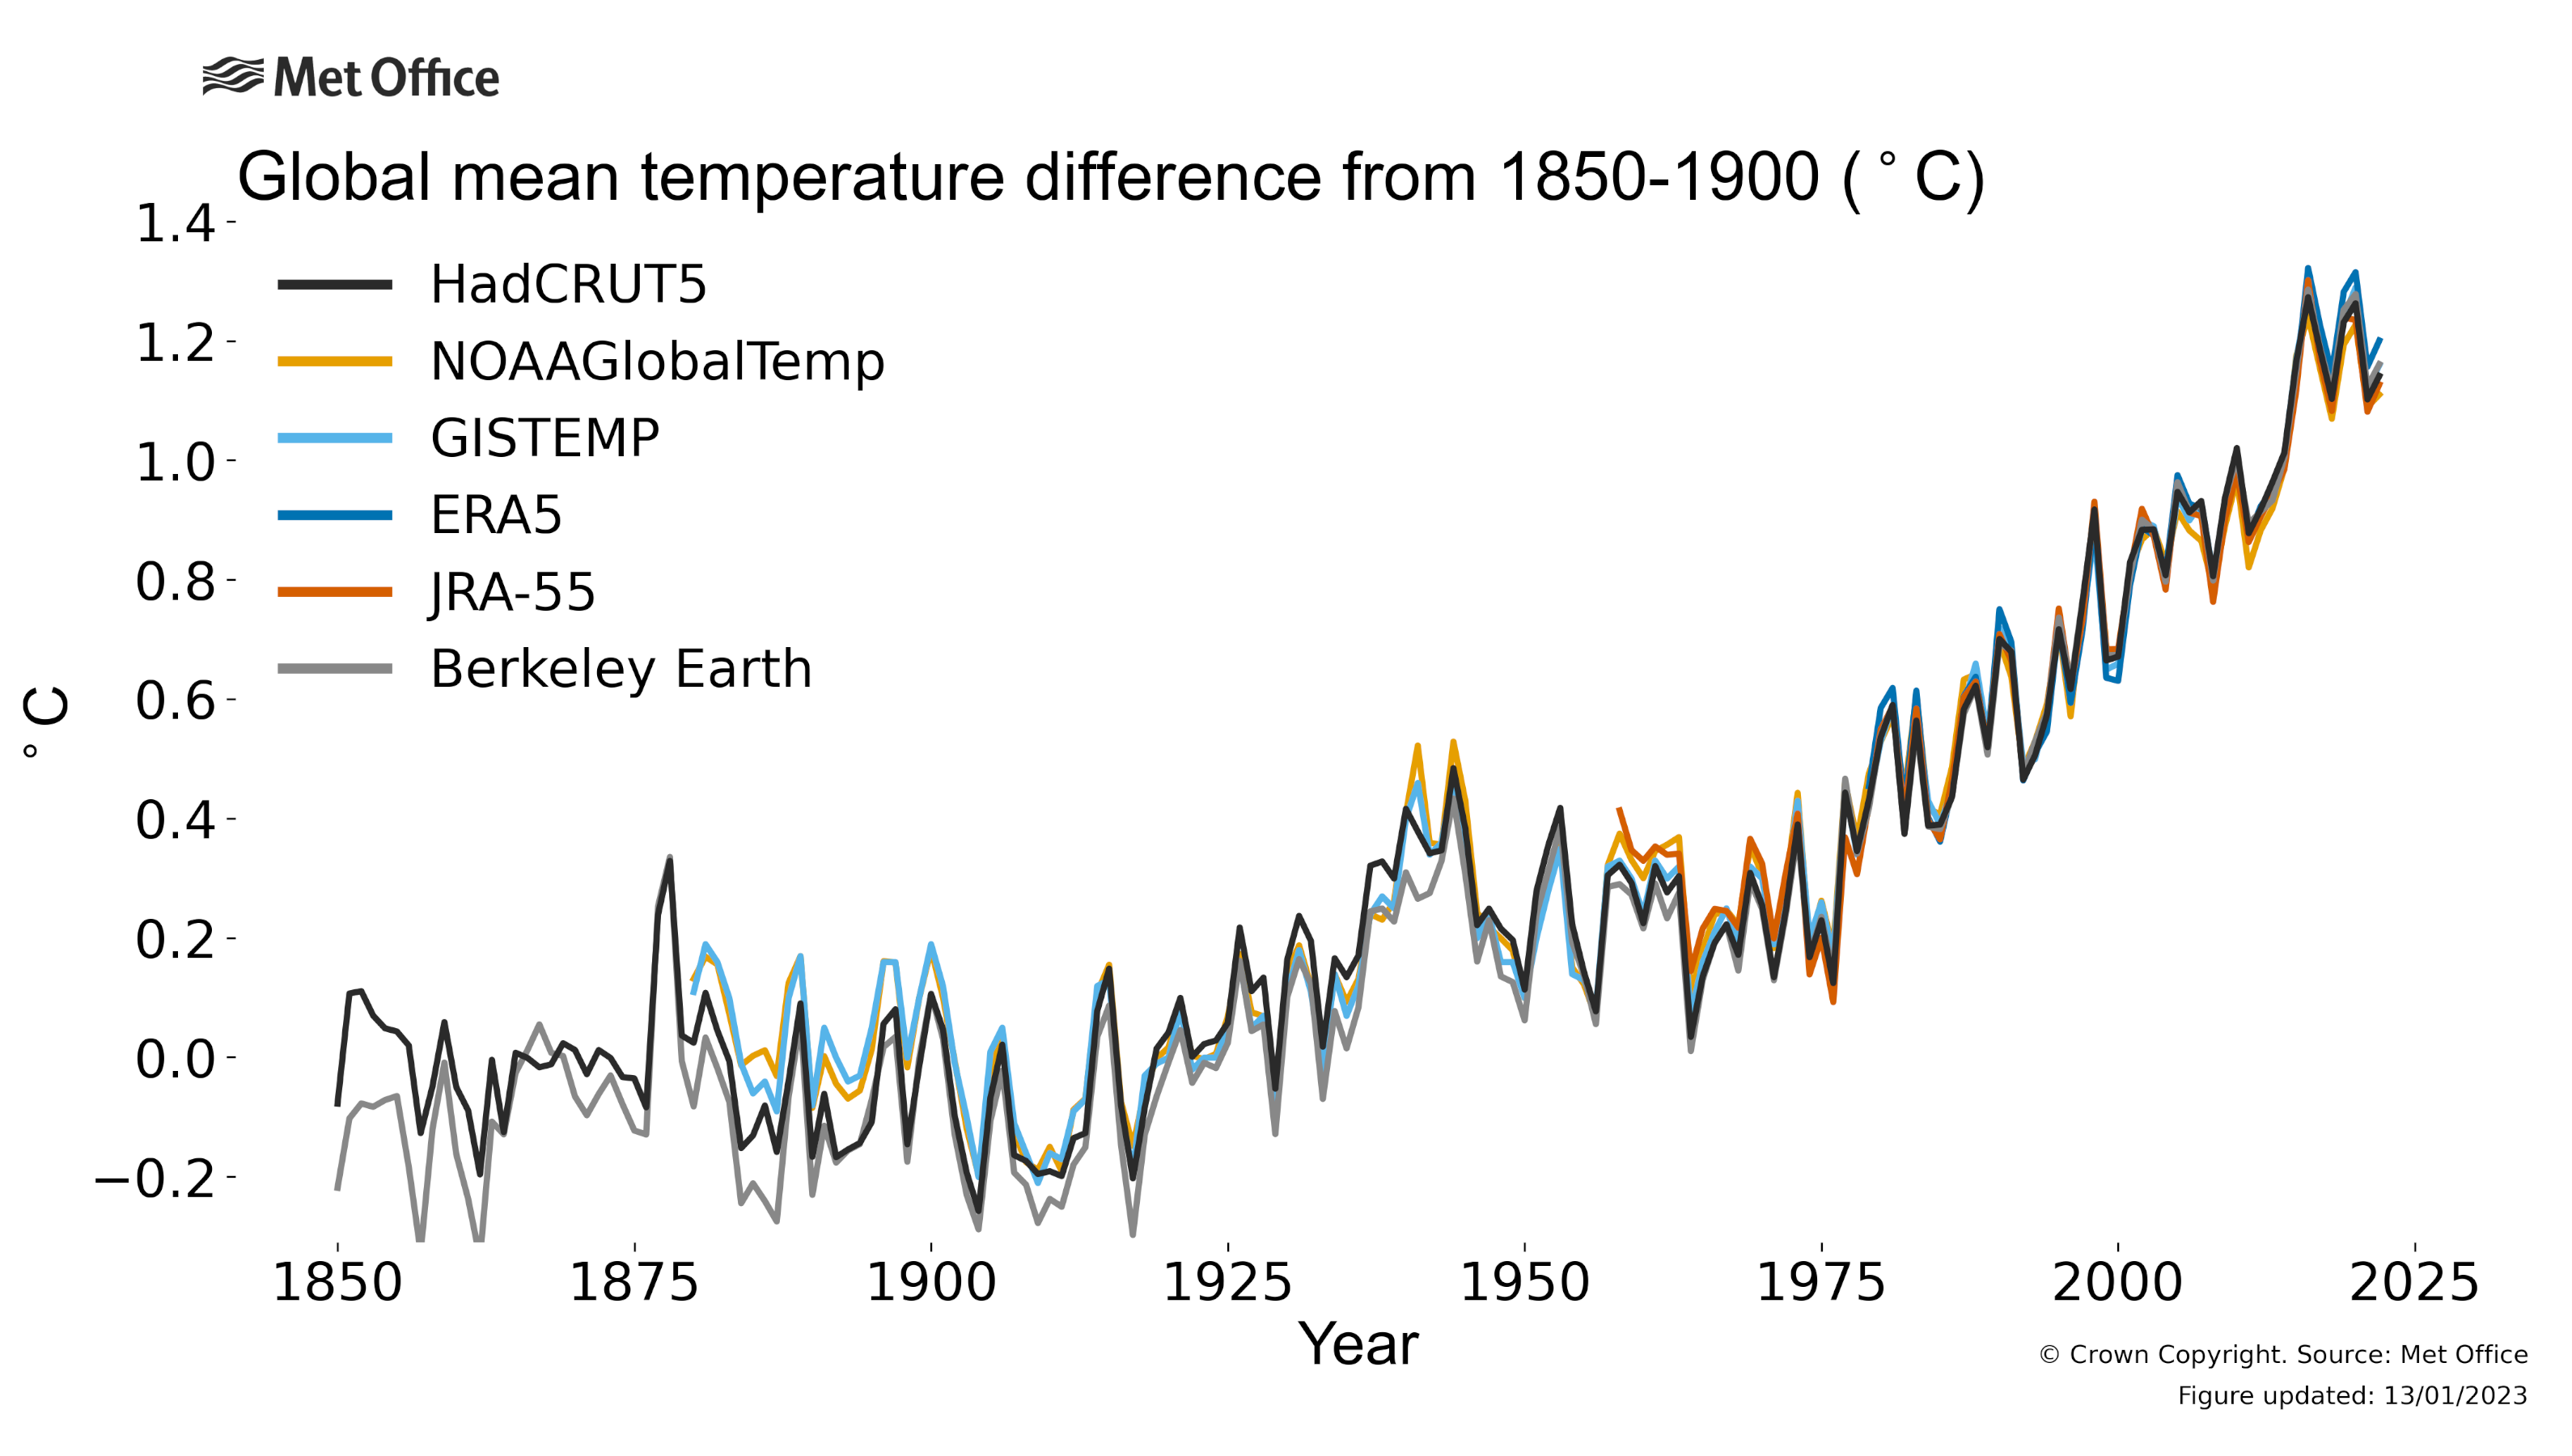
This plot shows the global temperature change from 1850 to 2022, compared to an estimated 1850-1900 baseline average temperature.
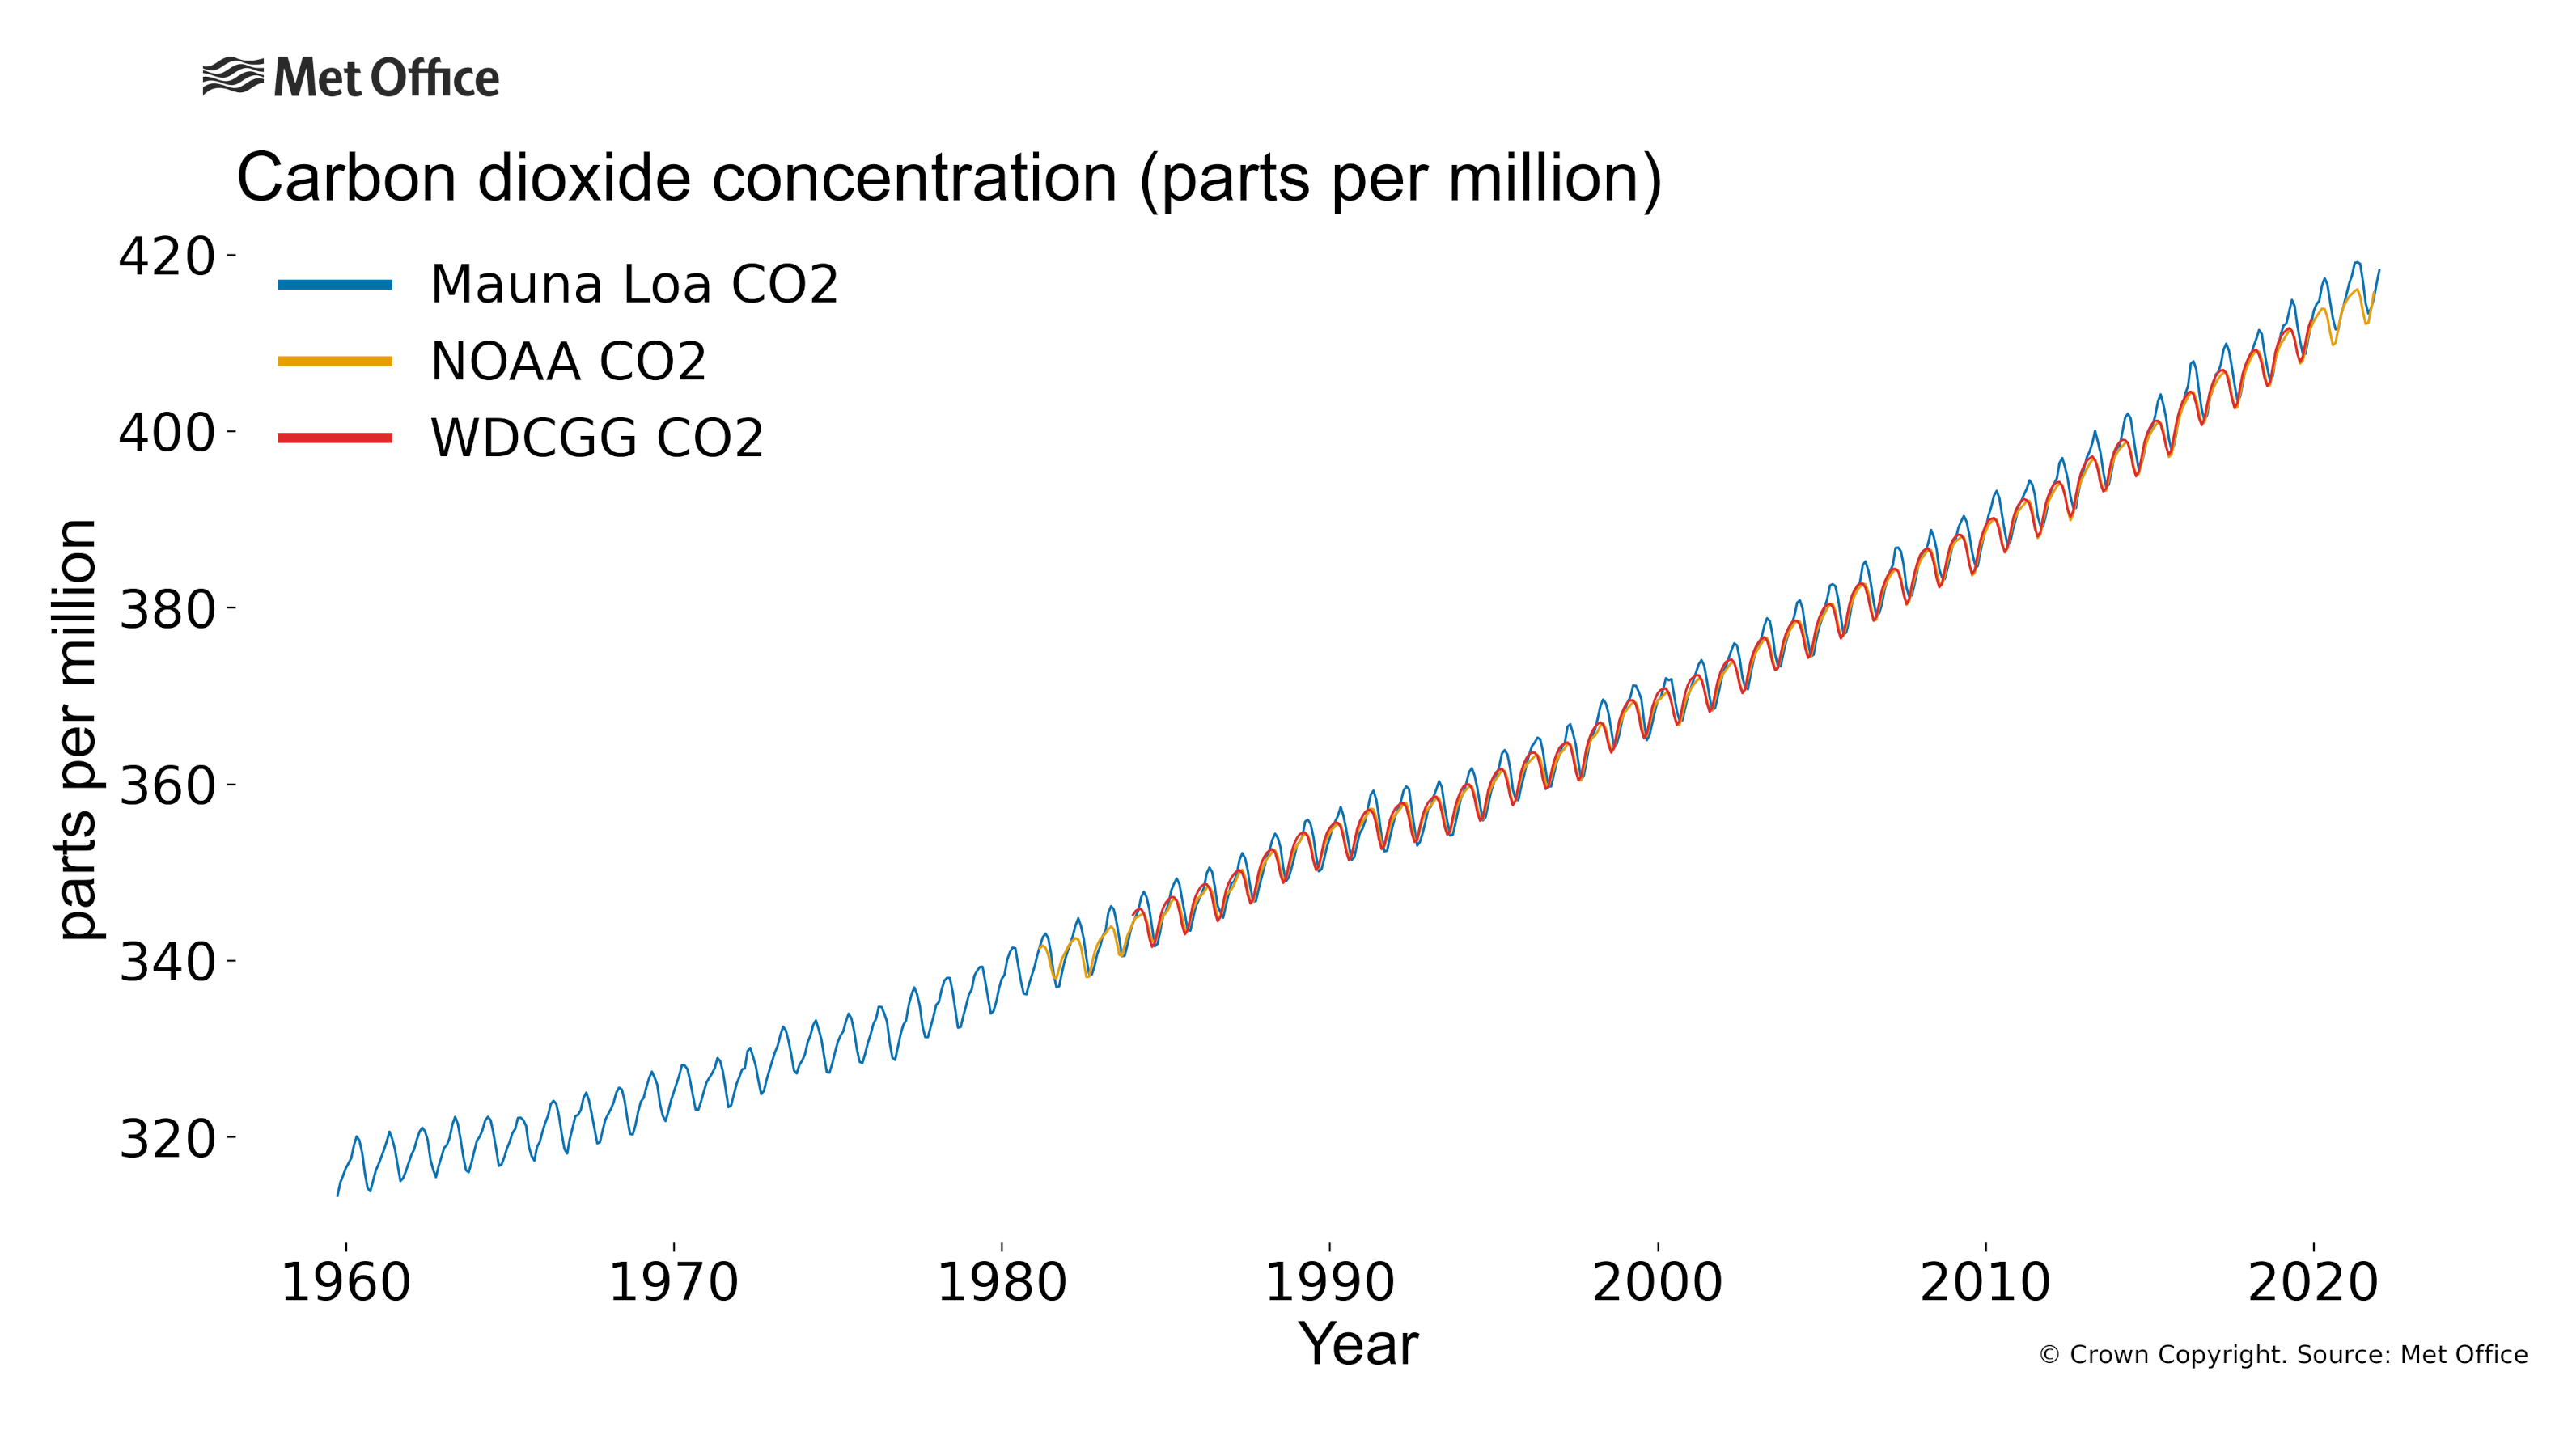
This graph shows the rising level of carbon dioxide in our atmosphere since 1960.
Once in the atmosphere, greenhouse gases such as carbon dioxide form a 'blanket' around the planet. This blanket traps the heat from the sun and causes the earth to heat up.
This effect was noticed as far back as the 1980s. In 1988, the Intergovernmental Panel on Climate Change (IPCC) was set up to provide governments with information to tackle climate change.
Evidence has shown that the high levels of greenhouse gases in the atmosphere are the leading cause of increasing global temperatures.
Scientists have been able to rule out natural events as causes of climate change, such as volcanic activity, changes in solar activity, or natural sources of CO2. These may, however, have a very small effect, on top of human contributions.
In their most recent report, the IPCC states that human activity is unequivocally the cause of climate change.
Climate change is not just seen in temperature and carbon dioxide increases. We see it in many other indicators of climate change, which you can explore further on our global climate dashboard.
How fast is the temperature rising?
Since the Industrial Revolution, the average temperature of the planet has risen by around 1°C. This is a rapid change in terms of our global climate system. Previously, natural global changes are understood to have happened over much longer periods of time. It is also important to remember that the world is not warming evenly, so the temperature increase is higher than 1°C in some countries.
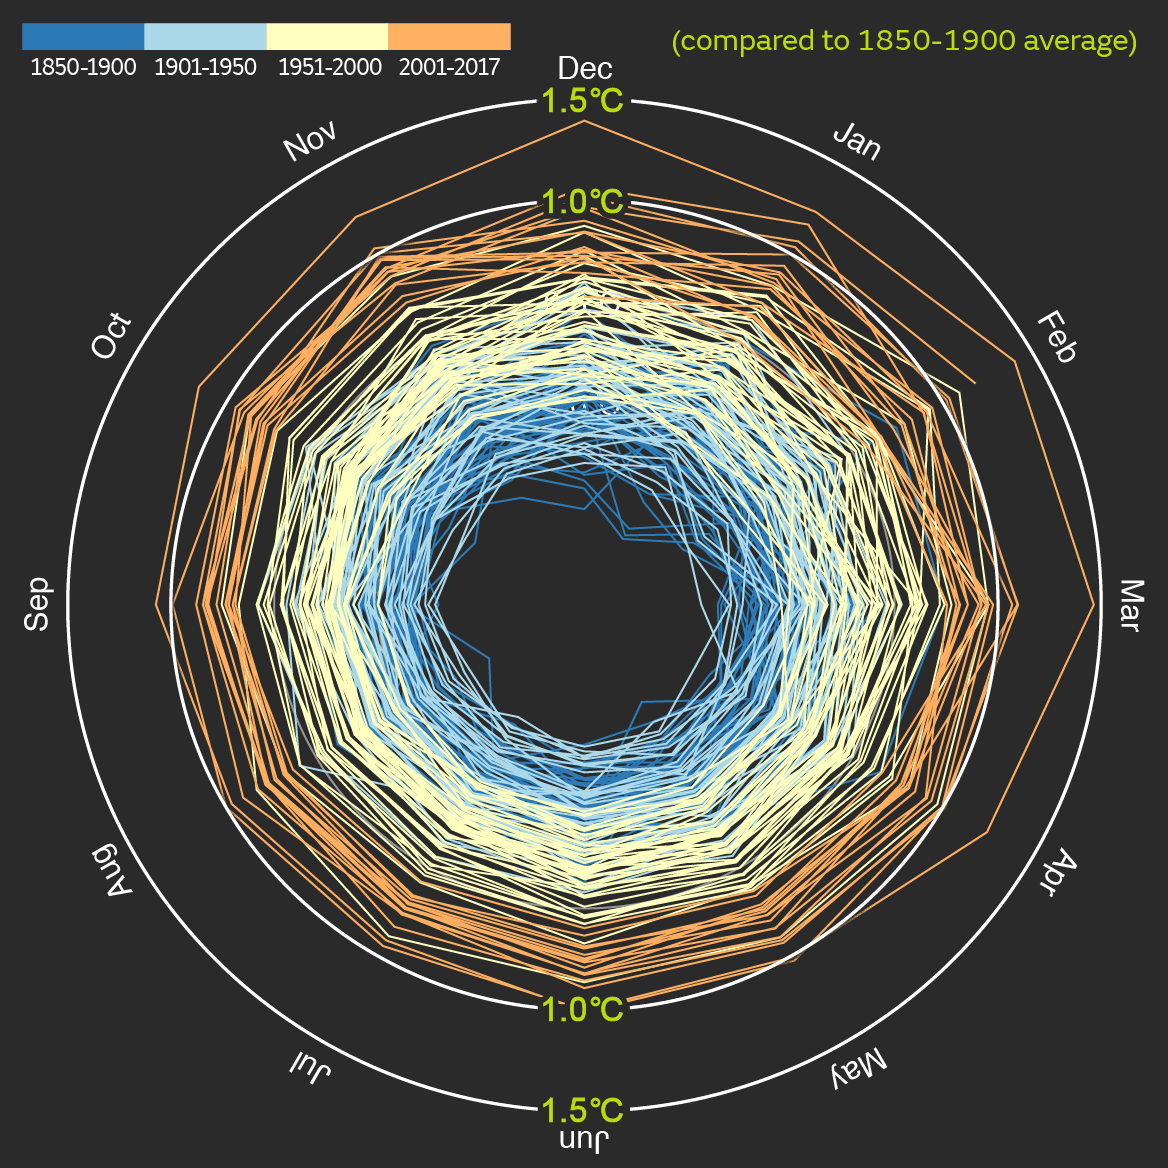
This graph shows the average global temperature for each month, from 1850 to 2017. The temperature increases as you move away from the centre of the circle.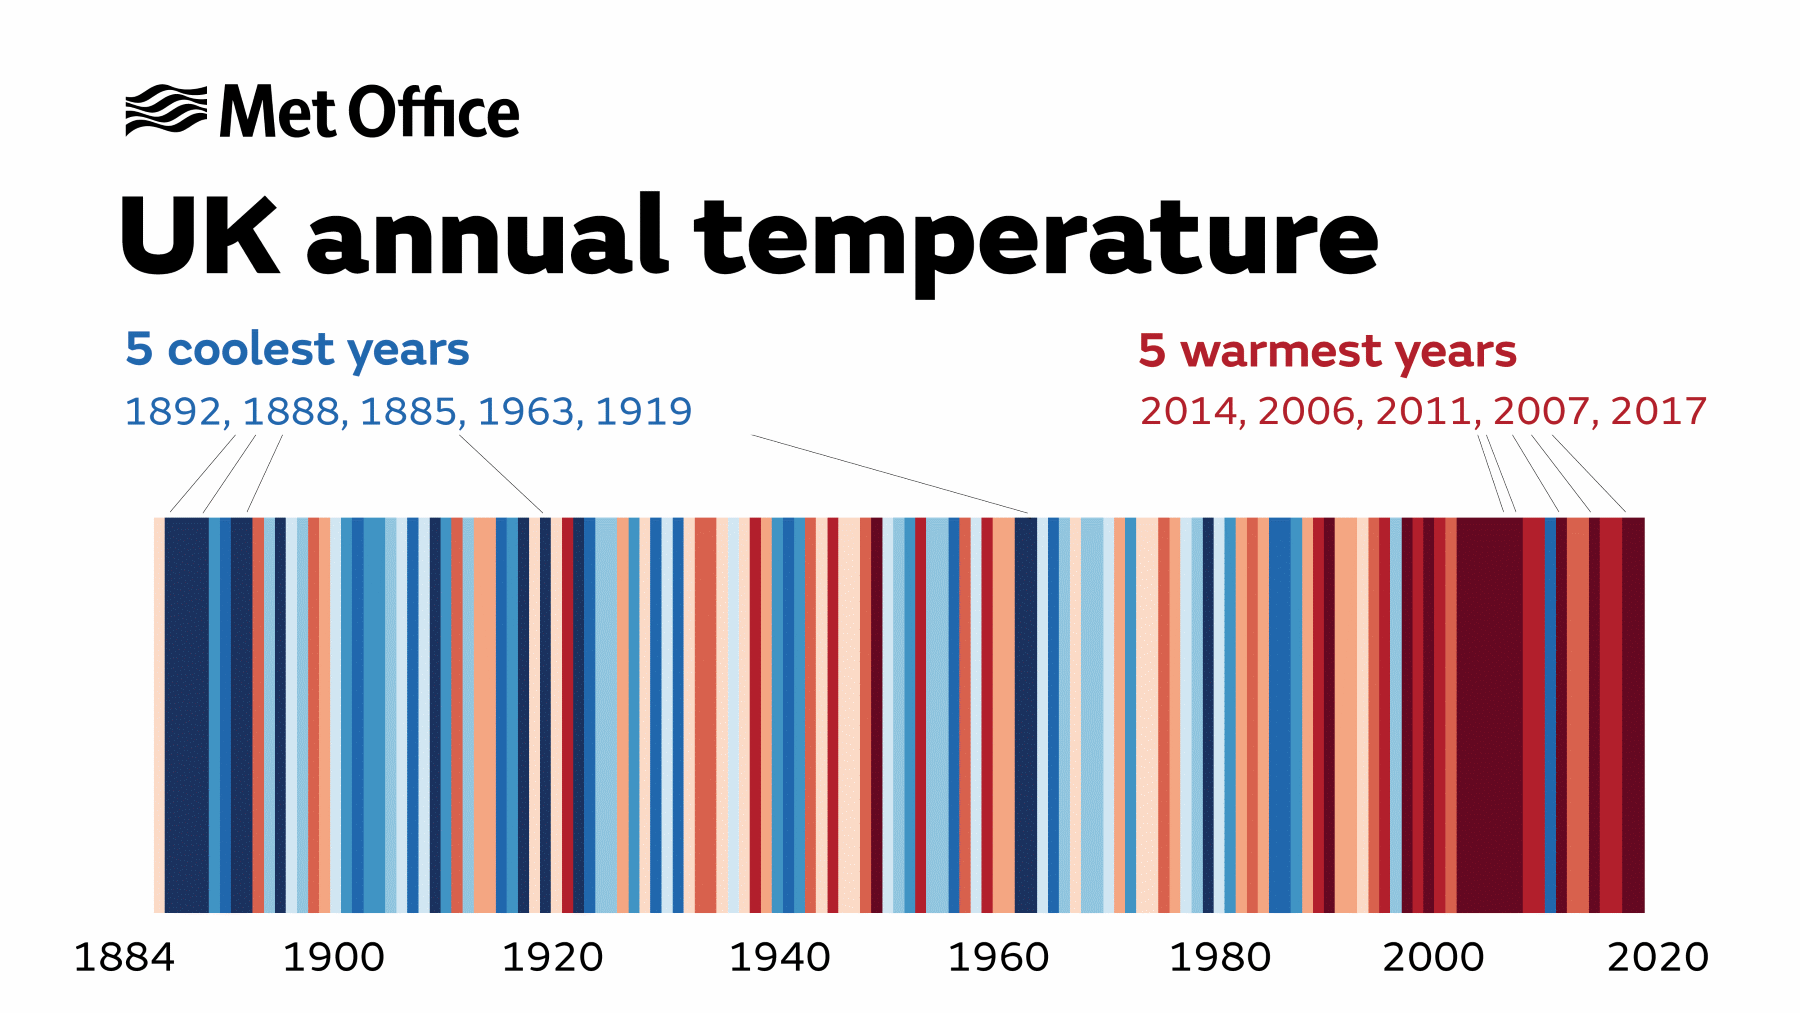
This image shows that the five warmest years have all occurred since 2006. Cooler years are blue, while warmer years are red.
This graph shows us that global temperatures are increasing. As of 2018, the 20 warmest years on record globally have been in the past 22 years. The Met Office’s State of the UK Climate report for 2021 shows the ten hottest years in the UK since 1884 have all happened since 2002.
What causes climate change?
What is the greenhouse effect?
When greenhouse gases such as carbon dioxide build in the atmosphere, they act like a blanket around the earth. When sunlight (mostly short-wave radiation) hits this blanket, it passes straight through and continues until it reaches the surface of the planet.
The earth then absorbs this sunlight and emits a different type of light, longer-wave infrared radiation, back out to space. As it leaves the atmosphere, the infrared radiation also hits the greenhouse gas blanket. Most of it goes straight through, but some of it is absorbed and goes back down to earth. This traps the infrared radiation and causes the surface to heat – a process we call the 'greenhouse effect'.
It is crucial to understand that the greenhouse effect is critical to life on earth. Without a blanket of greenhouse gases trapping in heat, the temperature would be bitterly cold, and humans would be unable to survive. However, by adding extra greenhouse gases into the atmosphere, humans have created an enhanced greenhouse effect.
The greenhouse gas blanket is now thicker and is absorbing more infrared radiation than before. In other words, the greenhouse effect is stronger and, instead of keeping the earth at a stable temperature, it is causing the planet to heat up.
What are the sources of greenhouse gases?
One-quarter of human-made greenhouse gas emissions come from burning fossil fuels for electricity and heat production.
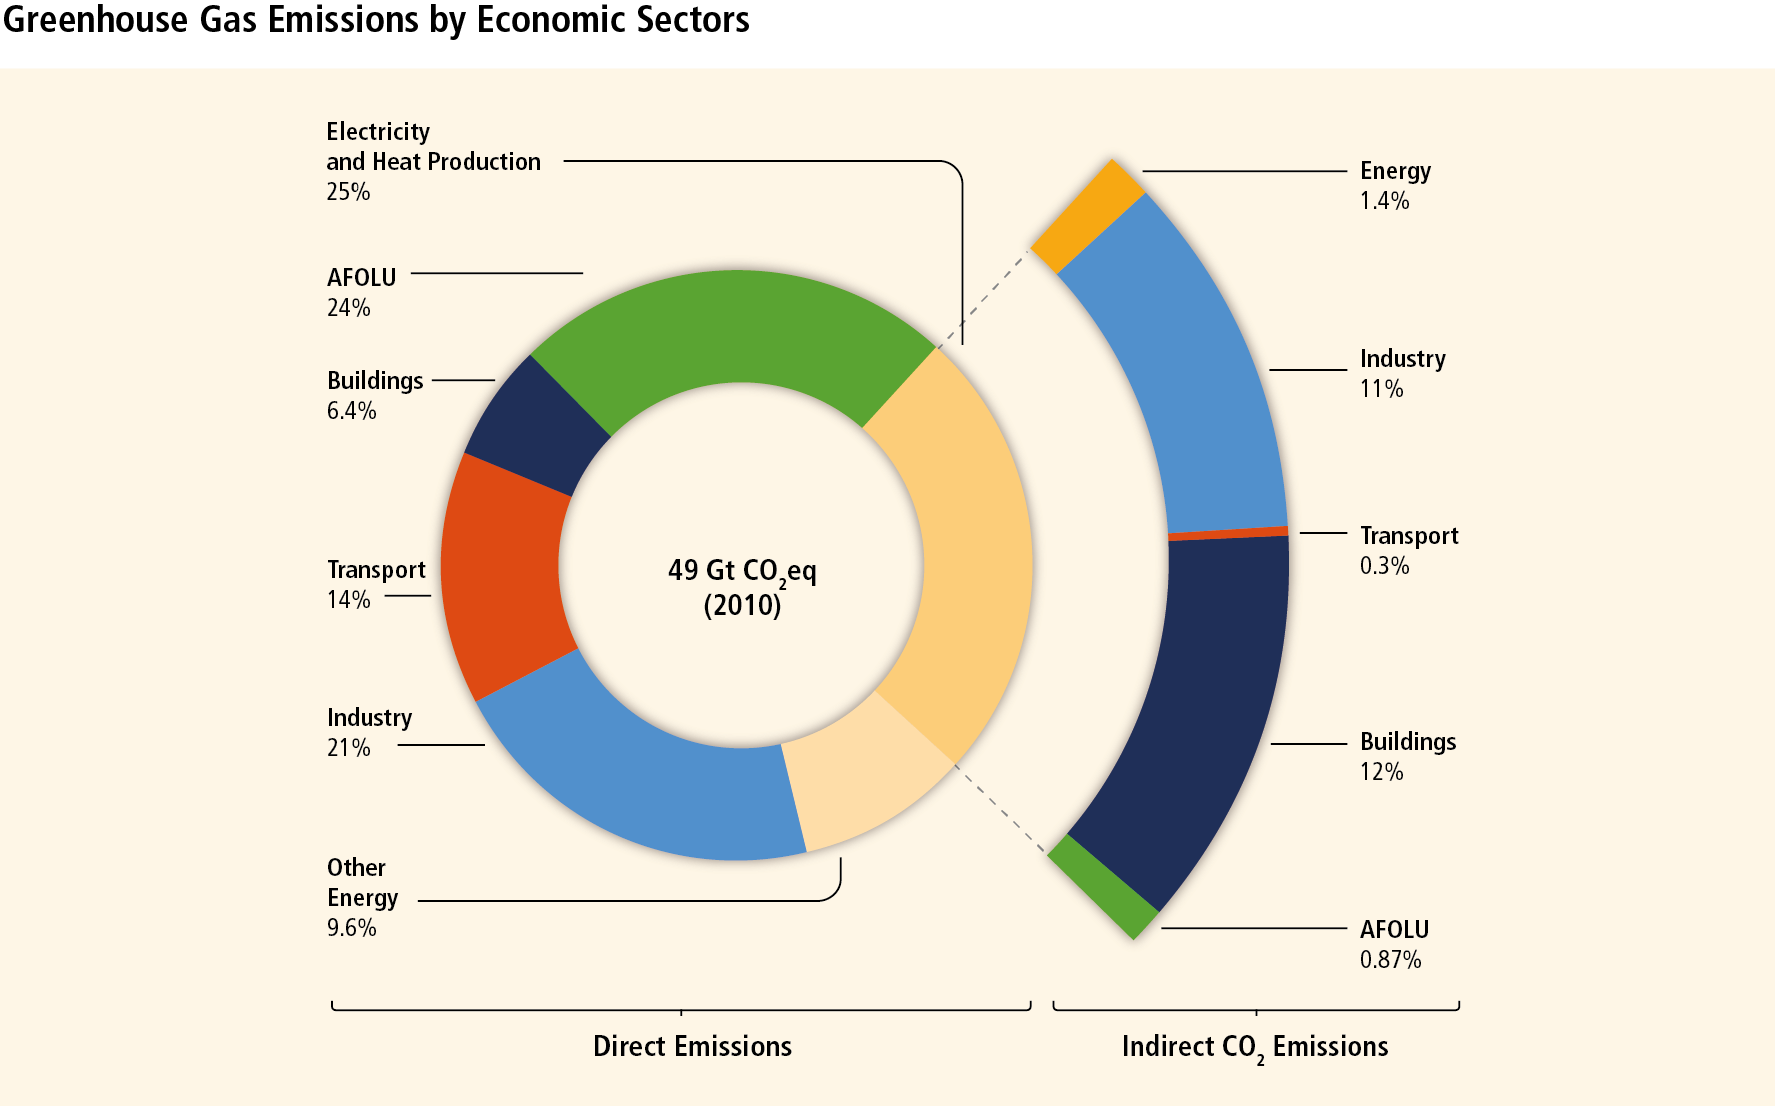
This chart shows the human-made greenhouse gas emissions, taken from the IPCC AR5 report. AFOLU stands for Agriculture, Forestry, and Other Land Use.
Another quarter of human-made greenhouse gas emissions come from Agriculture, Forestry, and Other Land Use (AFOLU).
To feed our livestock and ourselves, people have chopped down large areas of the forest and used the land to grow crops. Forests are very good at removing carbon dioxide from the atmosphere, and so cutting down trees allows carbon dioxide to build up in the atmosphere even more.
Land can also be used to rear livestock, such as cattle for meat and milk. These animals produce additional gases, like methane. They also eat crops that might otherwise have been needed by humans, meaning that even more land is required.
As well as fossil fuels, deforestation and land use, aeroplanes and the production of cement also contribute to emissions of carbon dioxide.
How much warming could we see?
Greenhouse gases can live in our atmosphere for tens or hundreds of years. The gases that are already in our atmosphere are effectively locked in and will contribute to increasing temperatures.
Even if we stop all emissions today, we cannot avoid some level of warming. The amount of warming we will see, beyond what we have already caused, depends on the changes we make.
How will climate change affect the UK?
Our UK Climate Projections (UKCP) help us see how climate change might affect the UK in the future.
In a high emission scenario (RCP 8.5), we expect that the UK will experience:
- Warmer and wetter winters
- Hotter and drier summers
- More frequent and intense weather extremes
In 50 years’ time, by 2070 we project:
- Winters will be between 1 and 4.5°C warmer and up to 30% wetter
- Summers will be between 1 and 6°C warmer and up to 60% drier
These changes could have a big impact on how we live our lives.
Explore climate change in your local area
You can find out more about climate change in your local area in this climate change visualisation tool.
This tool is a collaboration with the BBC. It uses our climate projections and records to visualise climate change in the UK.
The Paris Agreement and global temperature goals
In 2015, almost every country in the world signed a document promising to cut down on greenhouse gas emissions. The aim was to limit the average global temperature to 2°C above pre-industrial temperatures. If possible, countries pledged to aim for a 1.5°C limit.
Since then, the IPCC has published a report explaining the different impacts between a 1.5 or 2°C temperature rise. It showed that there are many benefits for people all over the world in limiting temperatures to 1.5°C. Large and rapid reductions in global greenhouse gas emissions are needed to meet this goal, however.
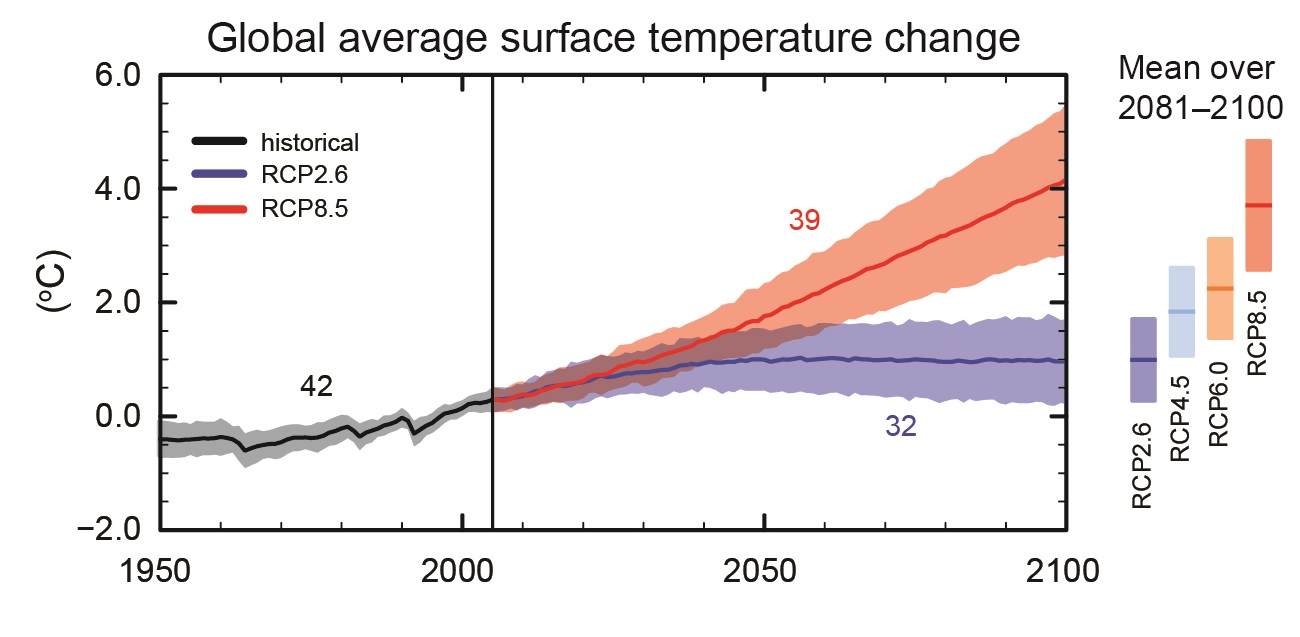
This chart from the IPCC shows two possible futures for our climate. The blue line represents what could happen if we commit to cutting emissions, and the red line represents what could happen if we don't make any changes.
If we want to avoid significant increases in the average surface temperature, we must cut greenhouse gas emissions and switch to renewable energy sources. We must also use land more sustainably and may need to use techniques to remove carbon dioxide from the air.
If we continue to burn fossil fuels and cut down forests at the same rate, the planet could warm by more than 4°C by 2100. This warming could fundamentally change life on earth, with potentially drastic consequences.
What is the difference between 1.5 or 2°C of warming?
Impacts of climate change
Human activity – from releasing greenhouse gases and aerosols into the atmosphere, to changing the use of land – is the main driver of climate change. This has a range of impacts on the climate system, ecosystems, and people.
Changes to the climate system include:
- Rising ocean levels – Rising temperatures are causing glaciers and ice sheets to melt, adding more water to the oceans and causing the ocean level to rise. Oceans absorb 90% of the extra heat from global warming: warmer water expands, and so our oceans are taking up more space.
- Ocean acidification – Ocean acidification occurs when the ocean absorbs carbon dioxide and becomes more acidic. It is often called the 'evil twin' of climate change.
- Extreme weather events – Climate change is causing many extreme weather events to become more intense and frequent, such as heatwaves, droughts, and floods.

This graph, from Munich RE's Topics Geo Natural Catastrophes report, shows events causing loss are becoming more frequent.
Climate change can also affect people and ecosystems. For example:
- Flooding of coastal regions – Coastal cities are at risk from flooding as sea levels continue to rise.
- Food insecurity – High temperatures, extreme weather events, flooding, and droughts can damage farmland. This makes it difficult for farmers to grow crops and means that their yield of crops each year is uncertain.
- Conflict and climate migrants – Climate change is a stress multiplier – it can take existing problems, such as lack of food or shelter, and make them worse. This can cause people to fight over resources (food, water, and shelter), or to migrate.
- Damage to marine ecosystems – Rising ocean temperatures, ocean acidification, and ocean anoxia (lack of oxygen) are damaging to marine life such as fish and coral reefs.
How can we stop climate change?
Reduce global greenhouse gas emissions
The most crucial step to limit climate change is to make big and rapid reductions in global greenhouse gas emissions. There are many different ways this can be done and governments, businesses, organisations and individuals around the world can all contribute. In June 2019, the UK became the world’s first major economy to pass a law committing the country to a target of ‘net zero’ emissions by 2050.
You can read more about what they are doing to achieve this, as well as what businesses and individuals can do to help, on the Green GB website.
Stay up to date with the latest climate news
Our climate newsletter shares research and news to give you the latest updates on climate science. We publish the newsletter twice a month and it's easy to sign up.
Find out more and sign up to the climate newsletter.
The Met Office is not responsible for the content of external sites.