
Past and future sea level rise
Find out more about sea level rise, what causes it and what we do and don’t know about future sea level rise
What causes sea level rise?
-
There are three main causes of global mean sea level rise: (1) expansion of the ocean as it warms; (2) addition of water from loss of land-based ice (including glaciers and ice sheets); and (3) changes in land water storage.
-
At a specific location, sea level rise may differ from the global mean substantially due to additional processes. These include local ocean changes, changes in Earth’s gravity field from land-based ice or water storage changes and vertical land motion. For example, sea level rise due to melting of the Greenland ice sheet will have little effect on the UK, due to the spatial pattern associated with the changes in Earth’s gravity field.
Past sea level rise
As greenhouse gases have been emitted and the Earth has warmed (see previous deep dive into the Earth’s Energy Budget), the ocean has expanded and land ice has melted. This has led to an increase in global mean sea level rise of about 20 cm between 1901 and 2018. This amount of sea level rise is unprecedented in the last 3000 years, i.e. no century has seen as much sea level rise in the last 3000 years. It is also clear that sea level rise is accelerating: the rate of sea level rise was ~1.3 mm/year over the period 1901-1971, this increased to ~1.9 mm/year over the period 1971-2006 and to ~3.7 mm/year over the period 2006-2018. The contribution to sea level rise from ice sheets has increased by almost a factor of four from the 1990s to 2010s. It is important to closely monitor both global mean sea level rise and the individual contributions using tools such as the sea level dashboard.
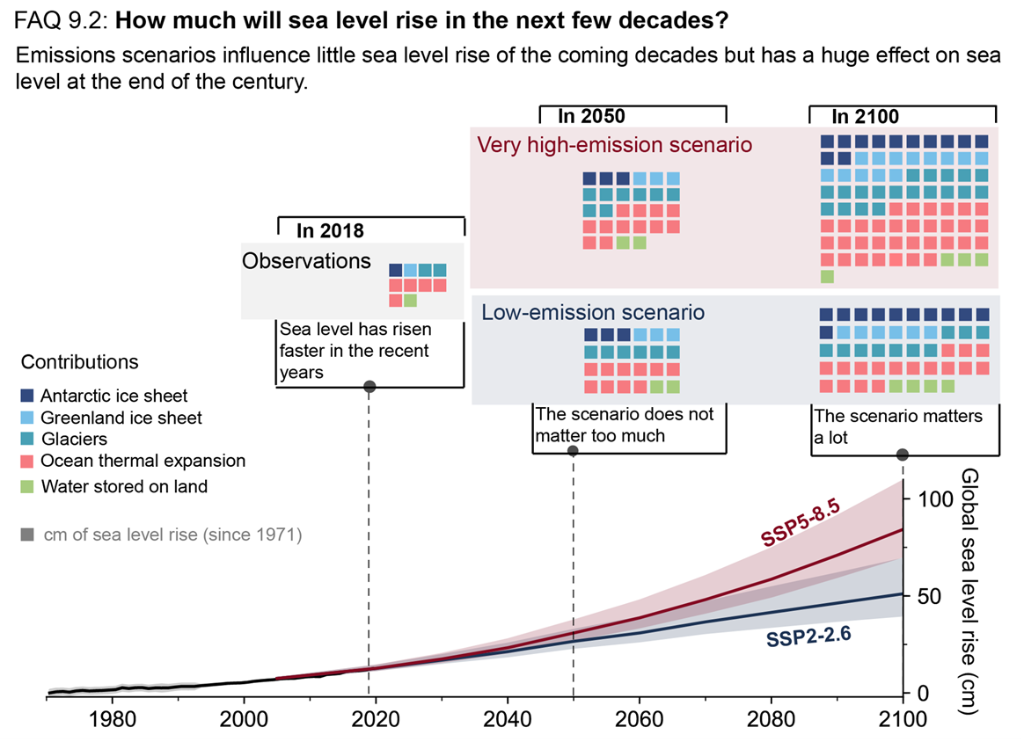
Figure 1 : Illustration of contributions to past and future sea level change. From IPCC AR6: FAQ 9.2.
Future sea level rise
-
Projections of sea level rise are made by combining output from the latest CMIP6 climate models, and ice sheet and glacier models with simpler models called “emulators”. This approach means that, for the first time in IPCC AR6, the sea level projections are consistent with assessment of climate sensitivity and future surface temperature rise.
-
Projections are based on the Shared Socioeconomic Pathways, i.e. a set of scenarios that span a range of future socio-economic conditions. These are different from previous reports that used Representative Concentration Pathways.
-
In the IPCC’s AR6, likely range projections to 2100 (which cover two-thirds of the expected distribution) derive from processes that are reasonably well understood (see figure 2). These ranges are broadly consistent with projections made in previous IPCC reports (AR5 and SROCC) as well as climate projections for the UK (UKCP18).
-
In AR6, projections of global mean sea level are also provided for 2300 for a low emissions scenario (SSP1-2.6) and a very high emissions scenario (SSP5-8.5) (see figure 2). The range of possible sea level rise by 2300 is higher than UKCP18 because AR6 spanned a greater range of scenarios for the evolution of the ice sheets.
-
IPCC AR6 also provides low likelihood, high impact storylines for future sea level rise. This is an important innovation compared to previous reports that allows decision makers to consider possible futures that lie outside the likely range projections.
What is a low-likelihood, high impact scenario for future sea level rise?
Many of the processes that lead to sea level rise are well-understood, such as the expansion of the ocean as it warms. However, key processes that determine the future rate of ice loss from the Greenland and Antarctic ice sheets are poorly understood, which leads to deep uncertainty in future projections. This means that scientists know there is a chance that we could see larger sea level rise than seen in the likely range projections, but they cannot currently quantify the likelihood of these outcomes. The uncertainty increases at higher levels of global warming (if warming is greater than we expect this century either because climate sensitivity is high or we follow a pathway of high emissions) because we may cross thresholds which mean that the evolution of the ice sheets is irreversible.
Taking the above into account, IPCC AR6 provides a low-likelihood, high impact storyline for possible global mean sea level rise (see figure 2). Storylines such as these should be interpreted as possible futures whose probability of occurrence is low or not well known, but if they did happen they could have a significant impact on society or ecosystems. This means that they can’t be ruled out and need to be considered as part of climate risk assessment and coastal decision-making.
For projections to 2100, the low-likelihood, high impact storyline could lead to an additional metre of global mean sea level rise and is associated with loss from both the Greenland and Antarctic ice sheets. The implications for uncertainty in UK sea level projections will need further work because the impact of ice loss from Antarctica is more important for sea level rise around the UK than ice loss from Greenland.
For projections to 2300, the low likelihood, high impact scenario could lead to global mean sea level rise of up to about 15m. This storyline is based on possible widespread loss from the Antarctic ice sheet. Under this storyline, large ice loss from Antarctica would have an even larger impact on UK sea level rise. This highlights that we need to work with scientists around the world to better understand and monitor the Antarctic ice sheet.
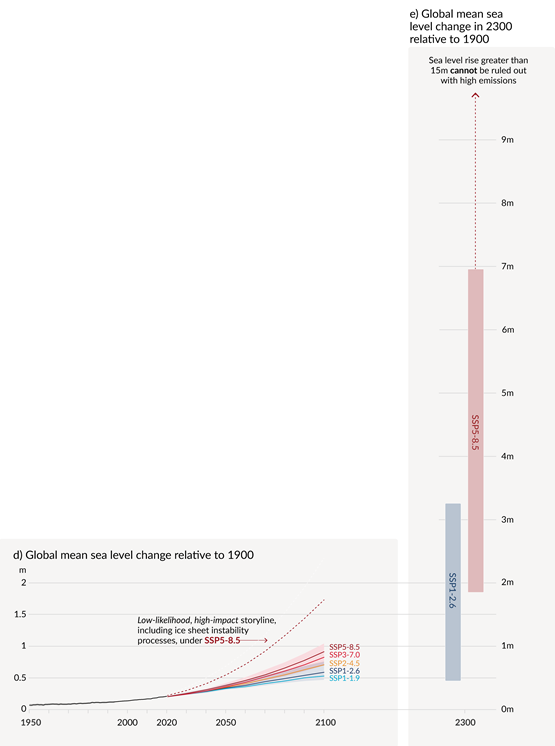
Figure 2: Projections of sea level rise in 21st Century and 2300 including low-likelihood, high impact storylines. From IPCC AR6: Figure SPM.8