Global-average temperature records
Dr Peter Stott explains how global-average temperature records work.
Global-average temperature records are vital to help understand how our climate is changing.
Dr Peter Stott, Head Climate Monitoring and Attribution at the Met Office, explains how these records are made.
What are they?
To understand changes and variations in our climate it is essential to know how the surface temperature changes - from month to month, up to decade to decade. Global-average temperature records provide this vital information.
From these records we can see how warm specific months, years or decades are, and we can discern trends in our climate over longer periods of time. Global records go back about 160 years, giving a long period from which to draw conclusions about how our climate is changing.
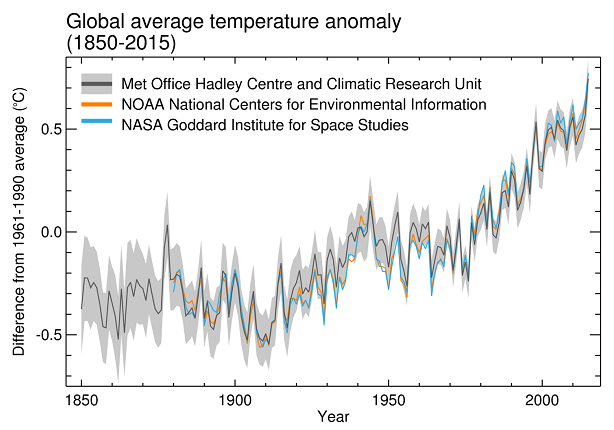
There are three centres that calculate global-average temperature each month.
-
Met Office, in collaboration with the Climatic Research Unit (CRU) at the University of East Anglia (UK)
-
Goddard Institute for Space Studies (GISS), which is part of NASA (USA)
-
National Climatic Data Center (NCDC), which is part of the National Oceanic and Atmospheric Administration (NOAA) (USA)
These work independently and use different methods in the way they collect and process data to calculate the global-average temperature. Despite this, the results of each are similar from month to month and year to year, and there is definite agreement on temperature trends from decade to decade (Figure 1). Most importantly, they all agree global-average temperature has increased over the past century and this warming has been particularly rapid since the 1970s.
How are they made?
Tens of thousands of temperature observations are taken across the globe, on land and at sea, each day. Land stations use these daily readings to create a monthly average (see boxed text), which is then sent off for use by climate researchers. Individual ship and buoy observations are transmitted on the Global Telecommunication System. These figures are checked before they are used to calculate the global-average temperature.
The monthly updates are combined with archives of historical observations that have been gathered over the past 160 years. The historical data are adjusted to minimise the effects of changes in the way measurements were made.
Each of the three global temperature centres uses different observation sets, although there are large overlaps in the information used. Each centre also has its own methods for checking and processing data, as well as for making the final calculation.
The HadCRUT4 record, which is produced by the Met Office in collaboration with the Climatic Research Unit, takes in observations from about 2,000 land stations each month. The figures for each one are checked both by computer and manually to find and remove any problems. Sea-surface temperature observations come from about 1,200 drifting buoys deployed across the world's oceans and around 4,000 ships in the Voluntary Observing Ship programme. There are also numerous moored buoys in the tropics and in coastal regions, principally around the US. Together they take around 1.5 million observations each month. These are checked by computer and any obviously inaccurate readings are excluded.
Anomalies
Absolute temperatures are not used directly to calculate the global-average temperature. They are first converted into 'anomalies', which are the difference in temperature from the 'normal' level. The normal level is calculated for each observation location by taking the long-term average for that area over a base period. For HadCRUT4, this is 1961-1990.
For example, if the 1961-1990 average September temperature for Edinburgh in Scotland is 12 °C and the recorded average temperature for that month in 2009 is 13 °C, the difference of 1 °C is the anomaly and this would be used in the calculation of the global average.
One of the main reasons for using anomalies is that they remain fairly constant over large areas. So, for example, an anomaly in Edinburgh is likely to be the same as the anomaly further north in Fort William and at the top of Ben Nevis, the UK's highest mountain. This is even though there may be large differences in absolute temperature at each of these locations.
The anomaly method also helps to avoid biases. For example, if actual temperatures were used and information from an Arctic observation station was missing for that month, it would mean the global temperature record would seem warmer. Using anomalies means missing data such as this will not bias the temperature record.
NOAA Global Surface Temperature Anomalies
Goddard Institute for Space Studies Surface Temperature Analysis (GISTEMP)
How do we know they are accurate?
Firstly, great care is taken to ensure the observations that form the basis for a global-average temperature are accurate. Each observation station follows international standards for taking observations set out by the World Meteorological Organization.
Each national met service provides information about how its data are collected and processed, thus helping to ensure consistency. This includes recording information about the local environment around the observation station and any changes to that environment. This is important as it can affect temperature measurements. For example, new buildings near an observation station can increase the night-time temperature readings.
While every effort is made to detect and remove errors in the data, scientists accept there will inevitably be some uncertainty in collecting so much information. There are additional uncertainties because temperatures over large areas of the earth are not observed as a matter of routine. Efforts are made to take these into account by factoring the uncertainty into global-average temperature calculations, which means we end up with a temperature range rather than one definite figure (Figure 1). Importantly, even with the temperature ranges, the global warming observed over the past century far outstrips the uncertainties.
The three independent global-average temperature records show that there has been warming in the Earth's climate since pre-industrial times. The warming has been particularly rapid since the 1970s. The records also clearly show each decade since the 1970s has been successively warmer than the last, including the decade since 2000. Changes in temperature observed in surface data records are corroborated by measurements of temperatures below the surface of the ocean, by records of temperatures in the troposphere recorded by satellites and weather balloons, in independent records of air temperatures measured over the oceans and by records of sea-surface temperatures measured by satellites. Indirect evidence of warming can be seen in the reductions in Arctic sea-ice, sea-level rise, reduction in glacier volume and in phenological records, for example the dates on which leaves, flowers and migratory birds appear.